
  |
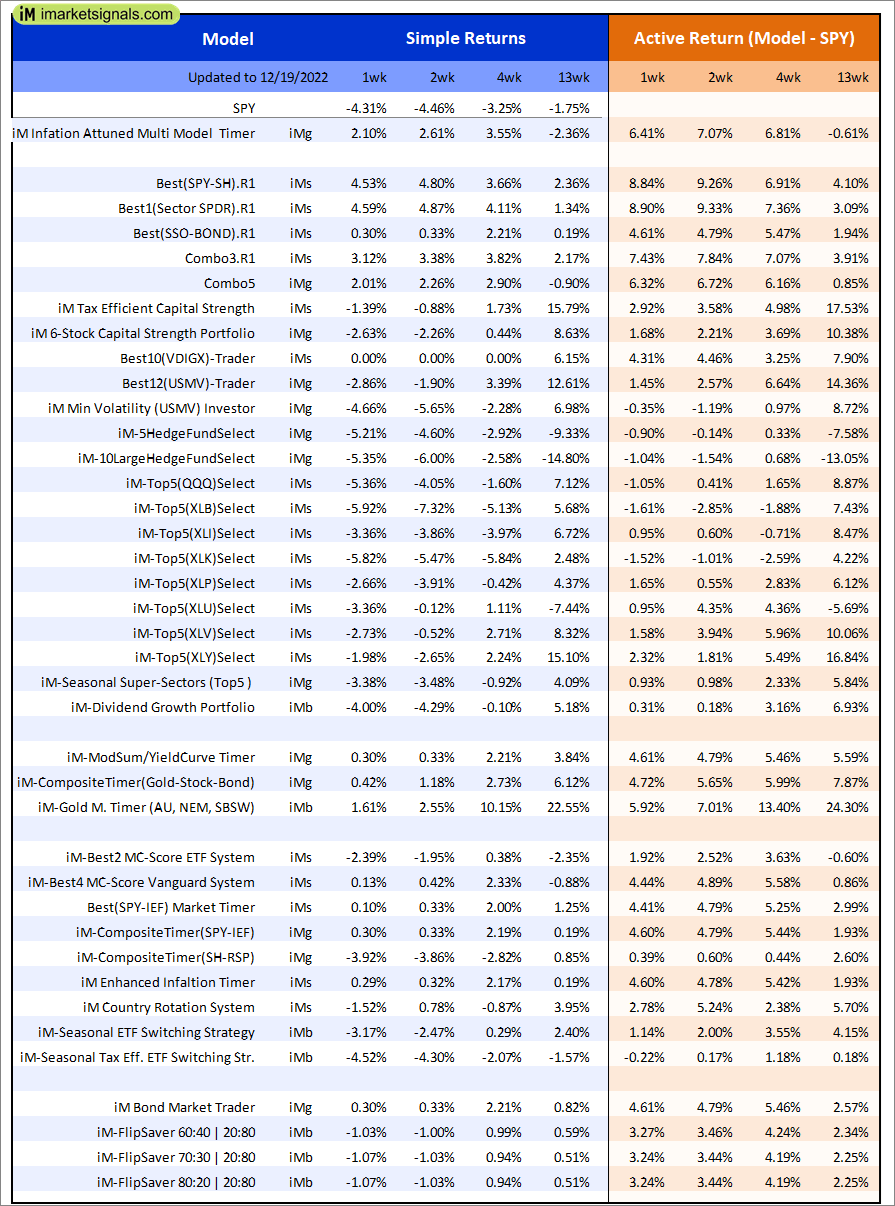
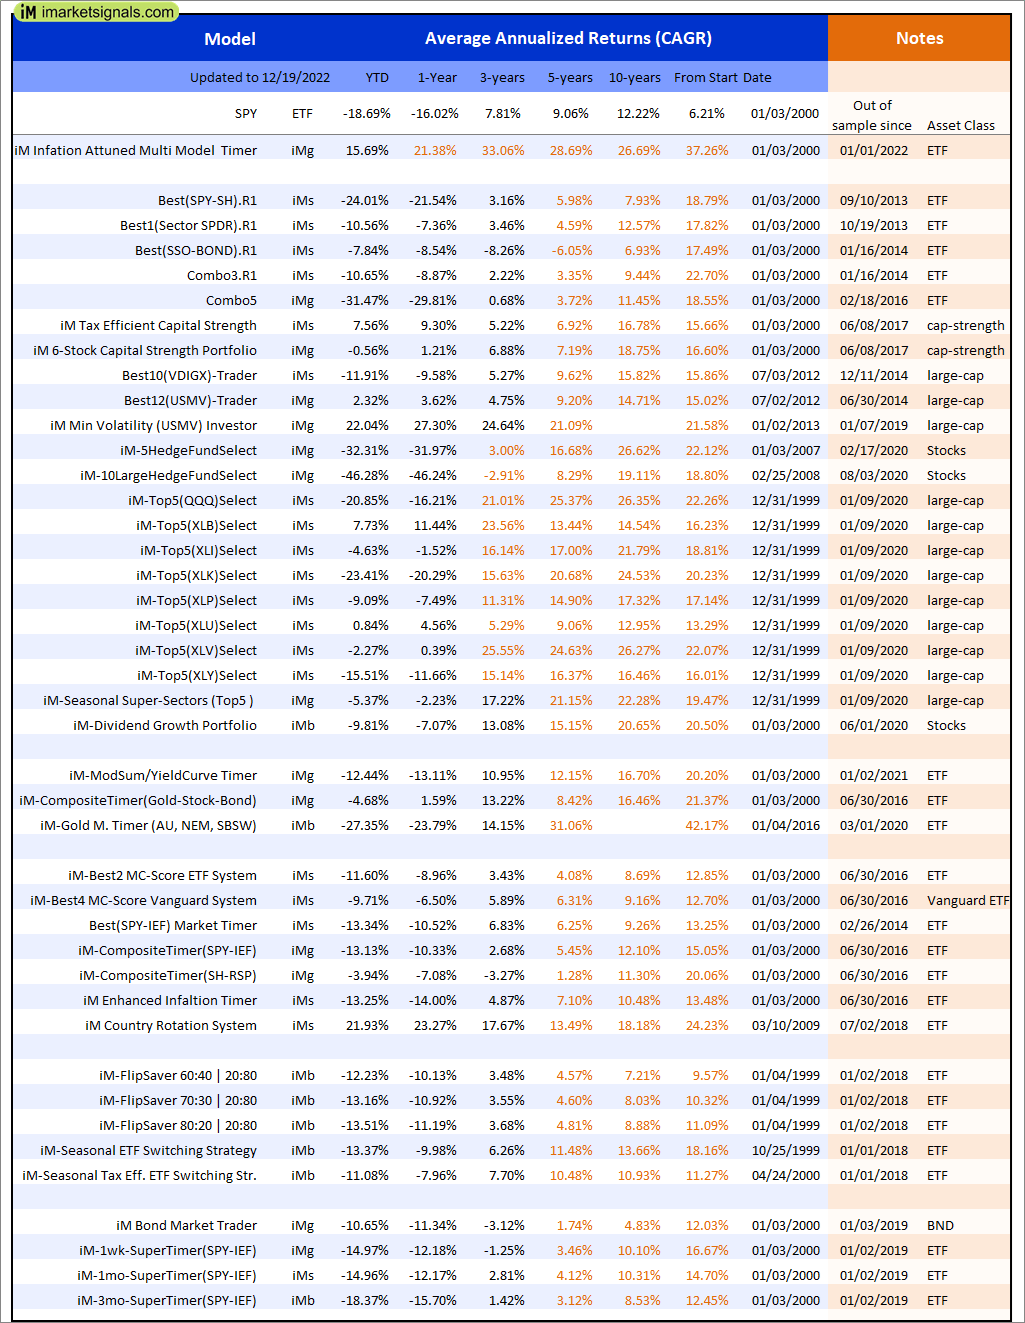
Out of sample performance summary of our models for the past 1, 2, 4 and 13 week periods. The active active return indicates how the models over- or underperformed the benchmark ETF SPY. Also the YTD, and the 1-, 3-, 5- and 10-year annualized returns are shown in the second table |
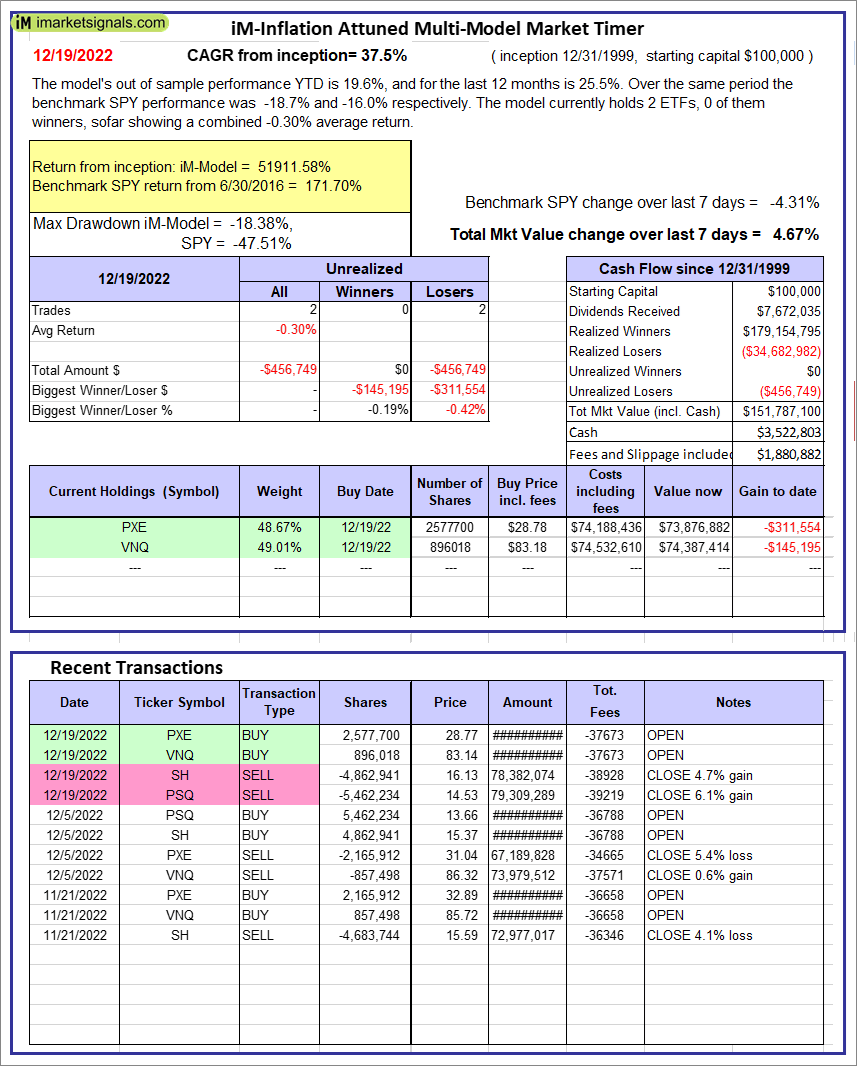 |
iM-Inflation Attuned Multi-Model Market Timer: The model’s out of sample performance YTD is 19.6%, and for the last 12 months is 25.5%. Over the same period the benchmark SPY performance was -18.7% and -16.0% respectively. Over the previous week the market value of the iM-Inflation Attuned Multi-Model Market Timer gained 4.67% at a time when SPY gained -4.31%. A starting capital of $100,000 at inception on 3/24/2017 would have grown to $151,787,100 which includes $3,522,803 cash and excludes $1,880,882 spent on fees and slippage. |
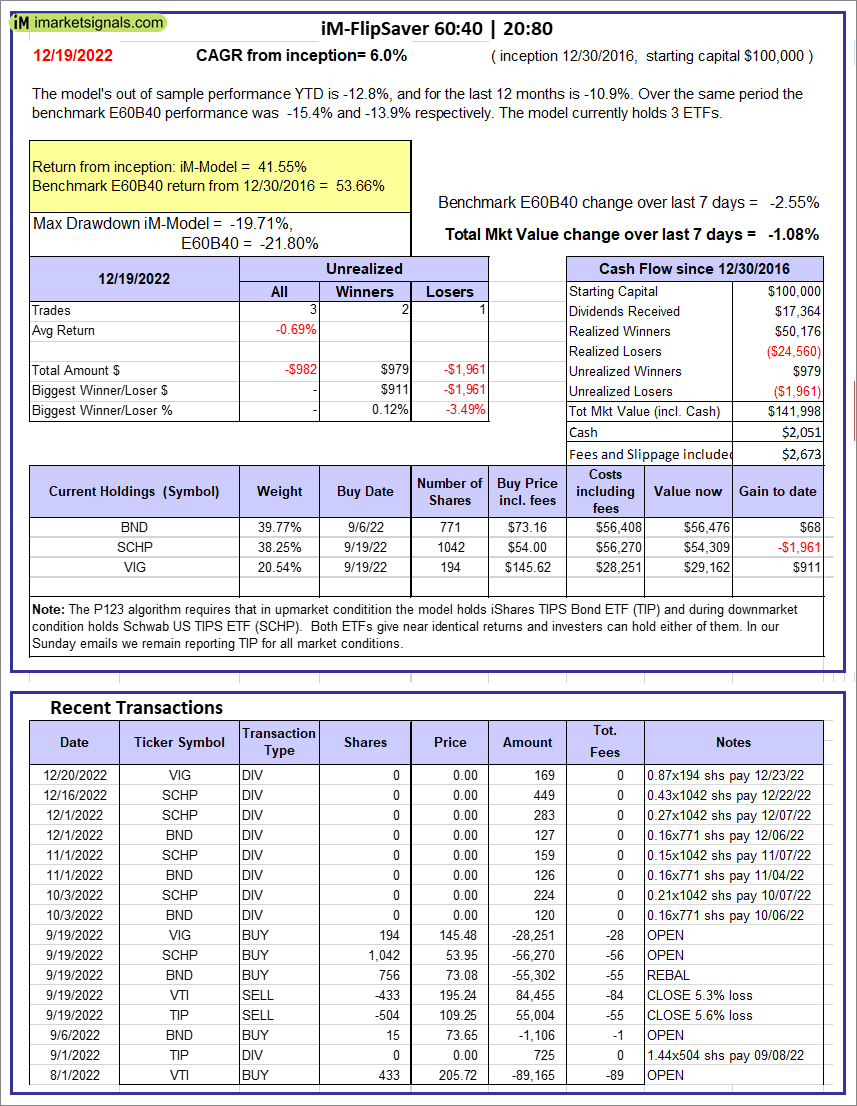 |
iM-FlipSaver 60:40 | 20:80 – 2017: The model’s out of sample performance YTD is -12.8%, and for the last 12 months is -10.9%. Over the same period the benchmark E60B40 performance was -15.4% and -13.9% respectively. Over the previous week the market value of iM-FlipSaver 80:20 | 20:80 gained -1.08% at a time when SPY gained -2.55%. A starting capital of $100,000 at inception on 7/16/2015 would have grown to $141,998 which includes $2,051 cash and excludes $2,673 spent on fees and slippage. |
 |
iM-FlipSaver 70:30 | 20:80 – 2017: The model’s out of sample performance YTD is -13.2%, and for the last 12 months is -11.1%. Over the same period the benchmark E60B40 performance was -15.4% and -13.9% respectively. Over the previous week the market value of iM-FlipSaver 70:30 | 20:80 gained -1.07% at a time when SPY gained -2.55%. A starting capital of $100,000 at inception on 7/15/2015 would have grown to $146,020 which includes $2,198 cash and excludes $2,831 spent on fees and slippage. |
 |
iM-FlipSaver 80:20 | 20:80 – 2017: The model’s out of sample performance YTD is -13.5%, and for the last 12 months is -11.3%. Over the same period the benchmark E60B40 performance was -15.4% and -13.9% respectively. Over the previous week the market value of iM-FlipSaver 80:20 | 20:80 gained -1.07% at a time when SPY gained -2.55%. A starting capital of $100,000 at inception on 1/2/2017 would have grown to $149,882 which includes $2,384 cash and excludes $2,982 spent on fees and slippage. |
  |
iM-5HedgeFundSelect: Since inception, on 1/5/2016, the model gained 270.49% while the benchmark SPY gained 111.42% over the same period. Over the previous week the market value of iM-5HedgeFundSelect gained -5.21% at a time when SPY gained -4.31%. A starting capital of $25,000 at inception on 1/5/2016 would have grown to $92,624 which includes $1,958 cash and excludes $1,835 spent on fees and slippage. |
 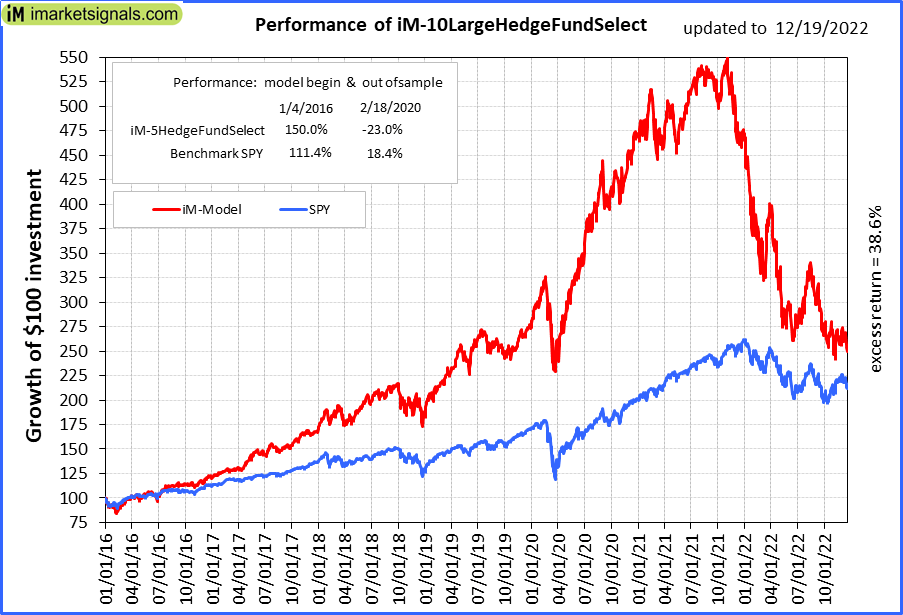 |
iM-10LargeHedgeFundSelect: Since inception, on 1/5/2016, the model gained 150.00% while the benchmark SPY gained 111.42% over the same period. Over the previous week the market value of iM-10LargeHedgeFundSelect gained -5.35% at a time when SPY gained -4.31%. A starting capital of $25,000 at inception on 1/5/2016 would have grown to $62,499 which includes -$892 cash and excludes $1,182 spent on fees and slippage. |
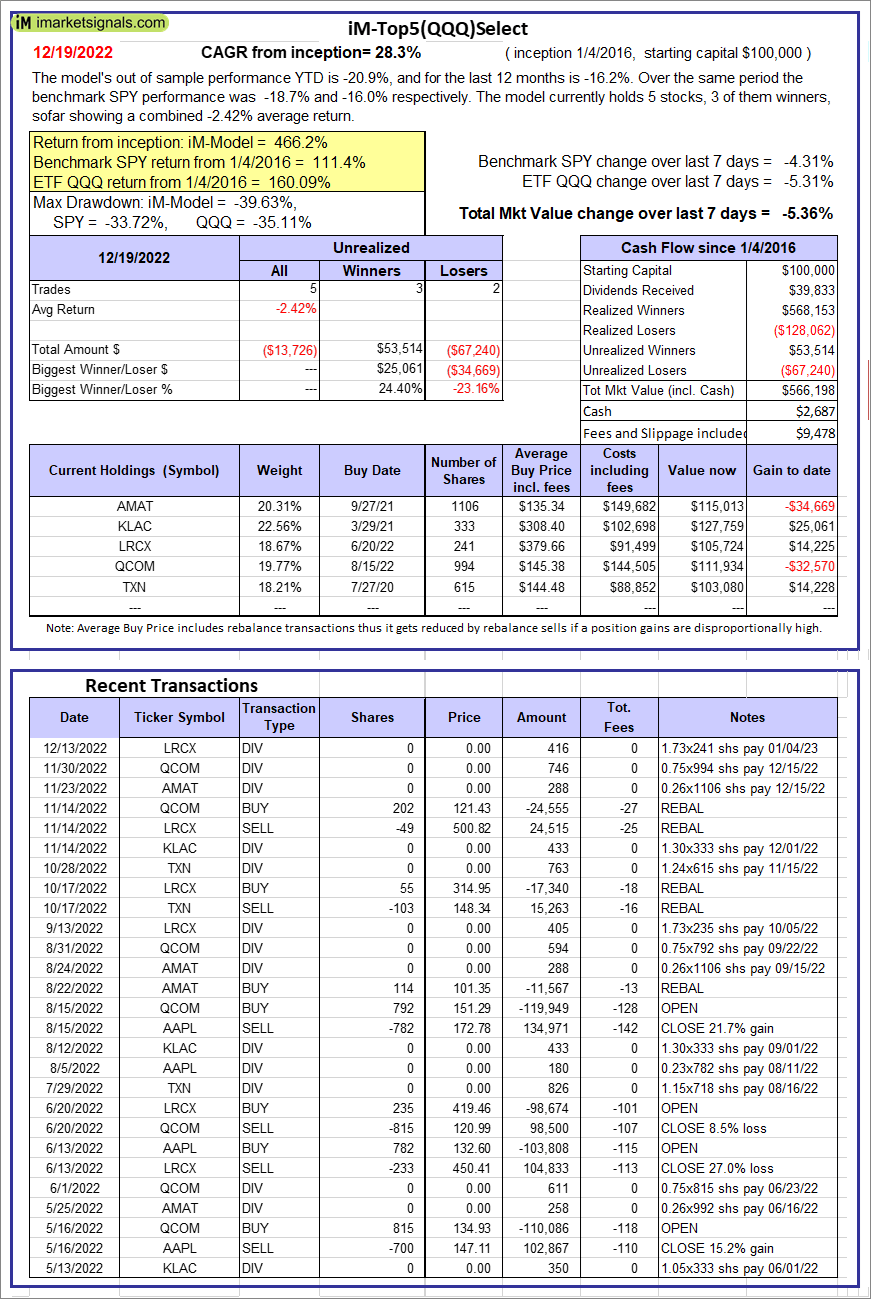  |
iM-Top5(QQQ)Select: Since inception, on 1/5/2016, the model gained 466.20% while the benchmark SPY gained 111.42% over the same period. Over the previous week the market value of iM-Top5(QQQ)Select gained -5.36% at a time when SPY gained -4.31%. A starting capital of $100,000 at inception on 1/5/2016 would have grown to $566,198 which includes $2,687 cash and excludes $9,478 spent on fees and slippage. |
  |
iM-Top5(XLB)Select: Since inception, on 1/5/2016, the model gained 156.44% while the benchmark SPY gained 111.42% over the same period. Over the previous week the market value of iM-Top5(XLB)Select gained -5.92% at a time when SPY gained -4.31%. A starting capital of $100,000 at inception on 1/5/2016 would have grown to $256,438 which includes $3,004 cash and excludes $9,012 spent on fees and slippage. |
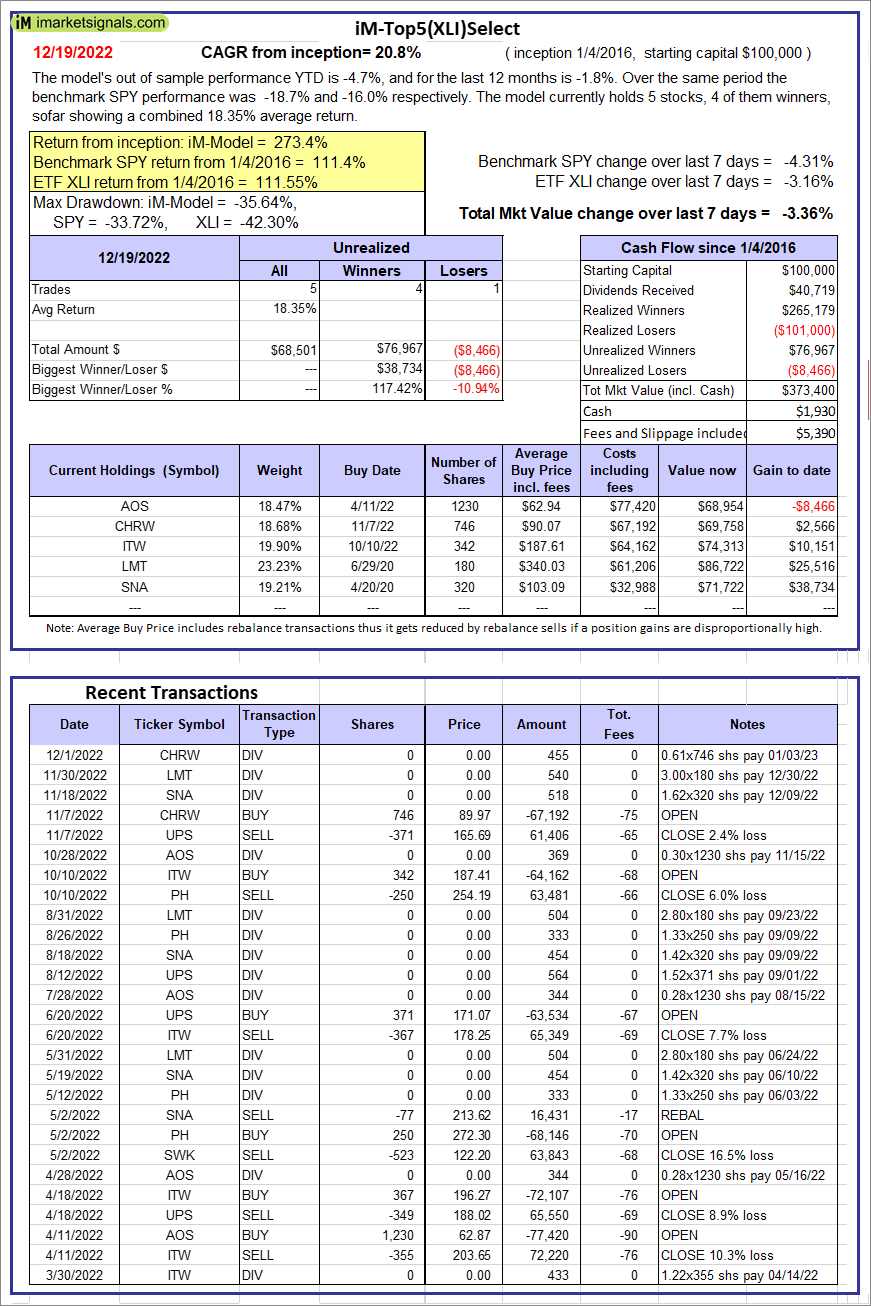 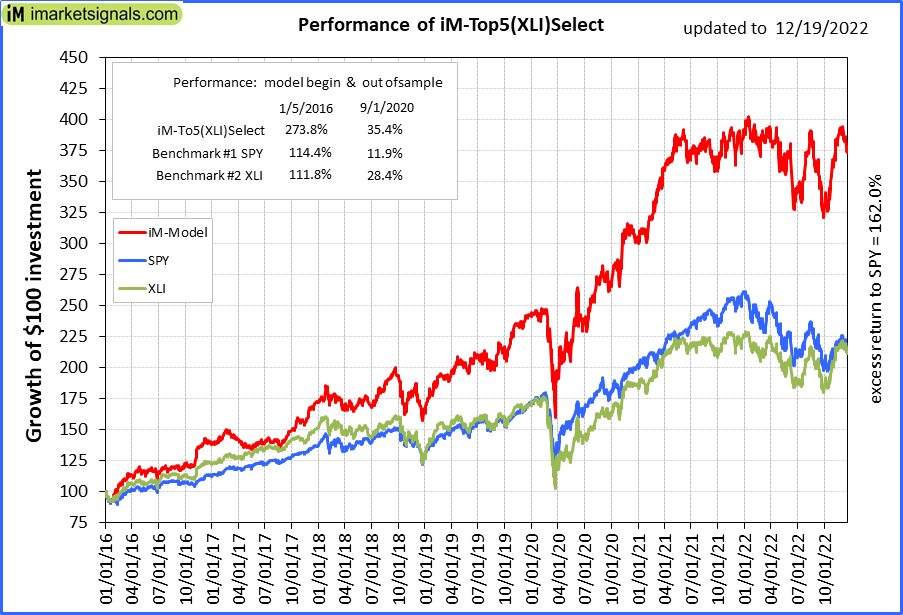 |
iM-Top5(XLI)Select: Since inception, on 1/5/2016, the model gained 273.40% while the benchmark SPY gained 111.42% over the same period. Over the previous week the market value of iM-Top5(XLI)Select gained -3.36% at a time when SPY gained -4.31%. A starting capital of $100,000 at inception on 1/5/2016 would have grown to $373,400 which includes $1,930 cash and excludes $5,390 spent on fees and slippage. |
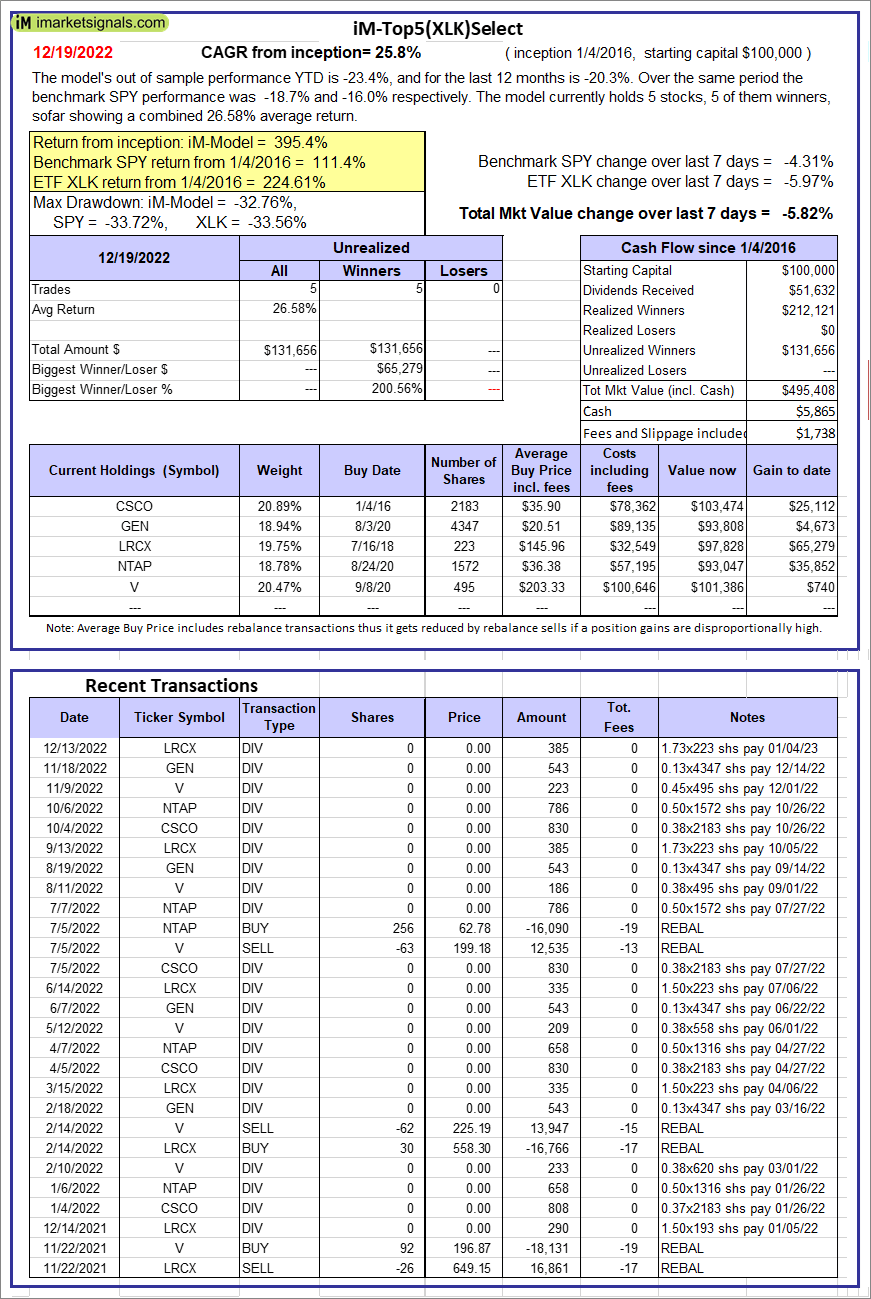 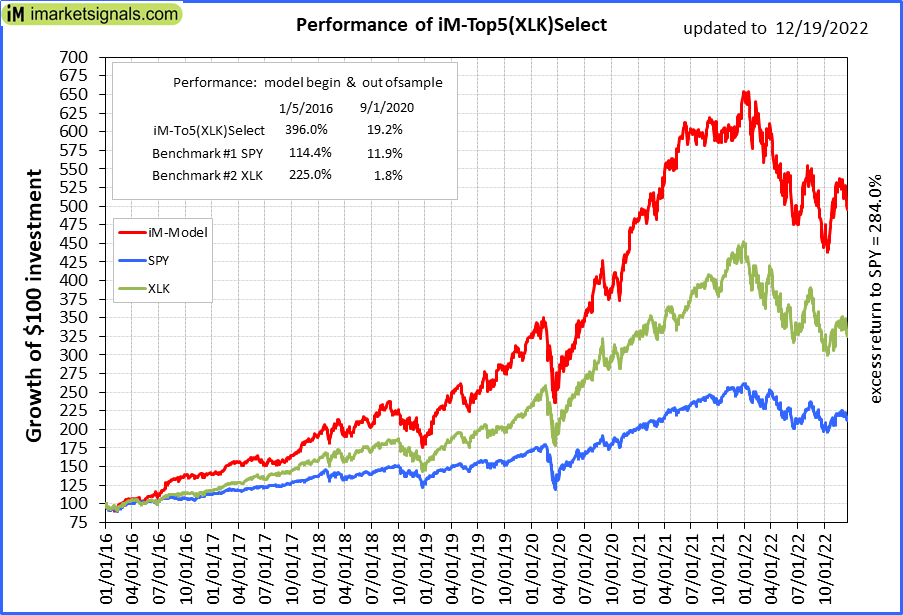 |
iM-Top5(XLK)Select: Since inception, on 1/5/2016, the model gained 395.41% while the benchmark SPY gained 111.42% over the same period. Over the previous week the market value of iM-Top5(XLK)Select gained -5.82% at a time when SPY gained -4.31%. A starting capital of $100,000 at inception on 1/5/2016 would have grown to $495,408 which includes $5,865 cash and excludes $1,738 spent on fees and slippage. |
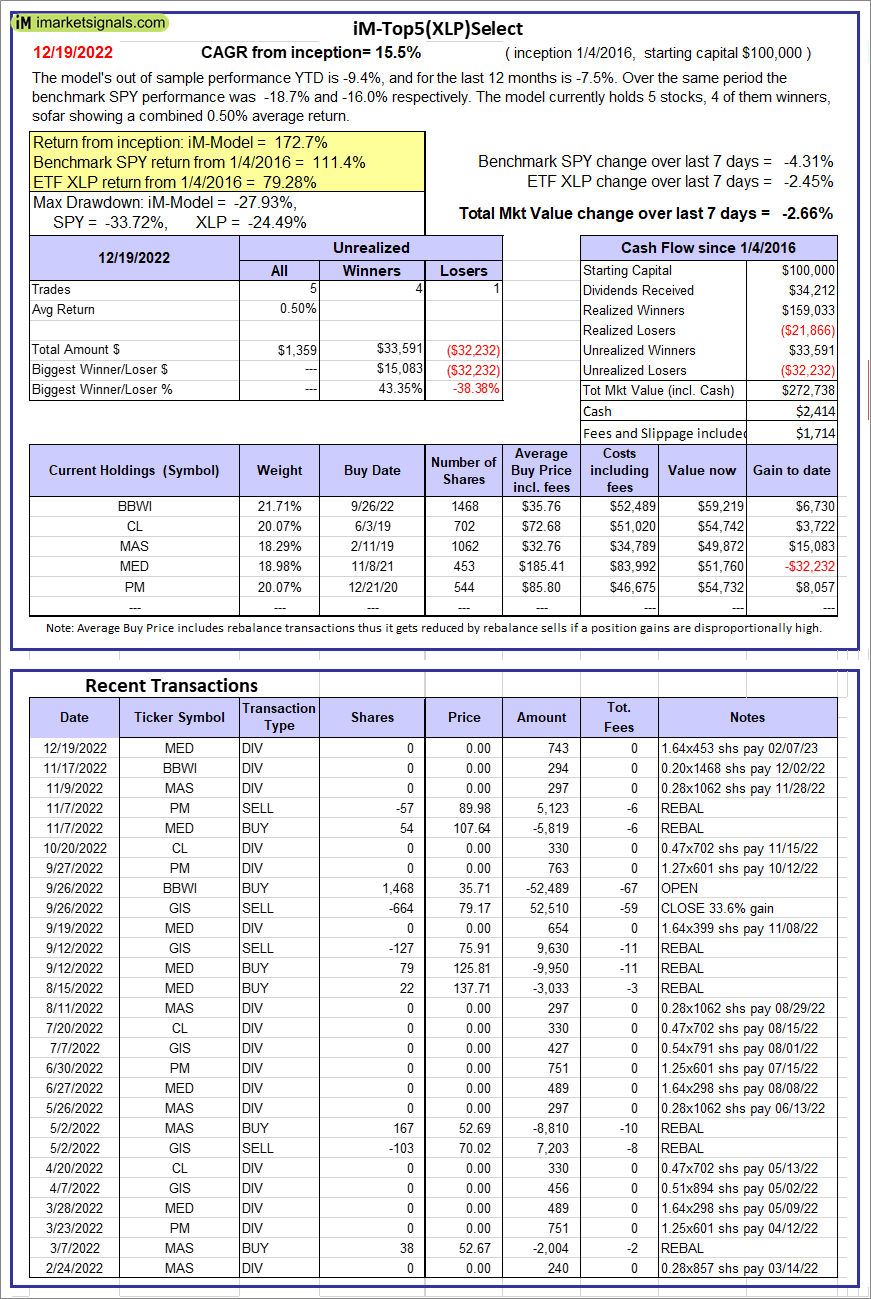 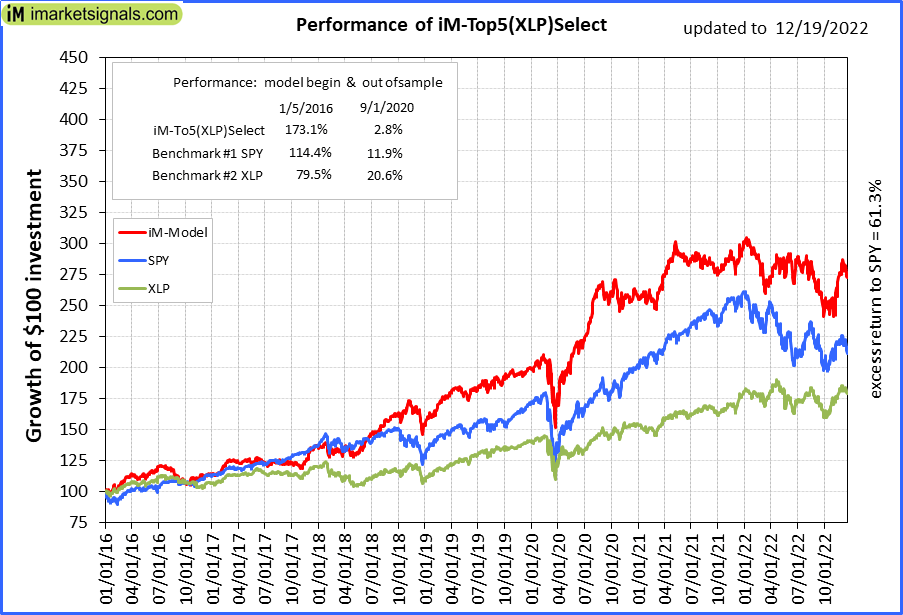 |
iM-Top5(XLP)Select: Since inception, on 1/5/2016, the model gained 172.74% while the benchmark SPY gained 111.42% over the same period. Over the previous week the market value of iM-Top5(XLP)Select gained -2.66% at a time when SPY gained -4.31%. A starting capital of $100,000 at inception on 1/5/2016 would have grown to $272,738 which includes $2,414 cash and excludes $1,714 spent on fees and slippage. |
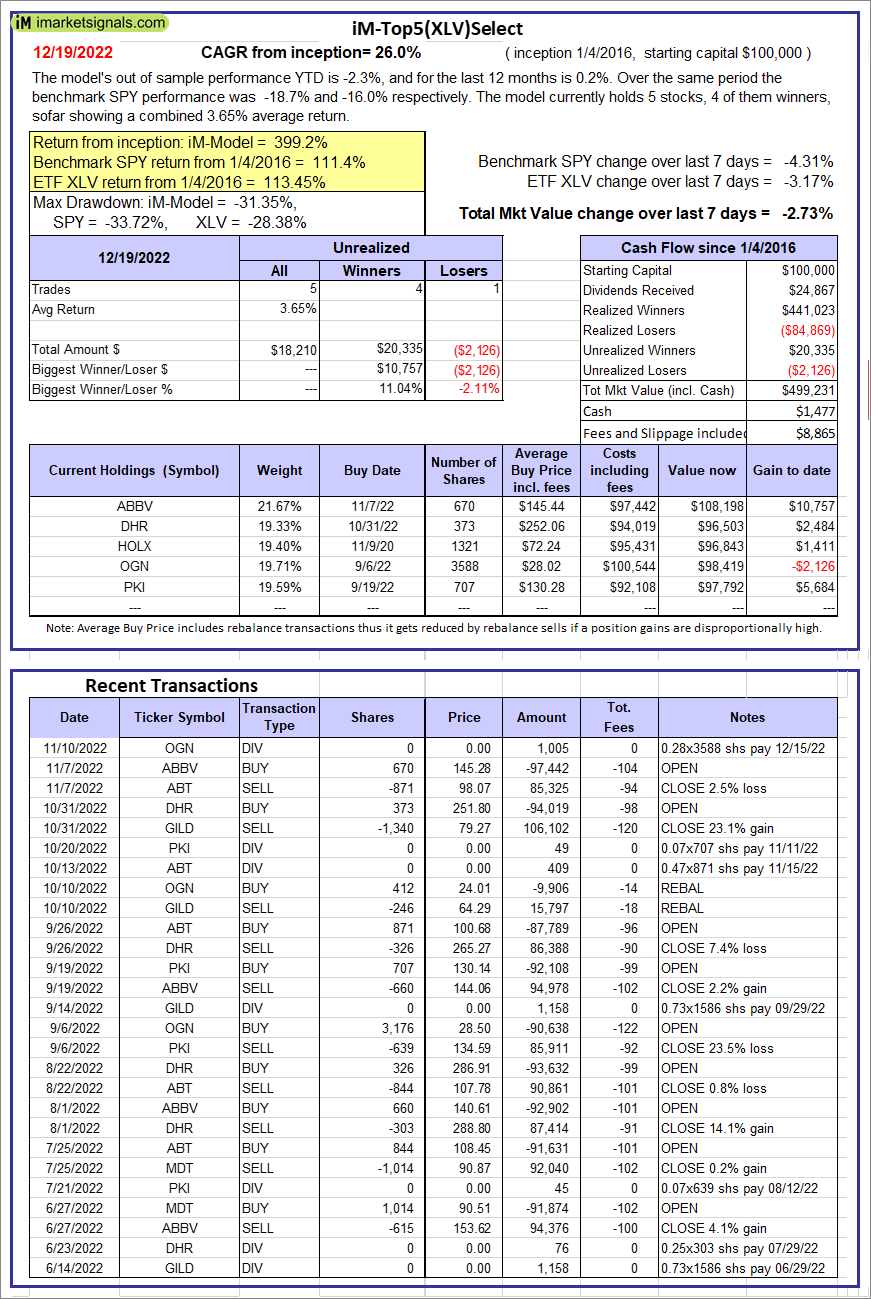 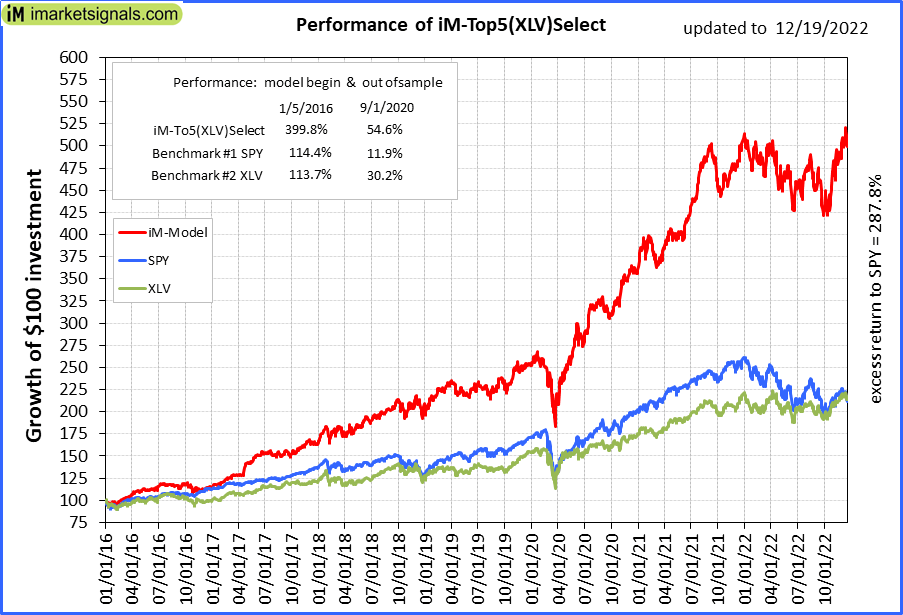 |
iM-Top5(XLV)Select: Since inception, on 1/5/2016, the model gained 399.23% while the benchmark SPY gained 111.42% over the same period. Over the previous week the market value of iM-Top5(XLV)Select gained -2.73% at a time when SPY gained -4.31%. A starting capital of $100,000 at inception on 1/5/2016 would have grown to $499,231 which includes $1,477 cash and excludes $8,865 spent on fees and slippage. |
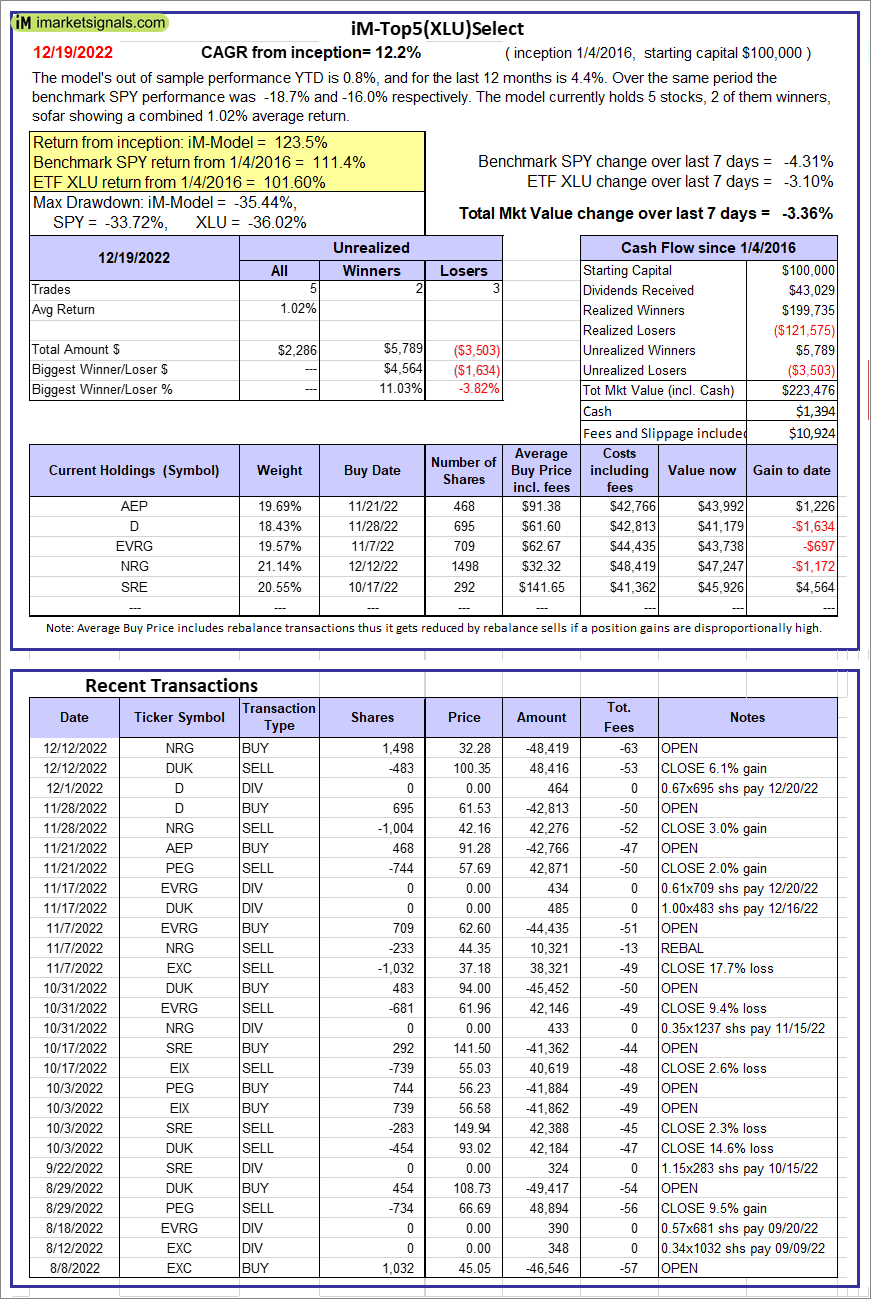 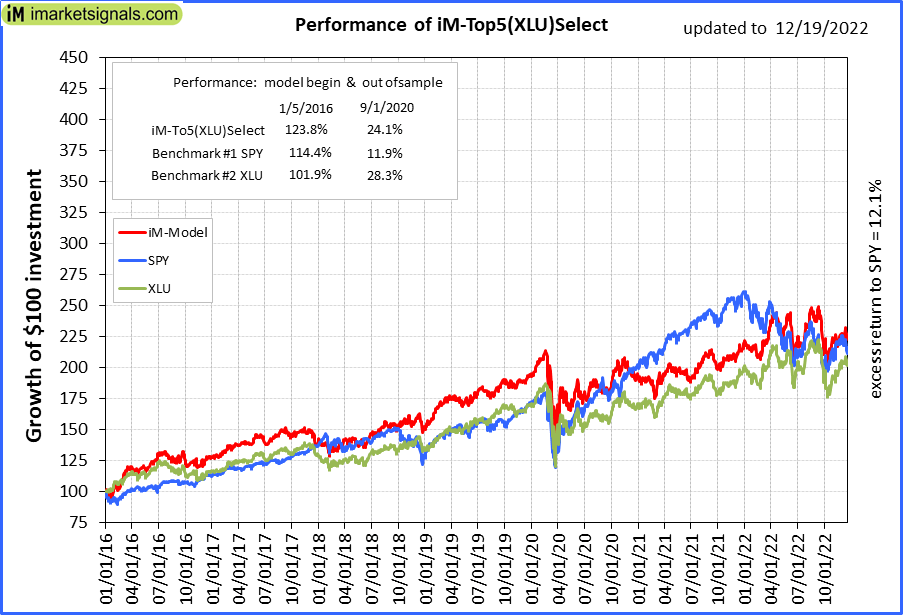 |
iM-Top5(XLU)Select: Since inception, on 1/5/2016, the model gained 123.48% while the benchmark SPY gained 111.42% over the same period. Over the previous week the market value of iM-Top5(XLU)Select gained -3.36% at a time when SPY gained -4.31%. A starting capital of $100,000 at inception on 1/5/2016 would have grown to $223,476 which includes $1,394 cash and excludes $10,924 spent on fees and slippage. |
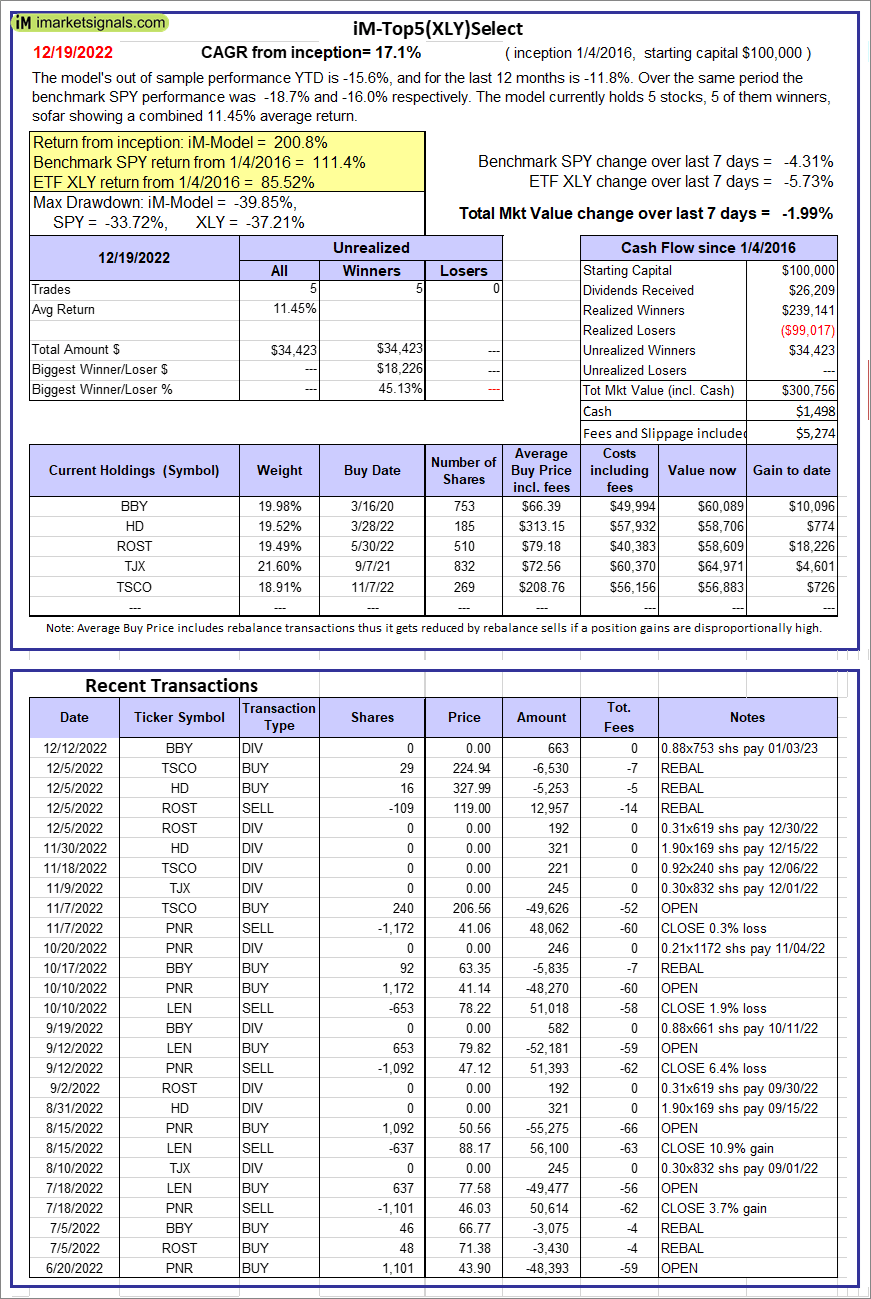  |
iM-Top5(XLY)Select: Since inception, on 1/5/2016, the model gained 200.76% while the benchmark SPY gained 111.42% over the same period. Over the previous week the market value of iM-Top5(XLY)Select gained -1.99% at a time when SPY gained -4.31%. A starting capital of $100,000 at inception on 1/5/2016 would have grown to $300,756 which includes $1,498 cash and excludes $5,274 spent on fees and slippage. |
 |
iM-Seasonal Super-Sectors (Top5 combo) : Since inception, on 11/17/2020, the model gained 22.28% while the benchmark SPY gained 9.75% over the same period. Over the previous week the market value of iM-Seasonal Super-Sectors (Top5 combo) gained -3.38% at a time when SPY gained -4.31%. A starting capital of $100,000 at inception on 11/17/2020 would have grown to $122,278 which includes $3,294 cash and excludes $00 spent on fees and slippage. |
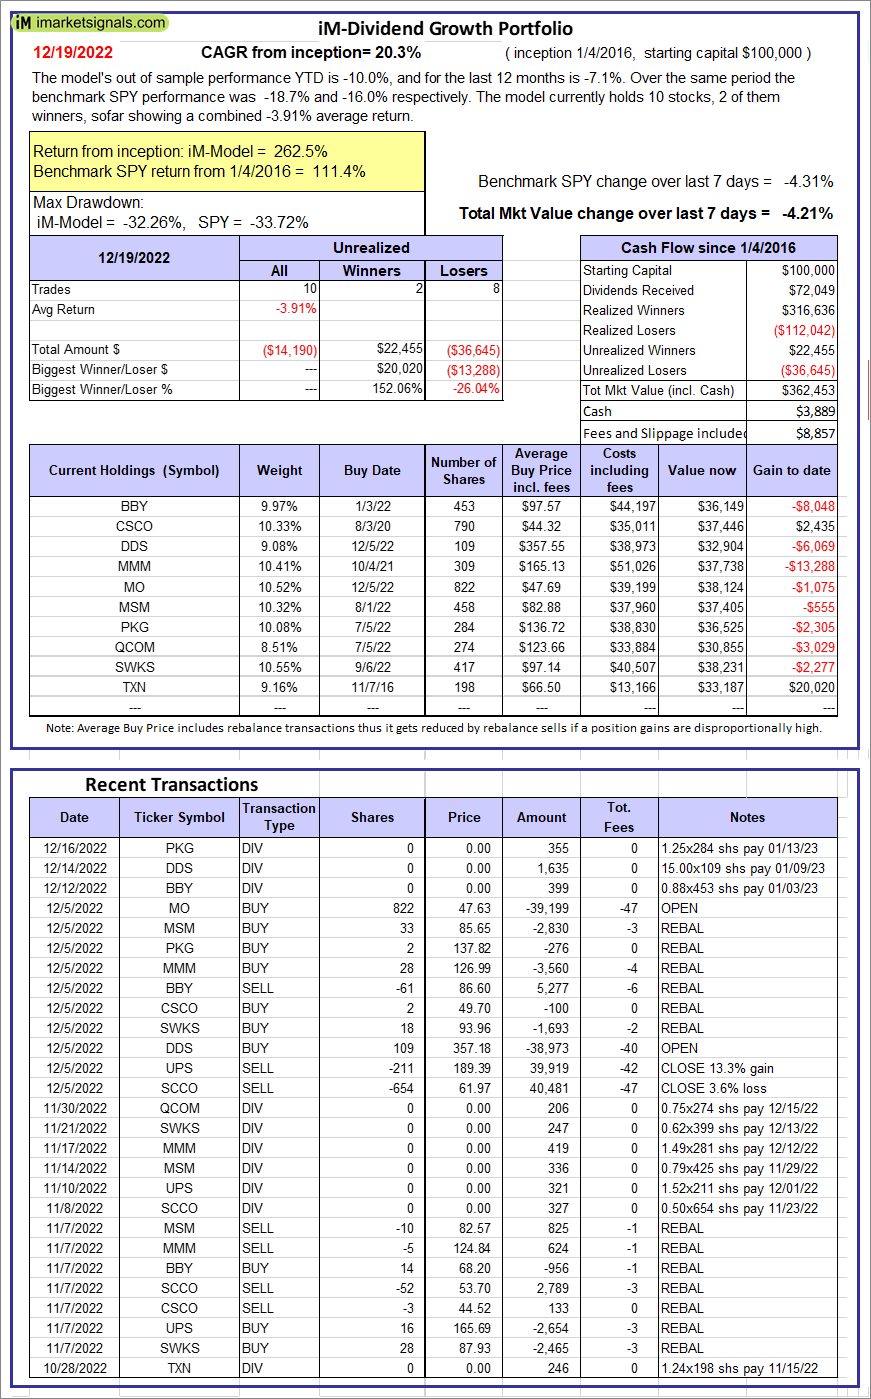 |
iM-Dividend Growth Portfolio: The model’s out of sample performance YTD is -10.0%, and for the last 12 months is -7.1%. Over the same period the benchmark SPY performance was -18.7% and -16.0% respectively. Over the previous week the market value of the iM-Dividend Growth Portfolio gained -4.21% at a time when SPY gained -4.31%. A starting capital of $100,000 at inception on 6/30/2016 would have grown to $362,453 which includes $3,889 cash and excludes $8,857 spent on fees and slippage. |
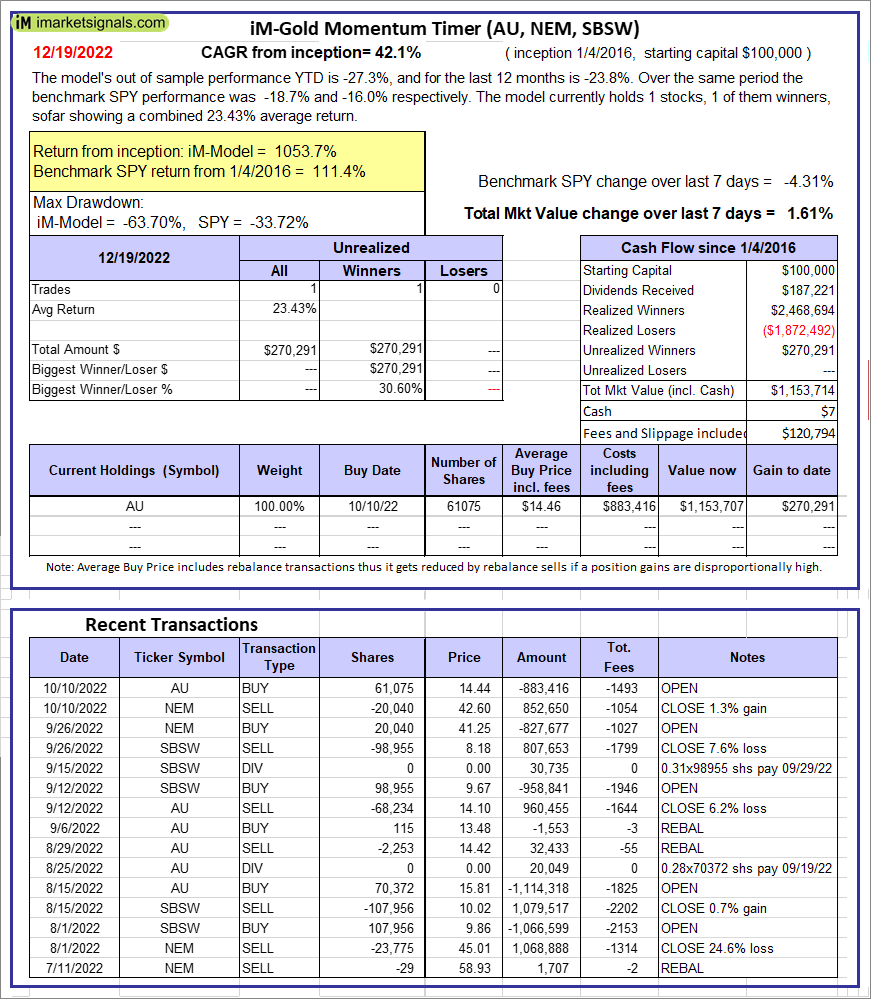 |
iM-Gold Momentum Timer (AU, NEM, SBSW): The model’s out of sample performance YTD is -27.3%, and for the last 12 months is -23.8%. Over the same period the benchmark SPY performance was -18.7% and -16.0% respectively. Over the previous week the market value of iM-Gold Momentum Timer (AU, NEM, SBSW) gained 1.61% at a time when SPY gained -4.31%. A starting capital of $100,000 at inception on 6/30/2016 would have grown to $07 which includes $120,794 cash and excludes Gain to date spent on fees and slippage. |
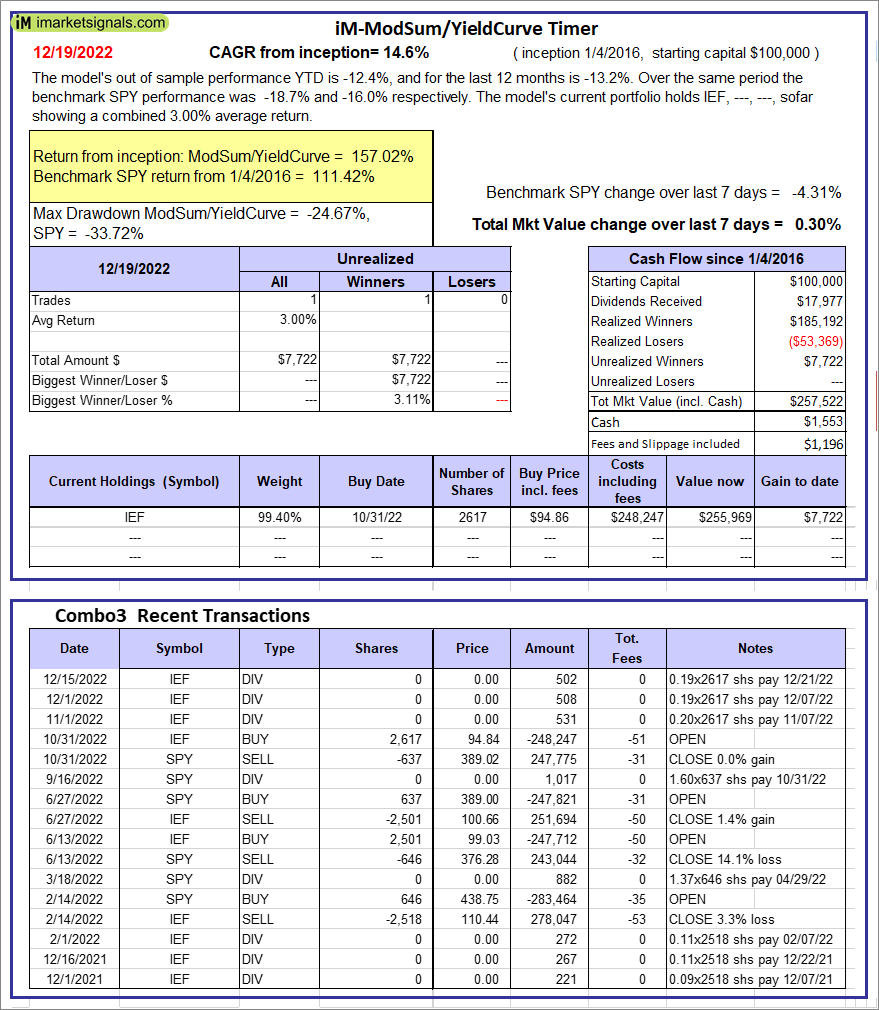 |
iM-ModSum/YieldCurve Timer: The model’s out of sample performance YTD is -12.4%, and for the last 12 months is -13.2%. Over the same period the benchmark SPY performance was -18.7% and -16.0% respectively. Over the previous week the market value of iM-PortSum/YieldCurve Timer gained 0.30% at a time when SPY gained -4.31%. A starting capital of $100,000 at inception on 1/1/2016 would have grown to $257,522 which includes $1,553 cash and excludes $1,196 spent on fees and slippage. |
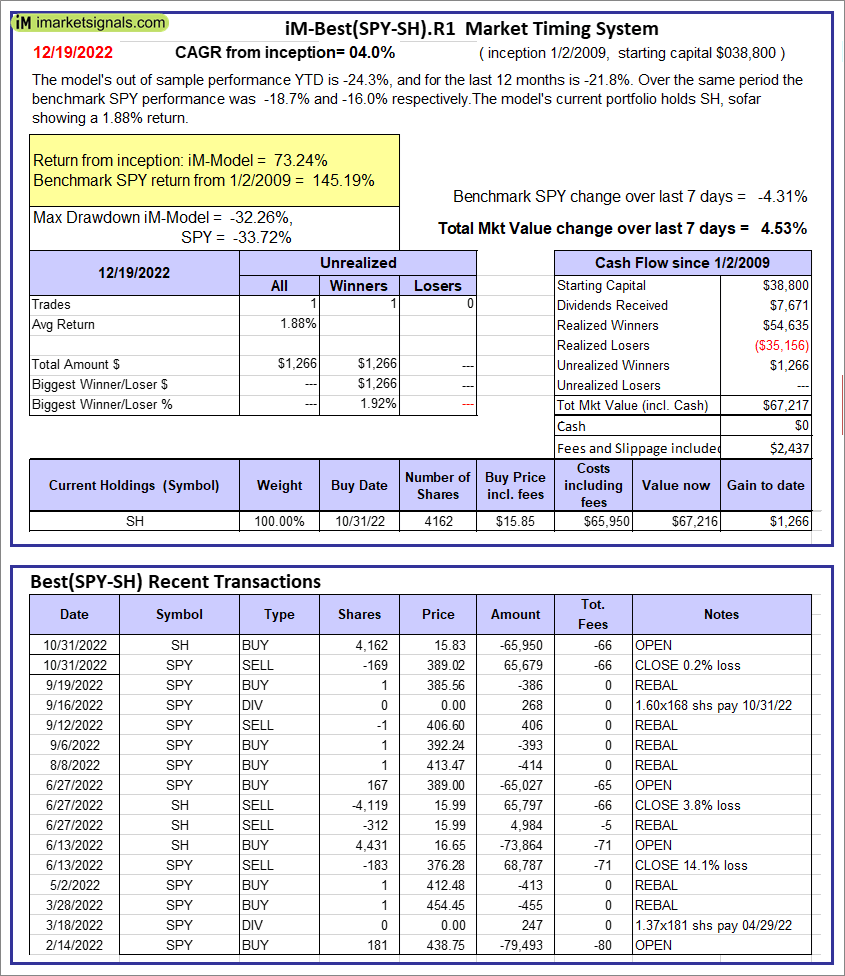 |
iM-Best(SPY-SH).R1: The model’s out of sample performance YTD is -24.3%, and for the last 12 months is -21.8%. Over the same period the benchmark SPY performance was -18.7% and -16.0% respectively. Over the previous week the market value of Best(SPY-SH) gained 4.53% at a time when SPY gained -4.31%. A starting capital of $100,000 at inception on 1/2/2009 would have grown to $67,217 which includes $0 cash and excludes $2,437 spent on fees and slippage. |
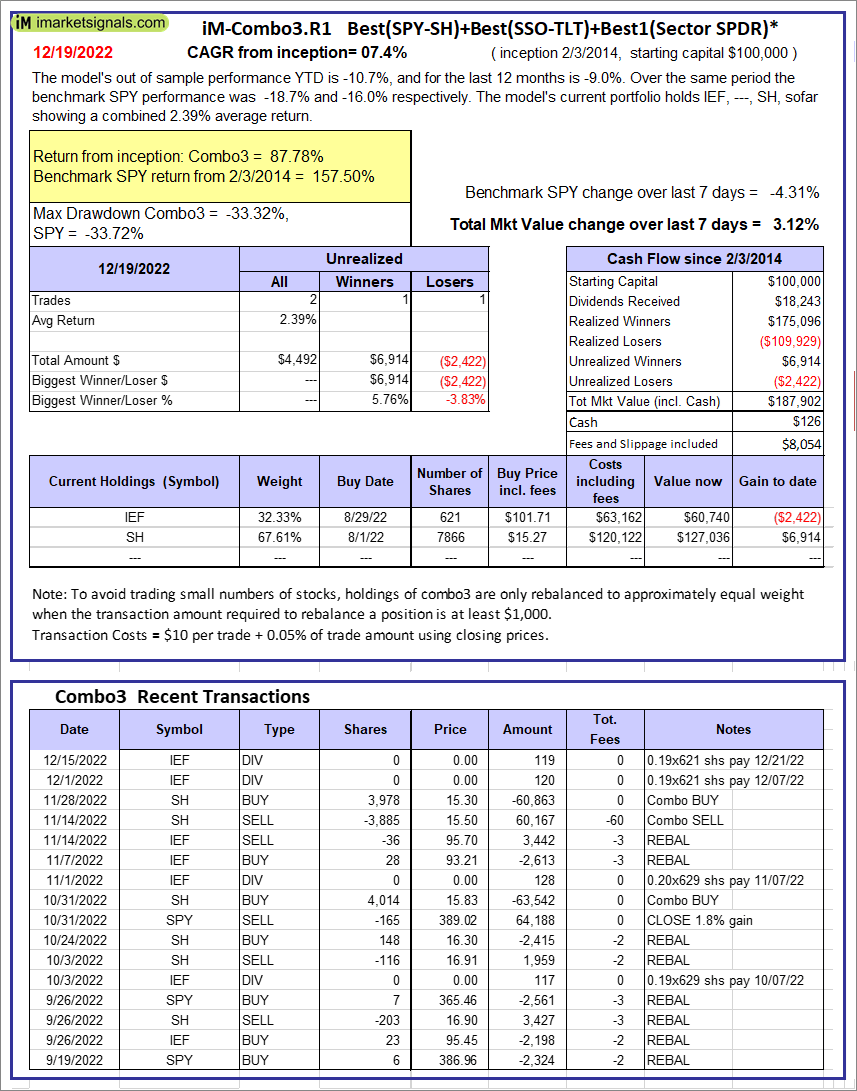 |
iM-Combo3.R1: The model’s out of sample performance YTD is -10.7%, and for the last 12 months is -9.0%. Over the same period the benchmark SPY performance was -18.7% and -16.0% respectively. Over the previous week the market value of iM-Combo3.R1 gained 3.12% at a time when SPY gained -4.31%. A starting capital of $100,000 at inception on 2/3/2014 would have grown to $187,902 which includes $126 cash and excludes $8,054 spent on fees and slippage. |
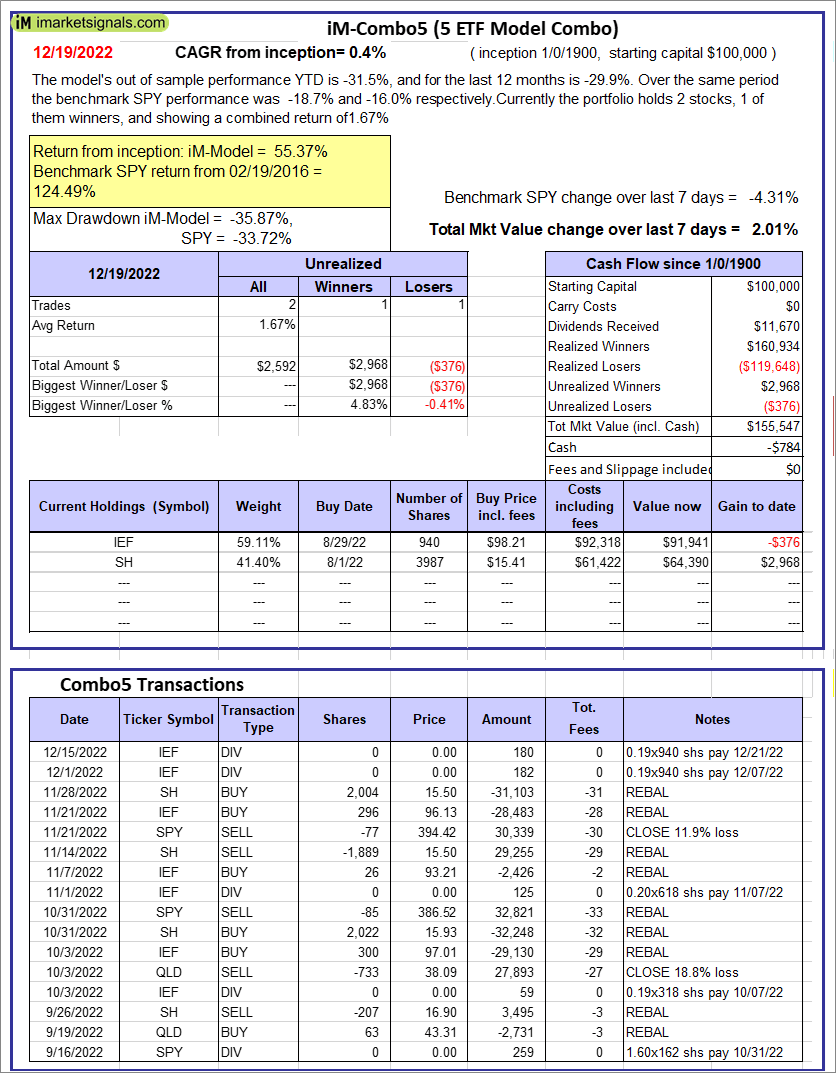 |
iM-Combo5: The model’s out of sample performance YTD is -31.5%, and for the last 12 months is -29.9%. Over the same period the benchmark SPY performance was -18.7% and -16.0% respectively. Over the previous week the market value of iM-Combo5 gained 2.01% at a time when SPY gained -4.31%. A starting capital of $100,000 at inception on 2/22/2016 would have grown to $155,547 which includes -$784 cash and excludes $0 spent on fees and slippage. |
 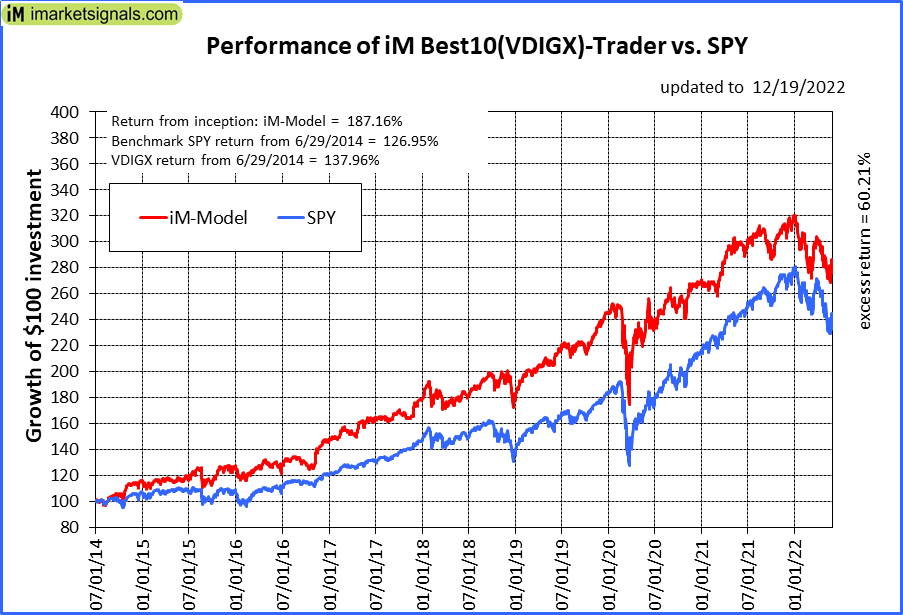 |
iM-Best10(VDIGX)-Trader: The model’s out of sample performance YTD is -10.3%, and for the last 12 months is -8.0%. Over the same period the benchmark SPY performance was -18.7% and -16.0% respectively. Since inception, on 7/1/2014, the model gained 187.16% while the benchmark SPY gained 126.95% and VDIGX gained 137.96% over the same period. Over the previous week the market value of iM-Best10(VDIGX) gained -2.74% at a time when SPY gained -4.31%. A starting capital of $100,000 at inception on 7/1/2014 would have grown to $287,164 which includes $716 cash and excludes $4,445 spent on fees and slippage. |
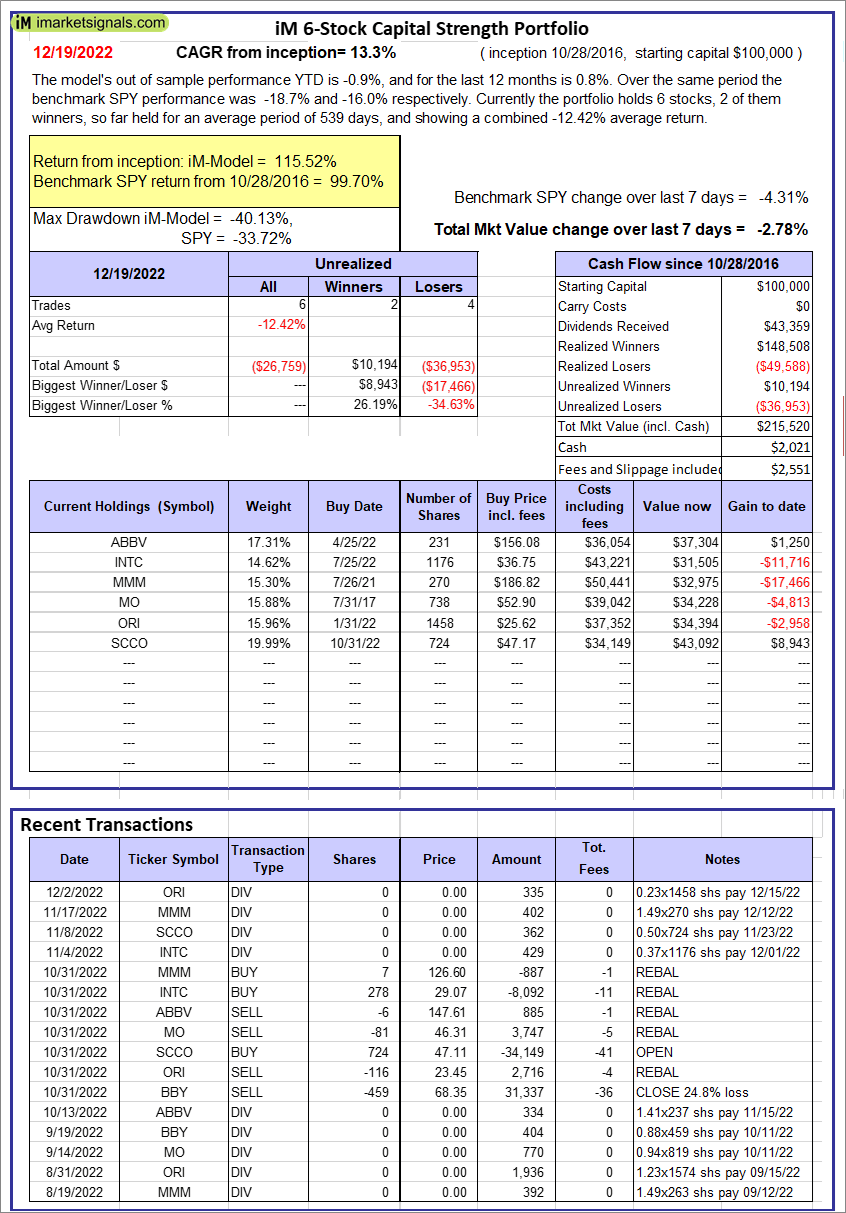 |
iM 6-Stock Capital Strength Portfolio: The model’s out of sample performance YTD is -0.9%, and for the last 12 months is 0.8%. Over the same period the benchmark SPY performance was -18.7% and -16.0% respectively. Over the previous week the market value of the iM 6-Stock Capital Strength Portfolio gained -2.78% at a time when SPY gained -4.31%. A starting capital of $100,000 at inception on 10/28/2016 would have grown to $215,520 which includes $2,021 cash and excludes $2,551 spent on fees and slippage. |
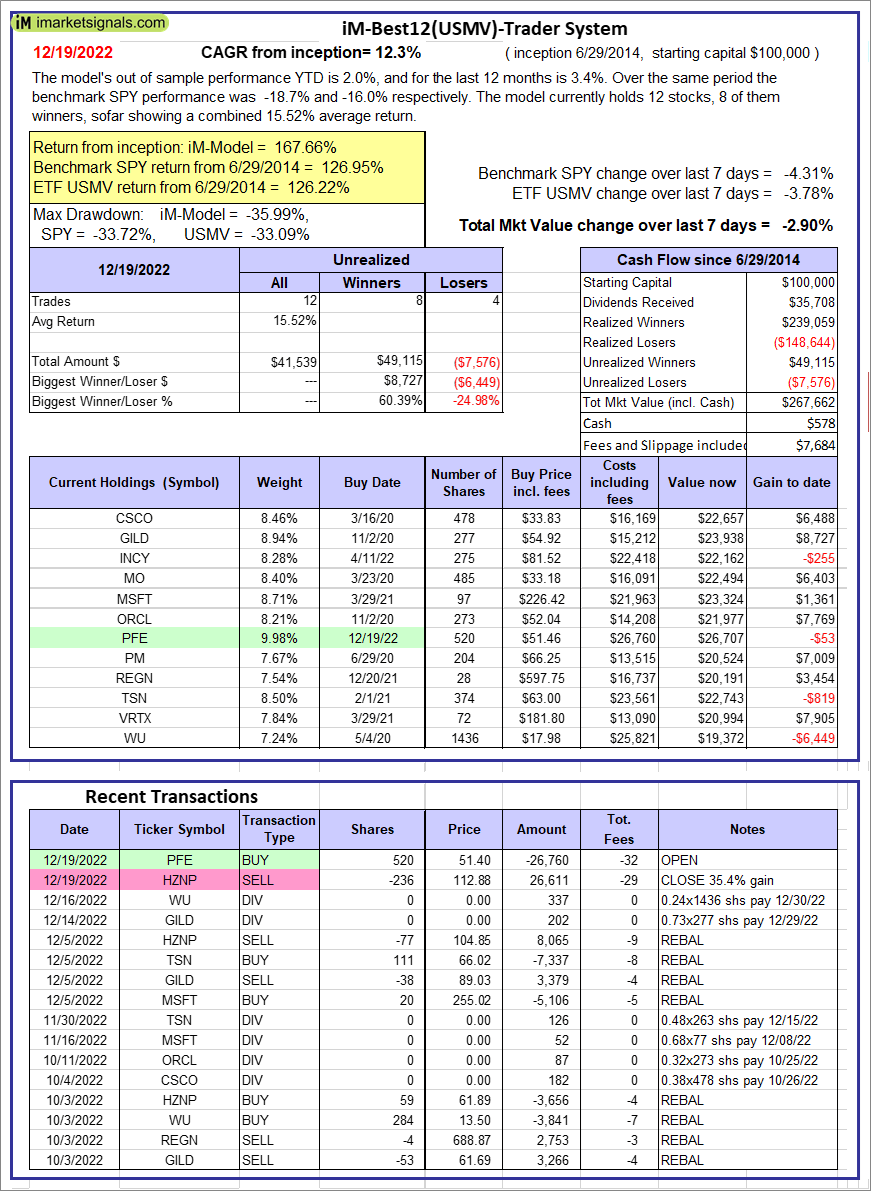 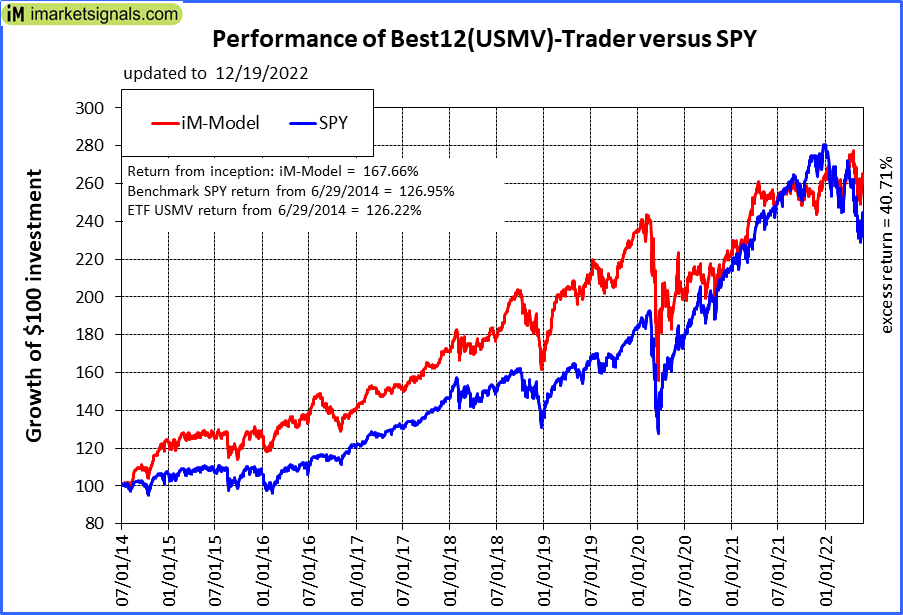 |
iM-Best12(USMV)-Trader: The model’s out of sample performance YTD is 2.0%, and for the last 12 months is 3.4%. Over the same period the benchmark SPY performance was -18.7% and -16.0% respectively. Since inception, on 6/30/2014, the model gained 167.66% while the benchmark SPY gained 126.95% and the ETF USMV gained 126.22% over the same period. Over the previous week the market value of iM-Best12(USMV)-Trader gained -2.90% at a time when SPY gained -4.31%. A starting capital of $100,000 at inception on 6/30/2014 would have grown to $267,662 which includes $578 cash and excludes $7,684 spent on fees and slippage. |
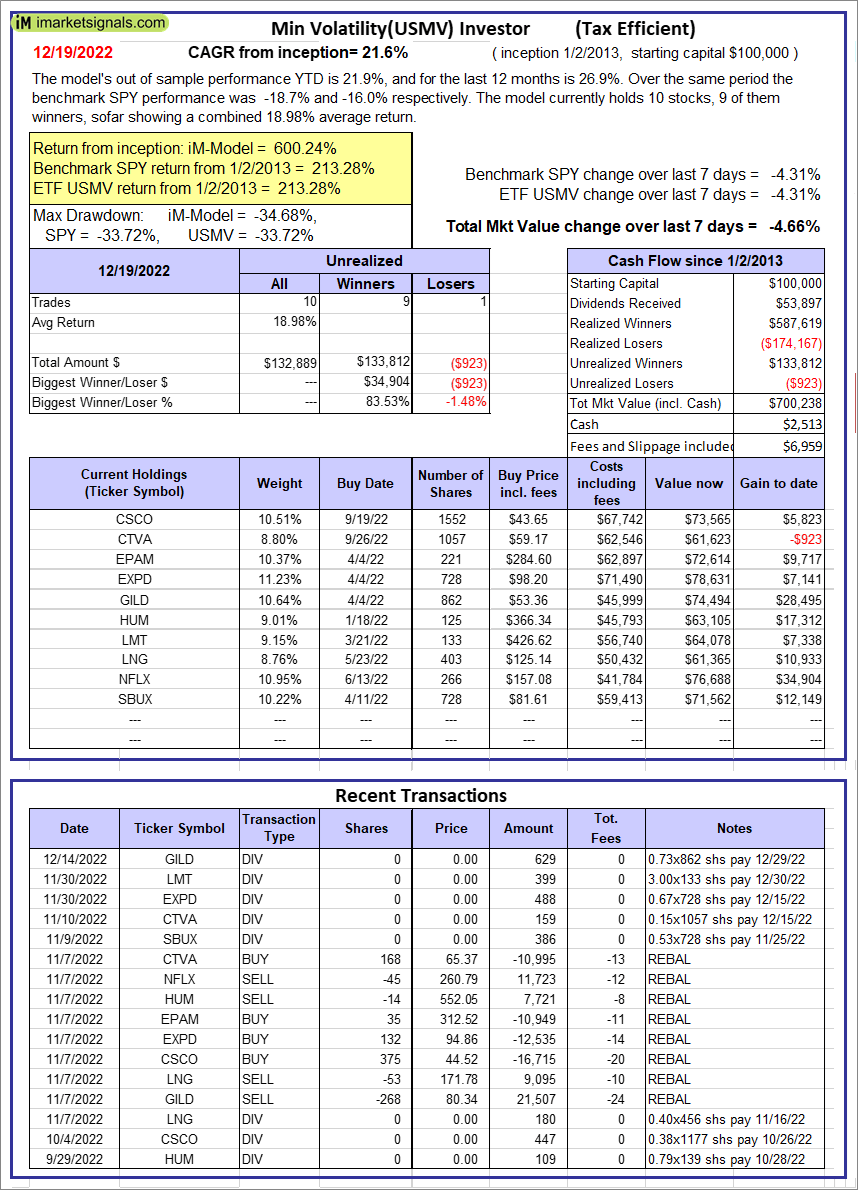  |
iM-Min Volatility(USMV) Investor (Tax Efficient): The model’s out of sample performance YTD is 21.9%, and for the last 12 months is 26.9%. Over the same period the benchmark SPY performance was -18.7% and -16.0% respectively. Since inception, on 1/3/2013, the model gained 600.24% while the benchmark SPY gained 213.28% and the ETF USMV gained 213.28% over the same period. Over the previous week the market value of iM-Best12(USMV)Q1 gained -4.66% at a time when SPY gained -4.31%. A starting capital of $100,000 at inception on 1/3/2013 would have grown to $700,238 which includes $2,513 cash and excludes $6,959 spent on fees and slippage. |
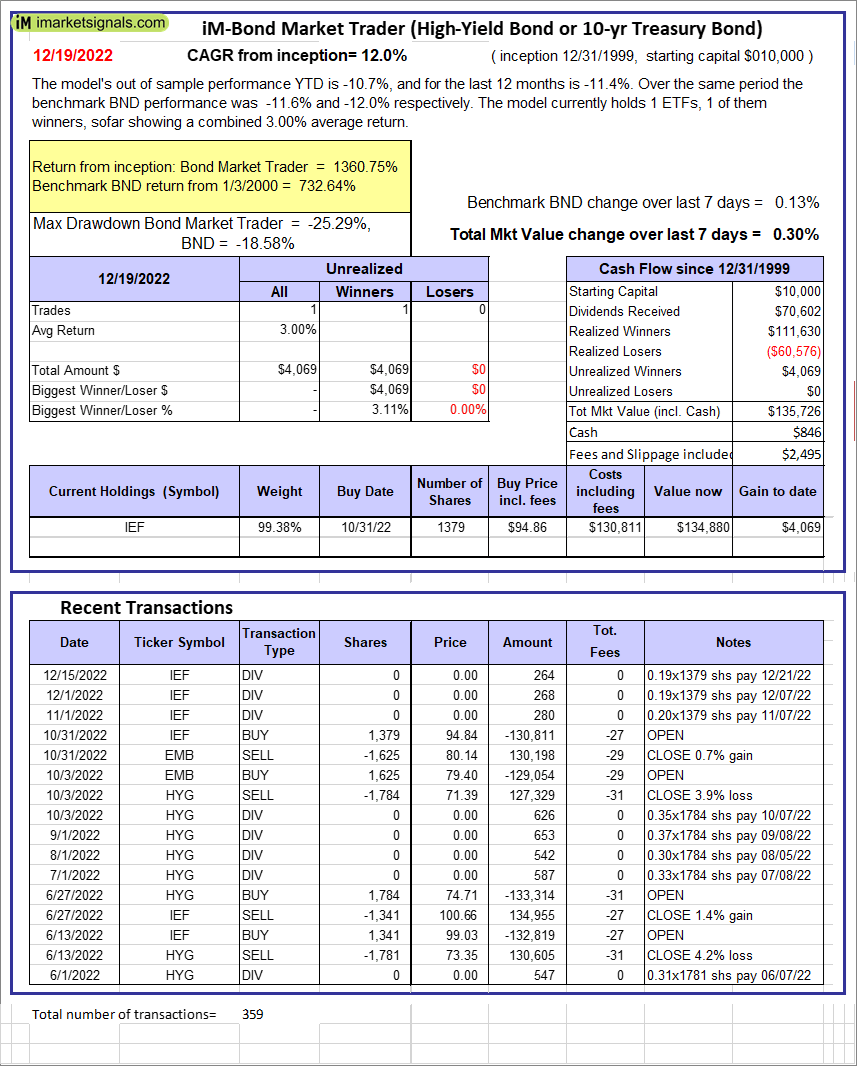 |
iM-Bond Market Trader (High-Yield Bond or 10-yr Treasury Bond): The model’s out of sample performance YTD is -10.7%, and for the last 12 months is -11.4%. Over the same period the benchmark BND performance was -11.6% and -12.0% respectively. Over the previous week the market value of the iM-Bond Market Trader (High-Yield Bond or 10-yr Treasury Bond) gained 0.30% at a time when BND gained 0.13%. A starting capital of $10,000 at inception on 1/3/2000 would have grown to $135,726 which includes $846 cash and excludes $2,495 spent on fees and slippage. |
|
|
iM-ModSum/YieldCurve Timer: The model’s out of sample performance YTD is -12.4%, and for the last 12 months is -13.2%. Over the same period the benchmark SPY performance was -18.7% and -16.0% respectively. Over the previous week the market value of iM-PortSum/YieldCurve Timer gained 0.30% at a time when SPY gained -4.31%. A starting capital of $100,000 at inception on 1/1/2016 would have grown to $257,522 which includes $1,553 cash and excludes $1,196 spent on fees and slippage. |
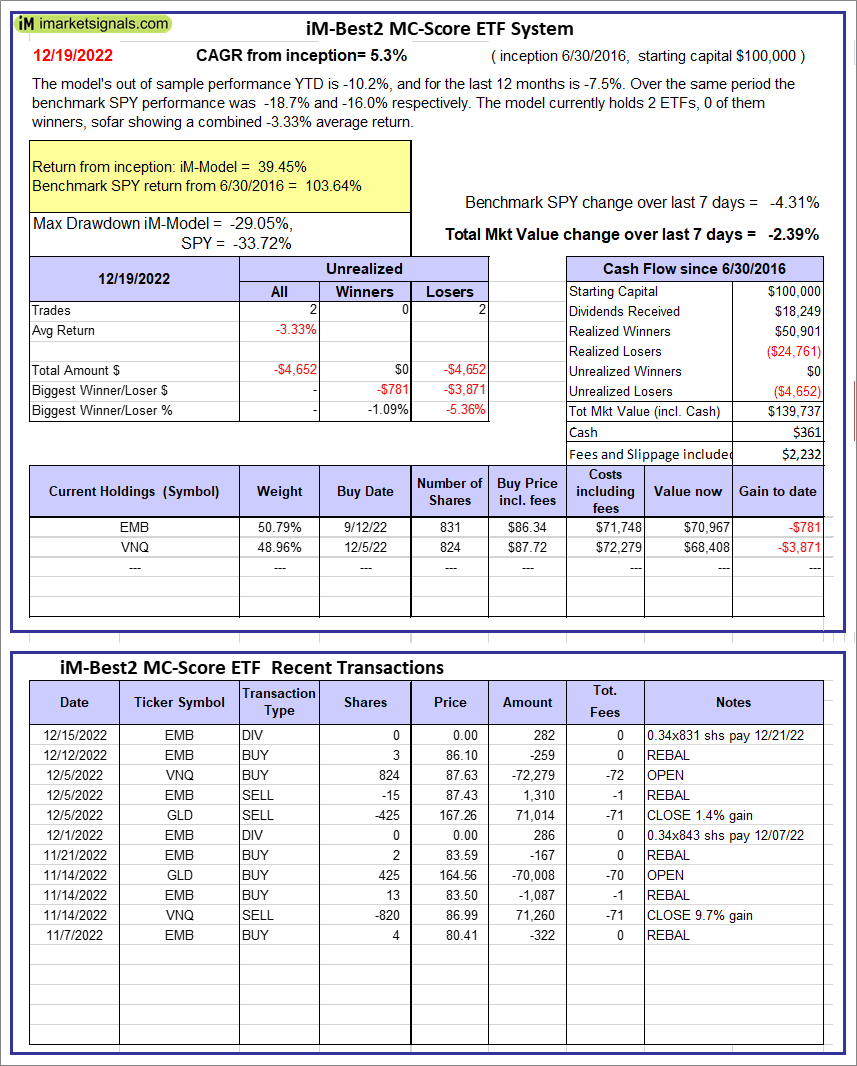 |
iM-Best2 MC-Score ETF System: The model’s out of sample performance YTD is -10.2%, and for the last 12 months is -7.5%. Over the same period the benchmark SPY performance was -18.7% and -16.0% respectively. Over the previous week the market value of the iM-Best2 MC-Score ETF System gained -2.39% at a time when SPY gained -4.31%. A starting capital of $100,000 at inception on 6/30/2016 would have grown to $139,737 which includes $361 cash and excludes $2,232 spent on fees and slippage. |
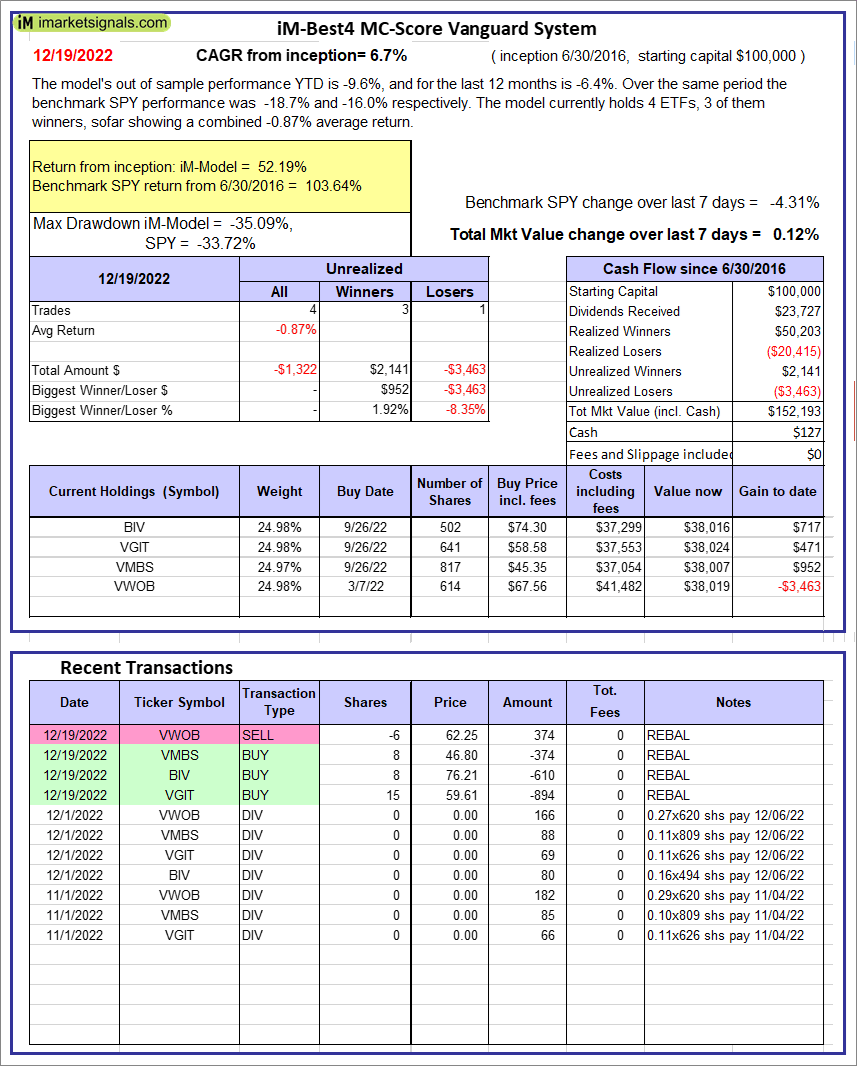 |
iM-Best4 MC-Score Vanguard System: The model’s out of sample performance YTD is -9.6%, and for the last 12 months is -6.4%. Over the same period the benchmark SPY performance was -18.7% and -16.0% respectively. Over the previous week the market value of the iM-Best4 MC-Score Vanguard System gained 0.12% at a time when SPY gained -4.31%. A starting capital of $100,000 at inception on 6/30/2016 would have grown to $152,193 which includes $127 cash and excludes $00 spent on fees and slippage. |
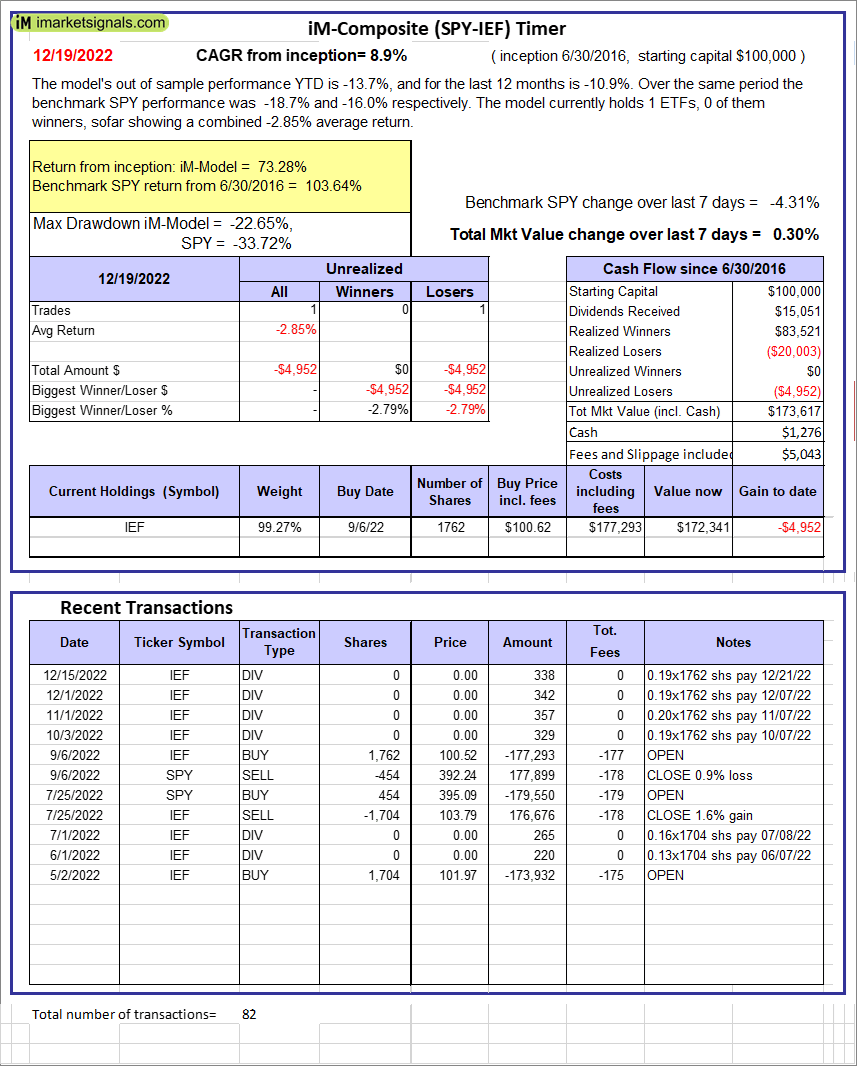 |
iM-Composite (SPY-IEF) Timer: The model’s out of sample performance YTD is -13.7%, and for the last 12 months is -10.9%. Over the same period the benchmark SPY performance was -18.7% and -16.0% respectively. Over the previous week the market value of the iM-Composite (SPY-IEF) Timer gained 0.30% at a time when SPY gained -4.31%. A starting capital of $100,000 at inception on 6/30/2016 would have grown to $173,617 which includes $1,276 cash and excludes $5,043 spent on fees and slippage. |
 |
iM-Composite(Gold-Stocks-Bond) Timer: The model’s out of sample performance YTD is -5.3%, and for the last 12 months is 0.9%. Over the same period the benchmark SPY performance was -18.7% and -16.0% respectively. Over the previous week the market value of the iM-Composite(Gold-Stocks-Bond) Timer gained 0.42% at a time when SPY gained -4.31%. A starting capital of $100,000 at inception on 6/30/2016 would have grown to $169,098 which includes $36 cash and excludes $9,190 spent on fees and slippage. |
iM-Best Reports – 12/19/2022
Posted in pmp SPY-SH
Leave a Reply
You must be logged in to post a comment.