  |
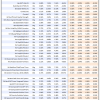
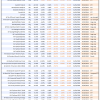
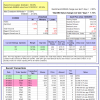
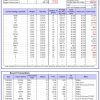
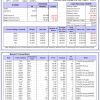
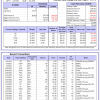
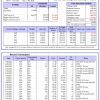
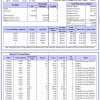
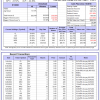
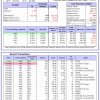
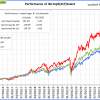
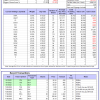
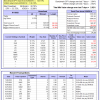
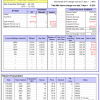
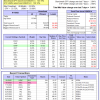
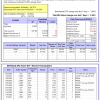
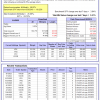
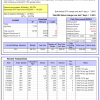
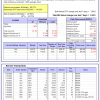
Out of sample performance summary of our models for the past 1, 2, 4 and 13 week periods. The active active return indicates how the models over- or underperformed the benchmark ETF SPY. Also the YTD, and the 1-, 3-, 5- and 10-year annualized returns are shown in the second table |
|
|
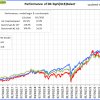
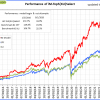
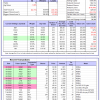
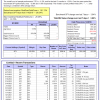
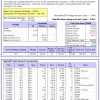
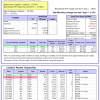
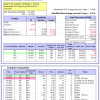
iM-FlipSaver 60:40 | 20:80 – 2017: The model’s out of sample performance YTD is -8.4%, and for the last 12 months is -3.6%. Over the same period the benchmark E60B40 performance was -10.5% and -6.1% respectively. Over the previous week the market value of iM-FlipSaver 80:20 | 20:80 gained 1.73% at a time when SPY gained 2.85%. A starting capital of $100,000 at inception on 7/16/2015 would have grown to $149,272 which includes $1,140 cash and excludes $2,392 spent on fees and slippage. |
|
|
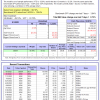
iM-FlipSaver 70:30 | 20:80 – 2017: The model’s out of sample performance YTD is -8.7%, and for the last 12 months is -3.6%. Over the same period the benchmark E60B40 performance was -10.5% and -6.1% respectively. Over the previous week the market value of iM-FlipSaver 70:30 | 20:80 gained 1.73% at a time when SPY gained 2.85%. A starting capital of $100,000 at inception on 7/15/2015 would have grown to $153,454 which includes $890 cash and excludes $2,542 spent on fees and slippage. |
|
|
iM-FlipSaver 80:20 | 20:80 – 2017: The model’s out of sample performance YTD is -9.1%, and for the last 12 months is -3.5%. Over the same period the benchmark E60B40 performance was -10.5% and -6.1% respectively. Over the previous week the market value of iM-FlipSaver 80:20 | 20:80 gained 1.73% at a time when SPY gained 2.85%. A starting capital of $100,000 at inception on 1/2/2017 would have grown to $157,457 which includes $781 cash and excludes $2,686 spent on fees and slippage. |
|
|
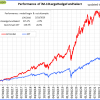
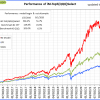
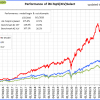
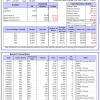
iM-5HedgeFundSelect: Since inception, on 1/5/2016, the model gained 332.12% while the benchmark SPY gained 126.55% over the same period. Over the previous week the market value of iM-5HedgeFundSelect gained 5.76% at a time when SPY gained 3.84%. A starting capital of $25,000 at inception on 1/5/2016 would have grown to $108,030 which includes $26 cash and excludes $1,739 spent on fees and slippage. |
|
|
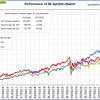
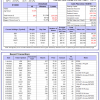
iM-10LargeHedgeFundSelect: Since inception, on 1/5/2016, the model gained 215.12% while the benchmark SPY gained 126.55% over the same period. Over the previous week the market value of iM-10LargeHedgeFundSelect gained 6.13% at a time when SPY gained 3.84%. A starting capital of $25,000 at inception on 1/5/2016 would have grown to $78,781 which includes $7 cash and excludes $1,118 spent on fees and slippage. |
|
|
iM-Top5(QQQ)Select: Since inception, on 1/5/2016, the model gained 503.61% while the benchmark SPY gained 126.55% over the same period. Over the previous week the market value of iM-Top5(QQQ)Select gained 8.33% at a time when SPY gained 3.84%. A starting capital of $100,000 at inception on 1/5/2016 would have grown to $603,610 which includes -$3,194 cash and excludes $9,109 spent on fees and slippage. |
|
|
iM-Top5(XLB)Select: Since inception, on 1/5/2016, the model gained 158.89% while the benchmark SPY gained 126.55% over the same period. Over the previous week the market value of iM-Top5(XLB)Select gained 3.11% at a time when SPY gained 3.84%. A starting capital of $100,000 at inception on 1/5/2016 would have grown to $258,894 which includes $1,036 cash and excludes $8,408 spent on fees and slippage. |
|
|
iM-Top5(XLI)Select: Since inception, on 1/5/2016, the model gained 272.28% while the benchmark SPY gained 126.55% over the same period. Over the previous week the market value of iM-Top5(XLI)Select gained 5.20% at a time when SPY gained 3.84%. A starting capital of $100,000 at inception on 1/5/2016 would have grown to $372,280 which includes $4,660 cash and excludes $5,117 spent on fees and slippage. |
|
|
iM-Top5(XLK)Select: Since inception, on 1/5/2016, the model gained 438.38% while the benchmark SPY gained 126.55% over the same period. Over the previous week the market value of iM-Top5(XLK)Select gained 2.89% at a time when SPY gained 3.84%. A starting capital of $100,000 at inception on 1/5/2016 would have grown to $538,376 which includes $1,985 cash and excludes $1,738 spent on fees and slippage. |
|
|
iM-Top5(XLP)Select: Since inception, on 1/5/2016, the model gained 189.83% while the benchmark SPY gained 126.55% over the same period. Over the previous week the market value of iM-Top5(XLP)Select gained 2.02% at a time when SPY gained 3.84%. A starting capital of $100,000 at inception on 1/5/2016 would have grown to $289,835 which includes $3,064 cash and excludes $1,550 spent on fees and slippage. |
|
|
iM-Top5(XLV)Select: Since inception, on 1/5/2016, the model gained 375.05% while the benchmark SPY gained 126.55% over the same period. Over the previous week the market value of iM-Top5(XLV)Select gained 2.91% at a time when SPY gained 3.84%. A starting capital of $100,000 at inception on 1/5/2016 would have grown to $475,054 which includes -$972 cash and excludes $7,616 spent on fees and slippage. |
|
|
iM-Top5(XLU)Select: Since inception, on 1/5/2016, the model gained 134.10% while the benchmark SPY gained 126.55% over the same period. Over the previous week the market value of iM-Top5(XLU)Select gained 5.82% at a time when SPY gained 3.84%. A starting capital of $100,000 at inception on 1/5/2016 would have grown to $234,098 which includes $534 cash and excludes $9,778 spent on fees and slippage. |
|
|
iM-Top5(XLY)Select: Since inception, on 1/5/2016, the model gained 161.64% while the benchmark SPY gained 126.55% over the same period. Over the previous week the market value of iM-Top5(XLY)Select gained 0.87% at a time when SPY gained 3.84%. A starting capital of $100,000 at inception on 1/5/2016 would have grown to $261,638 which includes $1,711 cash and excludes $4,762 spent on fees and slippage. |
|
|
iM-Seasonal Super-Sectors (Top5 combo) : Since inception, on 11/17/2020, the model gained 26.51% while the benchmark SPY gained 17.60% over the same period. Over the previous week the market value of iM-Seasonal Super-Sectors (Top5 combo) gained 4.73% at a time when SPY gained 3.84%. A starting capital of $100,000 at inception on 11/17/2020 would have grown to $126,512 which includes $79 cash and excludes $00 spent on fees and slippage. |
|
|
iM-Dividend Growth Portfolio: The model’s out of sample performance YTD is -8.2%, and for the last 12 months is -7.7%. Over the same period the benchmark SPY performance was -12.9% and -5.0% respectively. Over the previous week the market value of the iM-Dividend Growth Portfolio gained 2.14% at a time when SPY gained 3.84%. A starting capital of $100,000 at inception on 6/30/2016 would have grown to $369,463 which includes $1,383 cash and excludes $8,399 spent on fees and slippage. |
|
|
iM-Gold Momentum Timer (AU, NEM, SBSW): The model’s out of sample performance YTD is -32.8%, and for the last 12 months is -32.2%. Over the same period the benchmark SPY performance was -12.9% and -5.0% respectively. Over the previous week the market value of iM-Gold Momentum Timer (AU, NEM, SBSW) gained 0.73% at a time when SPY gained 3.84%. A starting capital of $100,000 at inception on 6/30/2016 would have grown to $2,320 which includes $107,745 cash and excludes Gain to date spent on fees and slippage. |
|
|
iM-ModSum/YieldCurve Timer: The model’s out of sample performance YTD is -11.2%, and for the last 12 months is -12.8%. Over the same period the benchmark SPY performance was -12.9% and -5.0% respectively. Over the previous week the market value of iM-PortSum/YieldCurve Timer gained 3.85% at a time when SPY gained 3.84%. A starting capital of $100,000 at inception on 1/1/2016 would have grown to $261,129 which includes -$531 cash and excludes $1,114 spent on fees and slippage. |
|
|
iM-Best(SPY-SH).R1: The model’s out of sample performance YTD is -21.8%, and for the last 12 months is -14.8%. Over the same period the benchmark SPY performance was -12.9% and -5.0% respectively. Over the previous week the market value of Best(SPY-SH) gained 3.80% at a time when SPY gained 3.84%. A starting capital of $100,000 at inception on 1/2/2009 would have grown to $69,389 which includes $790 cash and excludes $2,304 spent on fees and slippage. |
|
|
iM-Combo3.R1: The model’s out of sample performance YTD is -11.0%, and for the last 12 months is -2.9%. Over the same period the benchmark SPY performance was -12.9% and -5.0% respectively. Over the previous week the market value of iM-Combo3.R1 gained 5.15% at a time when SPY gained 3.84%. A starting capital of $100,000 at inception on 2/3/2014 would have grown to $187,301 which includes $328 cash and excludes $7,956 spent on fees and slippage. |
|
|
iM-Combo5: The model’s out of sample performance YTD is -25.2%, and for the last 12 months is -18.9%. Over the same period the benchmark SPY performance was -12.9% and -5.0% respectively. Over the previous week the market value of iM-Combo5 gained 4.21% at a time when SPY gained 3.84%. A starting capital of $100,000 at inception on 2/22/2016 would have grown to $169,979 which includes $1,382 cash and excludes $0 spent on fees and slippage. |
|
|
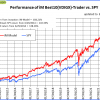
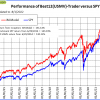
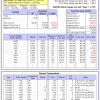
iM-Best10(VDIGX)-Trader: The model’s out of sample performance YTD is -11.3%, and for the last 12 months is -6.7%. Over the same period the benchmark SPY performance was -12.9% and -5.0% respectively. Since inception, on 7/1/2014, the model gained 184.21% while the benchmark SPY gained 143.19% and VDIGX gained 138.16% over the same period. Over the previous week the market value of iM-Best10(VDIGX) gained 2.92% at a time when SPY gained 3.84%. A starting capital of $100,000 at inception on 7/1/2014 would have grown to $284,207 which includes $724 cash and excludes $4,356 spent on fees and slippage. |
|
|
iM 6-Stock Capital Strength Portfolio: The model’s out of sample performance YTD is -2.2%, and for the last 12 months is -1.7%. Over the same period the benchmark SPY performance was -12.9% and -5.0% respectively. Over the previous week the market value of the iM 6-Stock Capital Strength Portfolio gained -0.29% at a time when SPY gained 3.84%. A starting capital of $100,000 at inception on 10/28/2016 would have grown to $212,653 which includes $772 cash and excludes $2,452 spent on fees and slippage. |
|
|
iM-Best12(USMV)-Trader: The model’s out of sample performance YTD is -4.3%, and for the last 12 months is -2.0%. Over the same period the benchmark SPY performance was -12.9% and -5.0% respectively. Since inception, on 6/30/2014, the model gained 151.14% while the benchmark SPY gained 143.19% and the ETF USMV gained 130.12% over the same period. Over the previous week the market value of iM-Best12(USMV)-Trader gained 0.41% at a time when SPY gained 3.84%. A starting capital of $100,000 at inception on 6/30/2014 would have grown to $251,143 which includes $793 cash and excludes $7,579 spent on fees and slippage. |
|
|
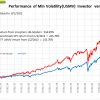
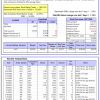
iM-Min Volatility(USMV) Investor (Tax Efficient): The model’s out of sample performance YTD is 10.5%, and for the last 12 months is 13.7%. Over the same period the benchmark SPY performance was -12.9% and -5.0% respectively. Since inception, on 1/3/2013, the model gained 534.99% while the benchmark SPY gained 235.70% and the ETF USMV gained 235.70% over the same period. Over the previous week the market value of iM-Best12(USMV)Q1 gained 2.72% at a time when SPY gained 3.84%. A starting capital of $100,000 at inception on 1/3/2013 would have grown to $634,992 which includes $2,989 cash and excludes $6,594 spent on fees and slippage. |
|
|
iM-Bond Market Trader (High-Yield Bond or 10-yr Treasury Bond): The model’s out of sample performance YTD is -7.8%, and for the last 12 months is -9.5%. Over the same period the benchmark BND performance was -7.8% and -9.0% respectively. Over the previous week the market value of the iM-Bond Market Trader (High-Yield Bond or 10-yr Treasury Bond) gained 1.74% at a time when BND gained 1.36%. A starting capital of $10,000 at inception on 1/3/2000 would have grown to $140,084 which includes $1,093 cash and excludes $2,379 spent on fees and slippage. |
|
|
iM-ModSum/YieldCurve Timer: The model’s out of sample performance YTD is -11.2%, and for the last 12 months is -12.8%. Over the same period the benchmark SPY performance was -12.9% and -5.0% respectively. Over the previous week the market value of iM-PortSum/YieldCurve Timer gained 3.85% at a time when SPY gained 3.84%. A starting capital of $100,000 at inception on 1/1/2016 would have grown to $261,129 which includes -$531 cash and excludes $1,114 spent on fees and slippage. |
|
|
iM-Best2 MC-Score ETF System: The model’s out of sample performance YTD is -4.7%, and for the last 12 months is 2.8%. Over the same period the benchmark SPY performance was -12.9% and -5.0% respectively. Over the previous week the market value of the iM-Best2 MC-Score ETF System gained 2.58% at a time when SPY gained 3.84%. A starting capital of $100,000 at inception on 6/30/2016 would have grown to $148,372 which includes $1,074 cash and excludes $1,394 spent on fees and slippage. |
|
|
iM-Best4 MC-Score Vanguard System: The model’s out of sample performance YTD is -5.6%, and for the last 12 months is 3.0%. Over the same period the benchmark SPY performance was -12.9% and -5.0% respectively. Over the previous week the market value of the iM-Best4 MC-Score Vanguard System gained 3.51% at a time when SPY gained 3.84%. A starting capital of $100,000 at inception on 6/30/2016 would have grown to $159,035 which includes $1,626 cash and excludes $00 spent on fees and slippage. |
|
|
iM-Composite (SPY-IEF) Timer: The model’s out of sample performance YTD is -7.7%, and for the last 12 months is 0.5%. Over the same period the benchmark SPY performance was -12.9% and -5.0% respectively. Over the previous week the market value of the iM-Composite (SPY-IEF) Timer gained 3.86% at a time when SPY gained 3.84%. A starting capital of $100,000 at inception on 6/30/2016 would have grown to $185,794 which includes -$696 cash and excludes $4,688 spent on fees and slippage. |
|
|
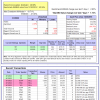
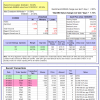
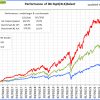
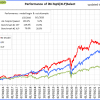
iM-Composite(Gold-Stocks-Bond) Timer: The model’s out of sample performance YTD is -4.9%, and for the last 12 months is -1.2%. Over the same period the benchmark SPY performance was -12.9% and -5.0% respectively. Over the previous week the market value of the iM-Composite(Gold-Stocks-Bond) Timer gained 3.00% at a time when SPY gained 3.84%. A starting capital of $100,000 at inception on 6/30/2016 would have grown to $169,767 which includes $93 cash and excludes $8,561 spent on fees and slippage. |


Leave a Reply
You must be logged in to post a comment.