Stock-market:
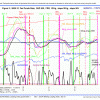 ECRI reported the WLI at a level of 125.7 and the six months smoothed annualized growth WLIg at +3.8%, as shown in Fig 2, almost identical to our shadow WLI. Last week the IBH model generated a sell-basic signal and 2 days later a sell A signal, indicating that the model had exited the S&P500. For those who are new to the IBH model, sell-basic is a warning signal to get ready to sell, it is not a sell signal, and it can be voided when a subsequent buy signal appears, before a sell A or sell B signal. Sell C does not need a sell-basic signal
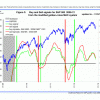 MAC Fig 3 shows the spreads of the moving averages which have declined further from last week. No sell signal has so far been generated from this model. The model stays invested
Bond-market:
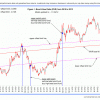 The Bond Value Ratio is shown in Fig 1. The BVR is a bit lower than where it was last week, and the trend seems to be lower. In the longer term BVR will reach the long-term trendline and long-bond investors will have suffered considerable losses by then. The model stays invested in low beta bonds.
The Yield Curve:
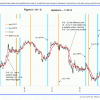 Figure 5 charts (i10 – i2). The trend is neither up or down, but the model expects the yield curve to steepen. FLAT and STPP are ETNs. STPP profits from a steepening yield curve and FLAT increases in value when the yield curve flattens.
The Elusive Recession of 2012:
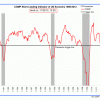 Attached also my composite recession indicator COMP. This indicator appears to be rolling over. No recession from 1969 onwards has ever started when this indicator was at the present level. The slope was always downwards and the level was zero or lower when any of the last 7 recessions began. Should this indicator go below zero then it is highly advisable to liquidate all stock market positions and wait for a buy signal from the IBH model.
