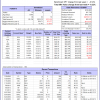
 Currently the portfolio holds 10 stocks, 5 of them winners, so far held for an average period of 66 days, and showing combined 1.56% average return to 7/29/2013
A starting capital of $100,000 at inception of 1/2/2009 would have grown to $594,511 which includes $727 cash and excludes $35,701 spent on fees and slippage.
The Best10(S&P 1500) model’s number of seats at R2G were limited to 20 to avoid affecting the actual stock prices when the trading signal are issued, all seats are subscribed.
NOTE: The P123 simulation algorithm was changed this week. The change is the way the stock, when buying, is balanced to available capital. Consequently, when comparing this week’s update to last weeks update you will notice small changes in stock quantity, but not stock selection, of the stimulated portfolio.
| Best10(S&P 1500) | Weekly Change | ||
| Date | Mkt. Value | Best10 | SPY |
| 08/25/14 | $839,128 | 1.85% | 1.44% |
| 08/18/14 | $823,895 | 3.28% | 1.84% |
| 08/11/14 | $797,730 | -0.34% | -0.05% |
| 08/04/14 | $800,486 | 0.05% | -1.97% |
| 07/28/14 | $800,060 | 1.91% | 0.23% |
| 07/21/14 | $785,076 | -0.43 | -0.13 |
| 07/14/14 | $788,459 | -1.78% | 0.05% |
| 07/07/14 | $802,720 | 1.77% | 0.91% |
| 06/30/14 | $788,788 | 0.68% | -0.08% |
| 06/23/14 | $783,482 | 1.41% | 1.30% |
| 06/16/14 | $772,592 | -0.61% | -0.66% |
| 06/10/14 | $777,303 | 2.26% | 1.39% |
| 06/02/14 | $760,145 | -0.23% | 0.72% |
| 05/27/14 | $761,893 | 2.71% | 1.47% |
| 05/19/14 | $741,812 | -0.77% | -0.55% |
| 05/12/14 | $747,572 | -0.09% | 0.73% |
| 05/05/14 | $748,216 | 0.41% | 0.82% |
| 04/28/14 | $745,146 | -0.53% | -0.08% |
| 04/21/14 | $749,109 | 2.93% | 2.24% |
| 04/14/14 | $727,790 | -1.33% | -0.76% |
| 04/07/14 | $737,610 | -2.32% | -1.43% |
| 03/31/14 | $755,107 | 1.40% | 0.85% |
| 03/24/14 | $744,712 | -0.15% | -0.04 |
| 03/17/14 | $745,830 | -0.92% | -0.97% |
| 03/10/14 | $752,747 | 1.42% | 1.72% |
| 03/03/14 | $742,164 | 0.68% | 0.04% |
| 02/24/14 | $737,186 | 0.14% | 0.36% |
| 02/18/14 | $736,126 | 2.99% | 2.35% |
| 02/10/14 | $714,757 | 2.31% | 3.35% |
| 02/03/14 | $698,639 | -2.60% | -2.16% |
| 01/27/14 | $717,288 | -3.83% | -3.35% |
| 01/21/14 | $745,878 | 1.10% | 1.37% |
| 01/13/14 | $737,765 | 0.86% | -0.37% |
| 01/06/14 | $731,483 | -0.49% | -0.79% |
| 12/30/13 | $735,108 | 3.12% | 0.71% |
| 12/23/13 | $712,843 | 2.75% | 2.40% |
| 12/16/13 | $693,781 | -0.46% | -1.21% |
| 12/09/13 | $697,019 | 0.08% | 0.48% |
| 12/02/13 | $696,480 | 0.43% | -0.06% |
| 11/25/13 | $693,493 | 0.38% | 0.67% |
| 11/18/13 | $690,839 | 2.54% | 1.19% |
| 11/11/13 | $673,755 | 3.13% | 0.28% |
| 11/04/13 | $653,289 | 3.84% | 0.34% |
| 10/28/13 | $629,132 | -0.31% | 1.05% |
| 10/21/13 | $631,108 | 1.50% | 2.02% |
| 10/14/13 | $621,752 | 2.60% | 2.10% |
| 10/07/13 | $606,001 | -0.29% | -0.35% |
| 09/30/13 | $607,761 | -0.72% | -1.13% |
| 09/23/17 | $612,195 | -0.58% | -0.18% |
| 09/17/13 | $615,742 | 0.45% | 2.05% |
| 09/09/13 | $612,992 | 3.09% | 1.97% |
| 09/03/13 | $583,574 | -2.53% | -0.97% |
| 08/26/13 | $598,698 | 1.20% | 0.74% |
| 08/19/13 | $591,625 | -3.59% | -2.57% |
| 08/12/13 | $613,680 | -0.16% | -0.93% |
| 08/05/13 | $614,653 | 3.39% | 1.25% |
| 07/29/13 | $594,511 | -0.22% | -0.54% |
| New Algorithm at P123 (see note on 7-29-13) | |||
| 07/22/13 | $618,264 | -0.63% | 0.80% |
| 07/15/13 | $622,406 | 4.47% | 2.57% |
| 07/08/13 | $595,782 | Start of Live Trading | |
| 01/02/09 | $100,000 | Best10 Inception | |

Leave a Reply
You must be logged in to post a comment.