  |
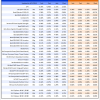
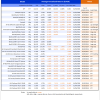
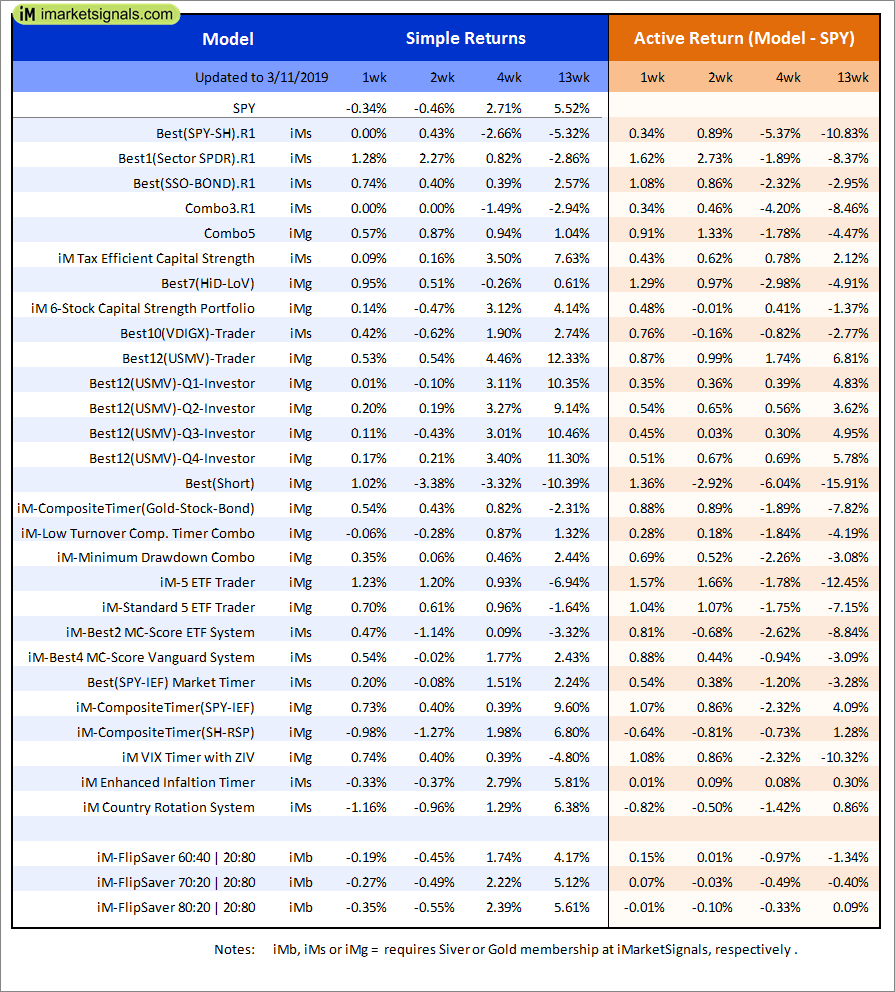
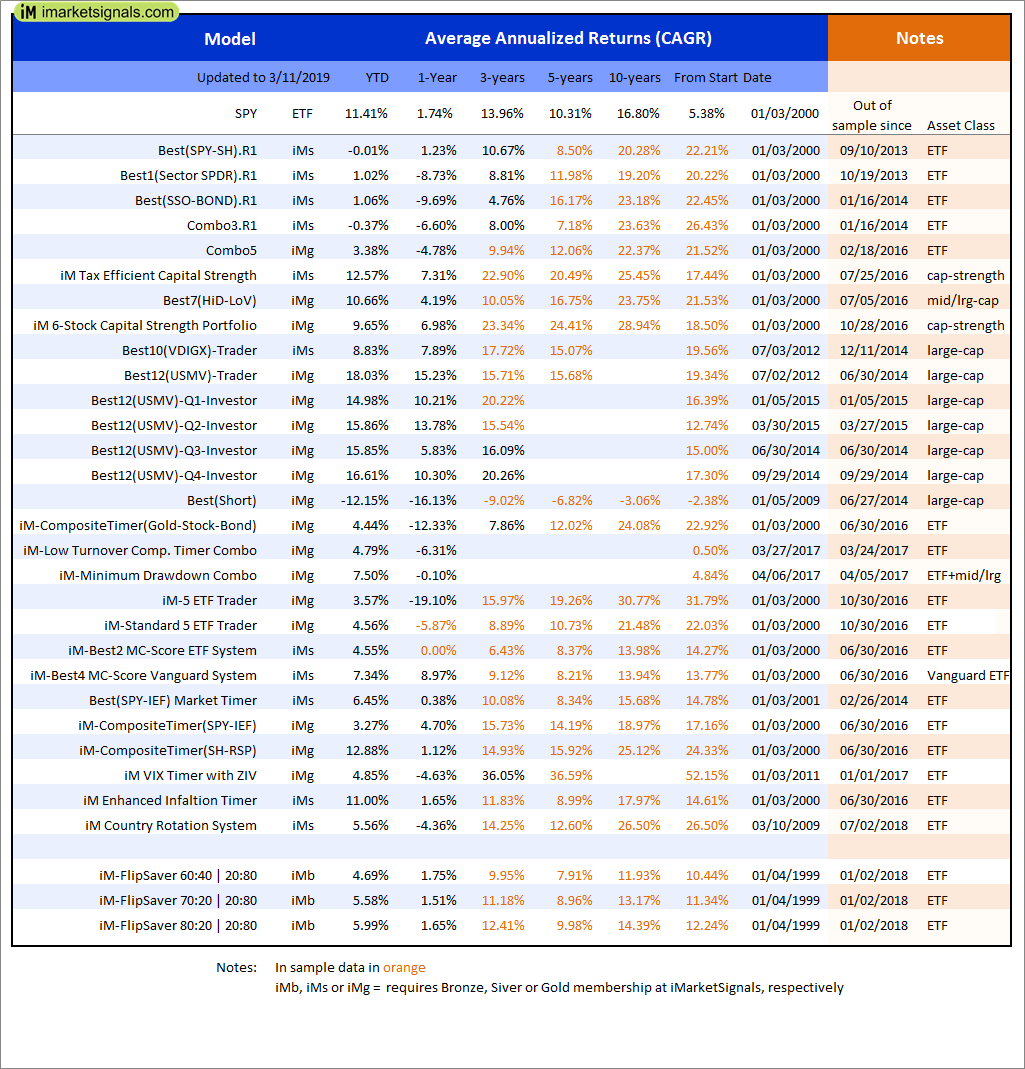
Out of sample performance summary of our models for the past 1, 2, 4 and 13 week periods. The active active return indicates how the models over- or underperformed the benchmark ETF SPY. Also the YTD, and the 1-, 3-, 5- and 10-year annualized returns are shown in the second table |
|
|
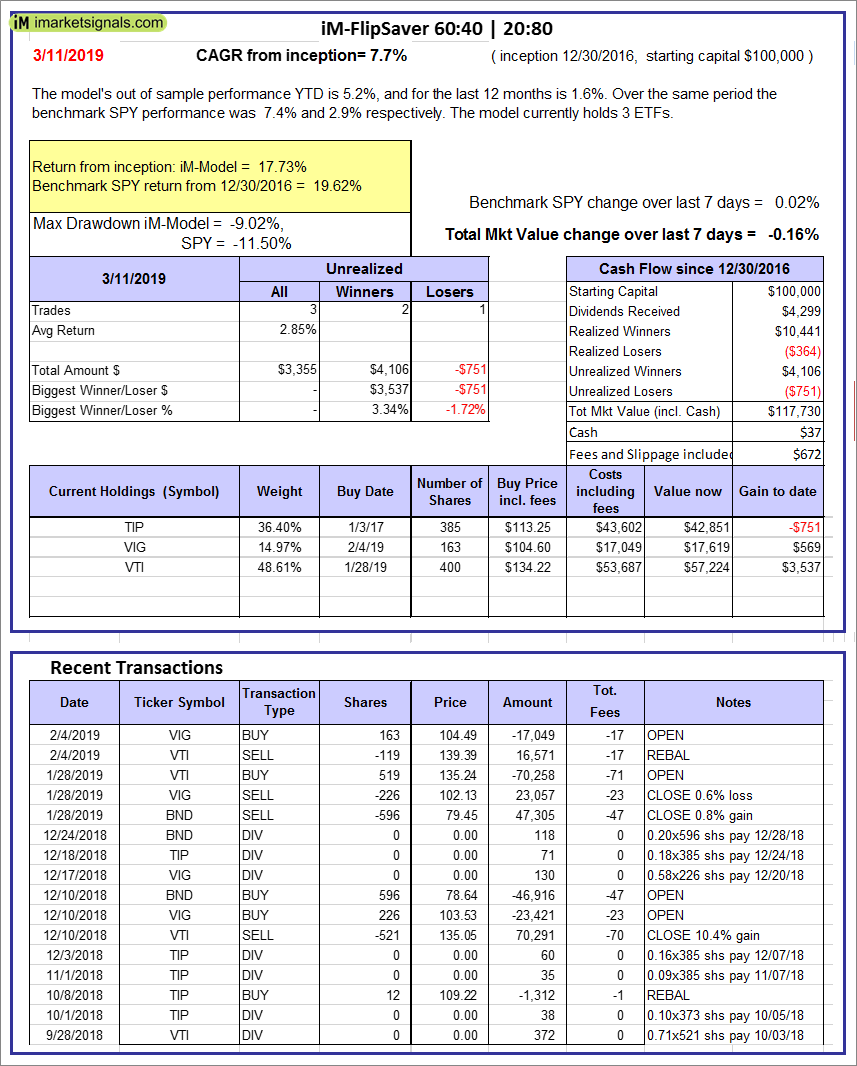
iM-FlipSaver 60:40 | 20:80 – 2017: The model’s out of sample performance YTD is 5.2%, and for the last 12 months is 1.6%. Over the same period the benchmark SPY performance was 7.4% and 2.9% respectively. Over the previous week the market value of iM-FlipSaver 80:20 | 20:80 gained -0.16% at a time when SPY gained 0.02%. A starting capital of $100,000 at inception on 7/16/2015 would have grown to $117,730 which includes $37 cash and excludes $672 spent on fees and slippage. |
|
|
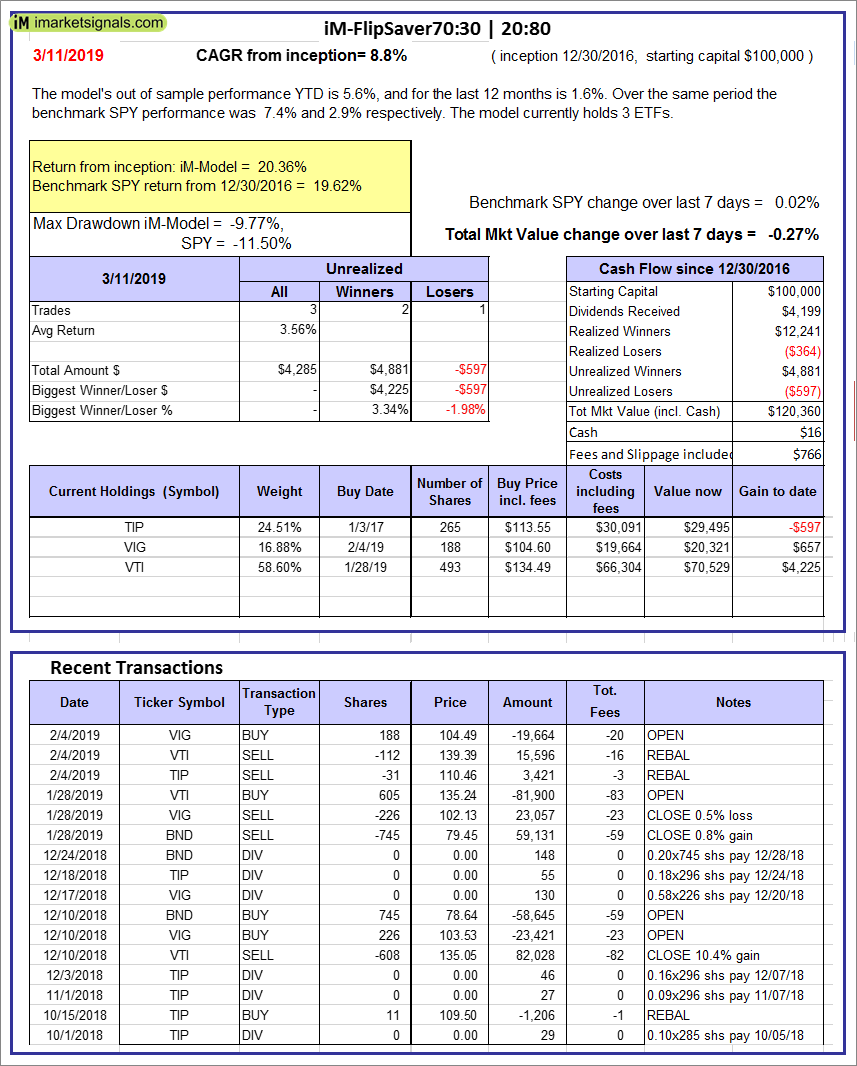
iM-FlipSaver 70:30 | 20:80 – 2017: The model’s out of sample performance YTD is 5.6%, and for the last 12 months is 1.6%. Over the same period the benchmark SPY performance was 7.4% and 2.9% respectively. Over the previous week the market value of iM-FlipSaver 70:30 | 20:80 gained -0.27% at a time when SPY gained 0.02%. A starting capital of $100,000 at inception on 7/15/2015 would have grown to $120,360 which includes $16 cash and excludes $766 spent on fees and slippage. |
|
|
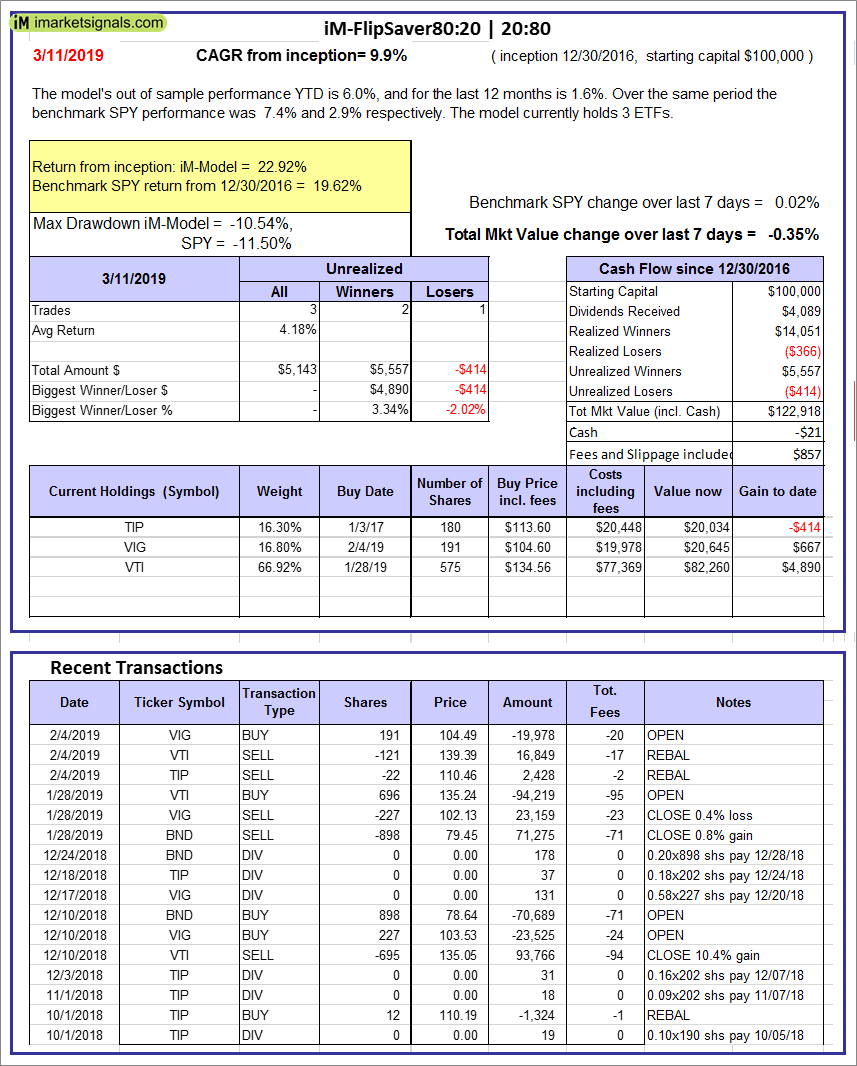
iM-FlipSaver 80:20 | 20:80 – 2017: The model’s out of sample performance YTD is 6.0%, and for the last 12 months is 1.6%. Over the same period the benchmark SPY performance was 7.4% and 2.9% respectively. Over the previous week the market value of iM-FlipSaver 80:20 | 20:80 gained -0.35% at a time when SPY gained 0.02%. A starting capital of $100,000 at inception on 1/2/2017 would have grown to $122,918 which includes -$21 cash and excludes $857 spent on fees and slippage. |
|
|
iM-Best(SPY-SH).R1: The model’s out of sample performance YTD is -0.1%, and for the last 12 months is 1.7%. Over the same period the benchmark SPY performance was 11.4% and 1.7% respectively. Over the previous week the market value of Best(SPY-SH) gained 0.73% at a time when SPY gained -0.34%. A starting capital of $100,000 at inception on 1/2/2009 would have grown to $600,561 which includes -$13,956 cash and excludes $22,629 spent on fees and slippage. |
|
|
iM-Combo3.R1: The model’s out of sample performance YTD is 0.6%, and for the last 12 months is -5.5%. Over the same period the benchmark SPY performance was 11.4% and 1.7% respectively. Over the previous week the market value of iM-Combo3.R1 gained 0.92% at a time when SPY gained -0.34%. A starting capital of $100,000 at inception on 2/3/2014 would have grown to $156,050 which includes -$1,496 cash and excludes $5,077 spent on fees and slippage. |
|
|
iM-Combo5: The model’s out of sample performance YTD is 3.2%, and for the last 12 months is -4.8%. Over the same period the benchmark SPY performance was 11.4% and 1.7% respectively. Over the previous week the market value of iM-Combo5 gained 0.53% at a time when SPY gained -0.34%. A starting capital of $100,000 at inception on 2/22/2016 would have grown to $131,336 which includes $266 cash and excludes $0 spent on fees and slippage. |
|
|
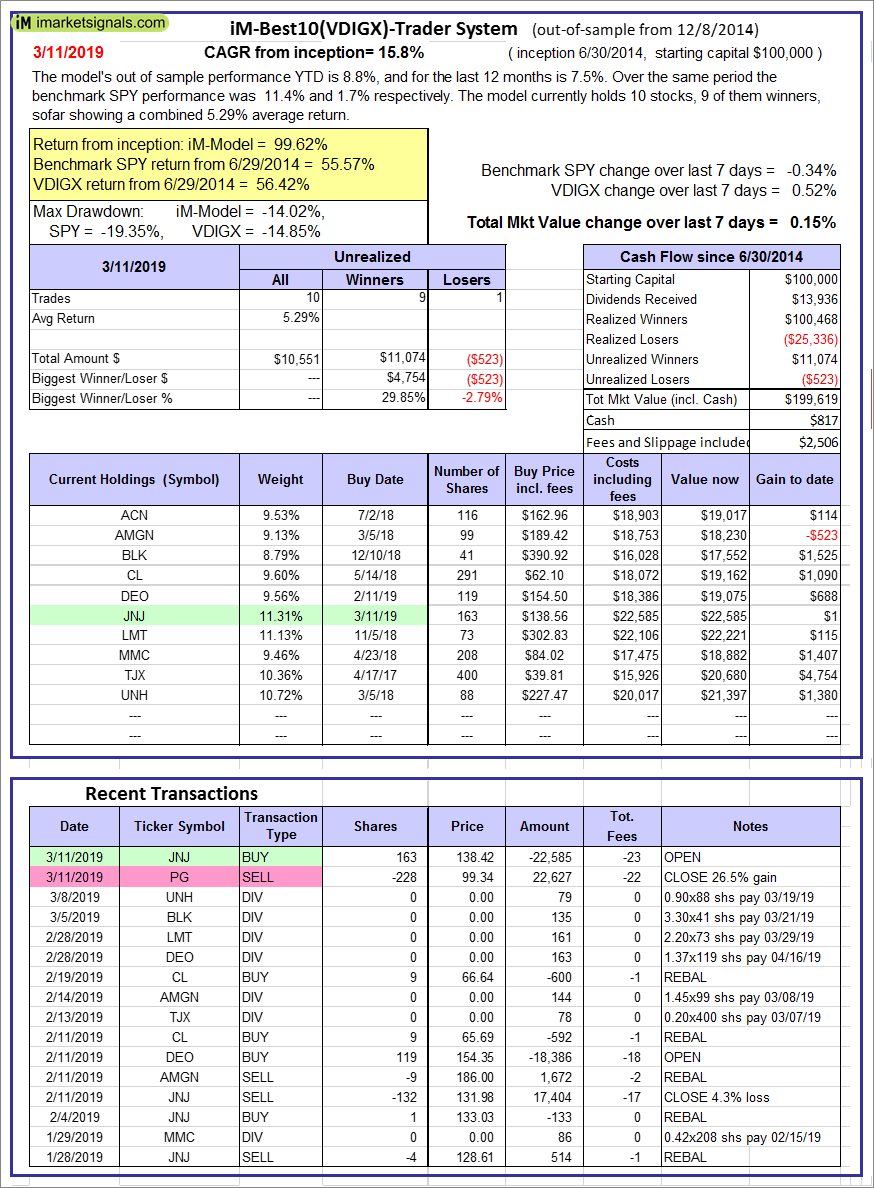
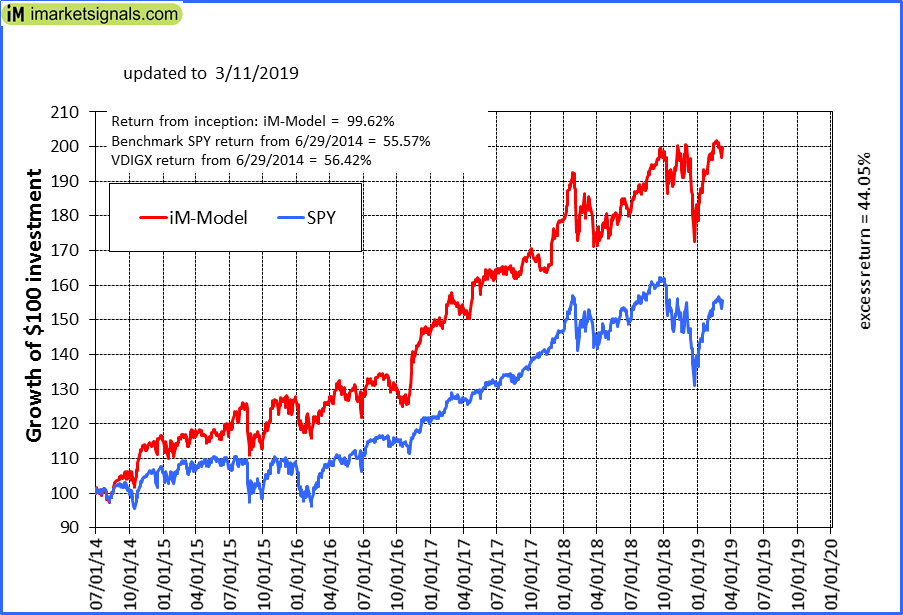
iM-Best10(VDIGX)-Trader: The model’s out of sample performance YTD is 8.8%, and for the last 12 months is 7.5%. Over the same period the benchmark SPY performance was 11.4% and 1.7% respectively. Since inception, on 7/1/2014, the model gained 99.62% while the benchmark SPY gained 55.57% and VDIGX gained 56.42% over the same period. Over the previous week the market value of iM-Best10(VDIGX) gained 0.15% at a time when SPY gained -0.34%. A starting capital of $100,000 at inception on 7/1/2014 would have grown to $199,619 which includes $817 cash and excludes $2,506 spent on fees and slippage. |
|
|
iM-Best7(HiD-LoV): The model’s out of sample performance YTD is 10.2%, and for the last 12 months is 3.9%. Over the same period the benchmark SPY performance was 11.4% and 1.7% respectively. Over the previous week the market value of iM-BESTOGA-3 gained 0.55% at a time when SPY gained -0.34%. A starting capital of $100,000 at inception on 6/30/2016 would have grown to $120,445 which includes $16,959 cash and excludes $2,851 spent on fees and slippage. |
|
|
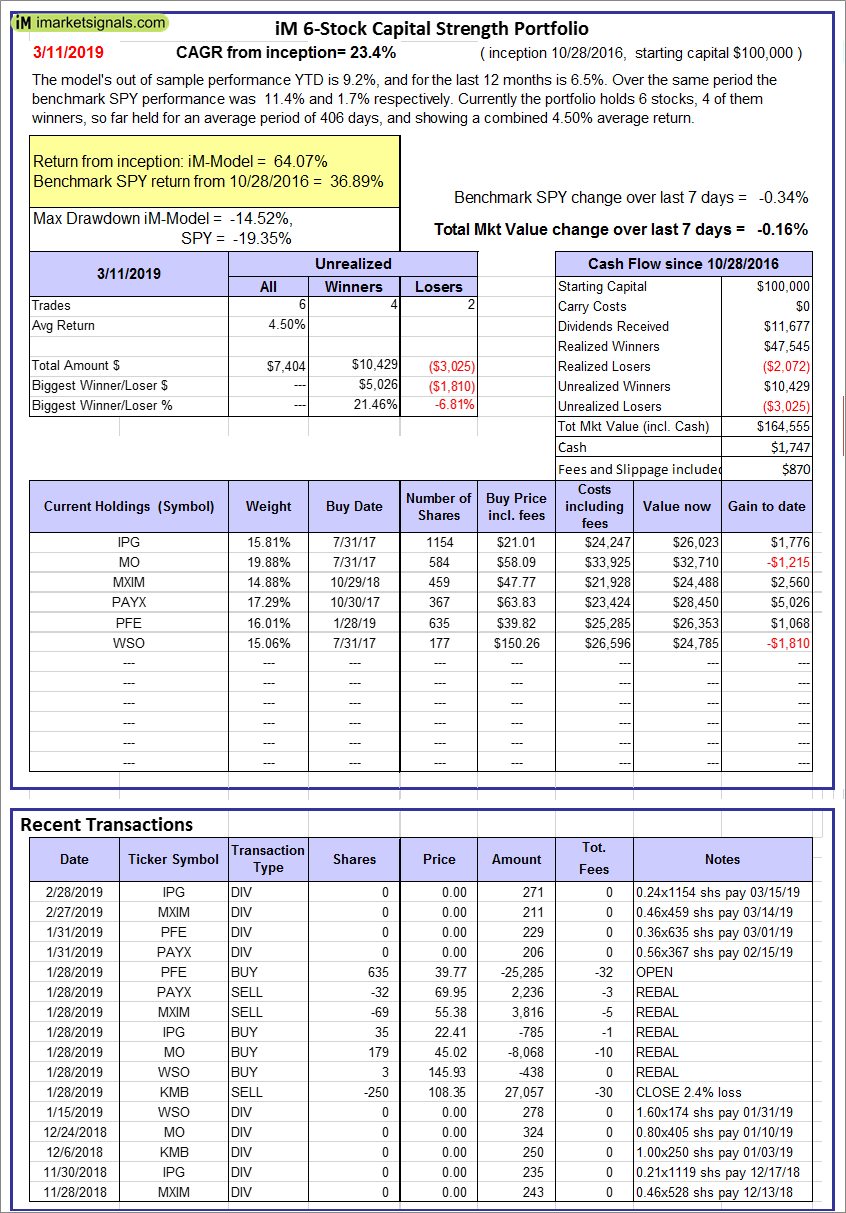
iM 6-Stock Capital Strength Portfolio: The model’s out of sample performance YTD is 9.2%, and for the last 12 months is 6.5%. Over the same period the benchmark SPY performance was 11.4% and 1.7% respectively. Over the previous week the market value of the iM 6-Stock Capital Strength Portfolio gained -0.16% at a time when SPY gained -0.34%. A starting capital of $100,000 at inception on 10/28/2016 would have grown to $164,555 which includes $1,747 cash and excludes $870 spent on fees and slippage. |
|
|
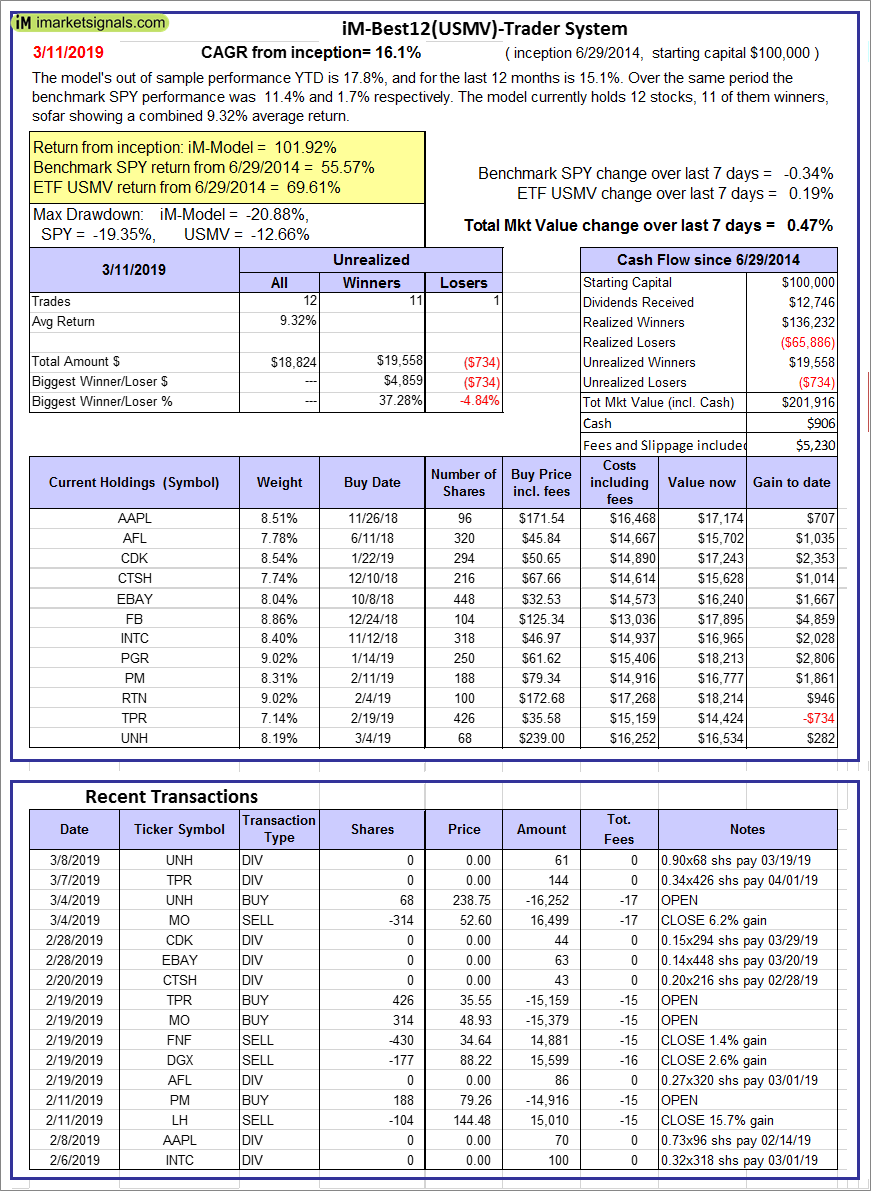
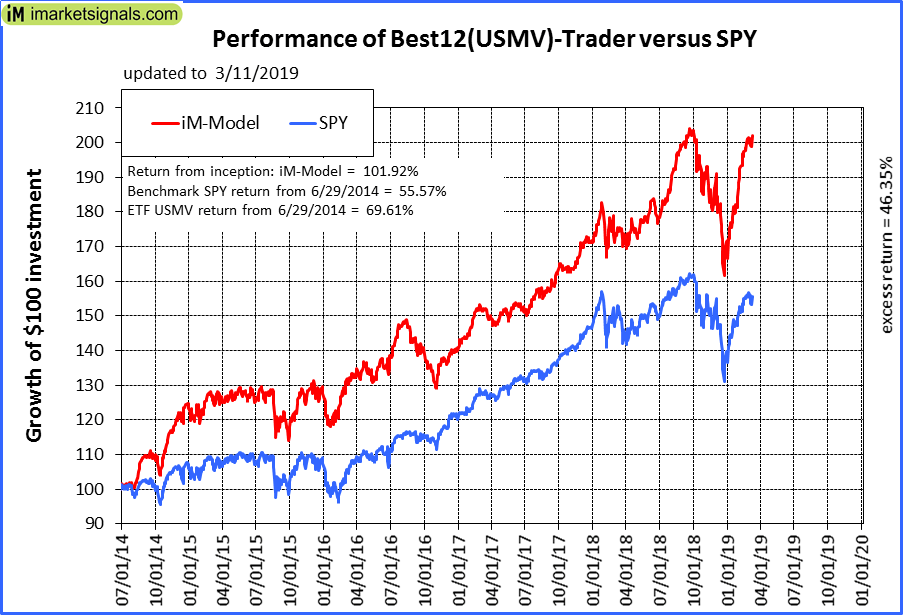
iM-Best12(USMV)-Trader: The model’s out of sample performance YTD is 17.8%, and for the last 12 months is 15.1%. Over the same period the benchmark SPY performance was 11.4% and 1.7% respectively. Since inception, on 6/30/2014, the model gained 101.92% while the benchmark SPY gained 55.57% and the ETF USMV gained 69.61% over the same period. Over the previous week the market value of iM-Best12(USMV)-Trader gained 0.47% at a time when SPY gained -0.34%. A starting capital of $100,000 at inception on 6/30/2014 would have grown to $201,916 which includes $906 cash and excludes $5,230 spent on fees and slippage. |
|
|
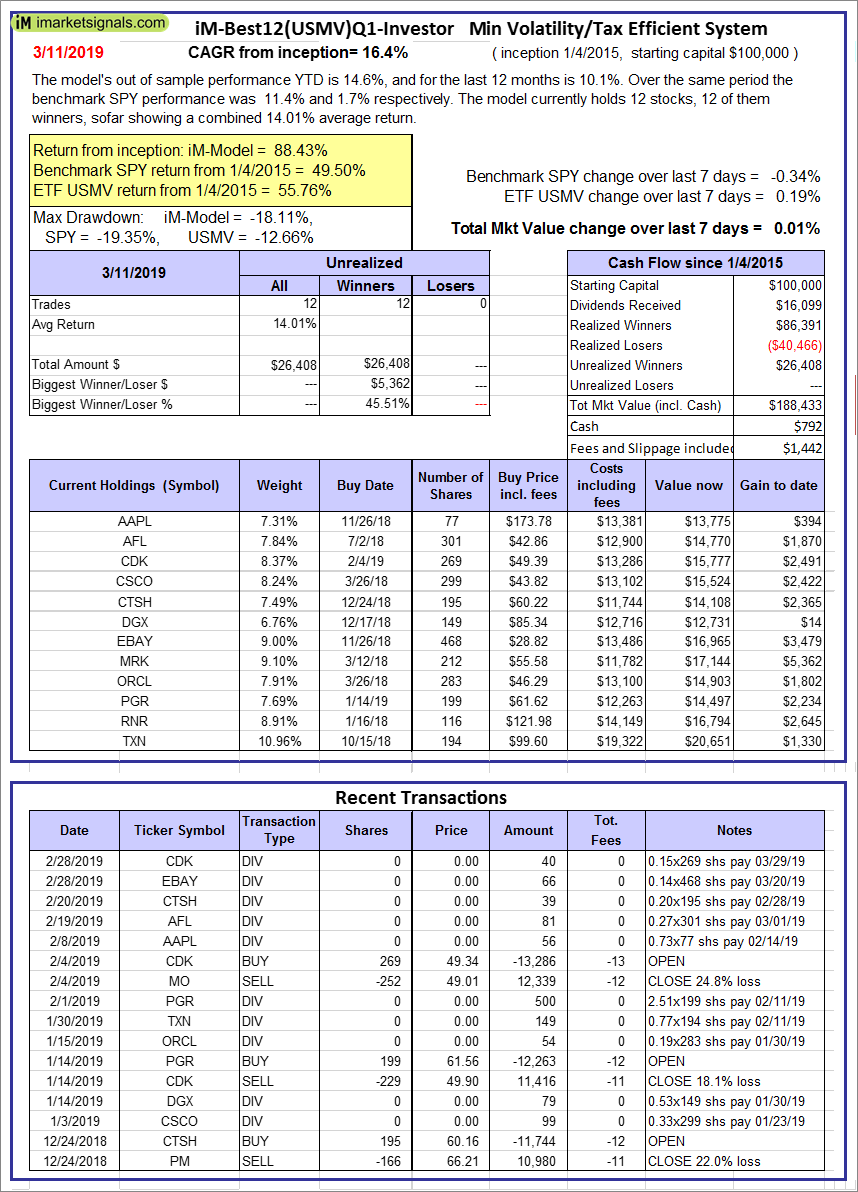
iM-Best12(USMV)Q1-Investor: The model’s out of sample performance YTD is 14.6%, and for the last 12 months is 10.1%. Over the same period the benchmark SPY performance was 11.4% and 1.7% respectively. Since inception, on 1/5/2015, the model gained 88.43% while the benchmark SPY gained 49.50% and the ETF USMV gained 55.76% over the same period. Over the previous week the market value of iM-Best12(USMV)Q1 gained 0.01% at a time when SPY gained -0.34%. A starting capital of $100,000 at inception on 1/5/2015 would have grown to $188,433 which includes $792 cash and excludes $1,442 spent on fees and slippage. |
|
|
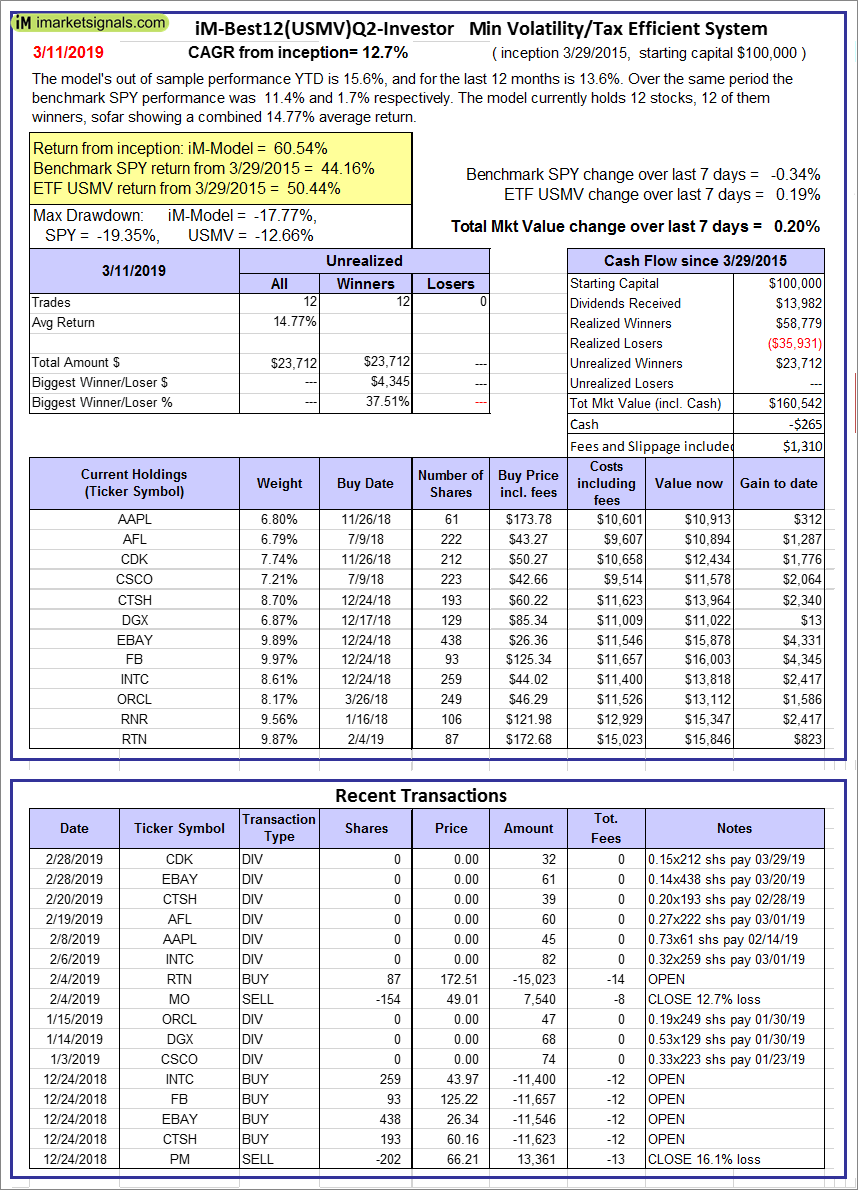
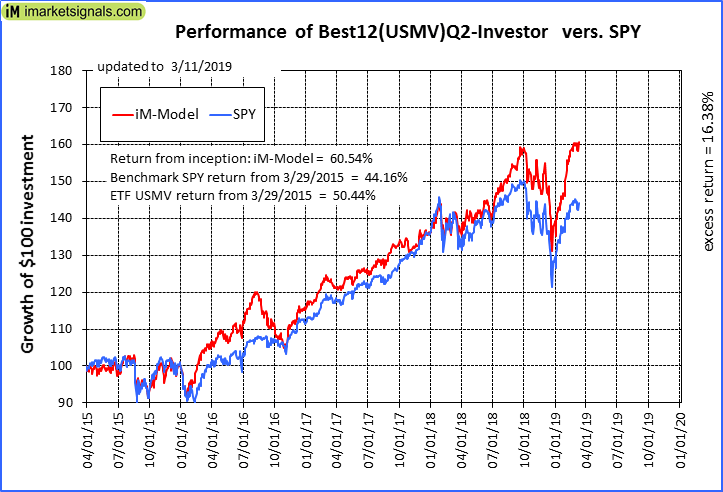
iM-Best12(USMV)Q2-Investor: The model’s out of sample performance YTD is 15.6%, and for the last 12 months is 13.6%. Over the same period the benchmark SPY performance was 11.4% and 1.7% respectively. Since inception, on 3/30/2015, the model gained 60.54% while the benchmark SPY gained 44.16% and the ETF USMV gained 50.44% over the same period. Over the previous week the market value of iM-Best12(USMV)Q2 gained 0.20% at a time when SPY gained -0.34%. A starting capital of $100,000 at inception on 3/30/2015 would have grown to $160,542 which includes -$265 cash and excludes $1,310 spent on fees and slippage. |
|
|
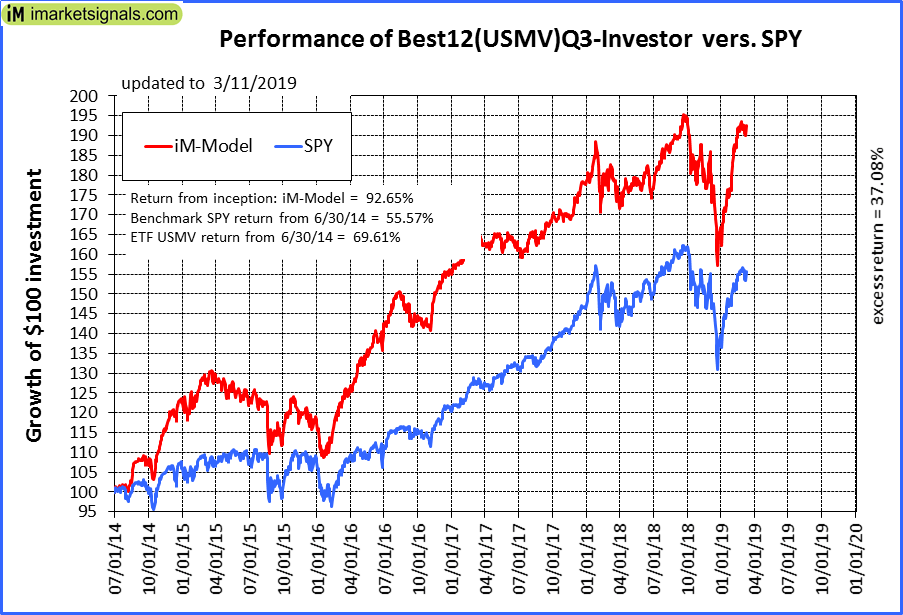
iM-Best12(USMV)Q3-Investor: The model’s out of sample performance YTD is 15.6%, and for the last 12 months is 5.7%. Over the same period the benchmark SPY performance was 11.4% and 1.7% respectively. Since inception, on 7/1/2014, the model gained 92.65% while the benchmark SPY gained 55.57% and the ETF USMV gained 69.61% over the same period. Over the previous week the market value of iM-Best12(USMV)Q3 gained 0.11% at a time when SPY gained -0.34%. A starting capital of $100,000 at inception on 7/1/2014 would have grown to $192,653 which includes $89 cash and excludes $1,917 spent on fees and slippage. |
|
|
iM-Best12(USMV)Q4-Investor: Since inception, on 9/29/2014, the model gained 103.18% while the benchmark SPY gained 53.22% and the ETF USMV gained 67.27% over the same period. Over the previous week the market value of iM-Best12(USMV)Q4 gained 0.11% at a time when SPY gained -0.34%. A starting capital of $100,000 at inception on 9/29/2014 would have grown to $203,183 which includes $150 cash and excludes $1,723 spent on fees and slippage. |
|
|
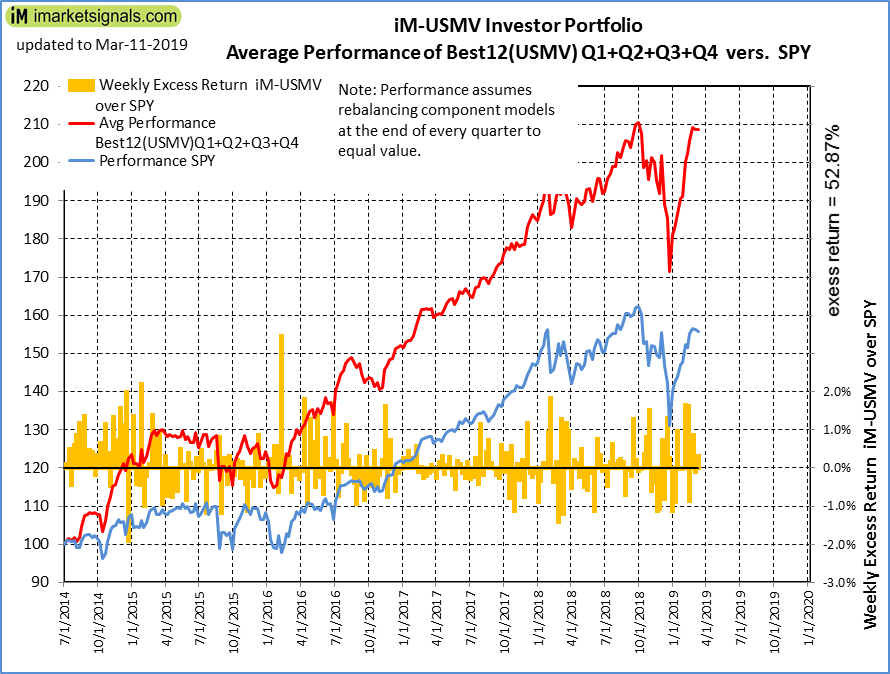
Average Performance of iM-Best12(USMV)Q1+Q2+Q3+Q4-Investor resulted in an excess return of 52.87% over SPY. (see iM-USMV Investor Portfolio) |
|
|
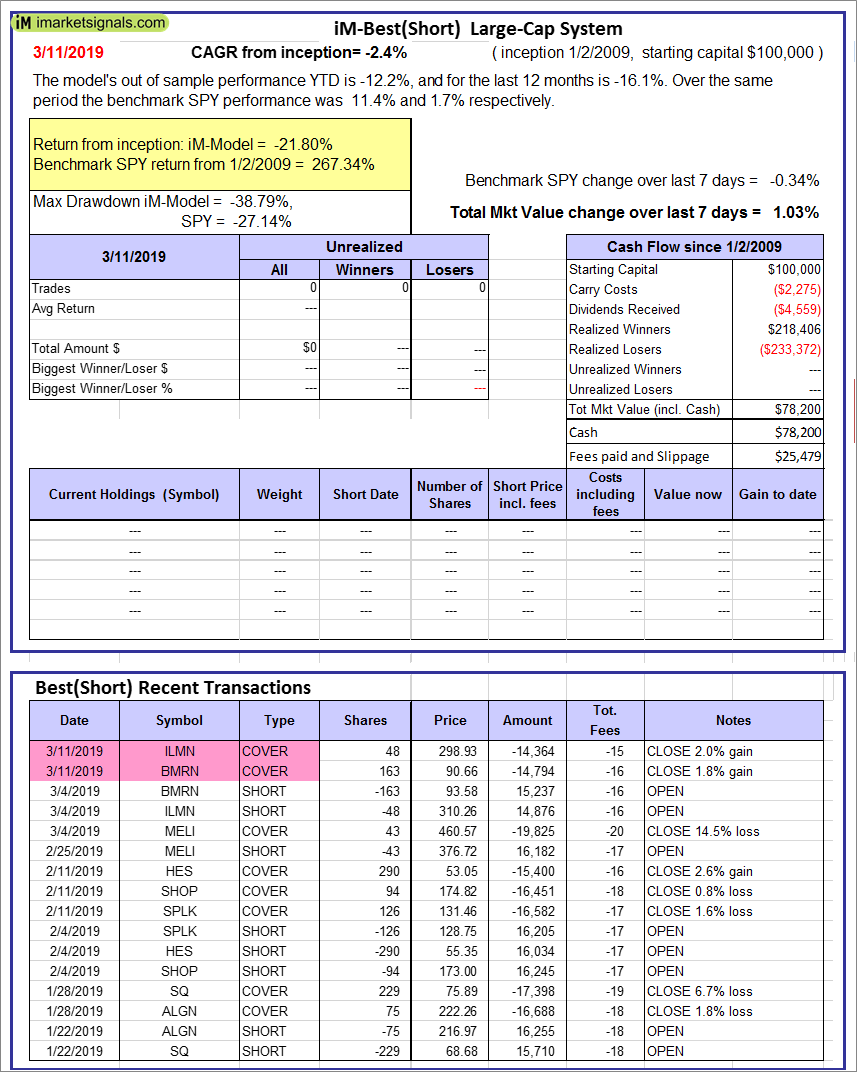
iM-Best(Short): The model’s out of sample performance YTD is -12.2%, and for the last 12 months is -16.1%. Over the same period the benchmark SPY performance was 11.4% and 1.7% respectively. Over the previous week the market value of iM-Best(Short) gained 1.03% at a time when SPY gained -0.34%. Over the period 1/2/2009 to 3/11/2019 the starting capital of $100,000 would have grown to $78,200 which includes $78,200 cash and excludes $25,479 spent on fees and slippage. |
|
|
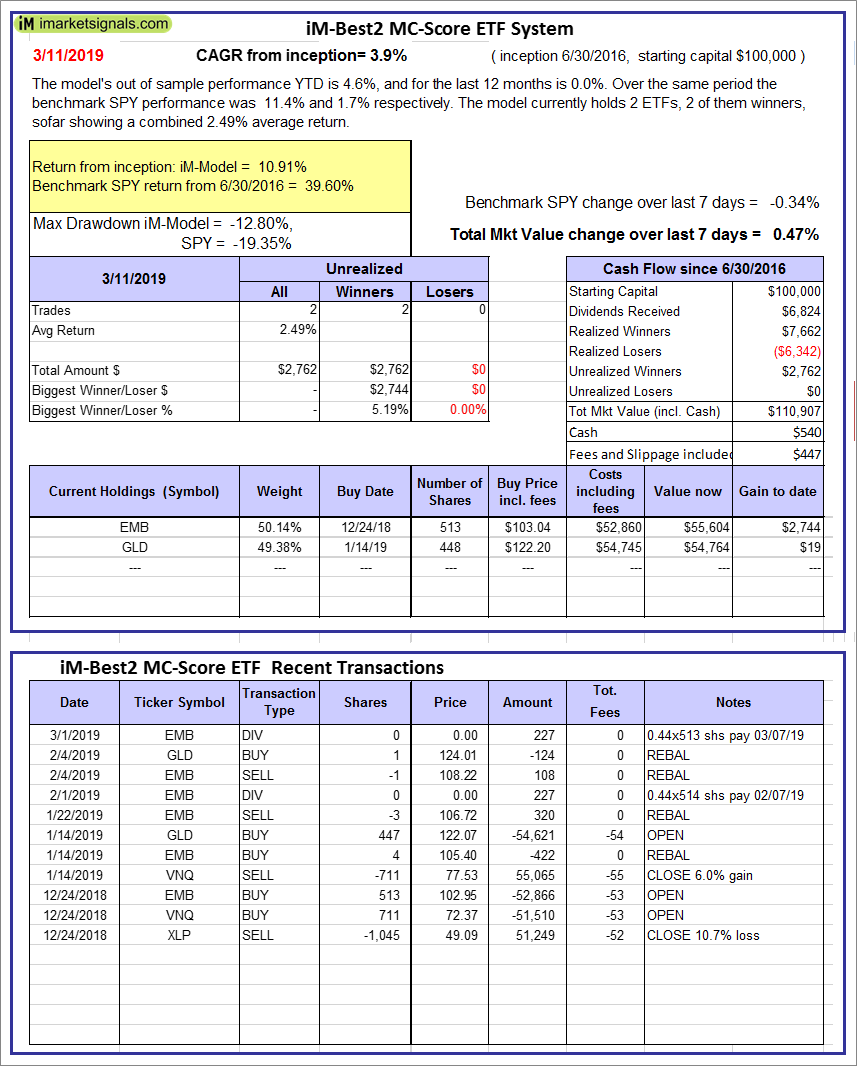
iM-Best2 MC-Score ETF System: The model’s out of sample performance YTD is 4.6%, and for the last 12 months is 0.0%. Over the same period the benchmark SPY performance was 11.4% and 1.7% respectively. Over the previous week the market value of the iM-Best2 MC-Score ETF System gained 0.47% at a time when SPY gained -0.34%. A starting capital of $100,000 at inception on 6/30/2016 would have grown to $110,907 which includes $540 cash and excludes $447 spent on fees and slippage. |
|
|
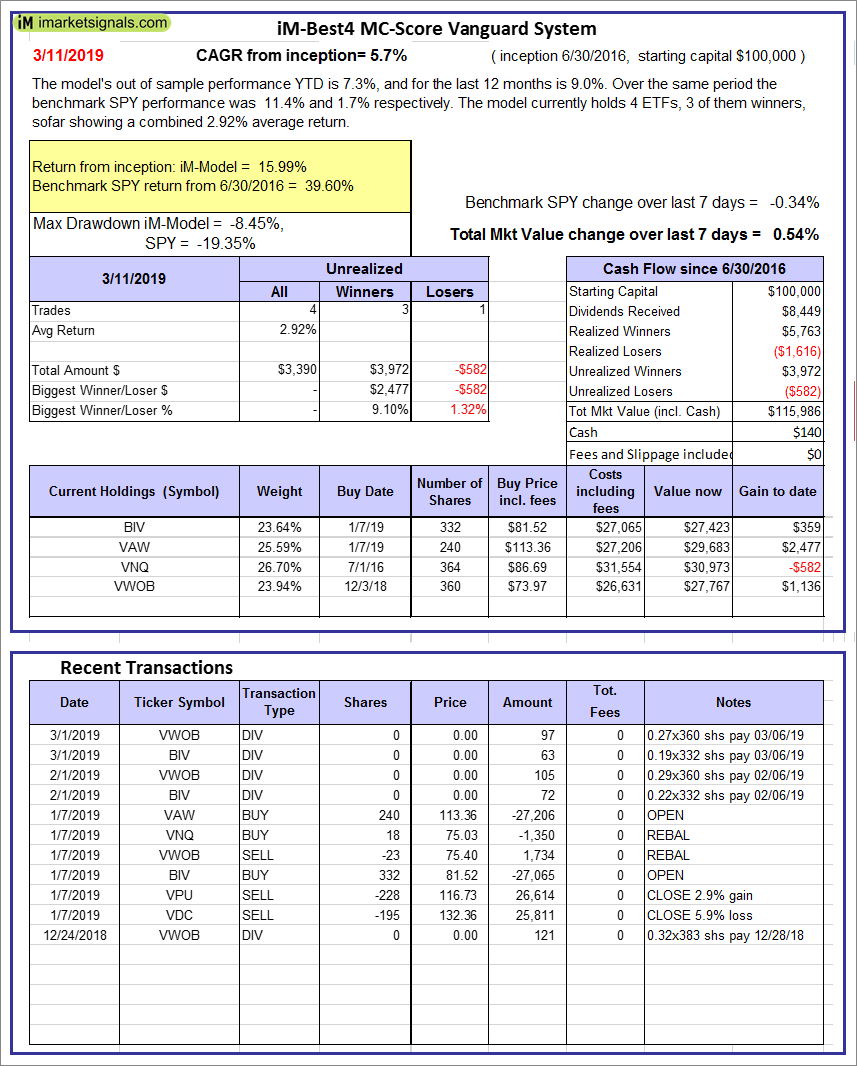
iM-Best4 MC-Score Vanguard System: The model’s out of sample performance YTD is 7.3%, and for the last 12 months is 9.0%. Over the same period the benchmark SPY performance was 11.4% and 1.7% respectively. Over the previous week the market value of the iM-Best4 MC-Score Vanguard System gained 0.54% at a time when SPY gained -0.34%. A starting capital of $100,000 at inception on 6/30/2016 would have grown to $115,986 which includes $140 cash and excludes $00 spent on fees and slippage. |
|
|
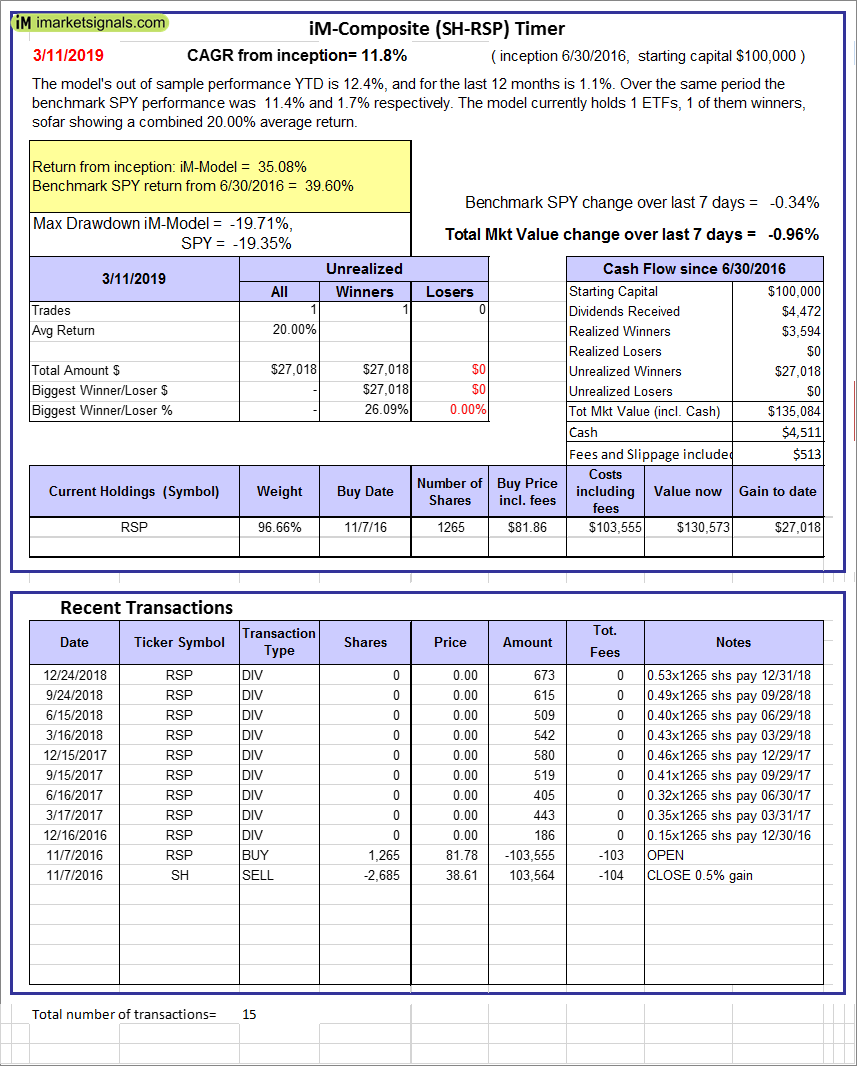
iM-Composite (SH-RSP) Timer: The model’s out of sample performance YTD is 12.4%, and for the last 12 months is 1.1%. Over the same period the benchmark SPY performance was 11.4% and 1.7% respectively. Over the previous week the market value of the iM-Composite (SH-RSP) Timer gained -0.96% at a time when SPY gained -0.34%. A starting capital of $100,000 at inception on 6/30/2016 would have grown to $135,084 which includes $4,511 cash and excludes $513 spent on fees and slippage. |
|
|
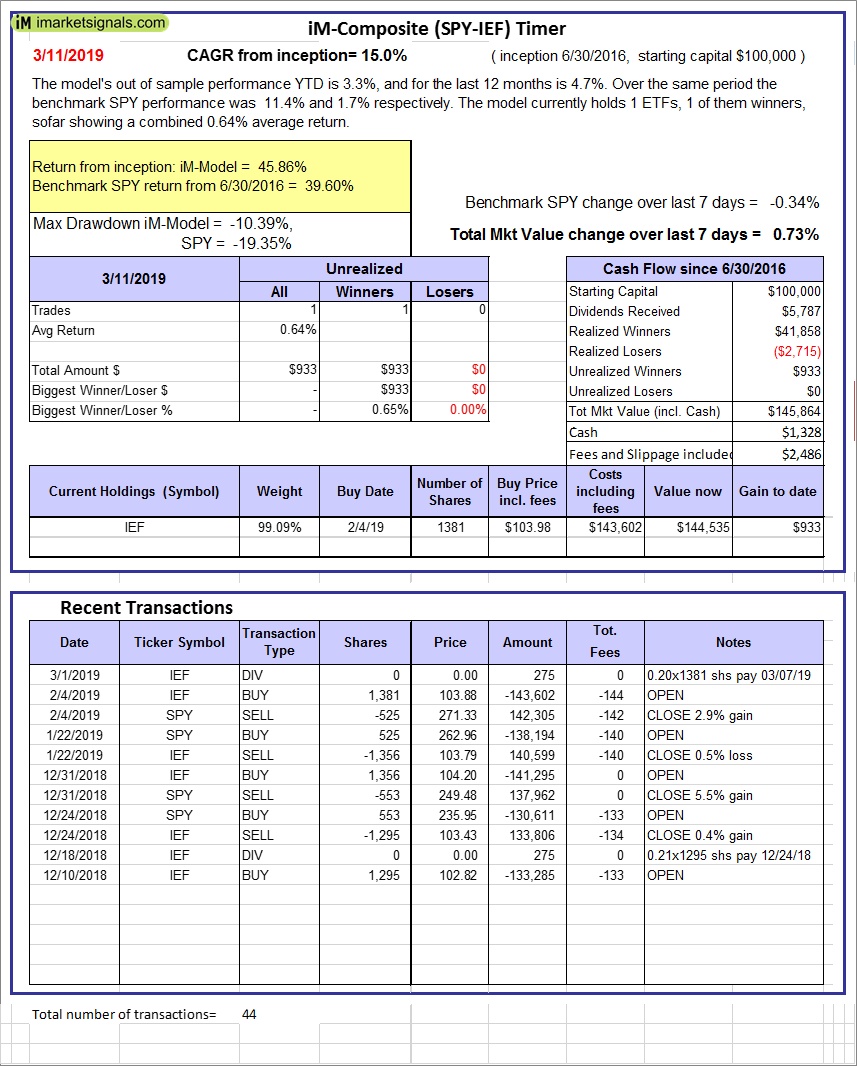
iM-Composite (SPY-IEF) Timer: The model’s out of sample performance YTD is 3.3%, and for the last 12 months is 4.7%. Over the same period the benchmark SPY performance was 11.4% and 1.7% respectively. Over the previous week the market value of the iM-Composite (SPY-IEF) Timer gained 0.73% at a time when SPY gained -0.34%. A starting capital of $100,000 at inception on 6/30/2016 would have grown to $145,864 which includes $1,328 cash and excludes $2,486 spent on fees and slippage. |
|
|
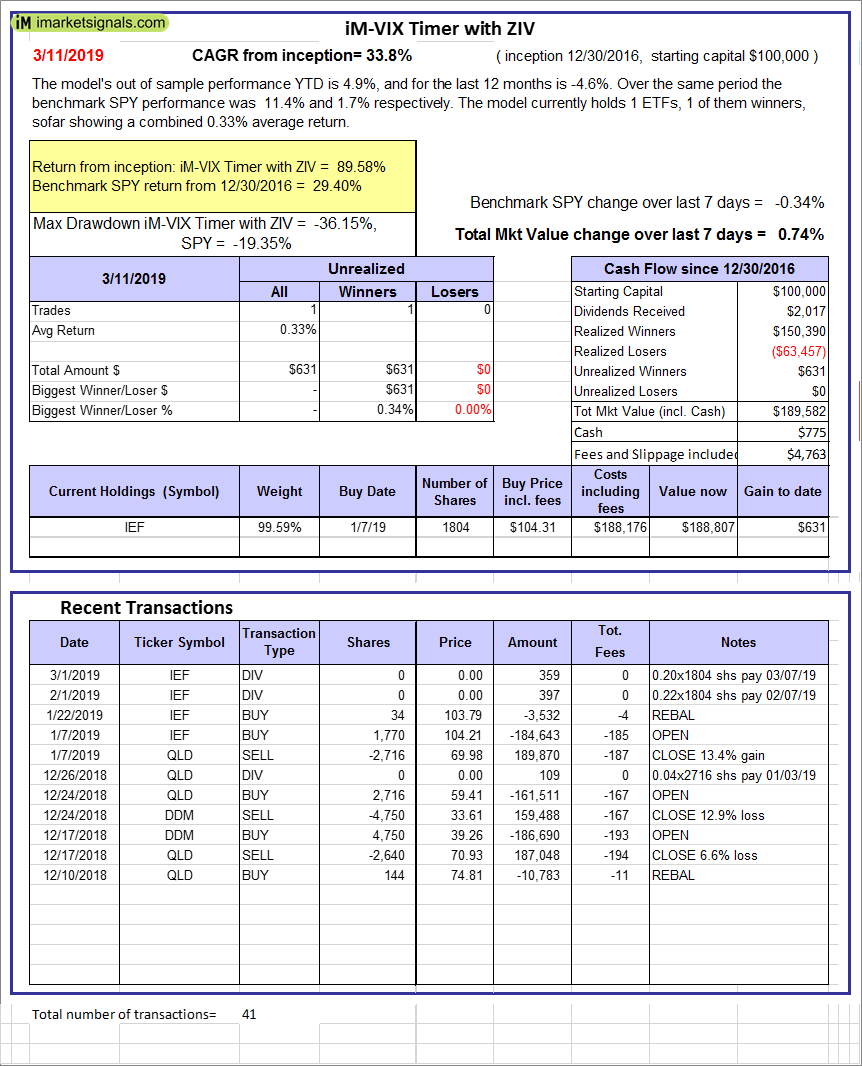
iM-VIX Timer with ZIV: The model’s out of sample performance YTD is 4.9%, and for the last 12 months is -4.6%. Over the same period the benchmark SPY performance was 11.4% and 1.7% respectively. Over the previous week the market value of the iM-VIX Timer with ZIV gained 0.74% at a time when SPY gained -0.34%. A starting capital of $100,000 at inception on 6/30/2016 would have grown to $189,582 which includes $775 cash and excludes $4,763 spent on fees and slippage. |
|
|
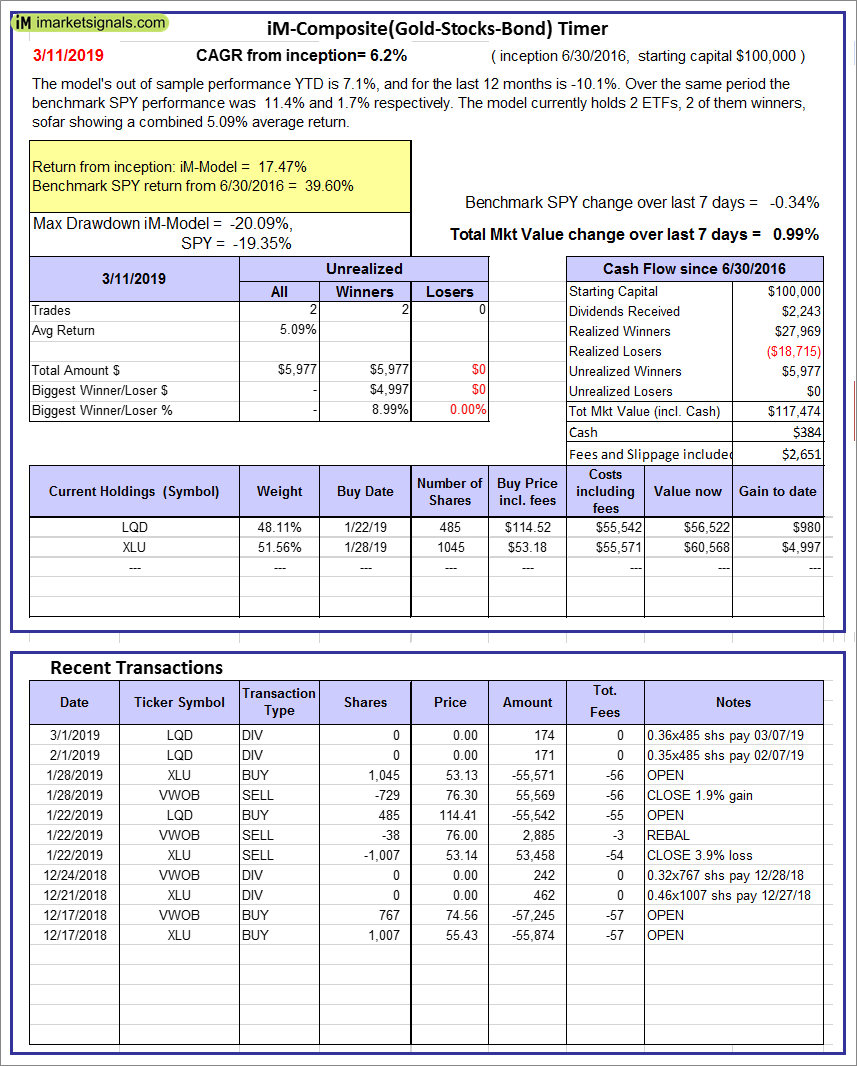
iM-Composite(Gold-Stocks-Bond) Timer: The model’s out of sample performance YTD is 7.1%, and for the last 12 months is -10.1%. Over the same period the benchmark SPY performance was 11.4% and 1.7% respectively. Over the previous week the market value of the iM-Composite(Gold-Stocks-Bond) Timer gained 0.99% at a time when SPY gained -0.34%. A starting capital of $100,000 at inception on 6/30/2016 would have grown to $117,474 which includes $384 cash and excludes $2,651 spent on fees and slippage. |
|
|
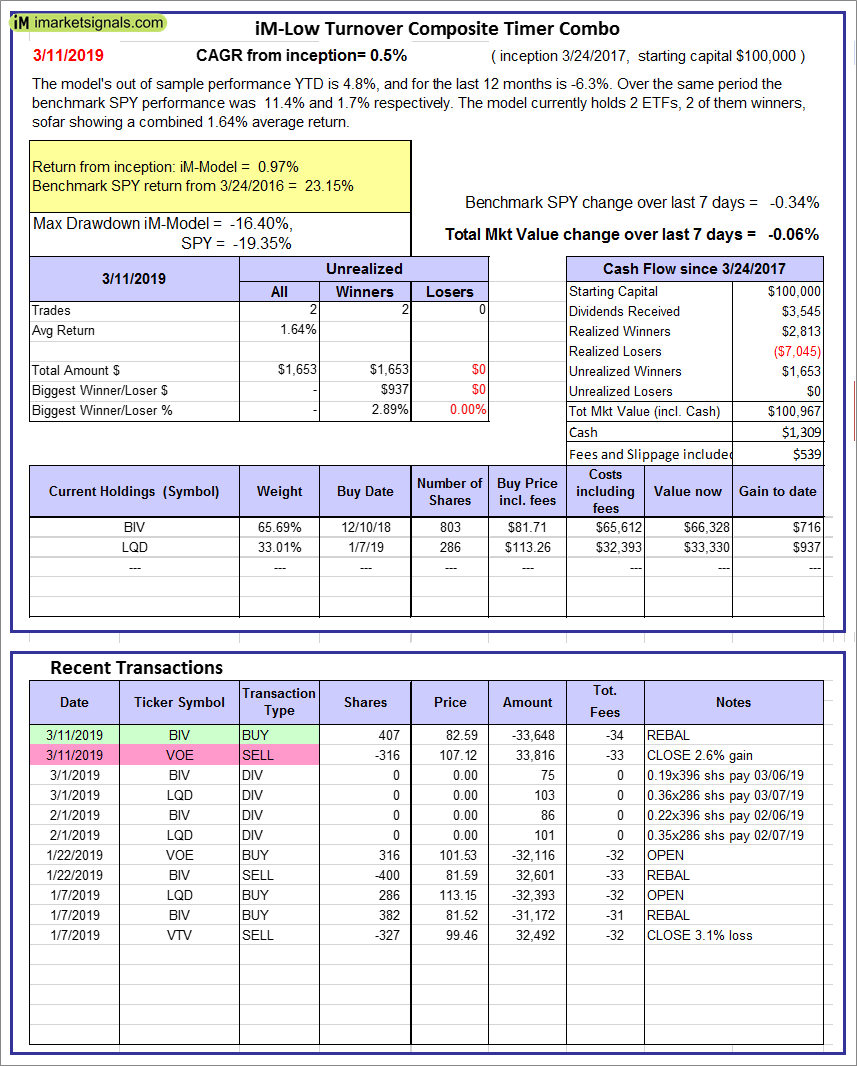
iM-Low Turnover Composite Timer Combo: The model’s out of sample performance YTD is 4.8%, and for the last 12 months is -6.3%. Over the same period the benchmark SPY performance was 11.4% and 1.7% respectively. Over the previous week the market value of the iM-Low Turnover Composite Timer Combo gained -0.06% at a time when SPY gained -0.34%. A starting capital of $100,000 at inception on 3/24/27 would have grown to $100,967 which includes $1,309 cash and excludes $539 spent on fees and slippage. |
|
|
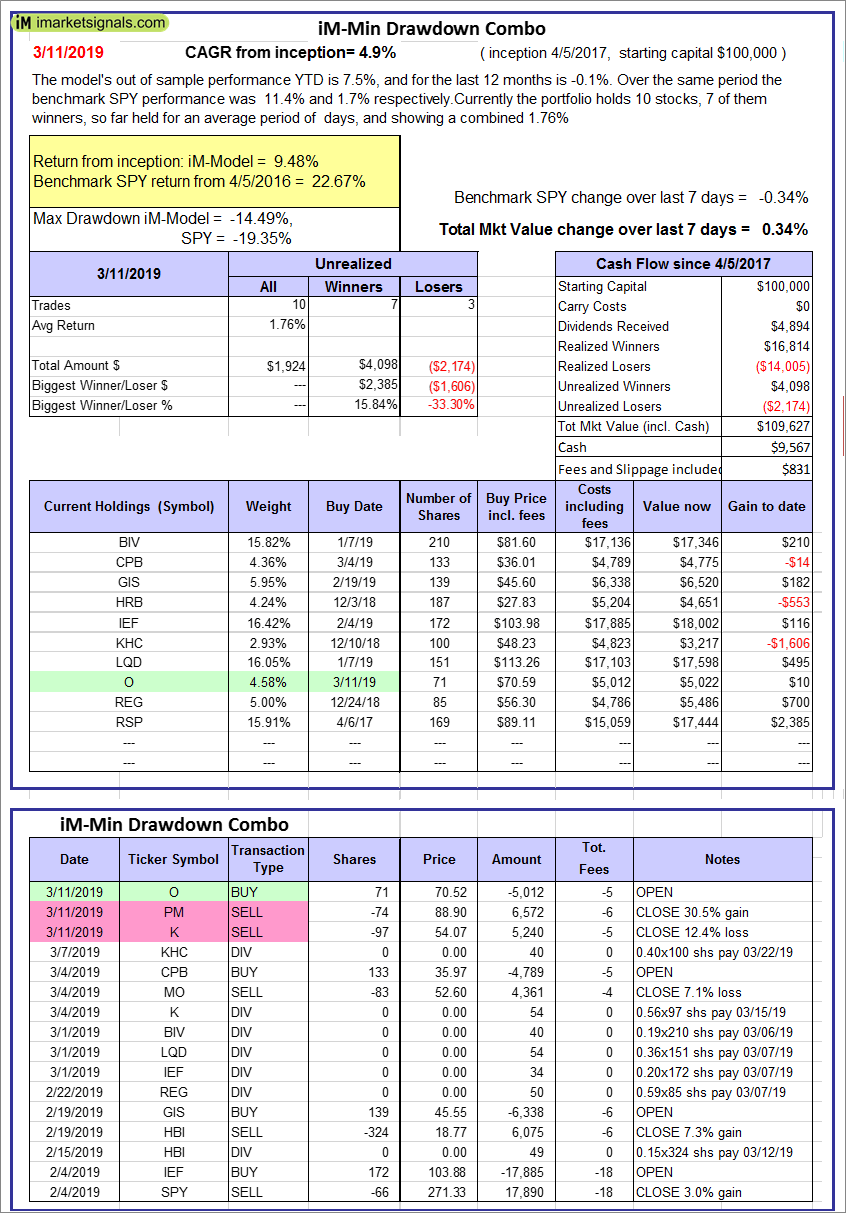
iM-Min Drawdown Combo: The model’s out of sample performance YTD is 7.5%, and for the last 12 months is -0.1%. Over the same period the benchmark SPY performance was 11.4% and 1.7% respectively. Over the previous week the market value of the iM-Min Drawdown Combo gained 0.34% at a time when SPY gained -0.34%. A starting capital of $100,000 at inception on 4/5/2017 would have grown to $109,627 which includes $9,567 cash and excludes $831 spent on fees and slippage. |
|
|
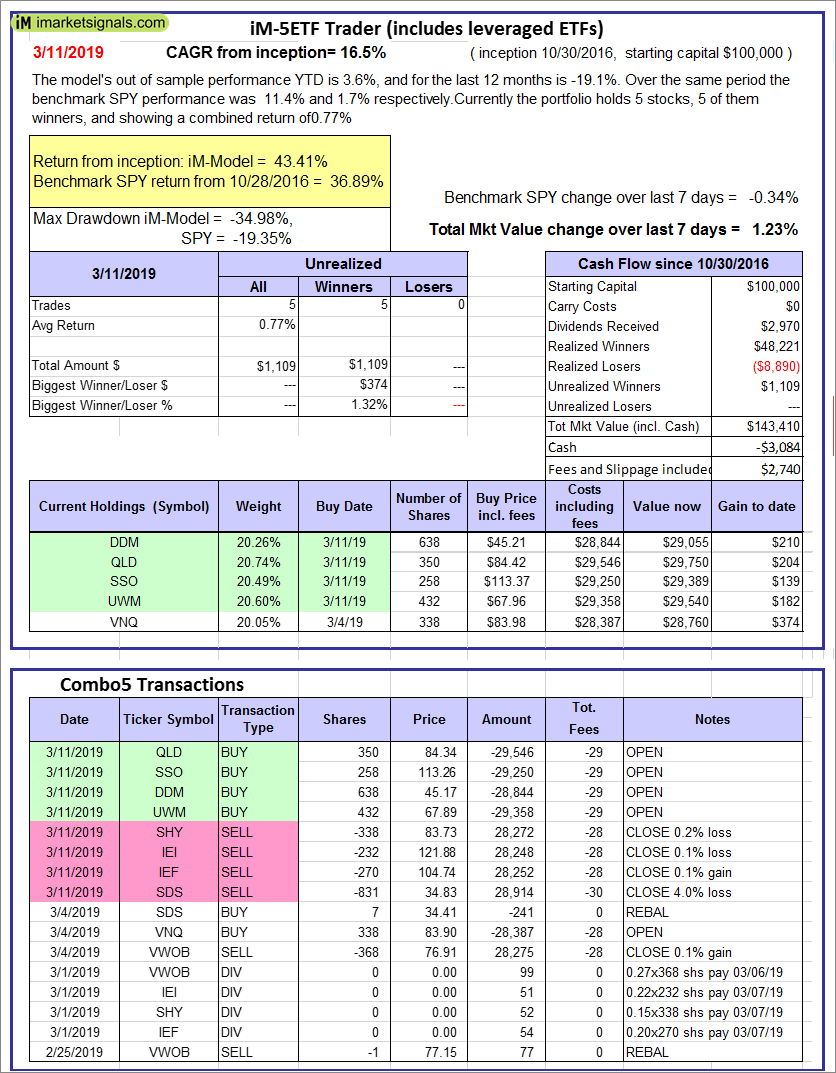
iM-5ETF Trader (includes leveraged ETFs): The model’s out of sample performance YTD is 3.6%, and for the last 12 months is -19.1%. Over the same period the benchmark SPY performance was 11.4% and 1.7% respectively. Over the previous week the market value of the iM-5ETF Trader (includes leveraged ETFs) gained 1.23% at a time when SPY gained -0.34%. A starting capital of $100,000 at inception on 10/30/2016 would have grown to $143,410 which includes -$3,084 cash and excludes $2,740 spent on fees and slippage. |
|
|
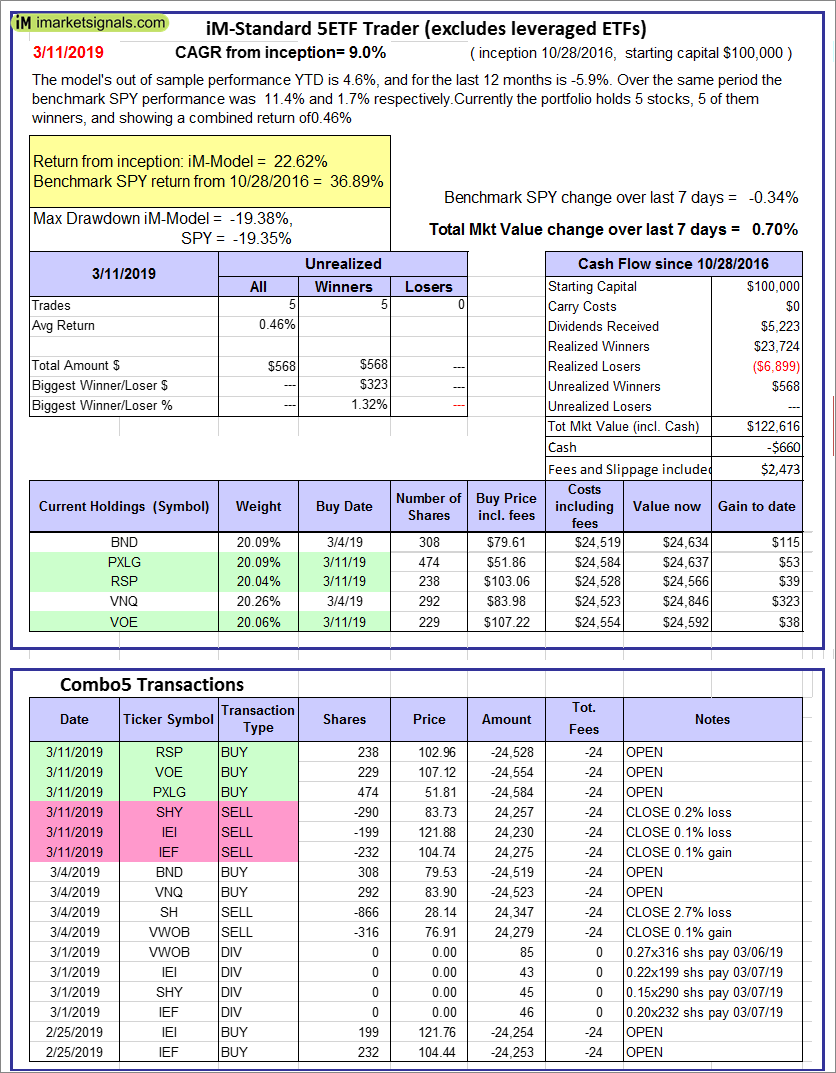
iM-Standard 5ETF Trader (excludes leveraged ETFs): The model’s out of sample performance YTD is 4.6%, and for the last 12 months is -5.9%. Over the same period the benchmark SPY performance was 11.4% and 1.7% respectively. Over the previous week the market value of the iM-Standard 5ETF Trader (excludes leveraged ETFs) gained 0.70% at a time when SPY gained -0.34%. A starting capital of $100,000 at inception on 10/30/2016 would have grown to $122,616 which includes -$660 cash and excludes $2,473 spent on fees and slippage. |


Leave a Reply
You must be logged in to post a comment.