
  |
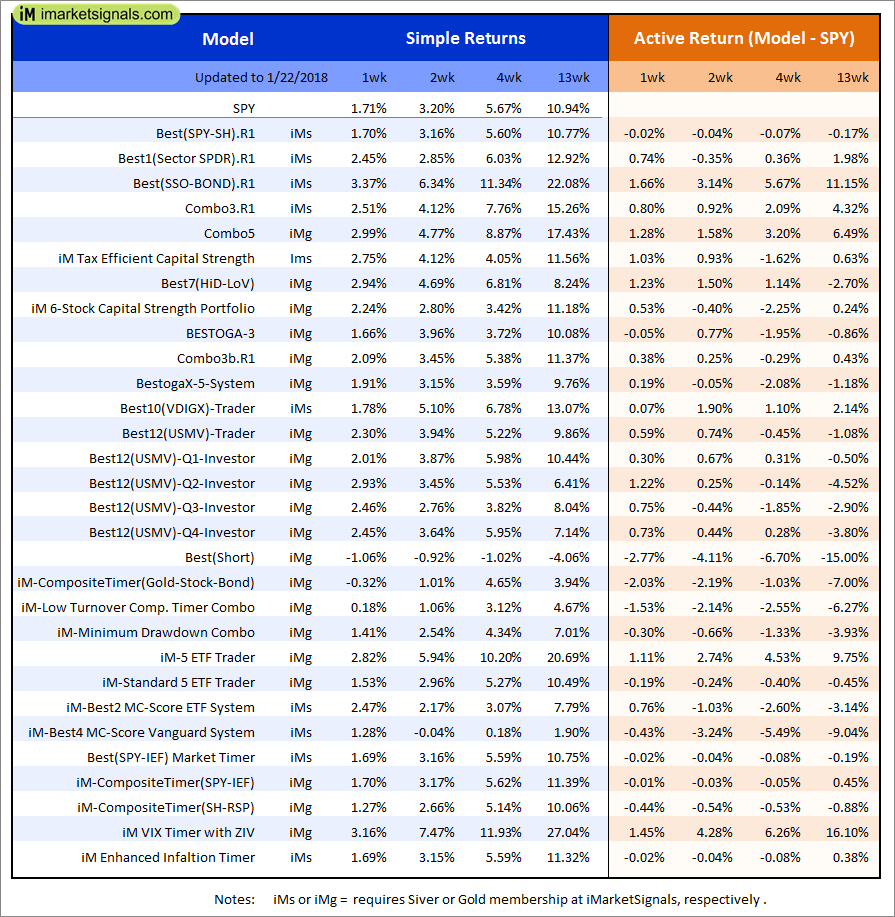
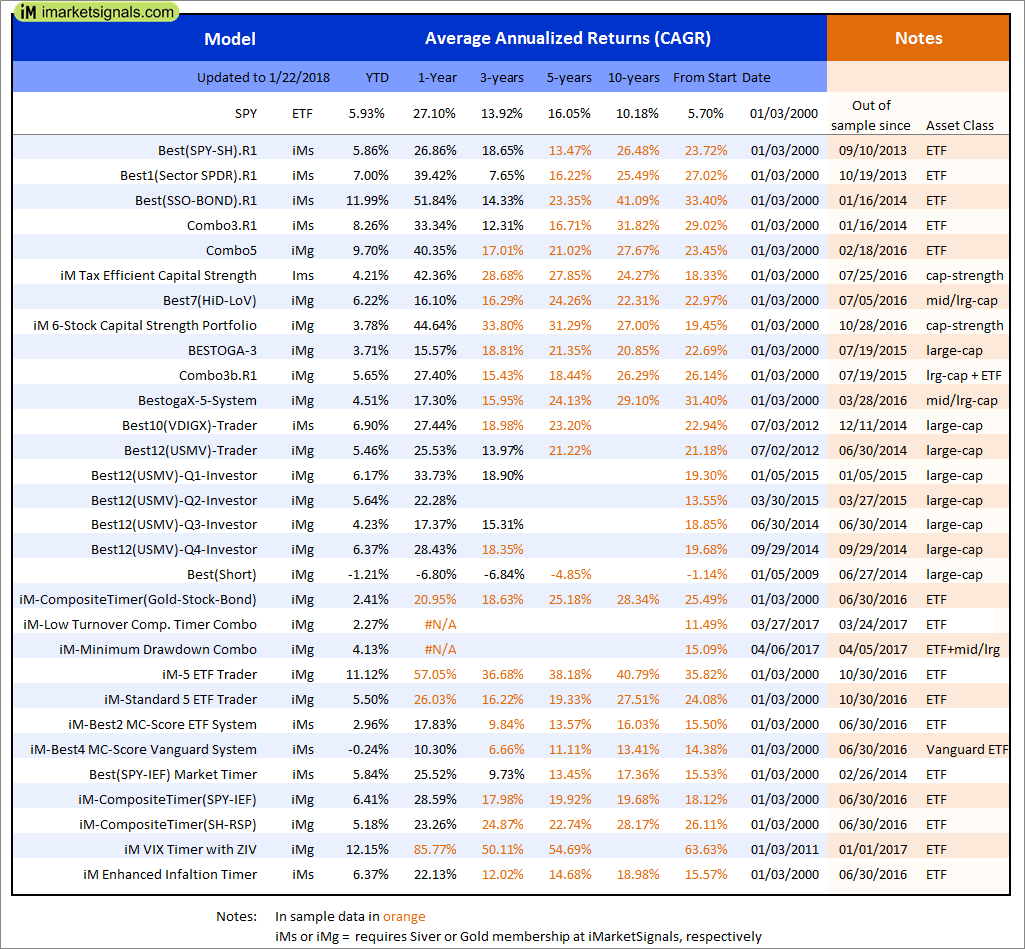
Out of sample performance summary of our models for the past 1, 2, 4 and 13 week periods. The active active return indicates how the models over- or underperformed the benchmark ETF SPY. Also the YTD, and the 1-, 3-, 5- and 10-year annualized returns are shown in the second table |
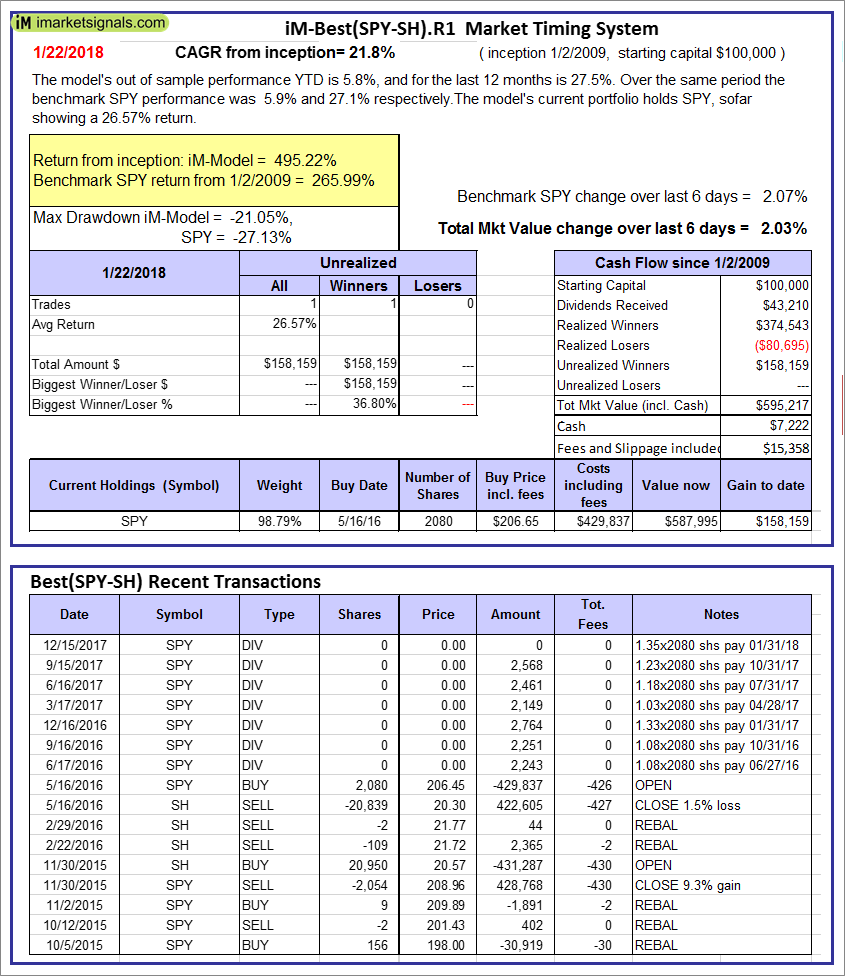 |
iM-Best(SPY-SH).R1: The model’s out of sample performance YTD is 5.8%, and for the last 12 months is 27.5%. Over the same period the benchmark SPY performance was 5.9% and 27.1% respectively. Over the previous week the market value of Best(SPY-SH) gained 2.03% at a time when SPY gained 2.07%. A starting capital of $100,000 at inception on 1/2/2009 would have grown to $595,217 which includes $7,222 cash and excludes $15,358 spent on fees and slippage. |
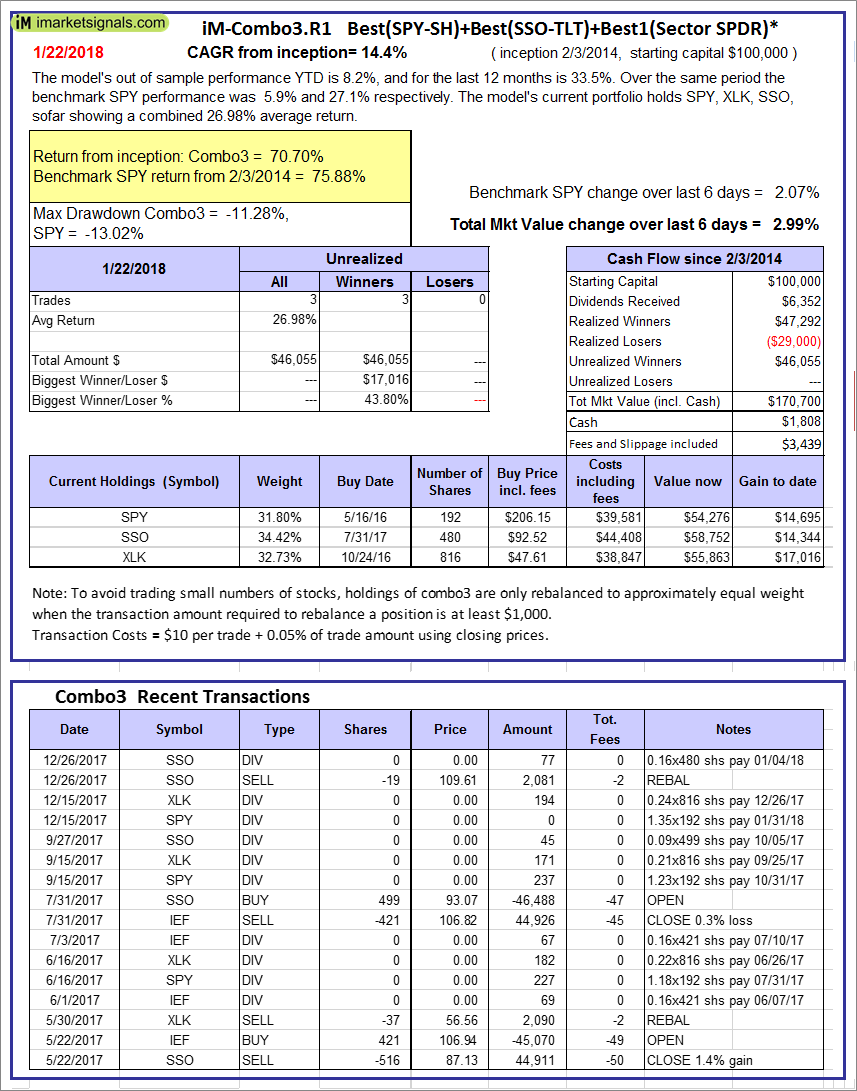 |
iM-Combo3.R1: The model’s out of sample performance YTD is 8.2%, and for the last 12 months is 33.5%. Over the same period the benchmark SPY performance was 5.9% and 27.1% respectively. Over the previous week the market value of iM-Combo3.R1 gained 2.99% at a time when SPY gained 2.07%. A starting capital of $100,000 at inception on 2/3/2014 would have grown to $170,700 which includes $1,808 cash and excludes $3,439 spent on fees and slippage. |
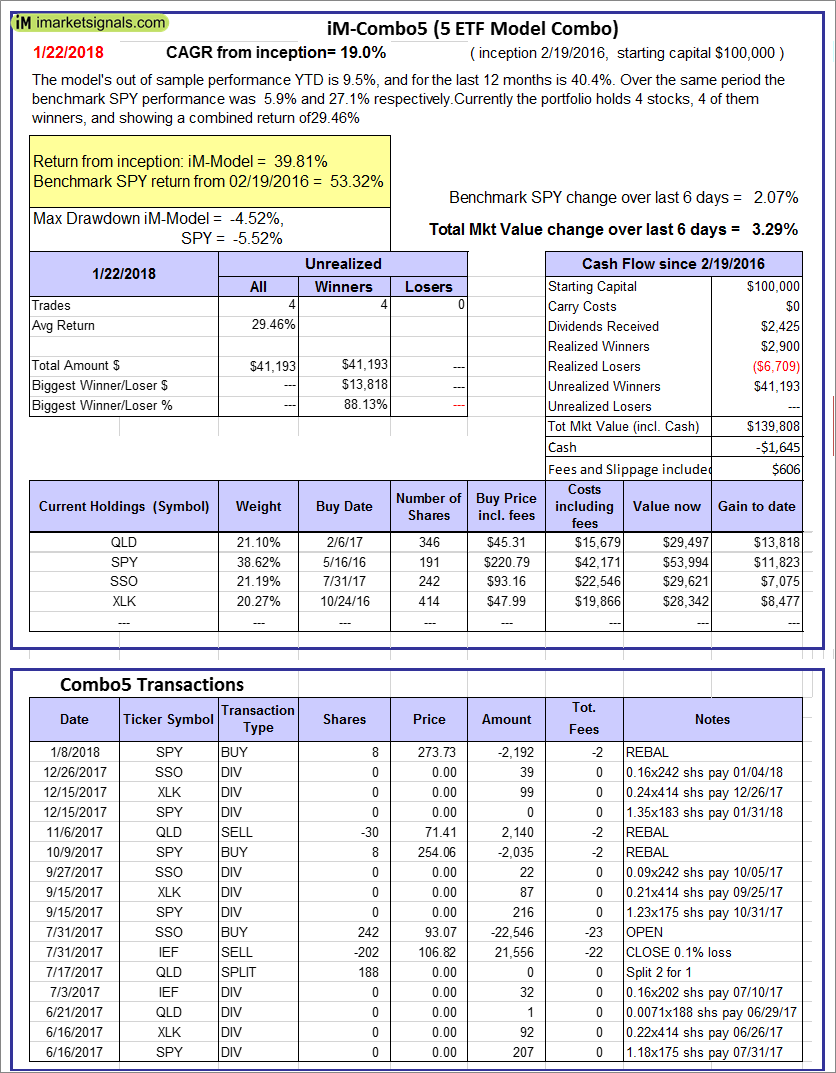 |
iM-Combo5: The model’s out of sample performance YTD is 9.5%, and for the last 12 months is 40.4%. Over the same period the benchmark SPY performance was 5.9% and 27.1% respectively. Over the previous week the market value of iM-Combo5 gained 3.29% at a time when SPY gained 2.07%. A starting capital of $100,000 at inception on 2/22/2016 would have grown to $139,808 which includes -$1,645 cash and excludes $606 spent on fees and slippage. |
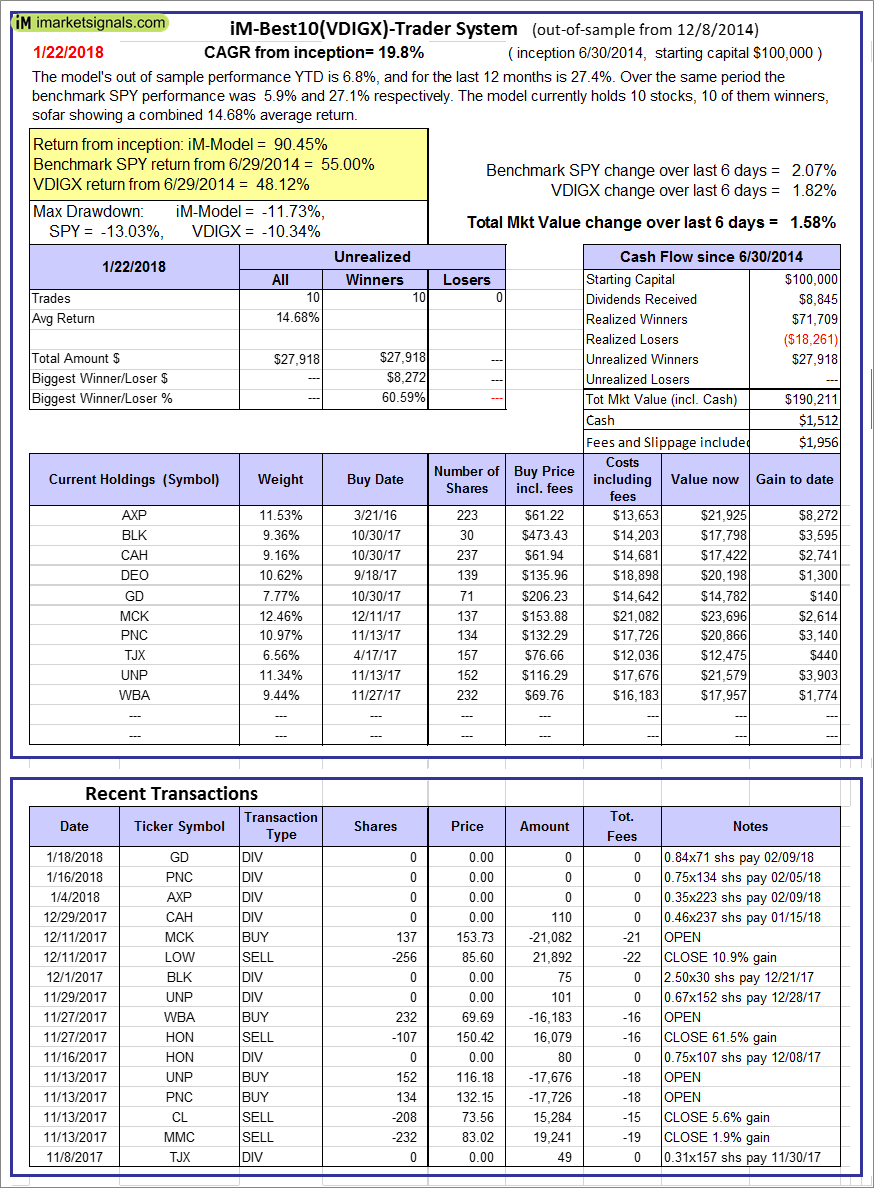 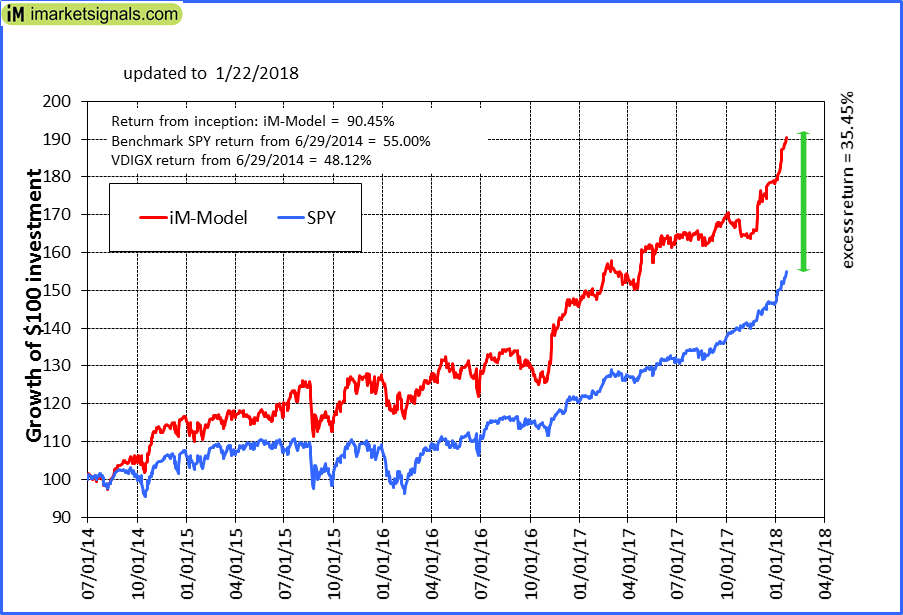 |
iM-Best10(VDIGX)-Trader: The model’s out of sample performance YTD is 6.8%, and for the last 12 months is 27.4%. Over the same period the benchmark SPY performance was 5.9% and 27.1% respectively. Since inception, on 7/1/2014, the model gained 90.45% while the benchmark SPY gained 55.00% and VDIGX gained 48.12% over the same period. Over the previous week the market value of iM-Best10(VDIGX) gained 1.58% at a time when SPY gained 2.07%. A starting capital of $100,000 at inception on 7/1/2014 would have grown to $190,211 which includes $1,512 cash and excludes $1,956 spent on fees and slippage. |
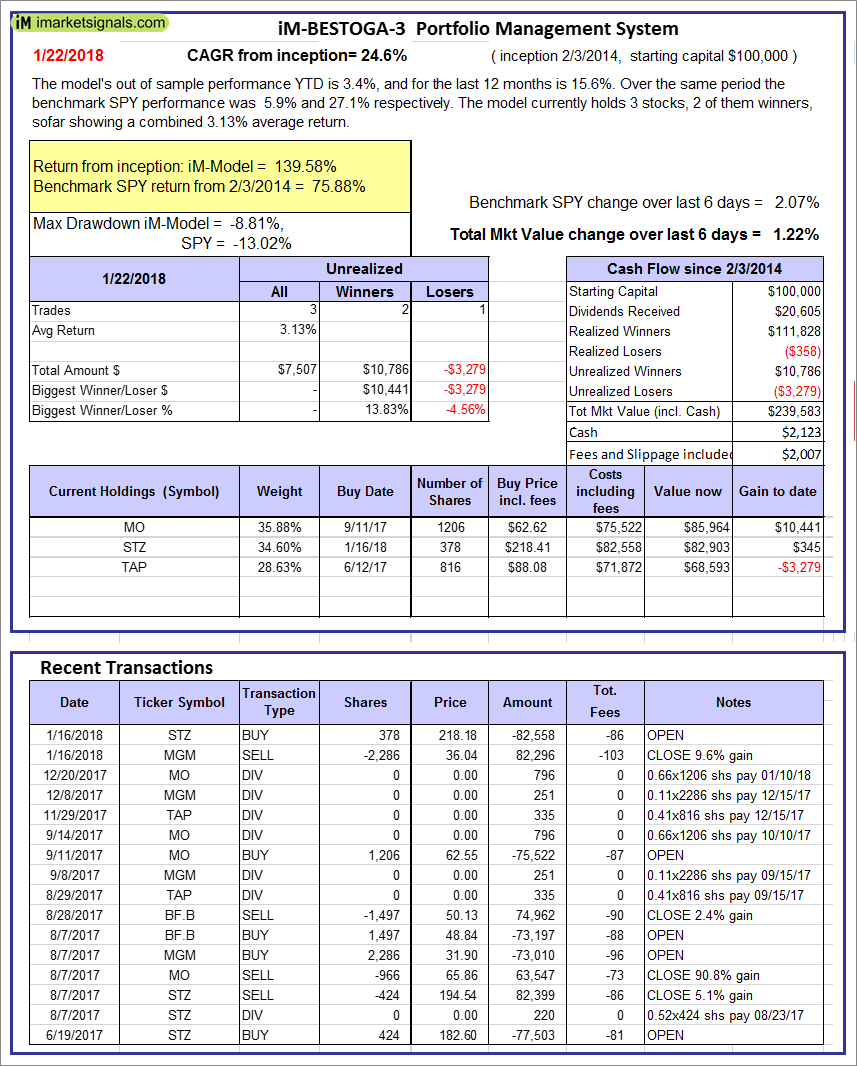 |
iM-BESTOGA-3: The model’s out of sample performance YTD is 3.4%, and for the last 12 months is 15.6%. Over the same period the benchmark SPY performance was 5.9% and 27.1% respectively. Over the previous week the market value of iM-BESTOGA-3 gained 1.22% at a time when SPY gained 2.07%. A starting capital of $100,000 at inception on 2/3/2014 would have grown to $239,583 which includes $2,123 cash and excludes $2,007 spent on fees and slippage. |
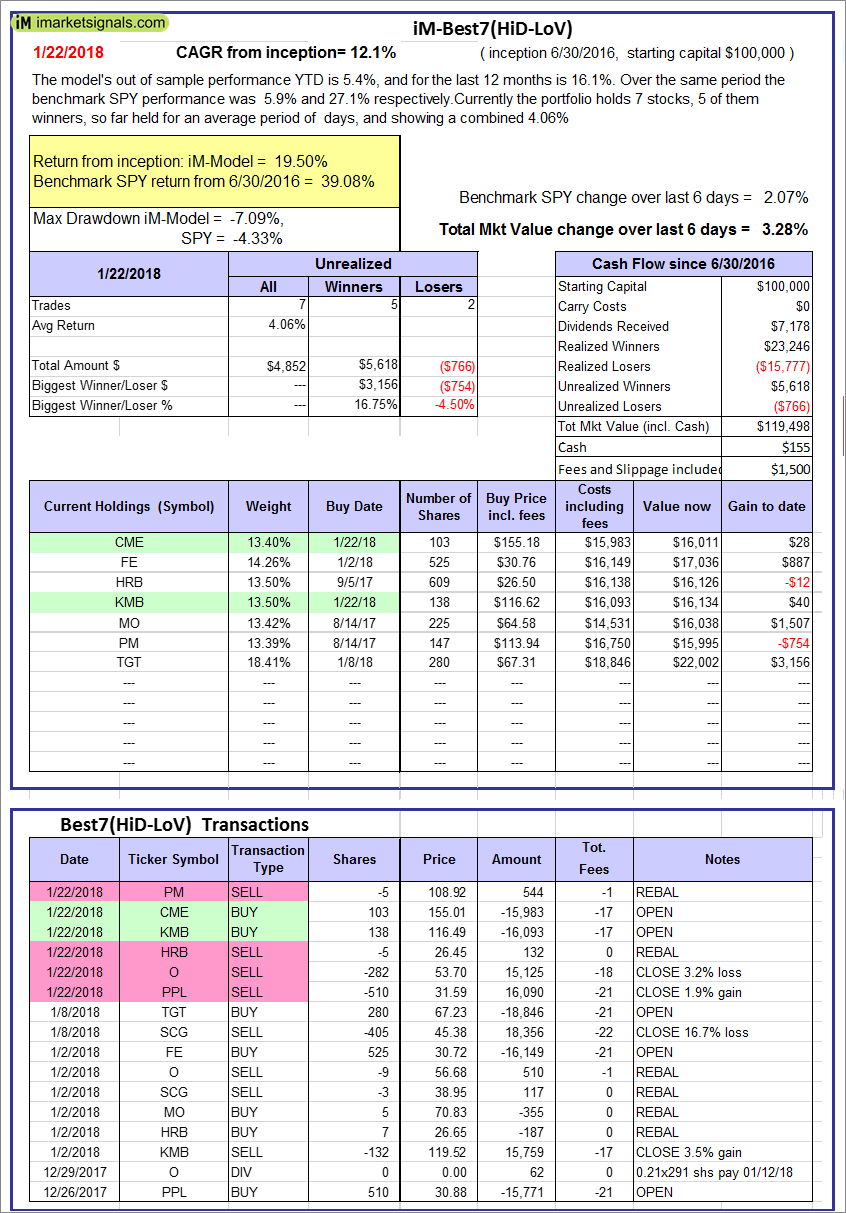 |
iM-Best7(HiD-LoV): The model’s out of sample performance YTD is 5.4%, and for the last 12 months is 16.1%. Over the same period the benchmark SPY performance was 5.9% and 27.1% respectively. Over the previous week the market value of iM-BESTOGA-3 gained 3.28% at a time when SPY gained 2.07%. A starting capital of $100,000 at inception on 6/30/2016 would have grown to $119,498 which includes $155 cash and excludes $1,500 spent on fees and slippage. |
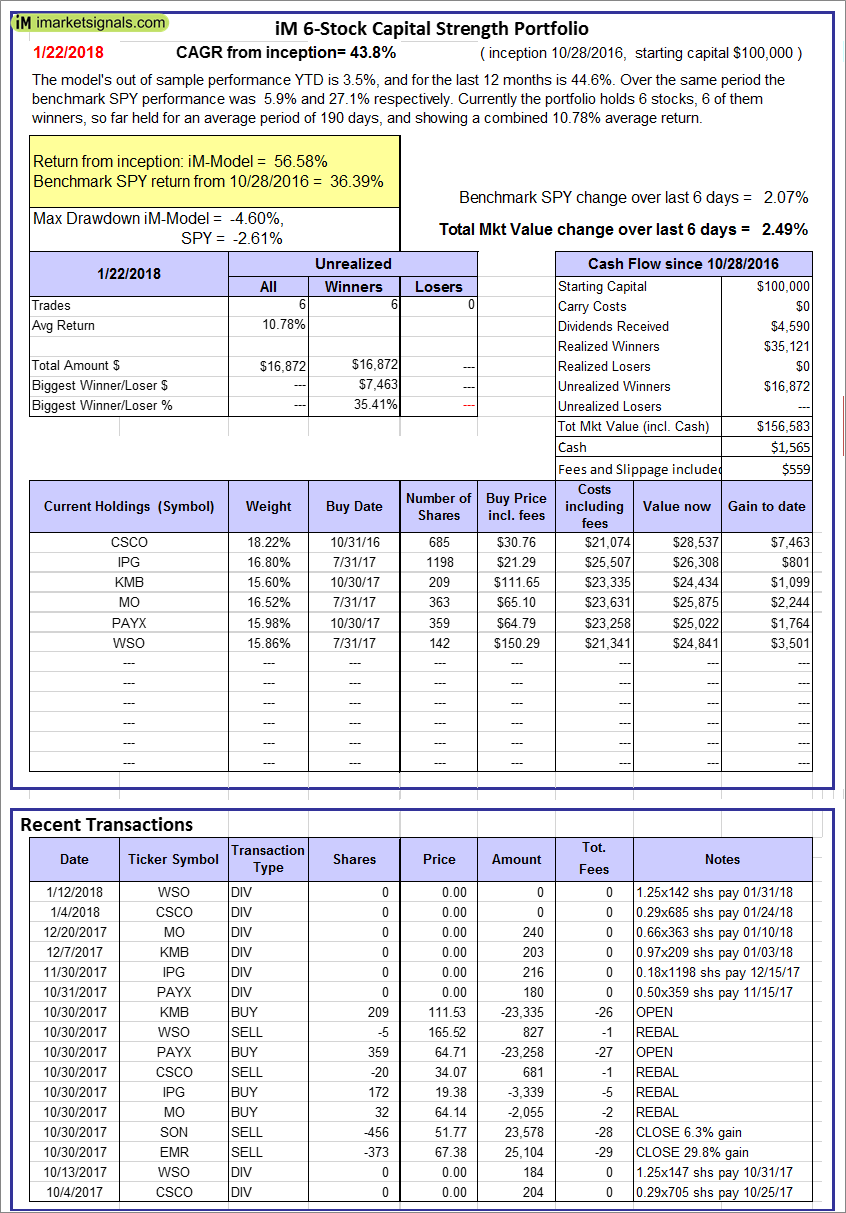 |
iM 6-Stock Capital Strength Portfolio: The model’s out of sample performance YTD is 3.5%, and for the last 12 months is 44.6%. Over the same period the benchmark SPY performance was 5.9% and 27.1% respectively. Over the previous week the market value of the iM 6-Stock Capital Strength Portfolio gained 2.49% at a time when SPY gained 2.07%. A starting capital of $100,000 at inception on 10/28/2016 would have grown to $156,583 which includes $1,565 cash and excludes $559 spent on fees and slippage. |
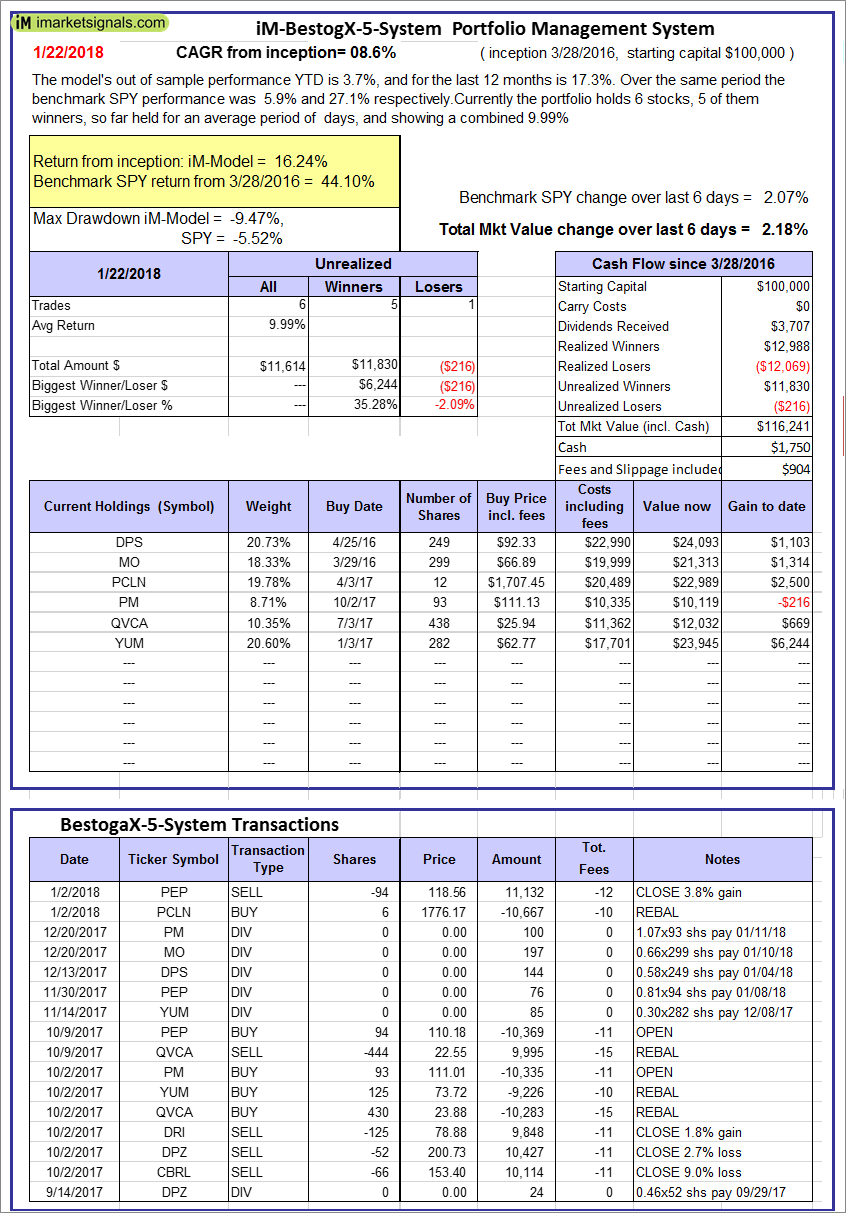 |
iM-BestogaX5-System: The model’s out of sample performance YTD is 3.7%, and for the last 12 months is 17.3%. Over the same period the benchmark SPY performance was 5.9% and 27.1% respectively. Over the previous week the market value of iM-Best8(S&P 500)Tax-Eff. gained 2.18% at a time when SPY gained 2.07%. A starting capital of $100,000 at inception on 3/28/2016 would have grown to $116,241 which includes $1,750 cash and excludes $904 spent on fees and slippage. |
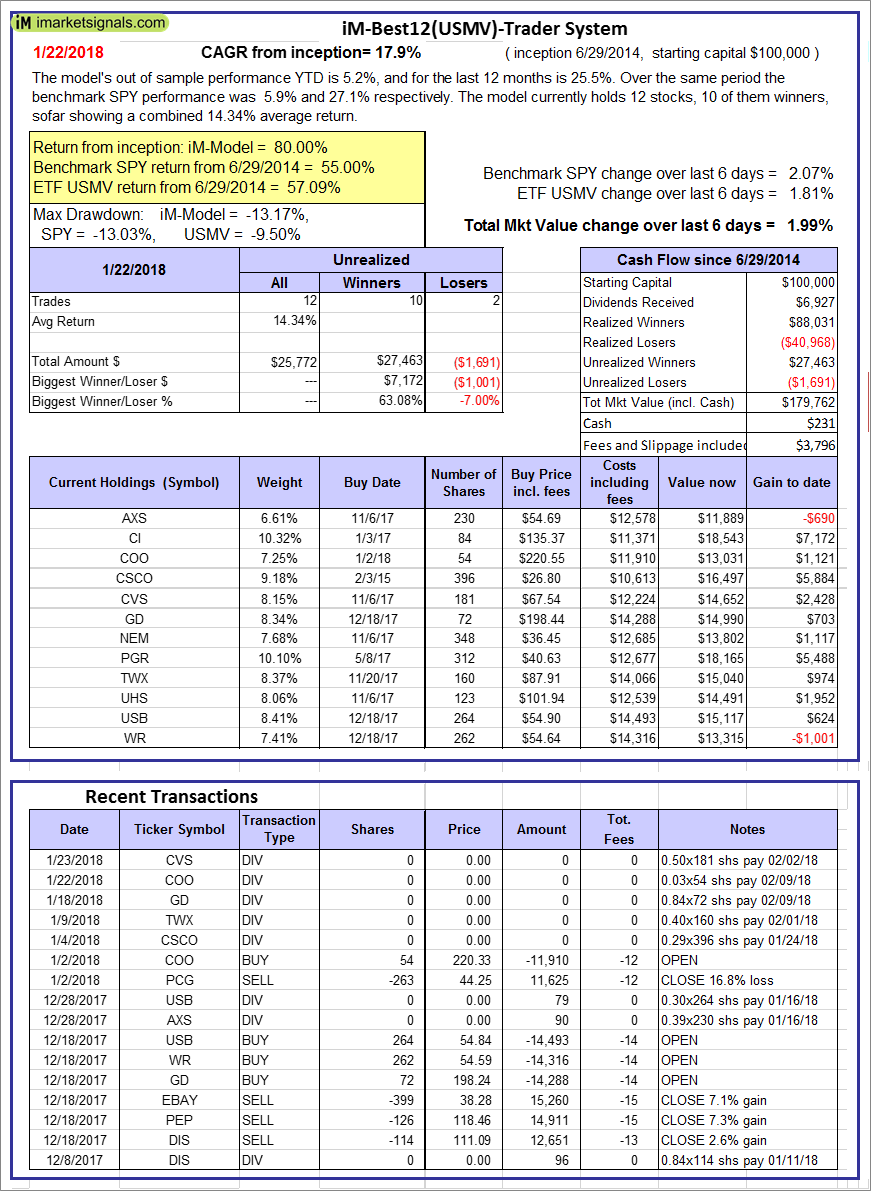  |
iM-Best12(USMV)-Trader: The model’s out of sample performance YTD is 5.2%, and for the last 12 months is 25.5%. Over the same period the benchmark SPY performance was 5.9% and 27.1% respectively. Since inception, on 6/30/2014, the model gained 80.00% while the benchmark SPY gained 55.00% and the ETF USMV gained 57.09% over the same period. Over the previous week the market value of iM-Best12(USMV)-Trader gained 1.99% at a time when SPY gained 2.07%. A starting capital of $100,000 at inception on 6/30/2014 would have grown to $179,762 which includes $231 cash and excludes $3,796 spent on fees and slippage. |
 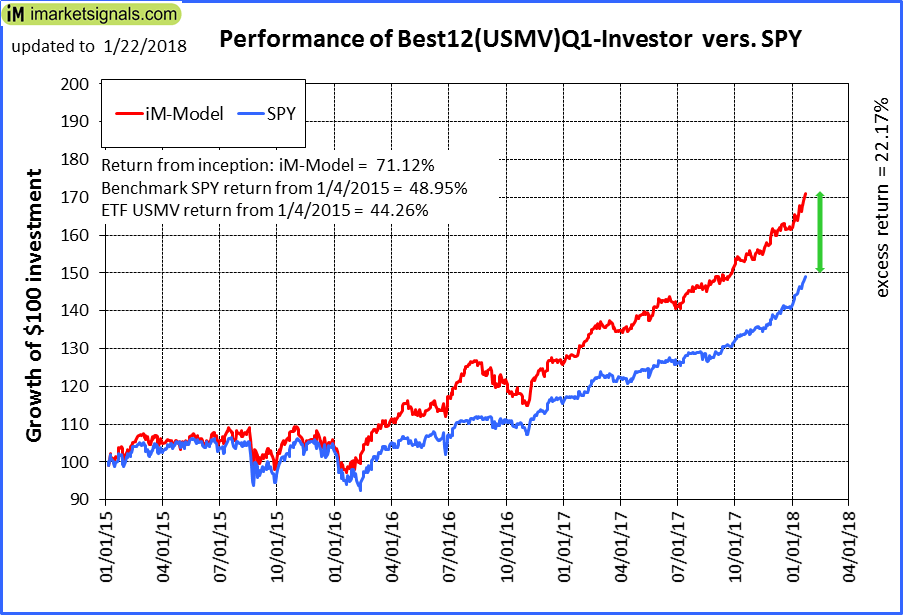 |
iM-Best12(USMV)Q1-Investor: The model’s out of sample performance YTD is 6.0%, and for the last 12 months is 33.7%. Over the same period the benchmark SPY performance was 5.9% and 27.1% respectively. Since inception, on 1/5/2015, the model gained 71.12% while the benchmark SPY gained 48.95% and the ETF USMV gained 44.26% over the same period. Over the previous week the market value of iM-Best12(USMV)Q1 gained 2.85% at a time when SPY gained 2.07%. A starting capital of $100,000 at inception on 1/5/2015 would have grown to $171,061 which includes $377 cash and excludes $926 spent on fees and slippage. |
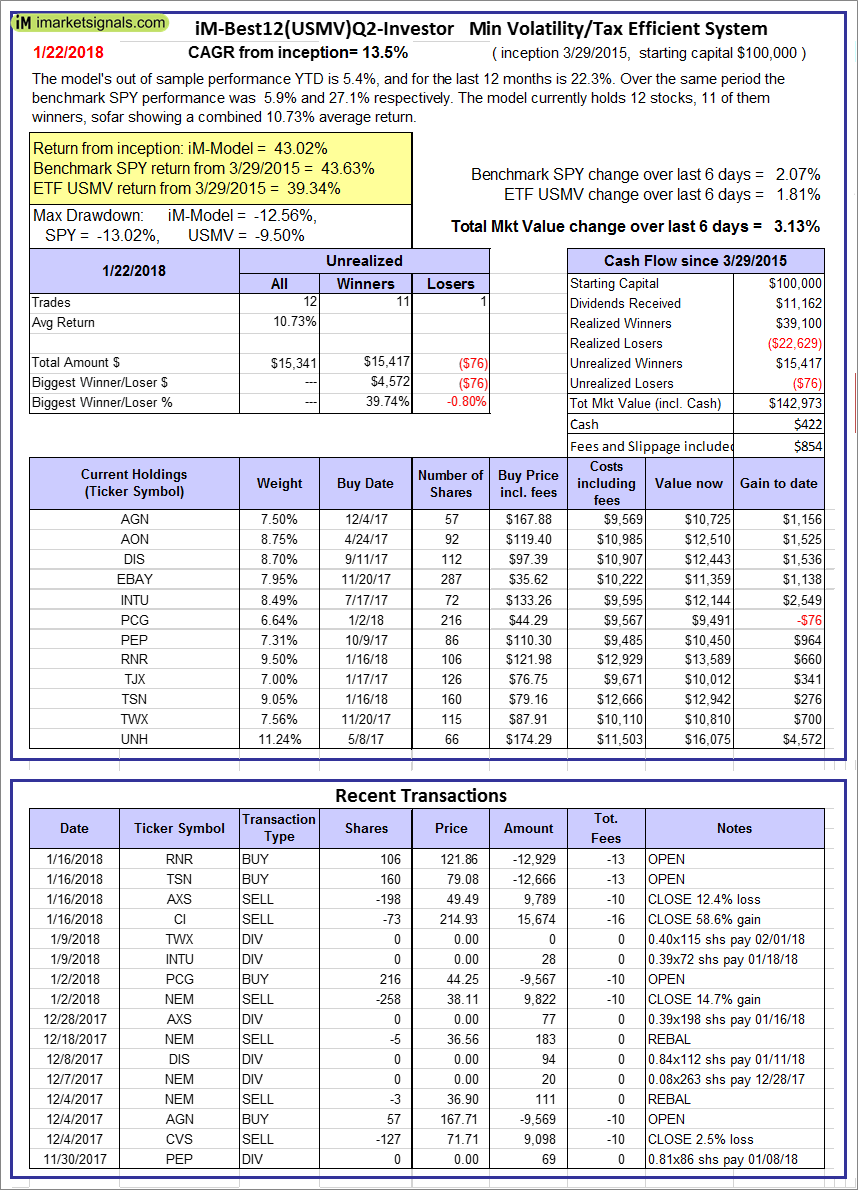 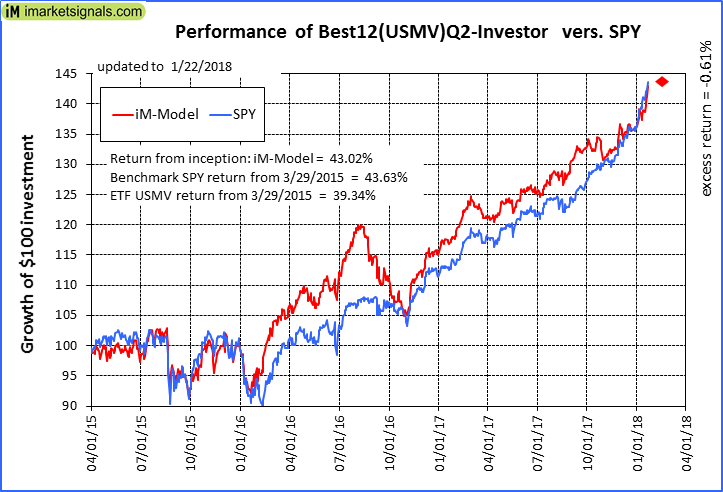 |
iM-Best12(USMV)Q2-Investor: The model’s out of sample performance YTD is 5.4%, and for the last 12 months is 22.3%. Over the same period the benchmark SPY performance was 5.9% and 27.1% respectively. Since inception, on 3/30/2015, the model gained 43.02% while the benchmark SPY gained 43.63% and the ETF USMV gained 39.34% over the same period. Over the previous week the market value of iM-Best12(USMV)Q2 gained 3.13% at a time when SPY gained 2.07%. A starting capital of $100,000 at inception on 3/30/2015 would have grown to $142,973 which includes $422 cash and excludes $854 spent on fees and slippage. |
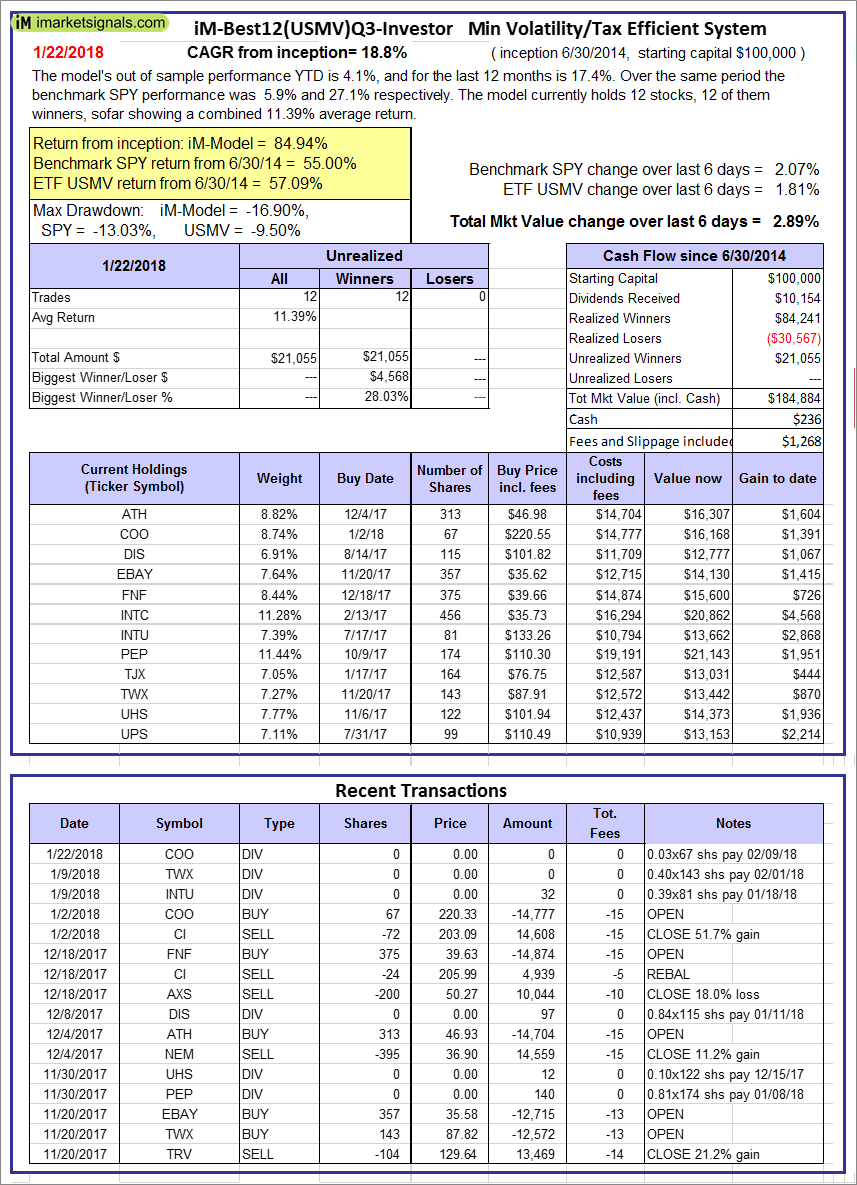 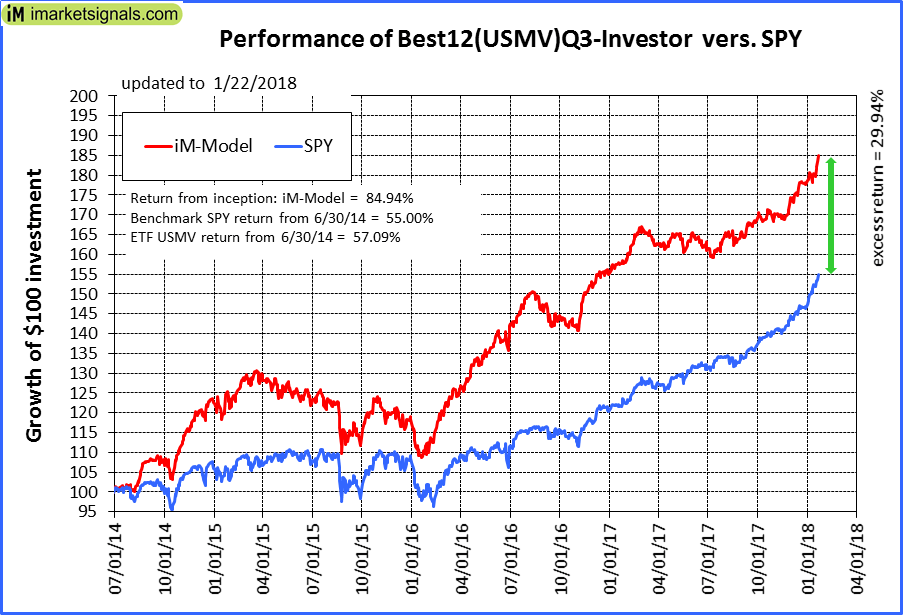 |
iM-Best12(USMV)Q3-Investor: The model’s out of sample performance YTD is 4.1%, and for the last 12 months is 17.4%. Over the same period the benchmark SPY performance was 5.9% and 27.1% respectively. Since inception, on 7/1/2014, the model gained 84.94% while the benchmark SPY gained 55.00% and the ETF USMV gained 57.09% over the same period. Over the previous week the market value of iM-Best12(USMV)Q3 gained 2.89% at a time when SPY gained 2.07%. A starting capital of $100,000 at inception on 7/1/2014 would have grown to $184,884 which includes $236 cash and excludes $1,268 spent on fees and slippage. |
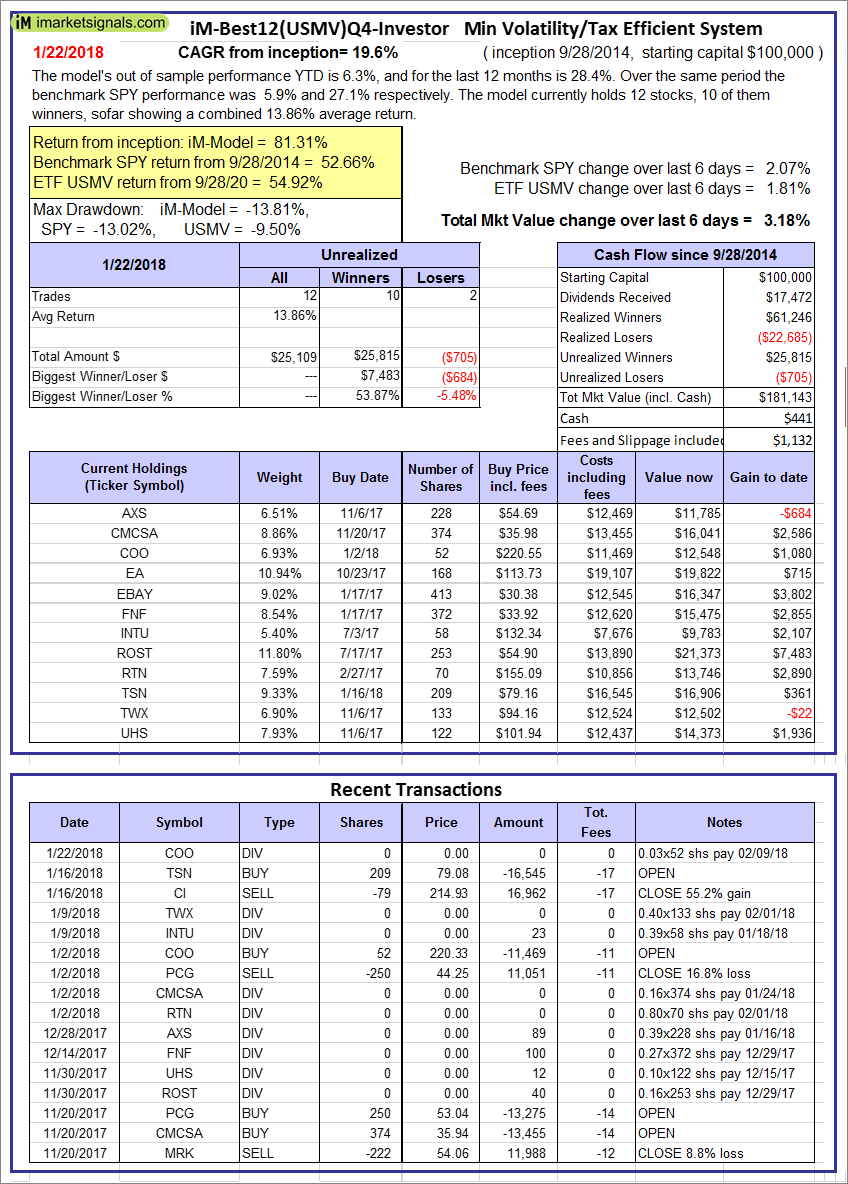 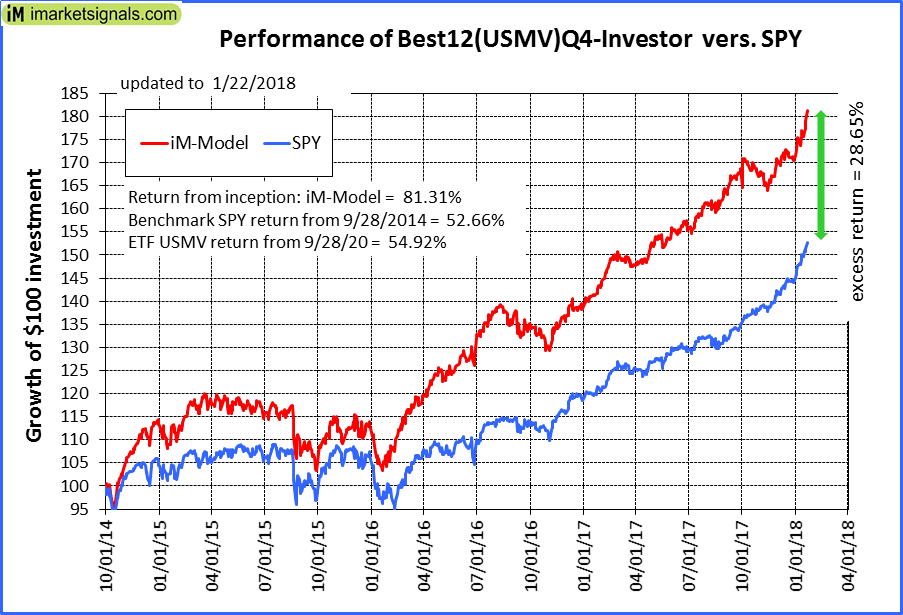 |
iM-Best12(USMV)Q4-Investor: Since inception, on 9/29/2014, the model gained 81.31% while the benchmark SPY gained 52.66% and the ETF USMV gained 54.92% over the same period. Over the previous week the market value of iM-Best12(USMV)Q4 gained 3.18% at a time when SPY gained 2.07%. A starting capital of $100,000 at inception on 9/29/2014 would have grown to $181,143 which includes $441 cash and excludes $1,132 spent on fees and slippage. |
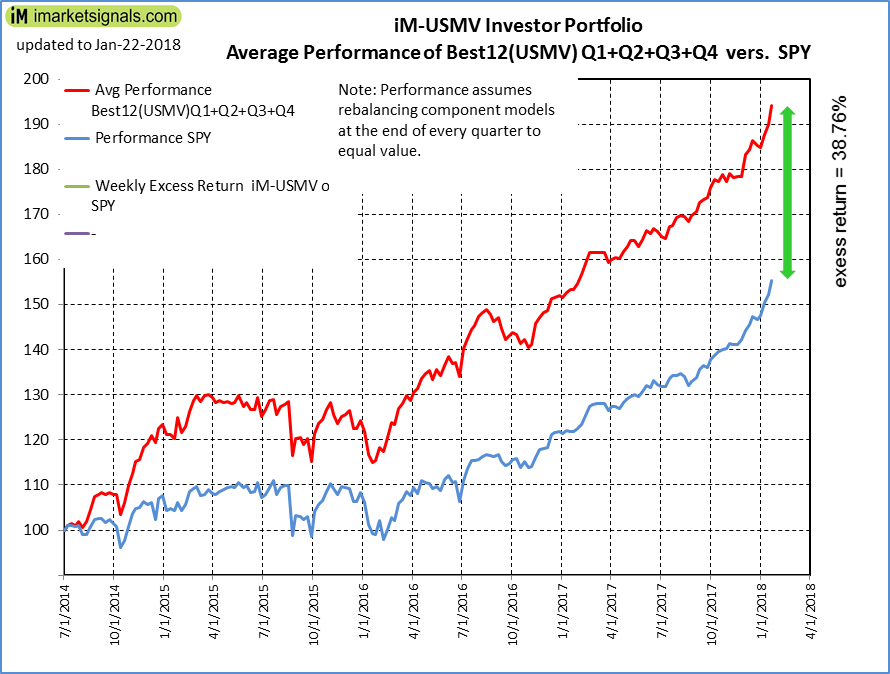 |
Average Performance of iM-Best12(USMV)Q1+Q2+Q3+Q4-Investor resulted in an excess return of 38.76% over SPY. (see iM-USMV Investor Portfolio) |
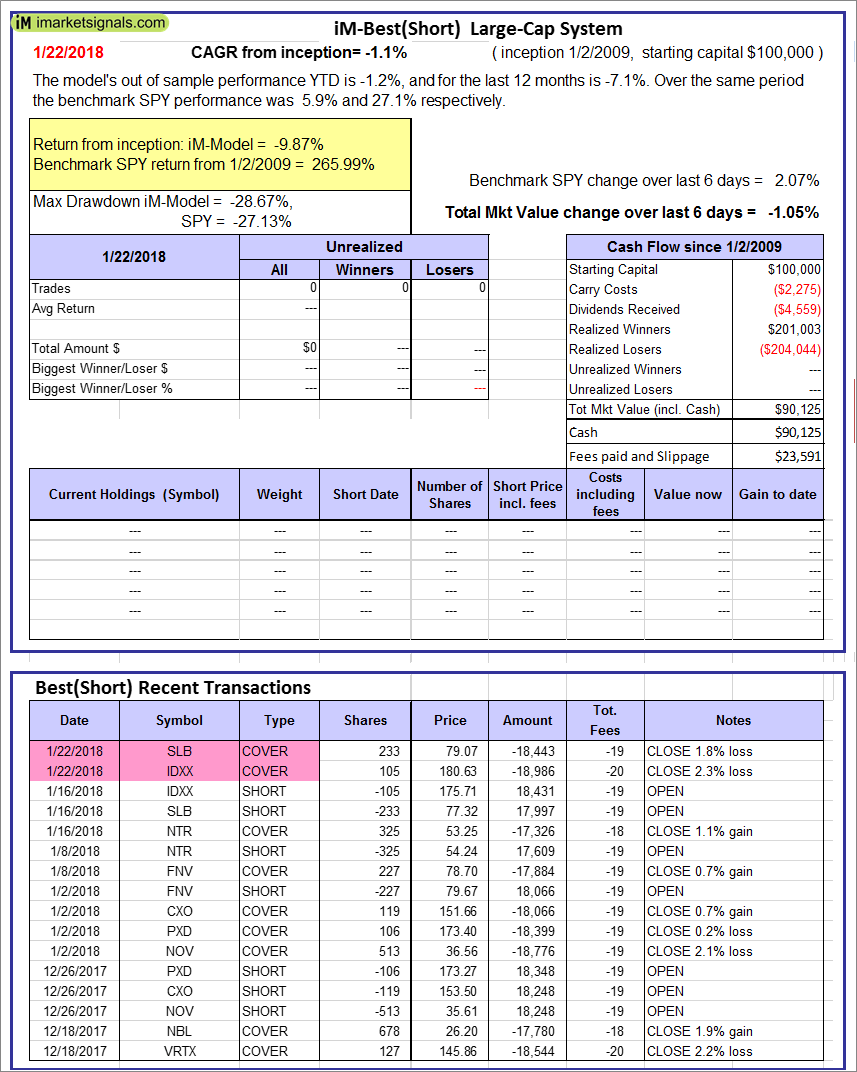 |
iM-Best(Short): The model’s out of sample performance YTD is -1.2%, and for the last 12 months is -7.1%. Over the same period the benchmark SPY performance was 5.9% and 27.1% respectively. Over the previous week the market value of iM-Best(Short) gained -1.05% at a time when SPY gained 2.07%. Over the period 1/2/2009 to 1/22/2018 the starting capital of $100,000 would have grown to $90,125 which includes $90,125 cash and excludes $23,591 spent on fees and slippage. |
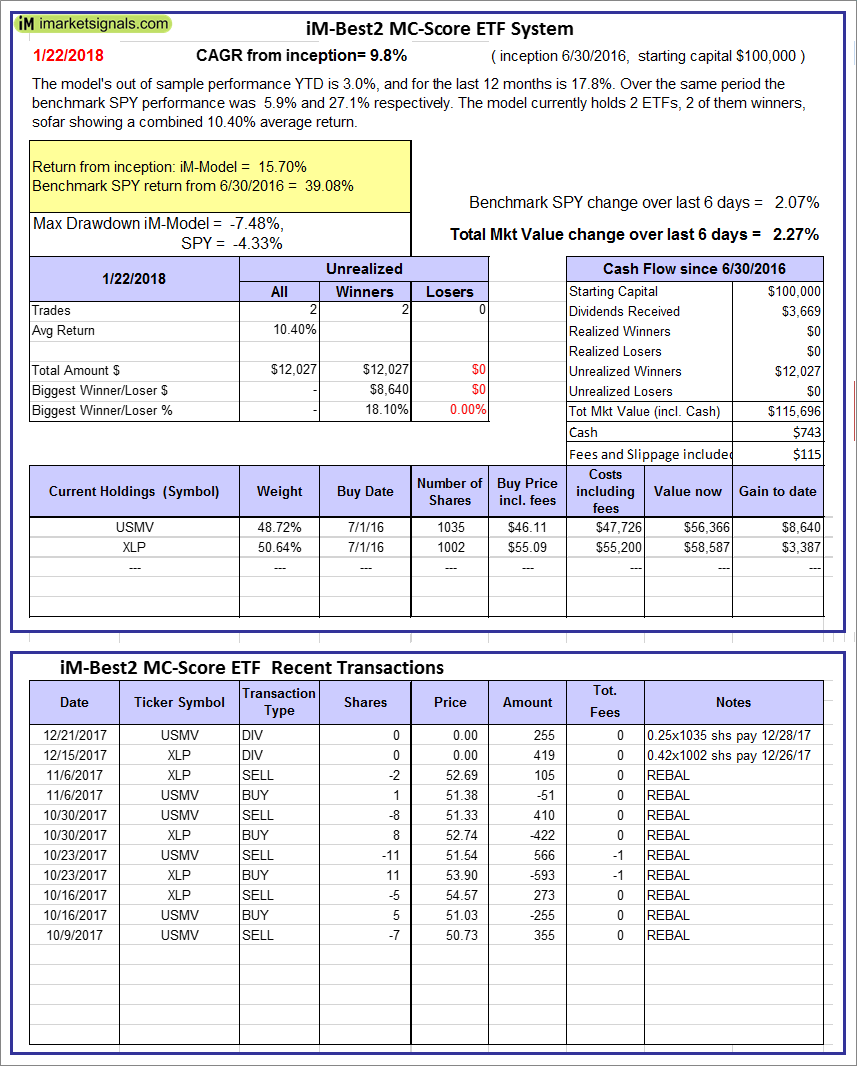 |
iM-Best2 MC-Score ETF System: The model’s out of sample performance YTD is 3.0%, and for the last 12 months is 17.8%. Over the same period the benchmark SPY performance was 5.9% and 27.1% respectively. Over the previous week the market value of the iM-Best2 MC-Score ETF System gained 2.27% at a time when SPY gained 2.07%. A starting capital of $100,000 at inception on 6/30/2016 would have grown to $115,696 which includes $743 cash and excludes $115 spent on fees and slippage. |
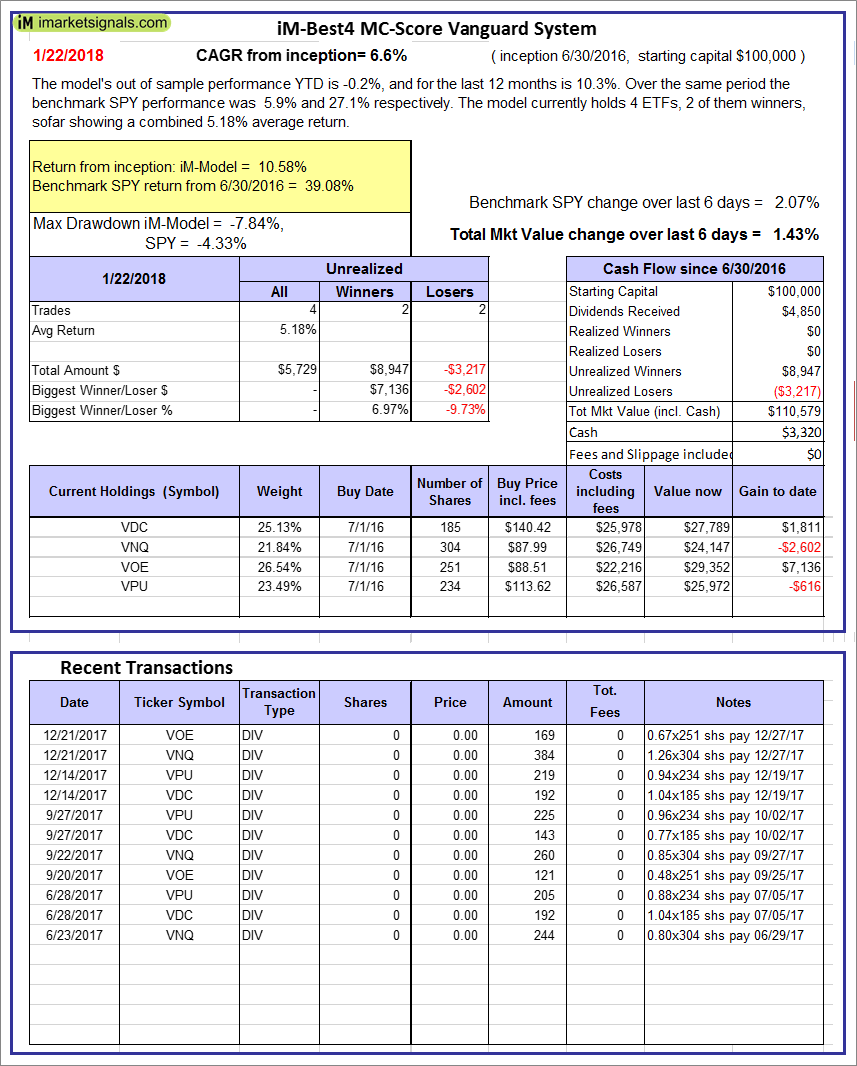 |
iM-Best4 MC-Score Vanguard System: The model’s out of sample performance YTD is -0.2%, and for the last 12 months is 10.3%. Over the same period the benchmark SPY performance was 5.9% and 27.1% respectively. Over the previous week the market value of the iM-Best4 MC-Score Vanguard System gained 1.43% at a time when SPY gained 2.07%. A starting capital of $100,000 at inception on 6/30/2016 would have grown to $110,579 which includes $3,320 cash and excludes $00 spent on fees and slippage. |
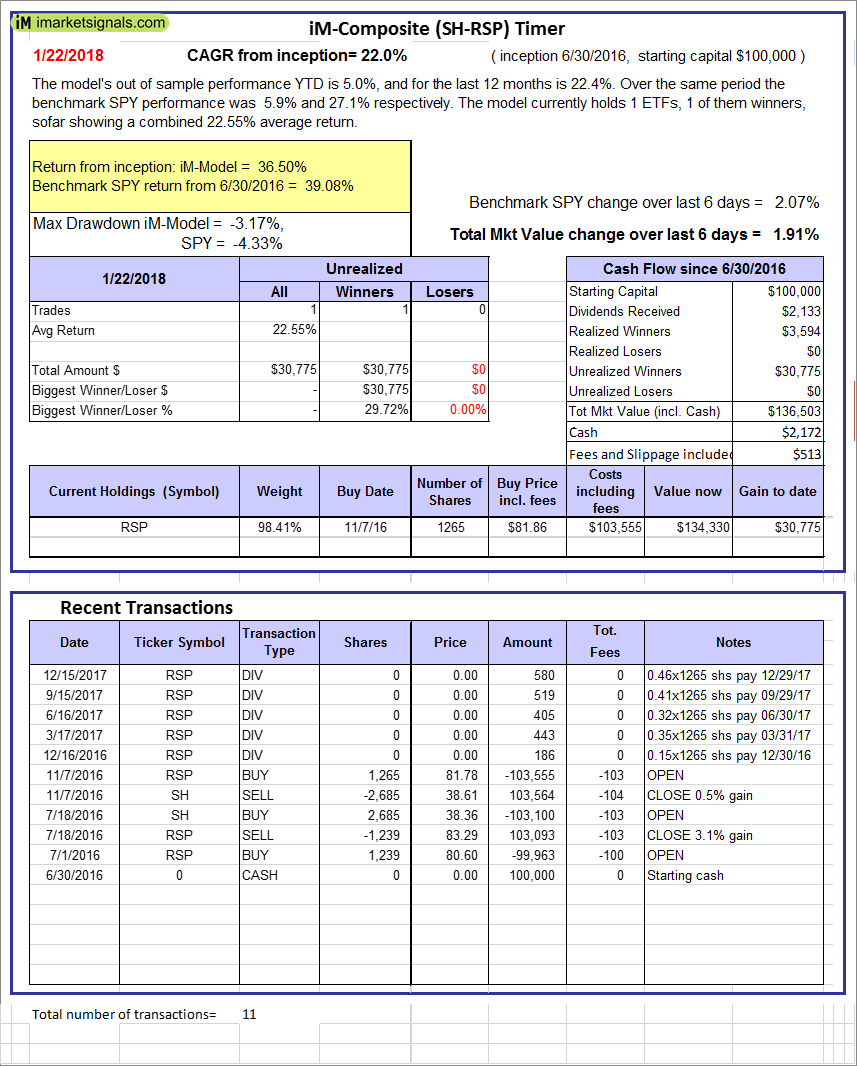 |
iM-Composite (SH-RSP) Timer: The model’s out of sample performance YTD is 5.0%, and for the last 12 months is 22.4%. Over the same period the benchmark SPY performance was 5.9% and 27.1% respectively. Over the previous week the market value of the iM-Composite (SH-RSP) Timer gained 1.91% at a time when SPY gained 2.07%. A starting capital of $100,000 at inception on 6/30/2016 would have grown to $136,503 which includes $2,172 cash and excludes $513 spent on fees and slippage. |
 |
iM-Composite (SPY-IEF) Timer: The model’s out of sample performance YTD is 5.9%, and for the last 12 months is 29.3%. Over the same period the benchmark SPY performance was 5.9% and 27.1% respectively. Over the previous week the market value of the iM-Composite (SPY-IEF) Timer gained 2.04% at a time when SPY gained 2.07%. A starting capital of $100,000 at inception on 6/30/2016 would have grown to $140,482 which includes $833 cash and excludes $1,390 spent on fees and slippage. |
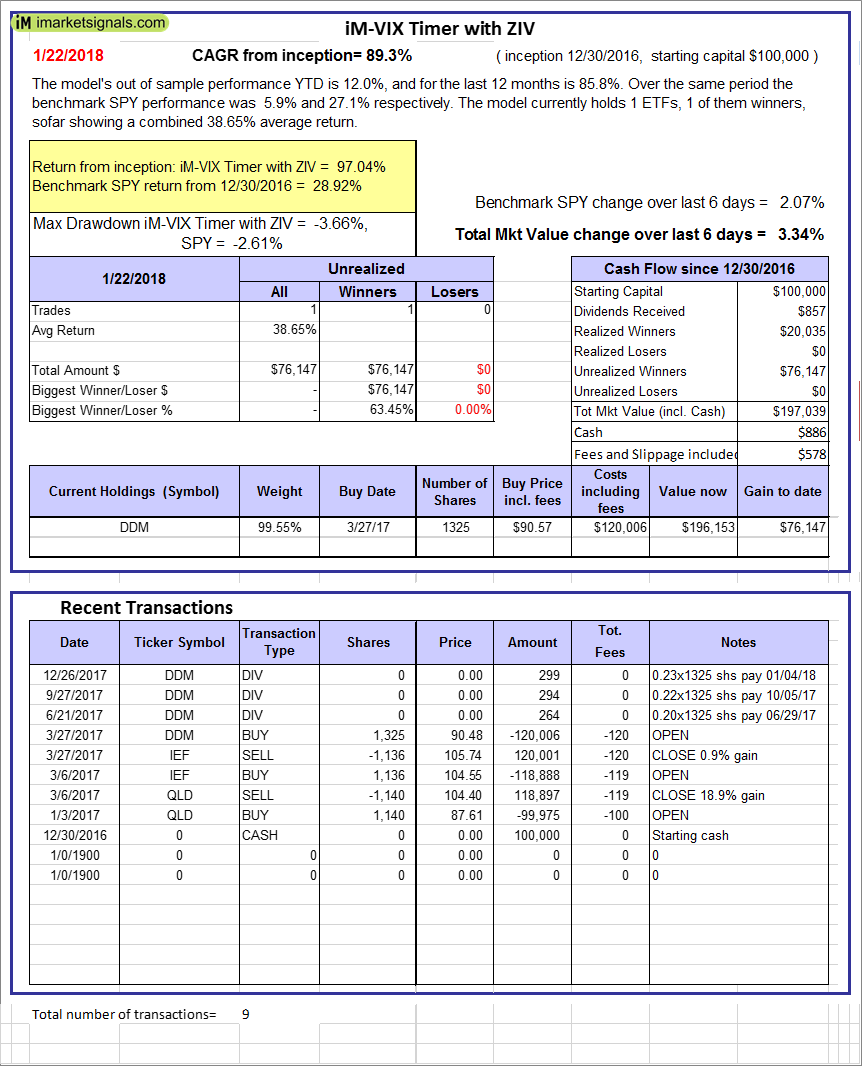 |
iM-VIX Timer with ZIV: The model’s out of sample performance YTD is 12.0%, and for the last 12 months is 85.8%. Over the same period the benchmark SPY performance was 5.9% and 27.1% respectively. Over the previous week the market value of the iM-VIX Timer with ZIV gained 3.34% at a time when SPY gained 2.07%. A starting capital of $100,000 at inception on 6/30/2016 would have grown to $197,039 which includes $886 cash and excludes $578 spent on fees and slippage. |
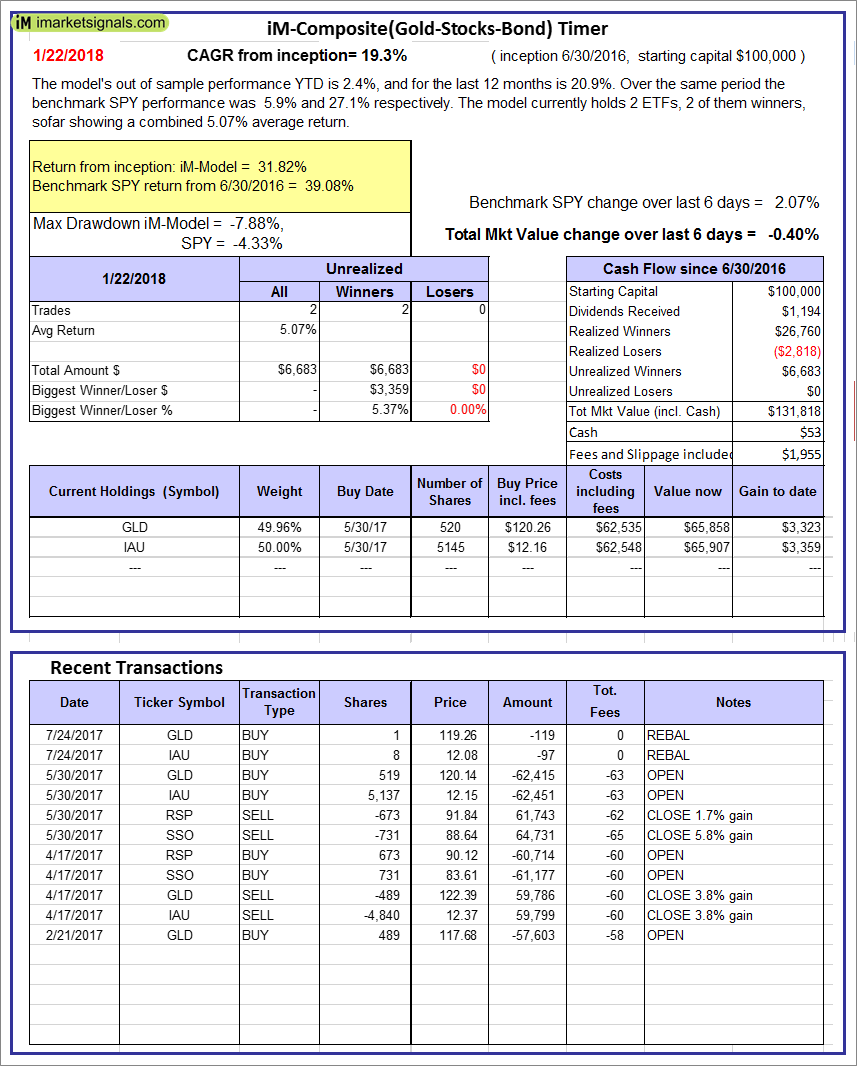 |
iM-Composite(Gold-Stocks-Bond) Timer: The model’s out of sample performance YTD is 2.4%, and for the last 12 months is 20.9%. Over the same period the benchmark SPY performance was 5.9% and 27.1% respectively. Over the previous week the market value of the iM-Composite(Gold-Stocks-Bond) Timer gained -0.40% at a time when SPY gained 2.07%. A starting capital of $100,000 at inception on 6/30/2016 would have grown to $131,818 which includes $53 cash and excludes $1,955 spent on fees and slippage. |
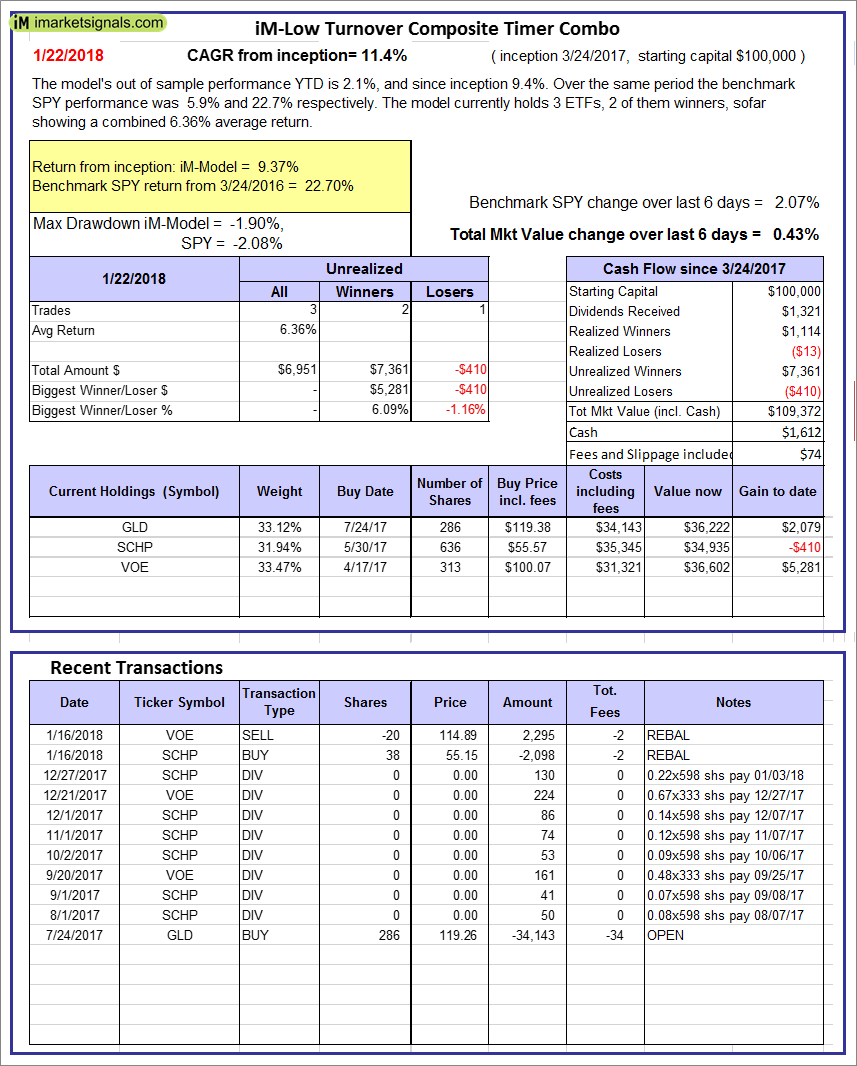 |
iM-Low Turnover Composite Timer Combo: The model’s out of sample performance YTD is 2.1%, and since inception 9.4%. Over the same period the benchmark SPY performance was 5.9% and 22.7% respectively. Over the previous week the market value of the iM-Low Turnover Composite Timer Combo gained 0.43% at a time when SPY gained 2.07%. A starting capital of $100,000 at inception on 3/24/27 would have grown to $109,372 which includes $1,612 cash and excludes $74 spent on fees and slippage. |
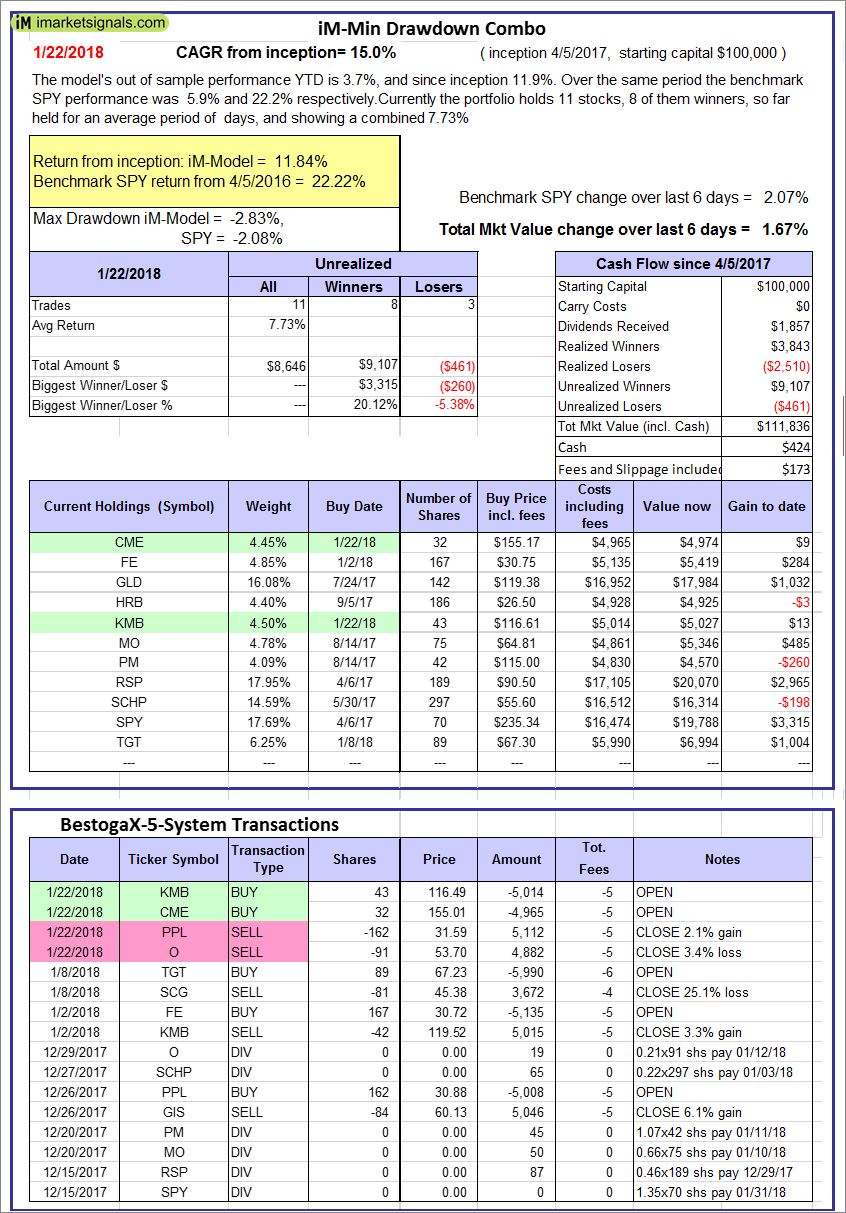 |
iM-Min Drawdown Combo: The model’s out of sample performance YTD is 3.7%, and since inception 11.9%. Over the same period the benchmark SPY performance was 5.9% and 22.2% respectively. Over the previous week the market value of the iM-Min Drawdown Combo gained 1.67% at a time when SPY gained 2.07%. A starting capital of $100,000 at inception on 4/5/2017 would have grown to $111,836 which includes $424 cash and excludes $173 spent on fees and slippage. |
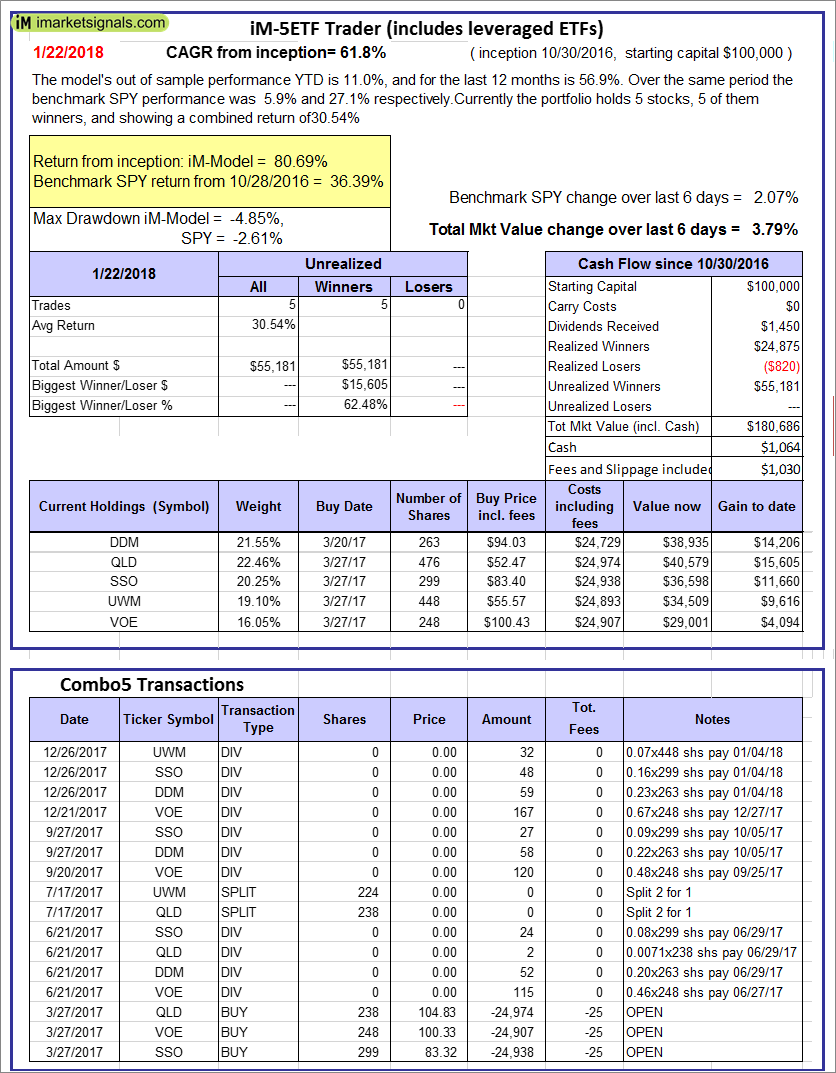 |
iM-5ETF Trader (includes leveraged ETFs): The model’s out of sample performance YTD is 11.0%, and for the last 12 months is 56.9%. Over the same period the benchmark SPY performance was 5.9% and 27.1% respectively. Over the previous week the market value of the iM-5ETF Trader (includes leveraged ETFs) gained 3.79% at a time when SPY gained 2.07%. A starting capital of $100,000 at inception on 10/30/2016 would have grown to $180,686 which includes $1,064 cash and excludes $1,030 spent on fees and slippage. |
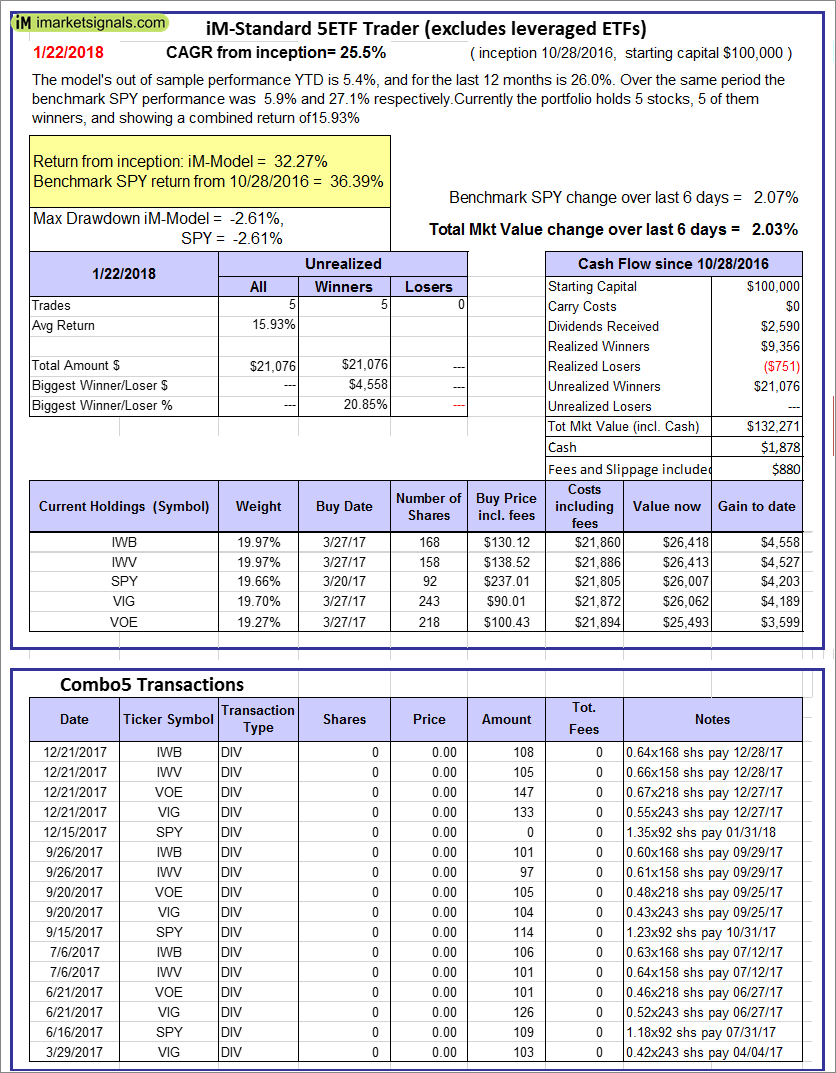 |
iM-Standard 5ETF Trader (excludes leveraged ETFs): The model’s out of sample performance YTD is 5.4%, and for the last 12 months is 26.0%. Over the same period the benchmark SPY performance was 5.9% and 27.1% respectively. Over the previous week the market value of the iM-Standard 5ETF Trader (excludes leveraged ETFs) gained 2.03% at a time when SPY gained 2.07%. A starting capital of $100,000 at inception on 10/30/2016 would have grown to $132,271 which includes $1,878 cash and excludes $880 spent on fees and slippage. |
iM-Best Reports – 1/22/2018
Posted in pmp SPY-SH
Leave a Reply
You must be logged in to post a comment.