  |
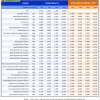
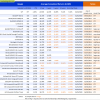
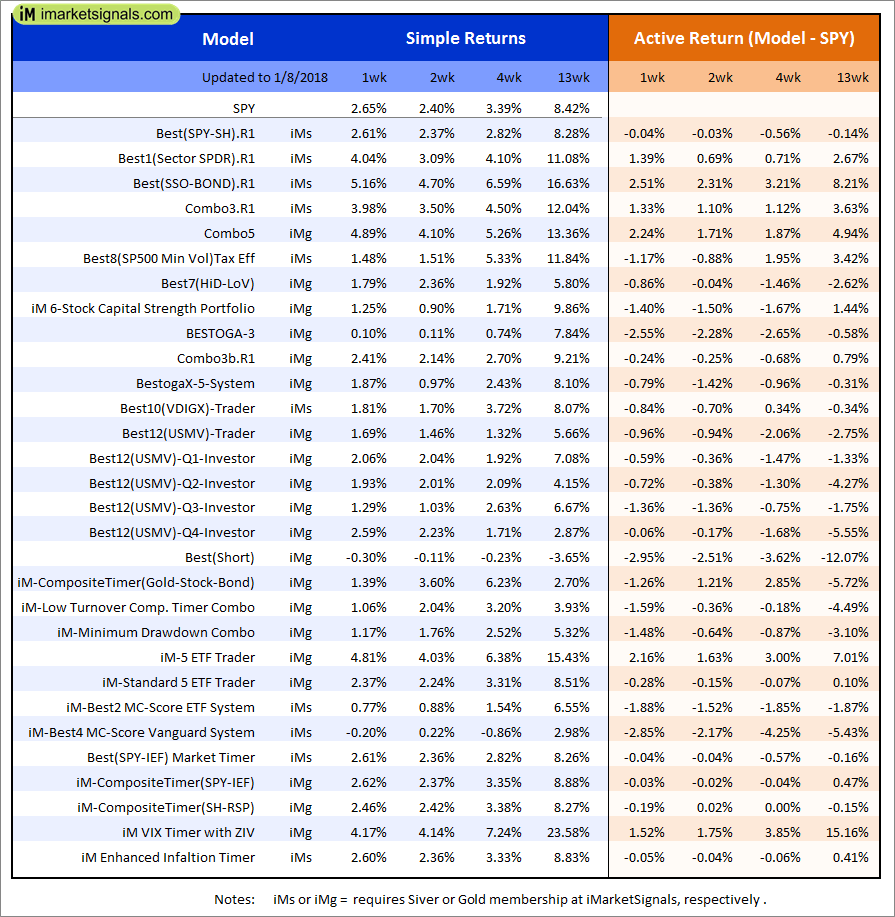
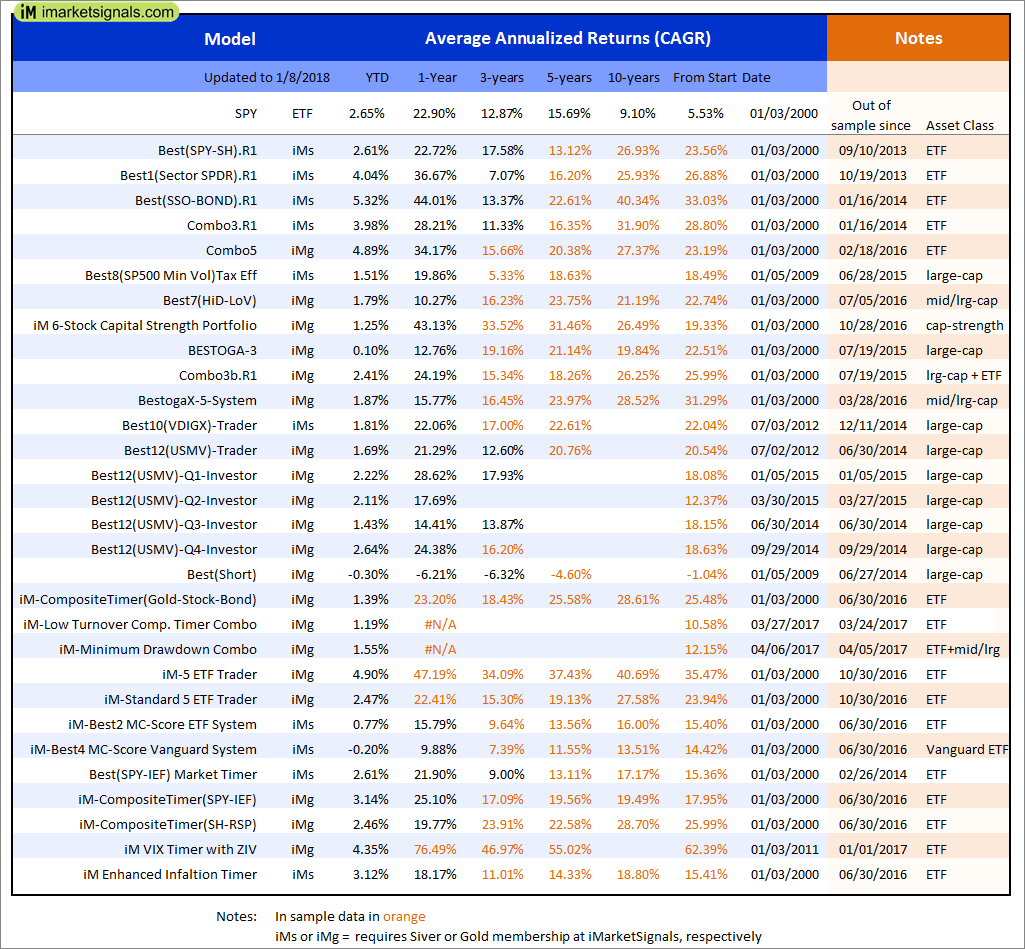
Out of sample performance summary of our models for the past 1, 2, 4 and 13 week periods. The active active return indicates how the models over- or underperformed the benchmark ETF SPY. Also the YTD, and the 1-, 3-, 5- and 10-year annualized returns are shown in the second table |
|
|
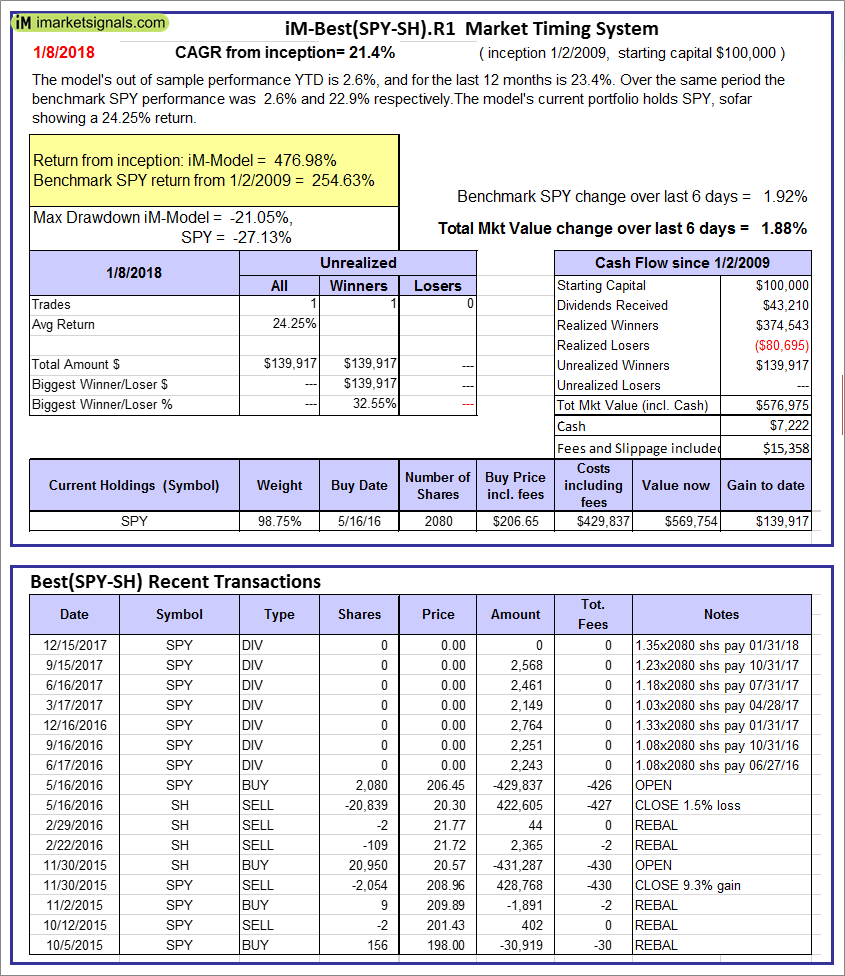
iM-Best(SPY-SH).R1: The model’s out of sample performance YTD is 2.6%, and for the last 12 months is 23.4%. Over the same period the benchmark SPY performance was 2.6% and 22.9% respectively. Over the previous week the market value of Best(SPY-SH) gained 1.88% at a time when SPY gained 1.92%. A starting capital of $100,000 at inception on 1/2/2009 would have grown to $576,975 which includes $7,222 cash and excludes $15,358 spent on fees and slippage. |
|
|
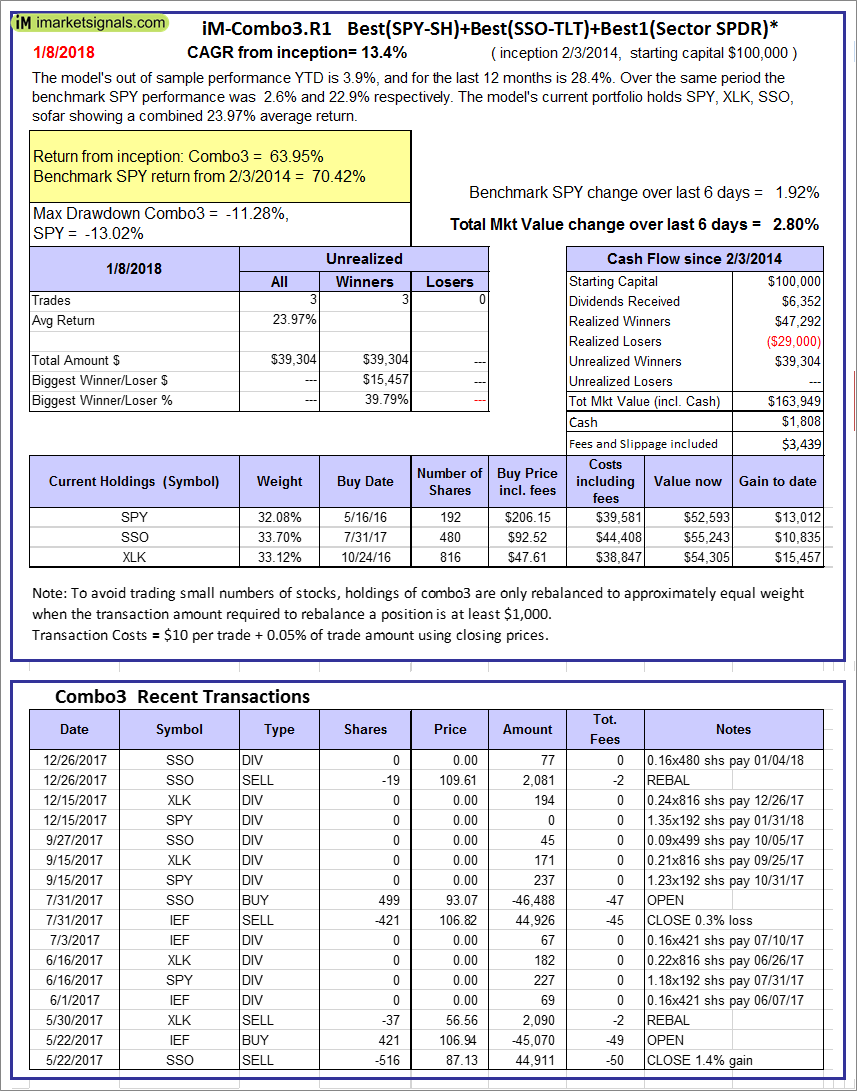
iM-Combo3.R1: The model’s out of sample performance YTD is 3.9%, and for the last 12 months is 28.4%. Over the same period the benchmark SPY performance was 2.6% and 22.9% respectively. Over the previous week the market value of iM-Combo3.R1 gained 2.80% at a time when SPY gained 1.92%. A starting capital of $100,000 at inception on 2/3/2014 would have grown to $163,949 which includes $1,808 cash and excludes $3,439 spent on fees and slippage. |
|
|
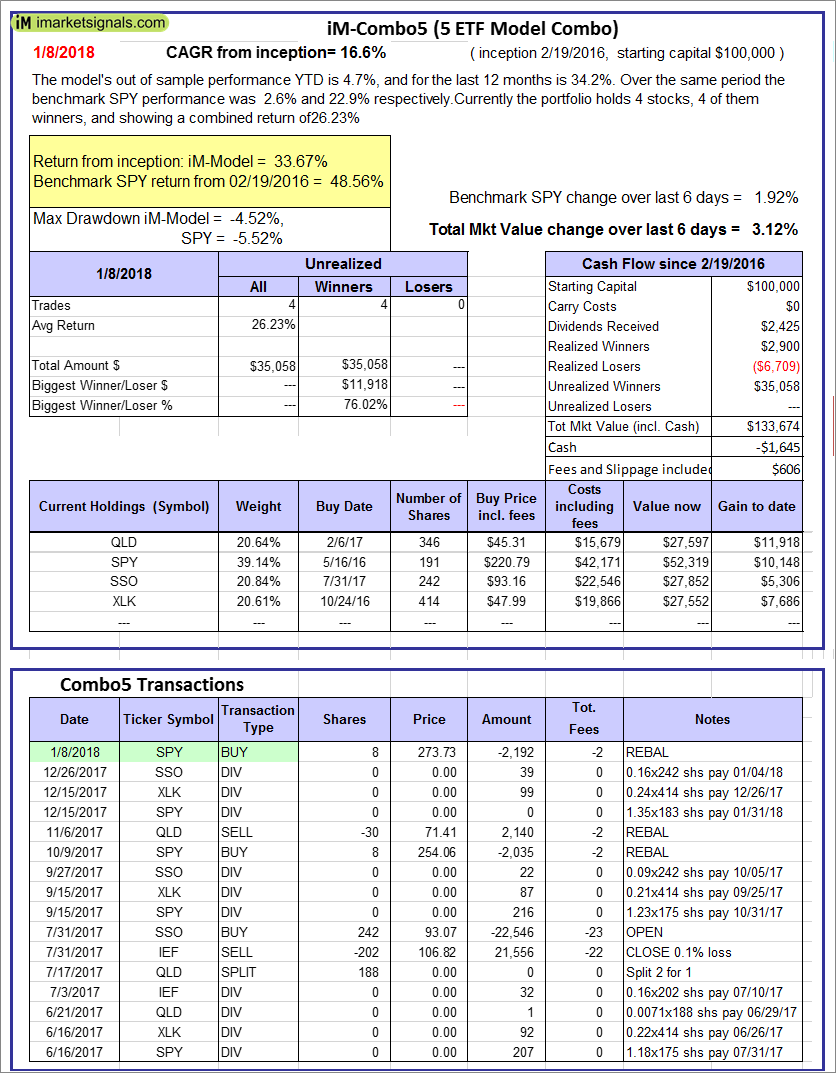
iM-Combo5: The model’s out of sample performance YTD is 4.7%, and for the last 12 months is 34.2%. Over the same period the benchmark SPY performance was 2.6% and 22.9% respectively. Over the previous week the market value of iM-Combo5 gained 3.12% at a time when SPY gained 1.92%. A starting capital of $100,000 at inception on 2/22/2016 would have grown to $133,674 which includes -$1,645 cash and excludes $606 spent on fees and slippage. |
|
|
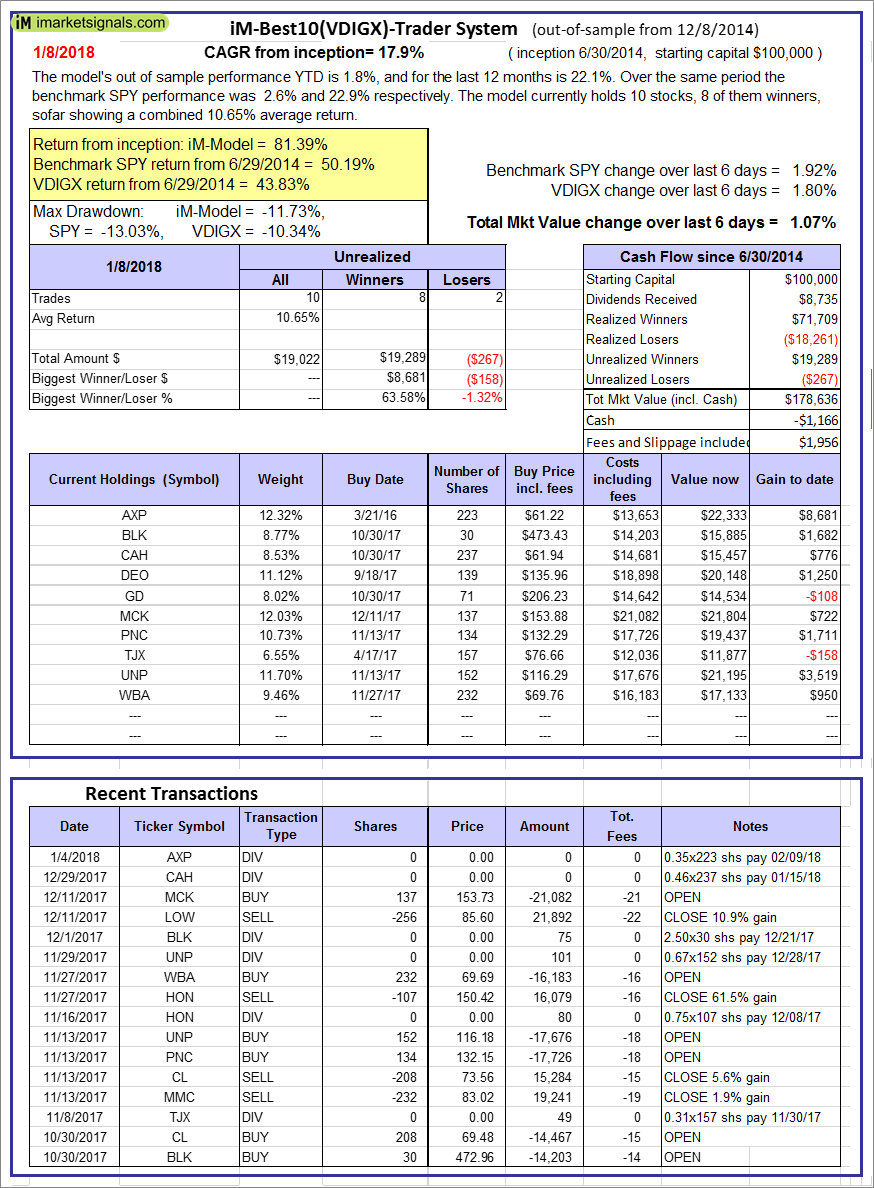
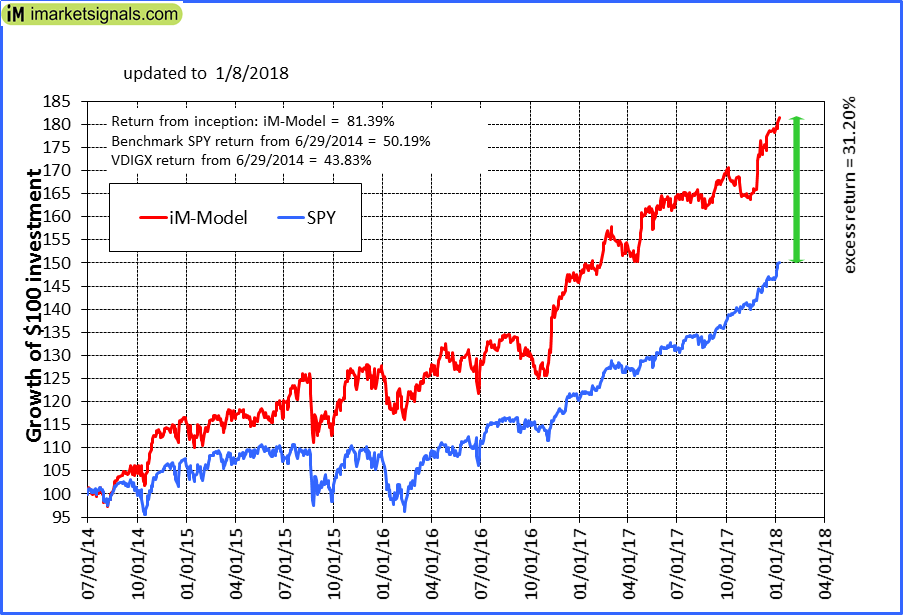
iM-Best10(VDIGX)-Trader: The model’s out of sample performance YTD is 1.8%, and for the last 12 months is 22.1%. Over the same period the benchmark SPY performance was 2.6% and 22.9% respectively. Since inception, on 7/1/2014, the model gained 81.39% while the benchmark SPY gained 50.19% and VDIGX gained 43.83% over the same period. Over the previous week the market value of iM-Best10(VDIGX) gained 1.07% at a time when SPY gained 1.92%. A starting capital of $100,000 at inception on 7/1/2014 would have grown to $178,636 which includes -$1,166 cash and excludes $1,956 spent on fees and slippage. |
|
|
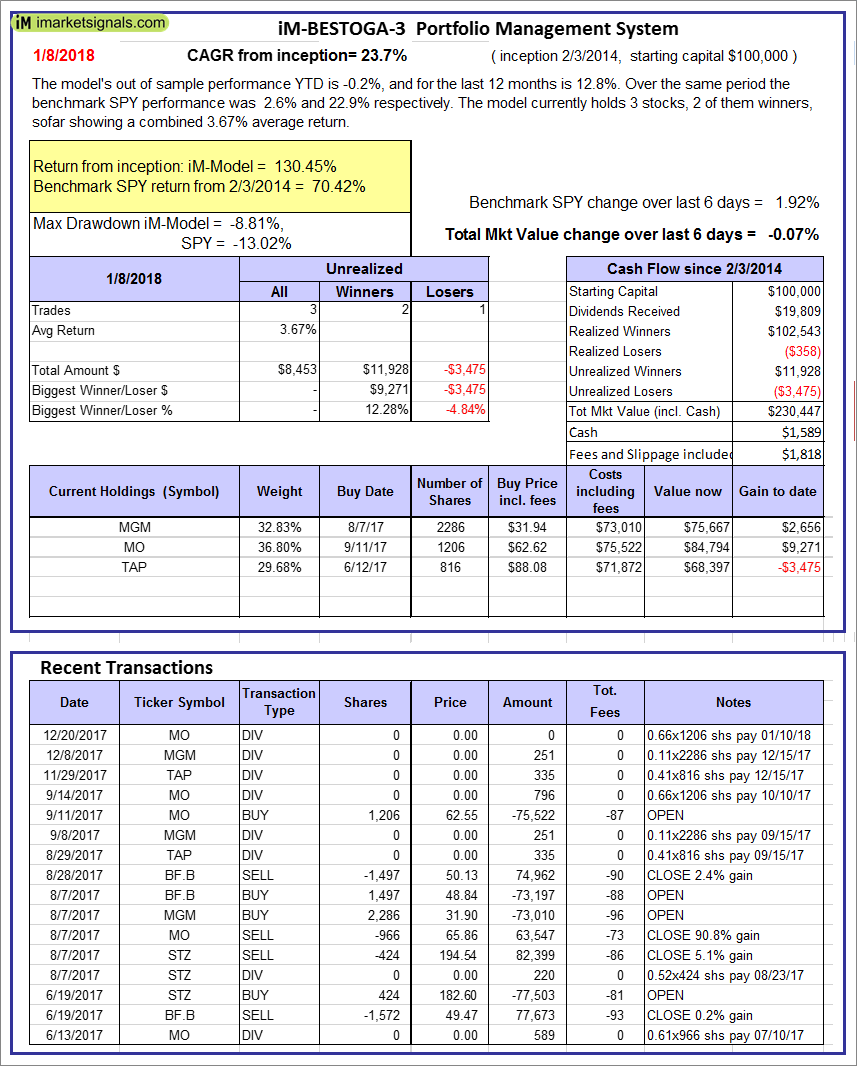
iM-BESTOGA-3: The model’s out of sample performance YTD is -0.2%, and for the last 12 months is 12.8%. Over the same period the benchmark SPY performance was 2.6% and 22.9% respectively. Over the previous week the market value of iM-BESTOGA-3 gained -0.07% at a time when SPY gained 1.92%. A starting capital of $100,000 at inception on 2/3/2014 would have grown to $230,447 which includes $1,589 cash and excludes $1,818 spent on fees and slippage. |
|
|
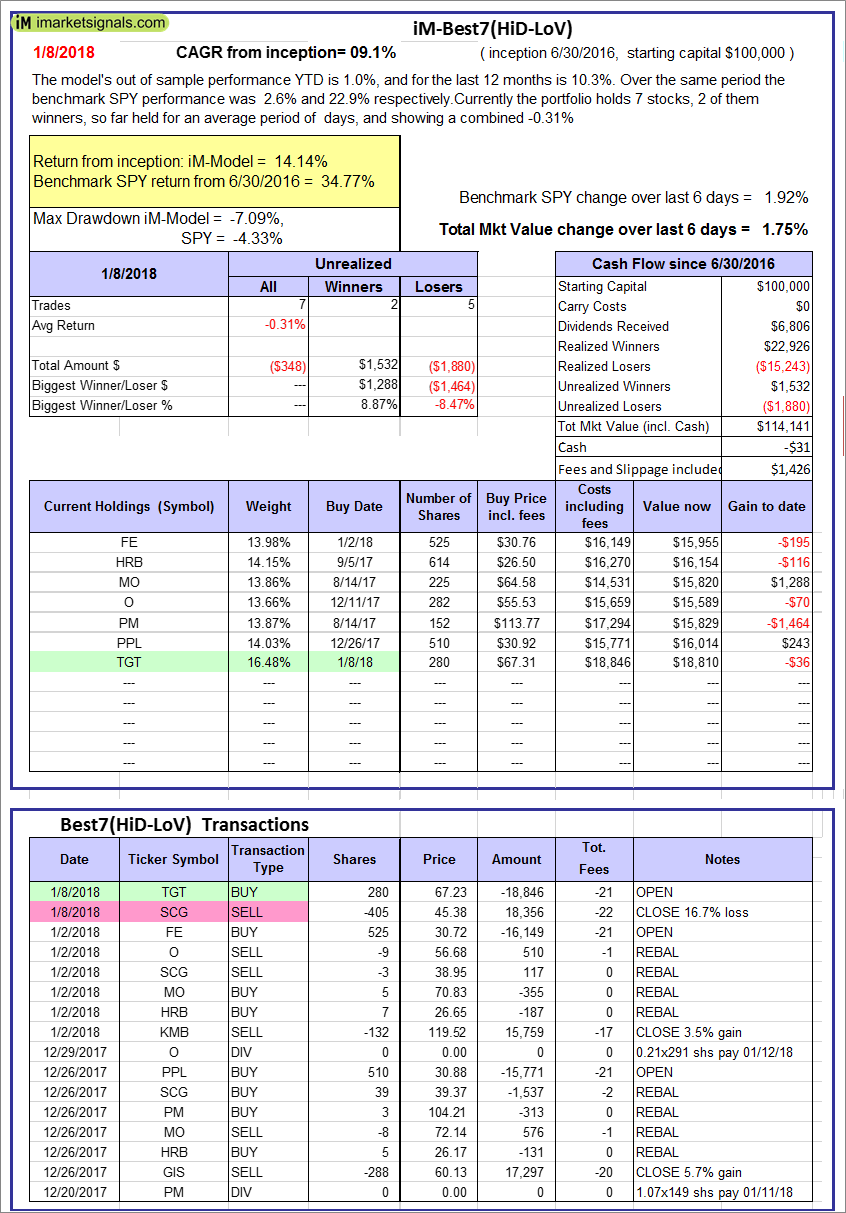
iM-Best7(HiD-LoV): The model’s out of sample performance YTD is 1.0%, and for the last 12 months is 10.3%. Over the same period the benchmark SPY performance was 2.6% and 22.9% respectively. Over the previous week the market value of iM-BESTOGA-3 gained 1.75% at a time when SPY gained 1.92%. A starting capital of $100,000 at inception on 6/30/2016 would have grown to $114,141 which includes -$31 cash and excludes $1,426 spent on fees and slippage. |
|
|
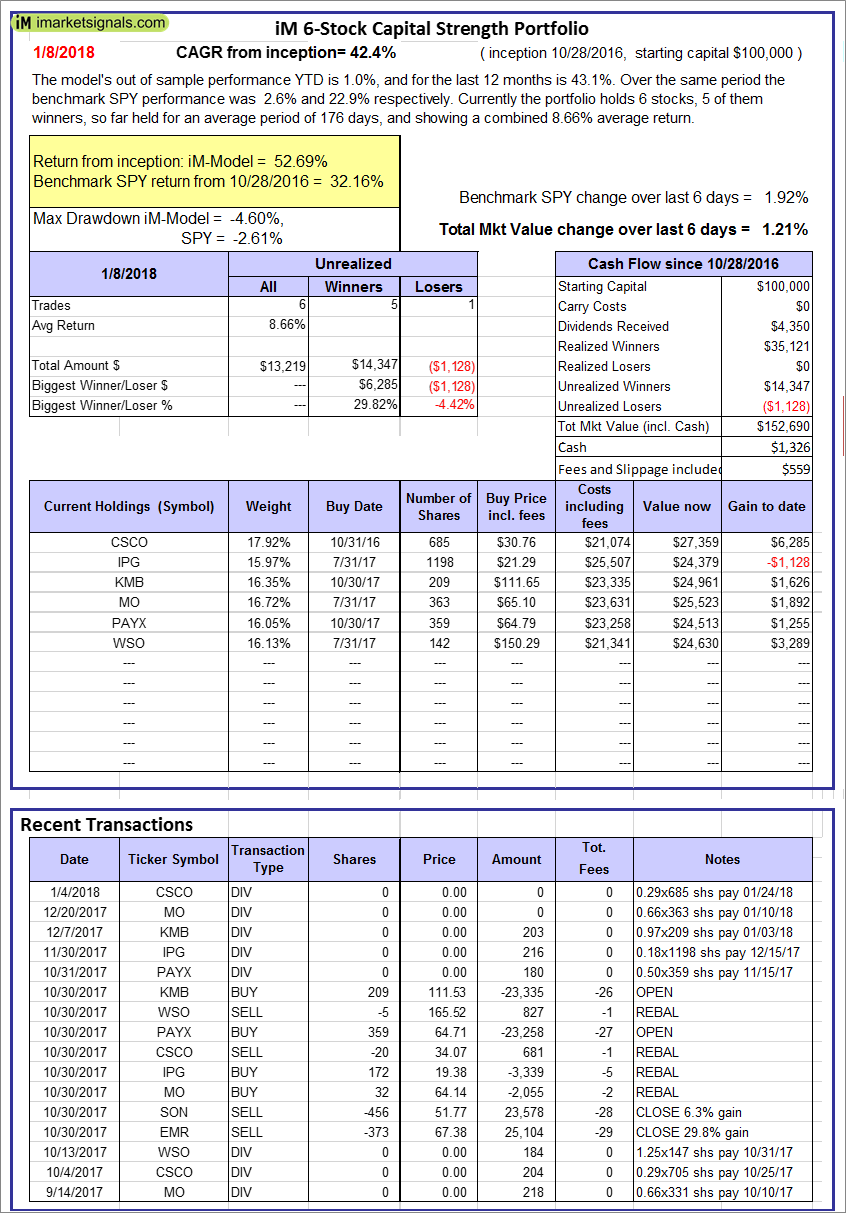
iM 6-Stock Capital Strength Portfolio: The model’s out of sample performance YTD is 1.0%, and for the last 12 months is 43.1%. Over the same period the benchmark SPY performance was 2.6% and 22.9% respectively. Over the previous week the market value of the iM 6-Stock Capital Strength Portfolio gained 1.21% at a time when SPY gained 1.92%. A starting capital of $100,000 at inception on 10/28/2016 would have grown to $152,690 which includes $1,326 cash and excludes $559 spent on fees and slippage. |
|
|
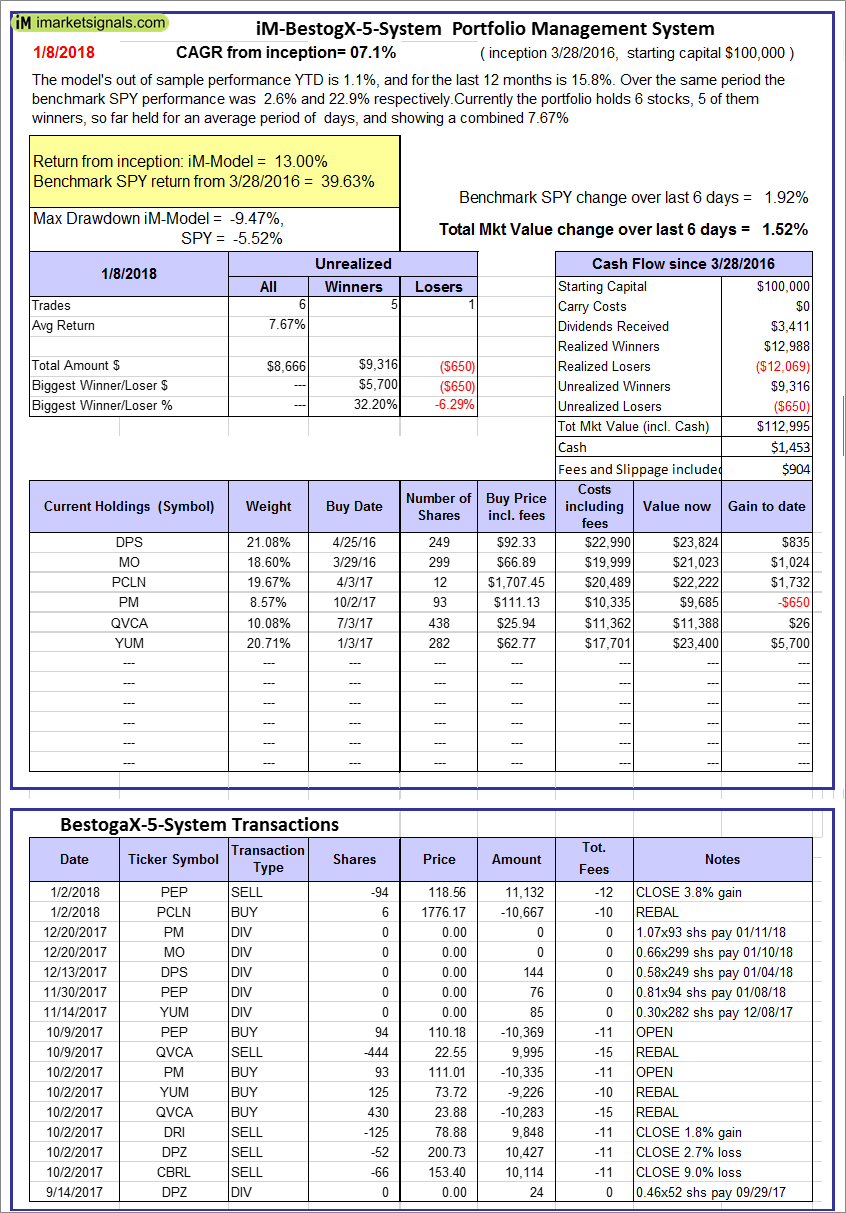
iM-BestogaX5-System: The model’s out of sample performance YTD is 1.1%, and for the last 12 months is 15.8%. Over the same period the benchmark SPY performance was 2.6% and 22.9% respectively. Over the previous week the market value of iM-Best8(S&P 500)Tax-Eff. gained 1.52% at a time when SPY gained 1.92%. A starting capital of $100,000 at inception on 3/28/2016 would have grown to $112,995 which includes $1,453 cash and excludes $904 spent on fees and slippage. |
|
|
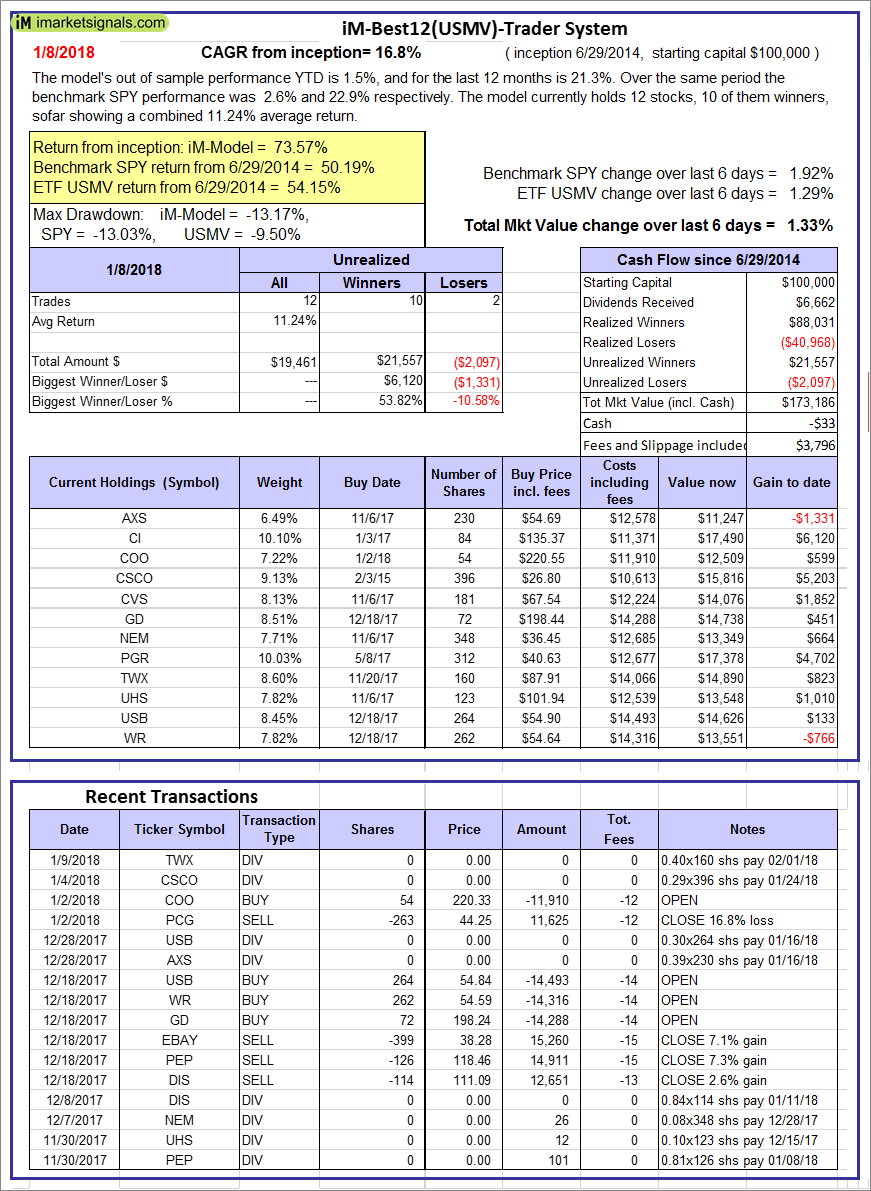
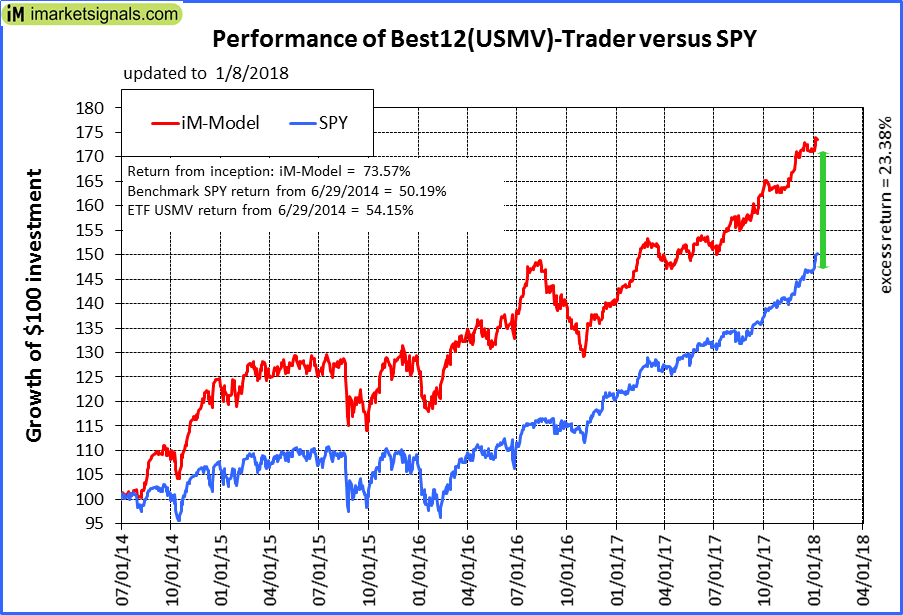
iM-Best12(USMV)-Trader: The model’s out of sample performance YTD is 1.5%, and for the last 12 months is 21.3%. Over the same period the benchmark SPY performance was 2.6% and 22.9% respectively. Since inception, on 6/30/2014, the model gained 73.57% while the benchmark SPY gained 50.19% and the ETF USMV gained 54.15% over the same period. Over the previous week the market value of iM-Best12(USMV)-Trader gained 1.33% at a time when SPY gained 1.92%. A starting capital of $100,000 at inception on 6/30/2014 would have grown to $173,186 which includes -$33 cash and excludes $3,796 spent on fees and slippage. |
|
|
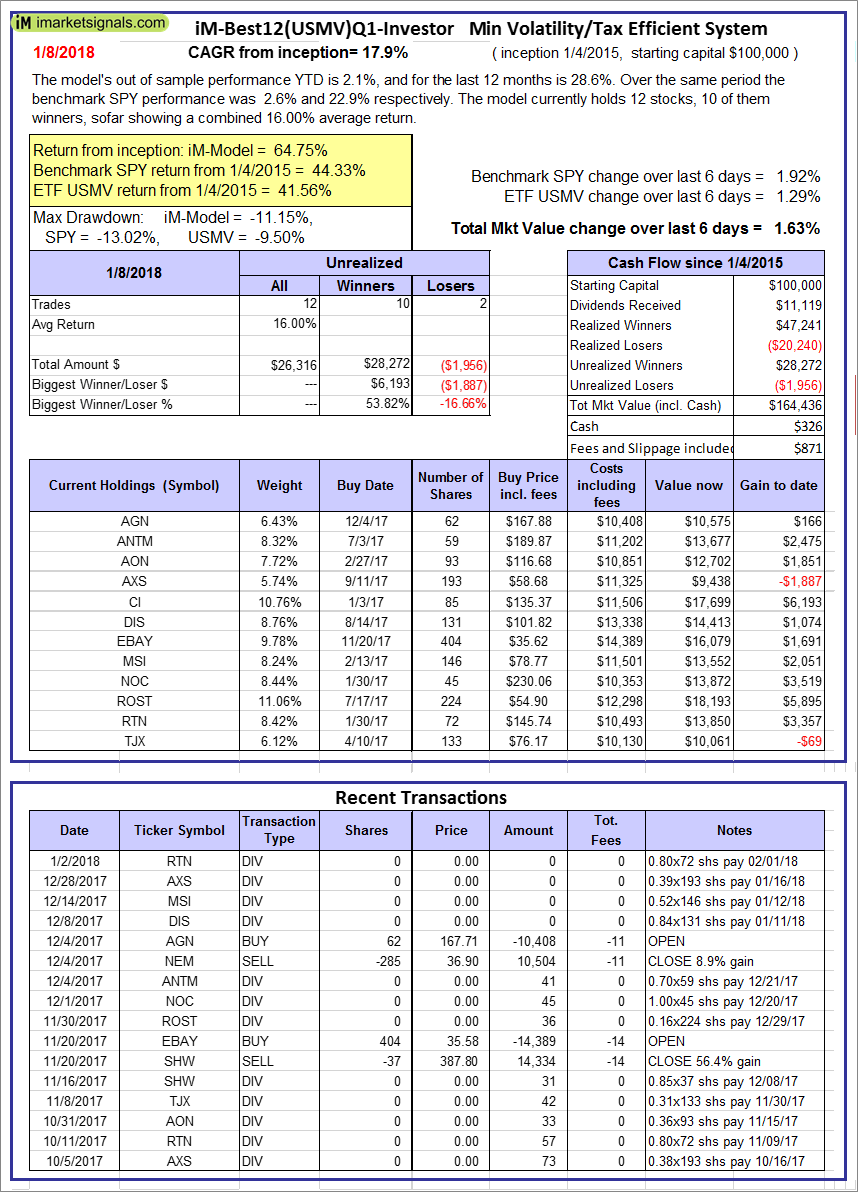
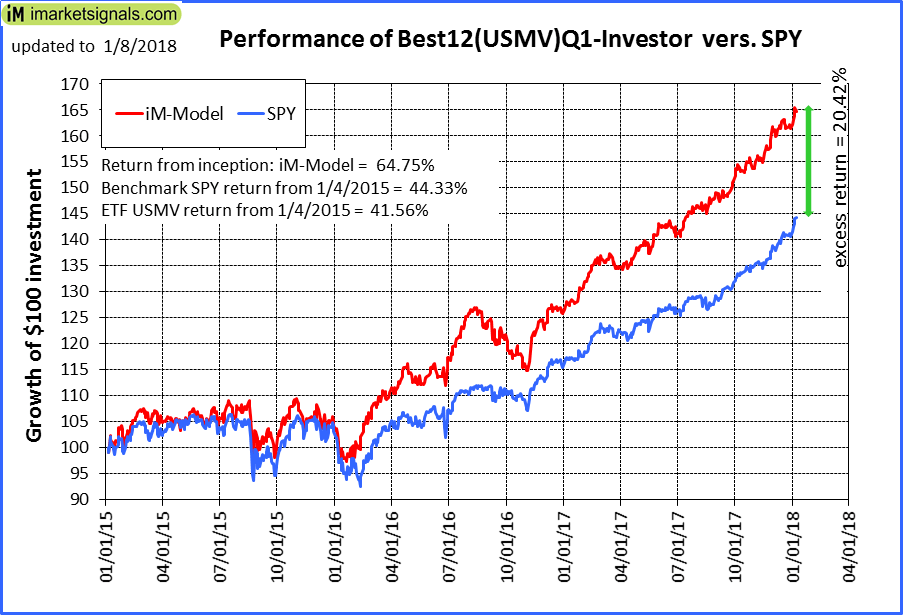
iM-Best12(USMV)Q1-Investor: The model’s out of sample performance YTD is 2.1%, and for the last 12 months is 28.6%. Over the same period the benchmark SPY performance was 2.6% and 22.9% respectively. Since inception, on 1/5/2015, the model gained 64.75% while the benchmark SPY gained 44.33% and the ETF USMV gained 41.56% over the same period. Over the previous week the market value of iM-Best12(USMV)Q1 gained 1.63% at a time when SPY gained 1.92%. A starting capital of $100,000 at inception on 1/5/2015 would have grown to $164,436 which includes $326 cash and excludes $871 spent on fees and slippage. |
|
|
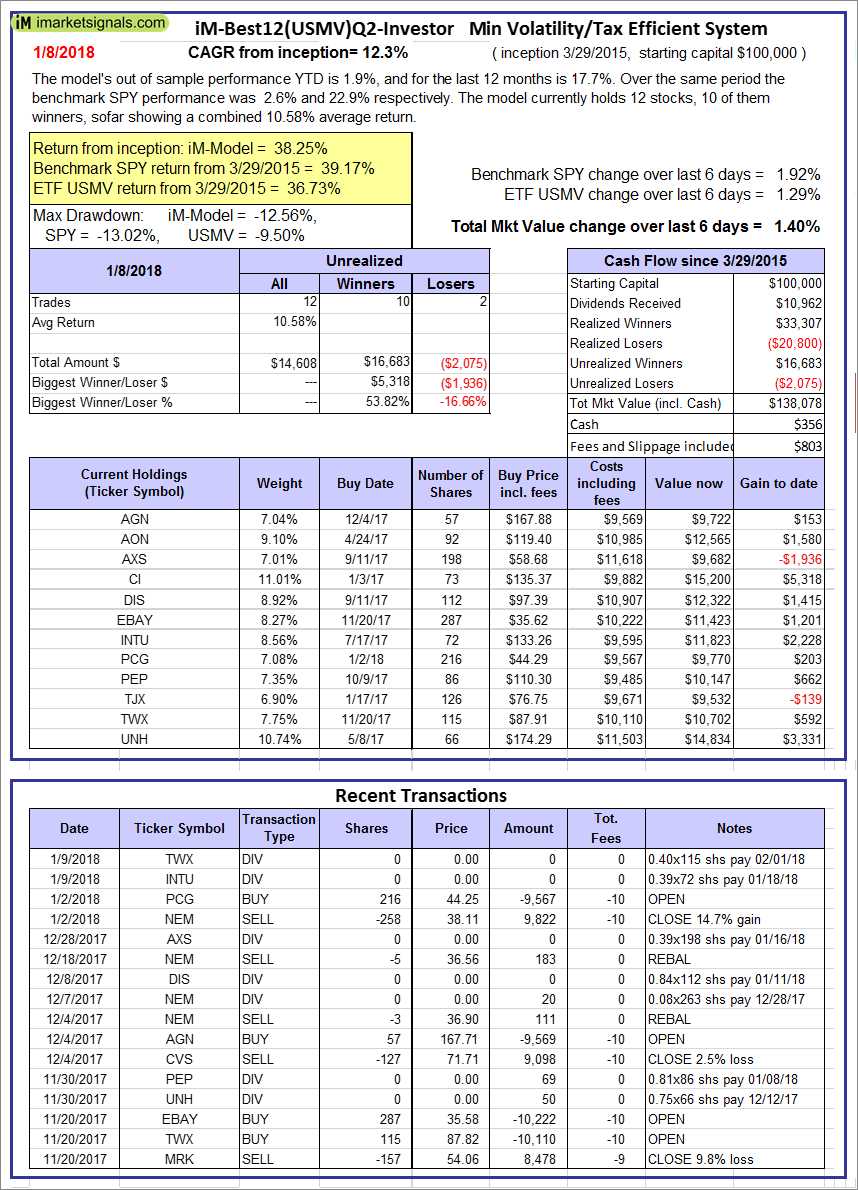
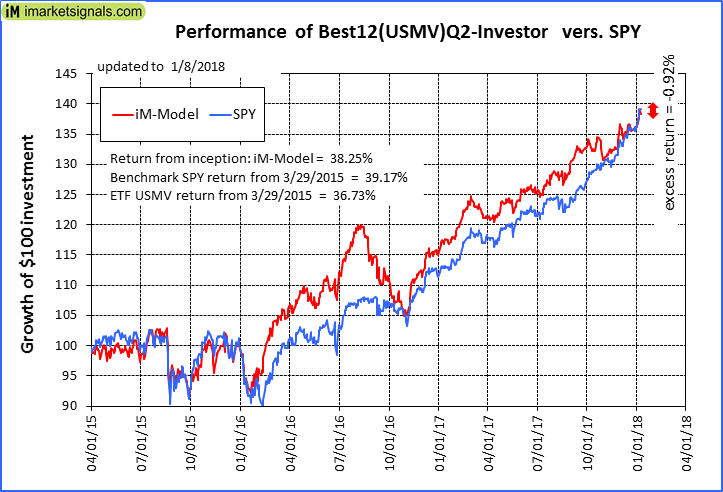
iM-Best12(USMV)Q2-Investor: The model’s out of sample performance YTD is 1.9%, and for the last 12 months is 17.7%. Over the same period the benchmark SPY performance was 2.6% and 22.9% respectively. Since inception, on 3/30/2015, the model gained 38.25% while the benchmark SPY gained 39.17% and the ETF USMV gained 36.73% over the same period. Over the previous week the market value of iM-Best12(USMV)Q2 gained 1.40% at a time when SPY gained 1.92%. A starting capital of $100,000 at inception on 3/30/2015 would have grown to $138,078 which includes $356 cash and excludes $803 spent on fees and slippage. |
|
|
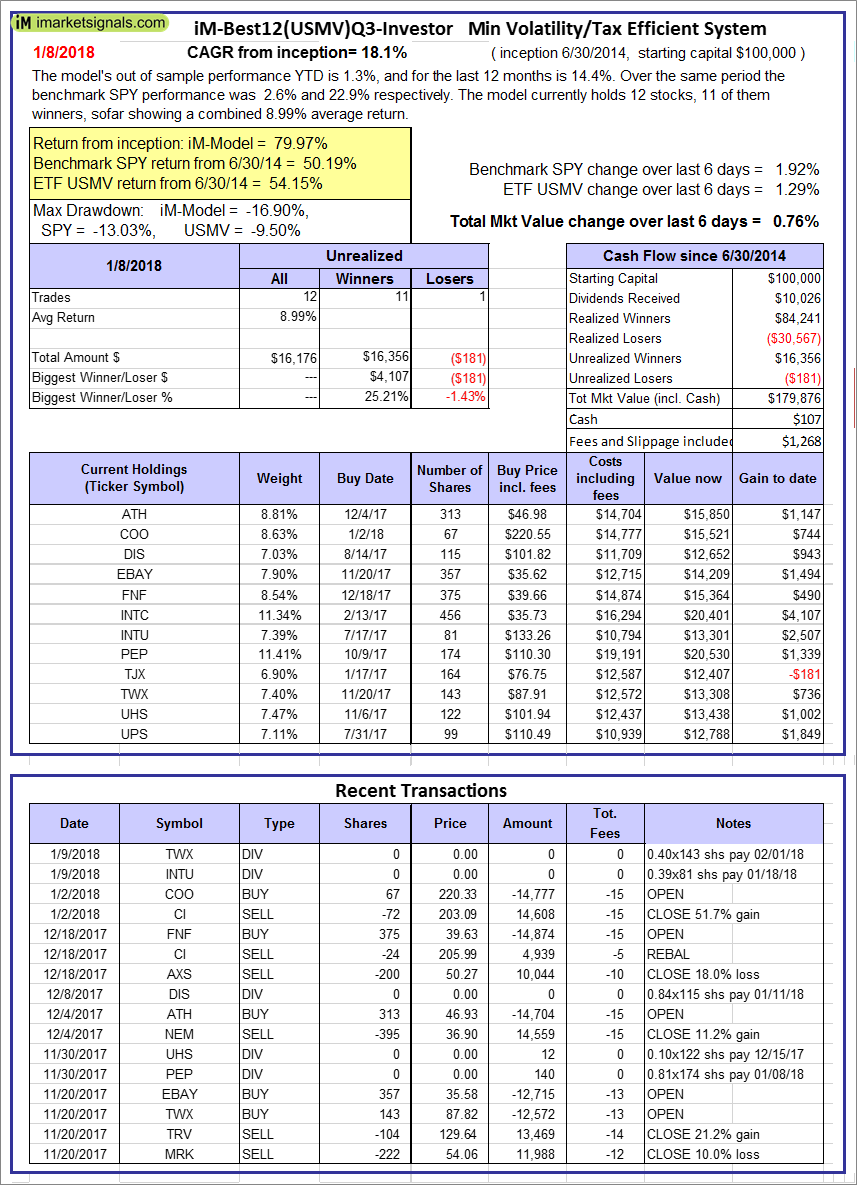
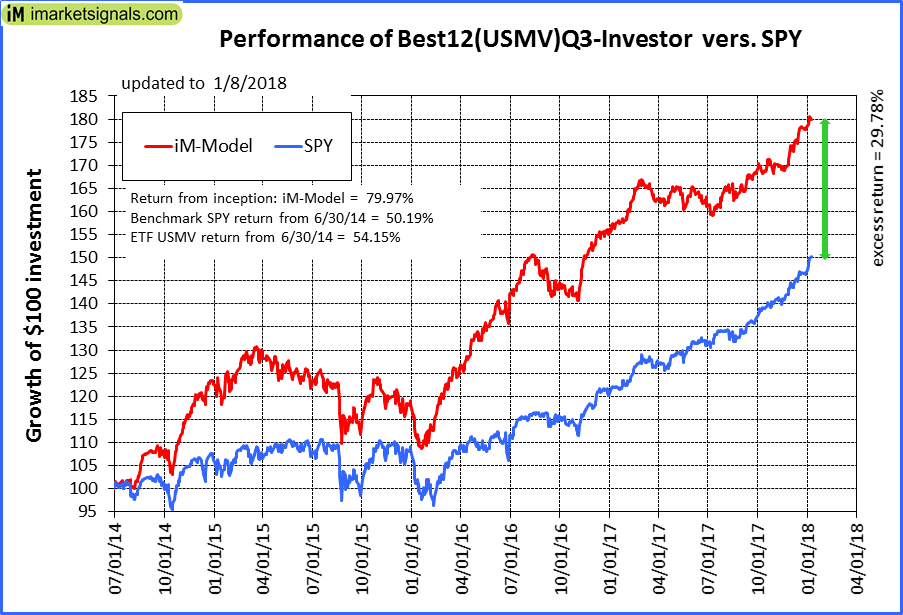
iM-Best12(USMV)Q3-Investor: The model’s out of sample performance YTD is 1.3%, and for the last 12 months is 14.4%. Over the same period the benchmark SPY performance was 2.6% and 22.9% respectively. Since inception, on 7/1/2014, the model gained 79.97% while the benchmark SPY gained 50.19% and the ETF USMV gained 54.15% over the same period. Over the previous week the market value of iM-Best12(USMV)Q3 gained 0.76% at a time when SPY gained 1.92%. A starting capital of $100,000 at inception on 7/1/2014 would have grown to $179,876 which includes $107 cash and excludes $1,268 spent on fees and slippage. |
|
|
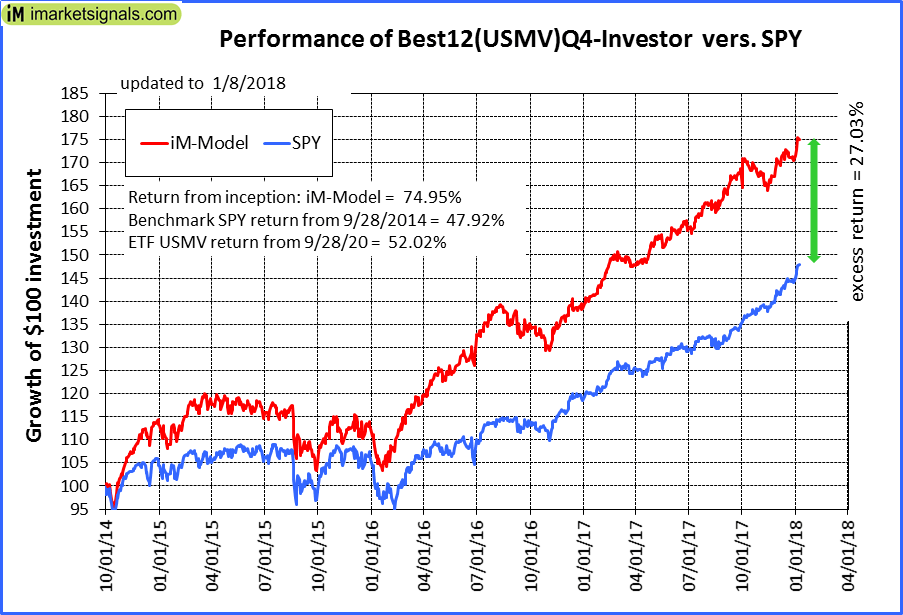
iM-Best12(USMV)Q4-Investor: Since inception, on 9/29/2014, the model gained 74.95% while the benchmark SPY gained 47.92% and the ETF USMV gained 52.02% over the same period. Over the previous week the market value of iM-Best12(USMV)Q4 gained 1.87% at a time when SPY gained 1.92%. A starting capital of $100,000 at inception on 9/29/2014 would have grown to $174,749 which includes -$88 cash and excludes $1,098 spent on fees and slippage. |
|
|
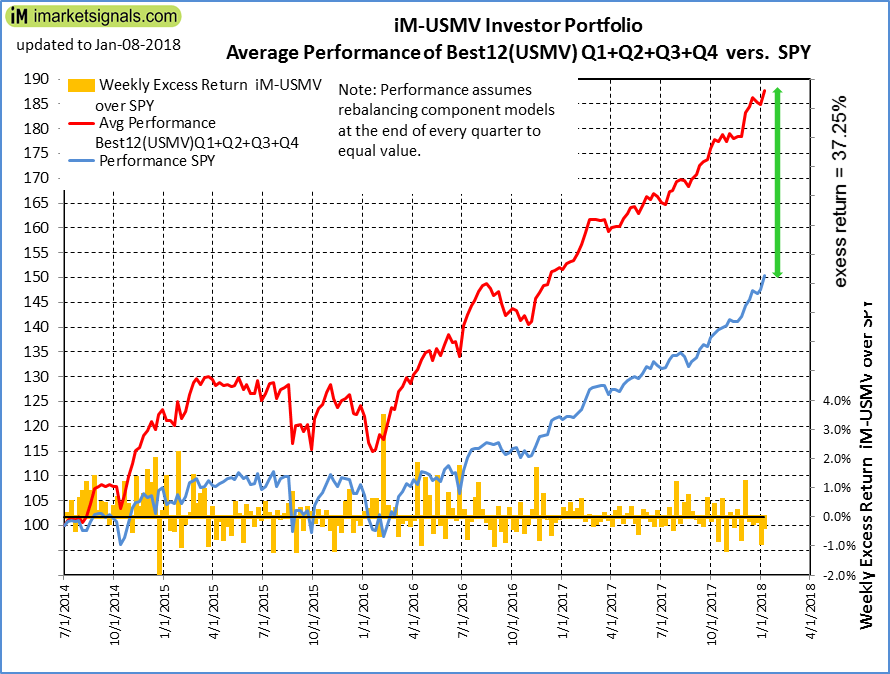
Average Performance of iM-Best12(USMV)Q1+Q2+Q3+Q4-Investor resulted in an excess return of 37.25% over SPY. (see iM-USMV Investor Portfolio) |
|
|
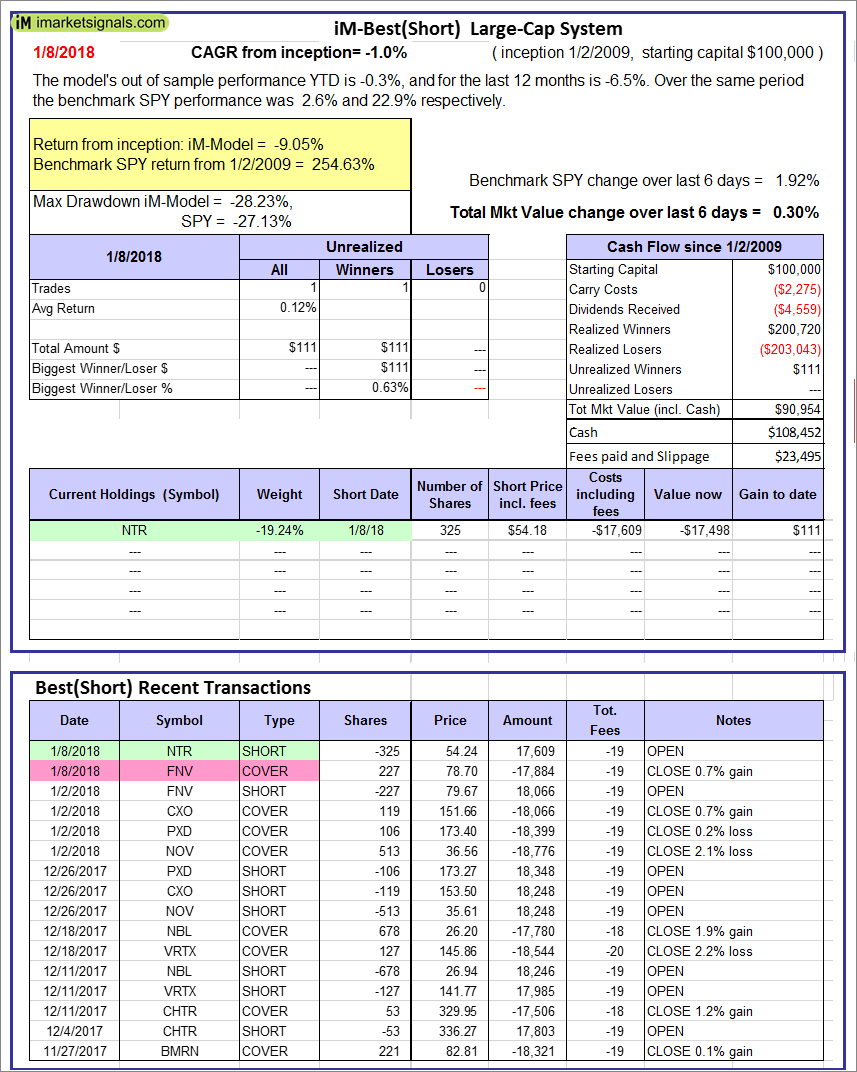
iM-Best(Short): The model’s out of sample performance YTD is -0.3%, and for the last 12 months is -6.5%. Over the same period the benchmark SPY performance was 2.6% and 22.9% respectively. Over the previous week the market value of iM-Best(Short) gained 0.30% at a time when SPY gained 1.92%. Over the period 1/2/2009 to 1/8/2018 the starting capital of $100,000 would have grown to $90,954 which includes $108,452 cash and excludes $23,495 spent on fees and slippage. |
|
|
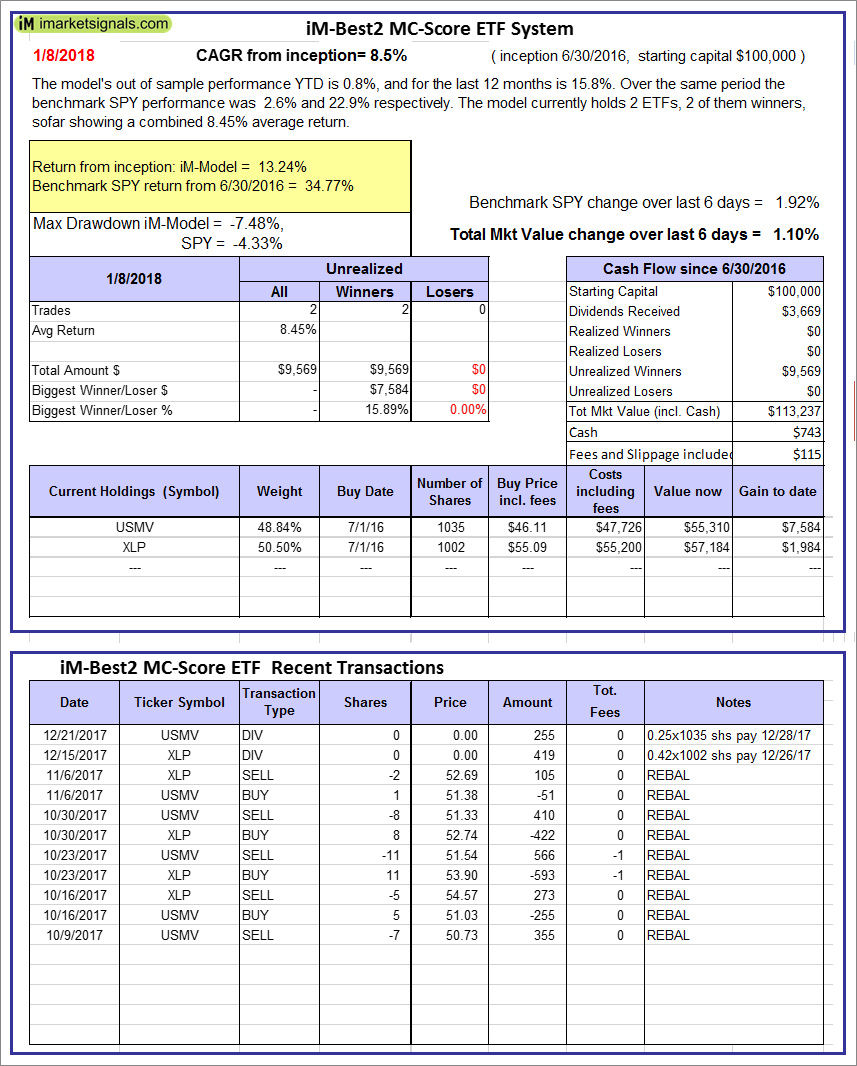
iM-Best2 MC-Score ETF System: The model’s out of sample performance YTD is 0.8%, and for the last 12 months is 15.8%. Over the same period the benchmark SPY performance was 2.6% and 22.9% respectively. Over the previous week the market value of the iM-Best2 MC-Score ETF System gained 1.10% at a time when SPY gained 1.92%. A starting capital of $100,000 at inception on 6/30/2016 would have grown to $113,237 which includes $743 cash and excludes $115 spent on fees and slippage. |
|
|
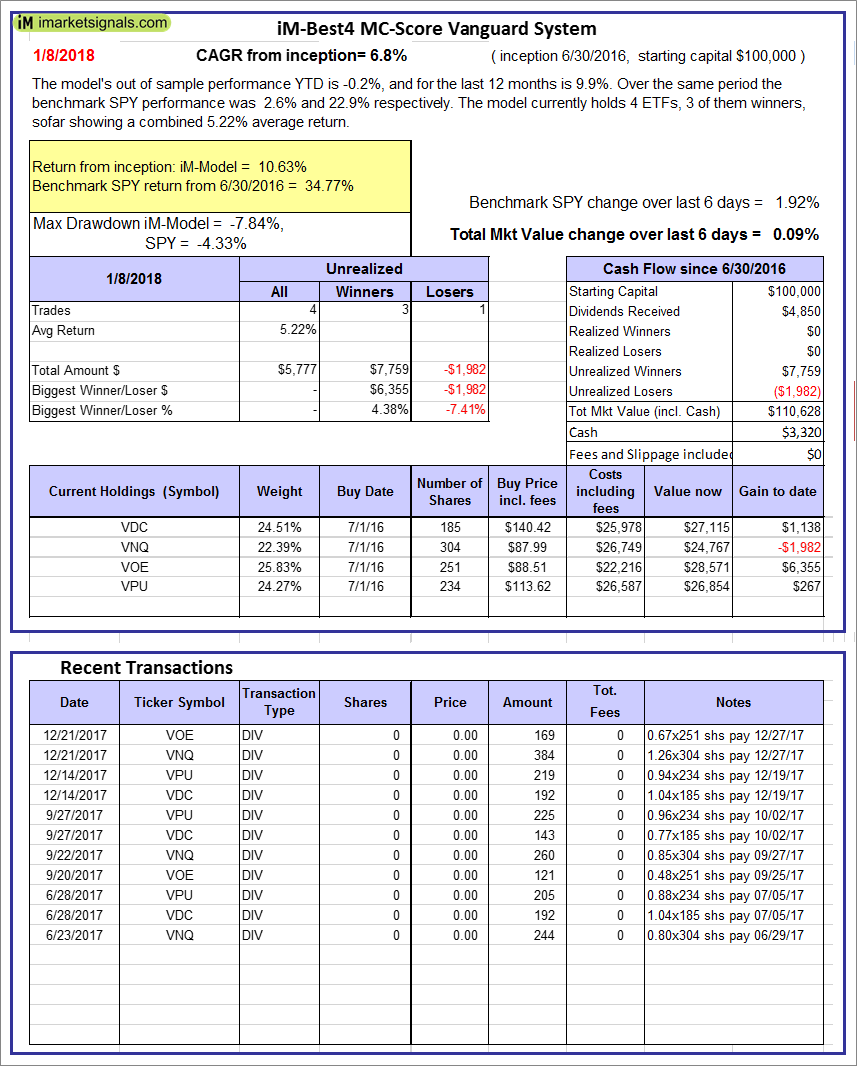
iM-Best4 MC-Score Vanguard System: The model’s out of sample performance YTD is -0.2%, and for the last 12 months is 9.9%. Over the same period the benchmark SPY performance was 2.6% and 22.9% respectively. Over the previous week the market value of the iM-Best4 MC-Score Vanguard System gained 0.09% at a time when SPY gained 1.92%. A starting capital of $100,000 at inception on 6/30/2016 would have grown to $110,628 which includes $3,320 cash and excludes $00 spent on fees and slippage. |
|
|
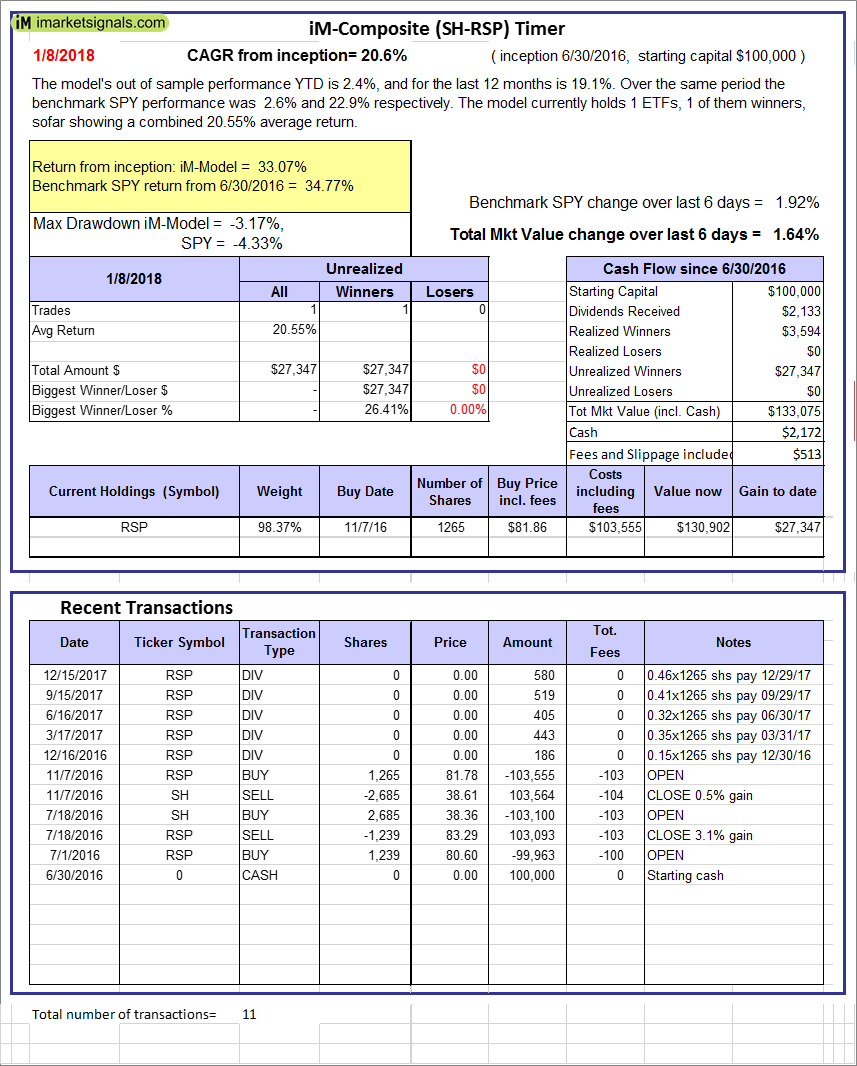
iM-Composite (SH-RSP) Timer: The model’s out of sample performance YTD is 2.4%, and for the last 12 months is 19.1%. Over the same period the benchmark SPY performance was 2.6% and 22.9% respectively. Over the previous week the market value of the iM-Composite (SH-RSP) Timer gained 1.64% at a time when SPY gained 1.92%. A starting capital of $100,000 at inception on 6/30/2016 would have grown to $133,075 which includes $2,172 cash and excludes $513 spent on fees and slippage. |
|
|
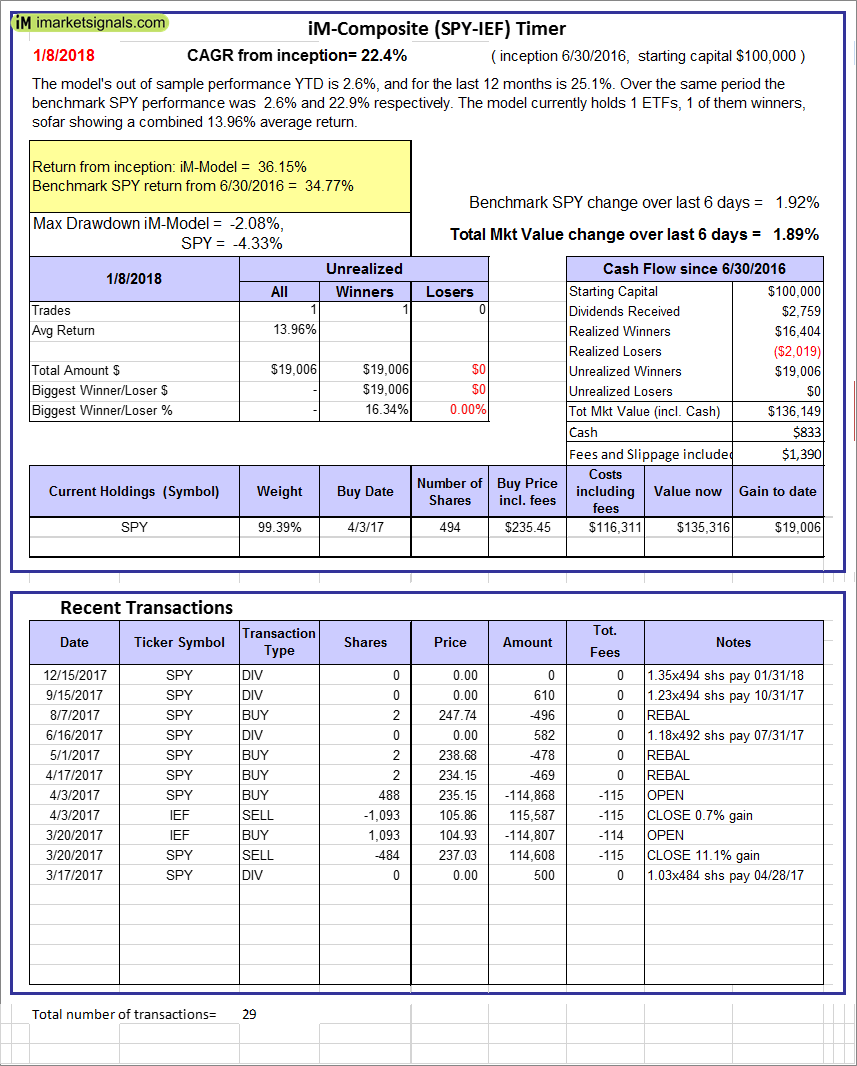
iM-Composite (SPY-IEF) Timer: The model’s out of sample performance YTD is 2.6%, and for the last 12 months is 25.1%. Over the same period the benchmark SPY performance was 2.6% and 22.9% respectively. Over the previous week the market value of the iM-Composite (SPY-IEF) Timer gained 1.89% at a time when SPY gained 1.92%. A starting capital of $100,000 at inception on 6/30/2016 would have grown to $136,149 which includes $833 cash and excludes $1,390 spent on fees and slippage. |
|
|
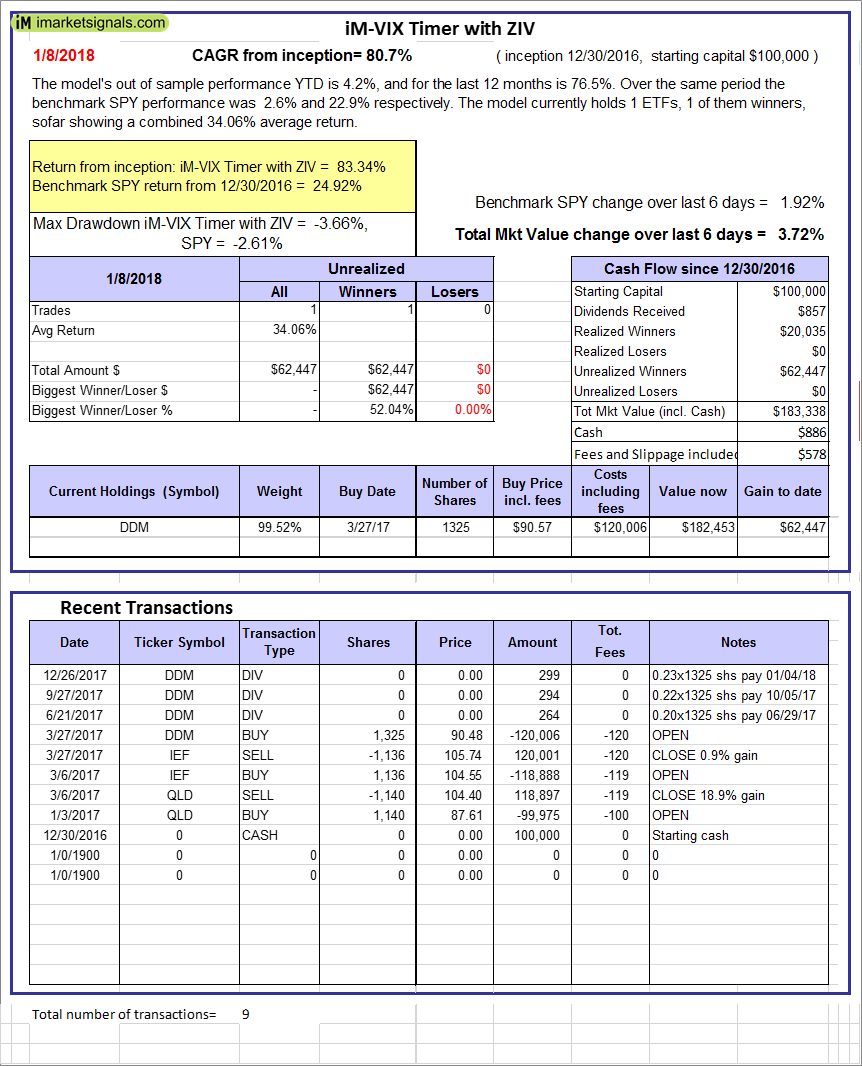
iM-VIX Timer with ZIV: The model’s out of sample performance YTD is 4.2%, and for the last 12 months is 76.5%. Over the same period the benchmark SPY performance was 2.6% and 22.9% respectively. Over the previous week the market value of the iM-VIX Timer with ZIV gained 3.72% at a time when SPY gained 1.92%. A starting capital of $100,000 at inception on 6/30/2016 would have grown to $183,338 which includes $886 cash and excludes $578 spent on fees and slippage. |
|
|
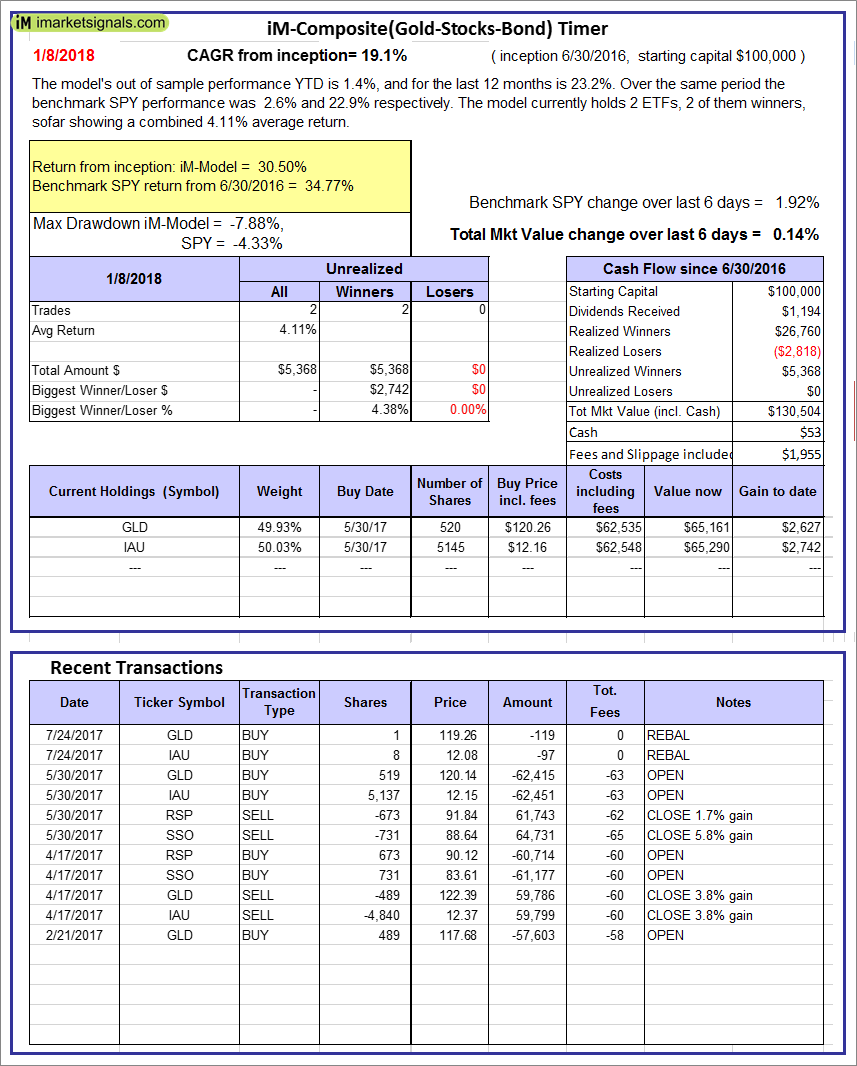
iM-Composite(Gold-Stocks-Bond) Timer: The model’s out of sample performance YTD is 1.4%, and for the last 12 months is 23.2%. Over the same period the benchmark SPY performance was 2.6% and 22.9% respectively. Over the previous week the market value of the iM-Composite(Gold-Stocks-Bond) Timer gained 0.14% at a time when SPY gained 1.92%. A starting capital of $100,000 at inception on 6/30/2016 would have grown to $130,504 which includes $53 cash and excludes $1,955 spent on fees and slippage. |
|
|
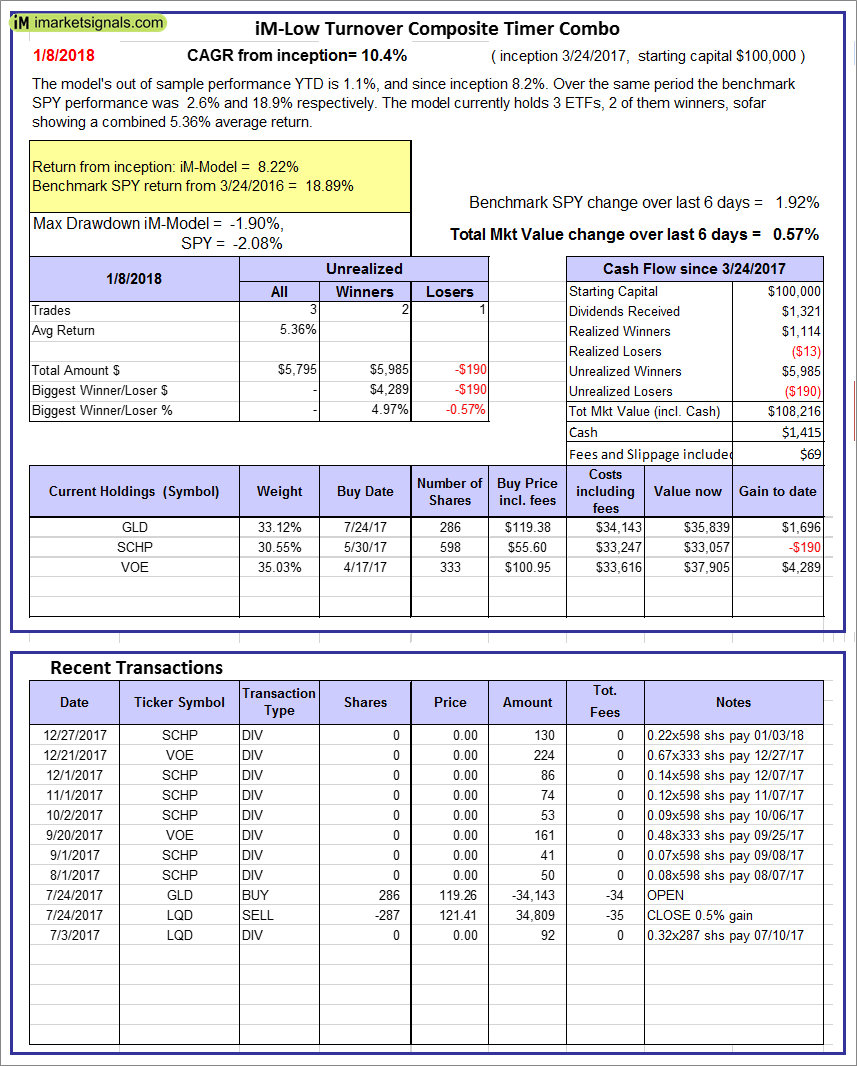
iM-Low Turnover Composite Timer Combo: The model’s out of sample performance YTD is 1.1%, and since inception 8.2%. Over the same period the benchmark SPY performance was 2.6% and 18.9% respectively. Over the previous week the market value of the iM-Low Turnover Composite Timer Combo gained 0.57% at a time when SPY gained 1.92%. A starting capital of $100,000 at inception on 3/24/27 would have grown to $108,216 which includes $1,415 cash and excludes $69 spent on fees and slippage. |
|
|
iM-Min Drawdown Combo: The model’s out of sample performance YTD is 1.2%, and since inception 9.2%. Over the same period the benchmark SPY performance was 2.6% and 18.4% respectively. Over the previous week the market value of the iM-Min Drawdown Combo gained 0.95% at a time when SPY gained 1.92%. A starting capital of $100,000 at inception on 4/5/2017 would have grown to $108,952 which includes $296 cash and excludes $153 spent on fees and slippage. |
|
|
iM-5ETF Trader (includes leveraged ETFs): The model’s out of sample performance YTD is 4.8%, and for the last 12 months is 47.1%. Over the same period the benchmark SPY performance was 2.6% and 22.9% respectively. Over the previous week the market value of the iM-5ETF Trader (includes leveraged ETFs) gained 3.19% at a time when SPY gained 1.92%. A starting capital of $100,000 at inception on 10/30/2016 would have grown to $170,577 which includes $1,064 cash and excludes $1,030 spent on fees and slippage. |
|
|
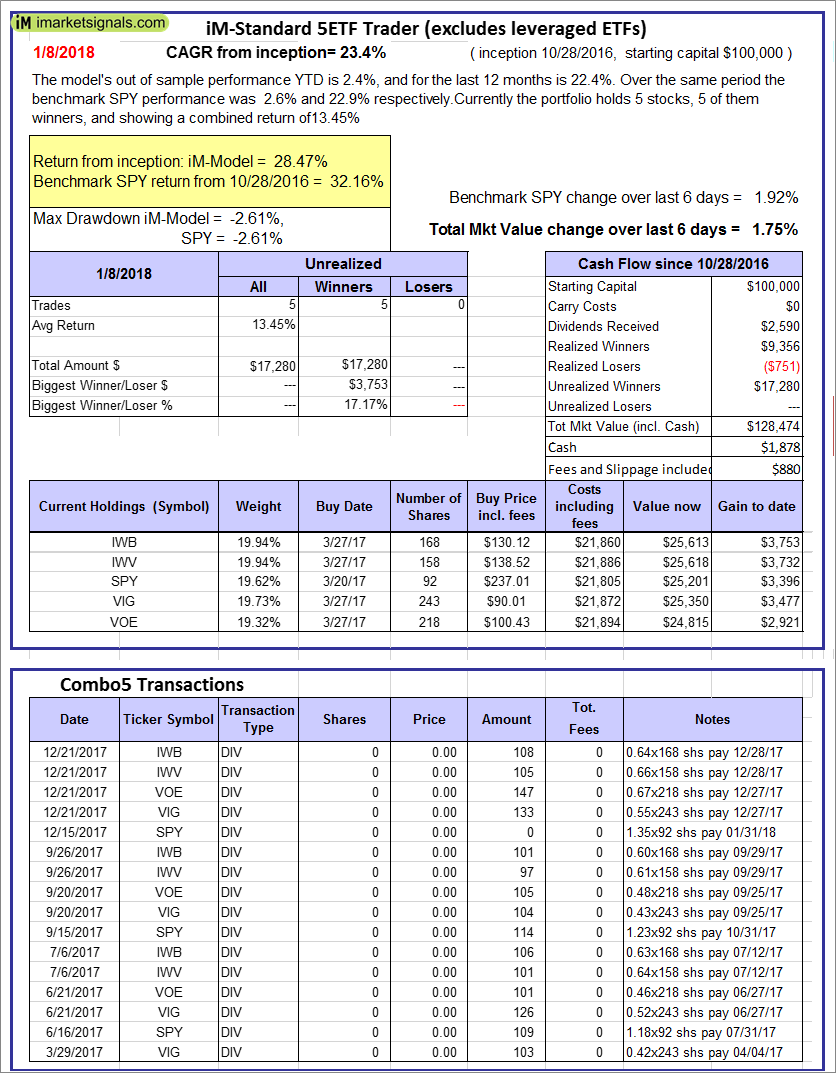
iM-Standard 5ETF Trader (excludes leveraged ETFs): The model’s out of sample performance YTD is 2.4%, and for the last 12 months is 22.4%. Over the same period the benchmark SPY performance was 2.6% and 22.9% respectively. Over the previous week the market value of the iM-Standard 5ETF Trader (excludes leveraged ETFs) gained 1.75% at a time when SPY gained 1.92%. A starting capital of $100,000 at inception on 10/30/2016 would have grown to $128,474 which includes $1,878 cash and excludes $880 spent on fees and slippage. |


Leave a Reply
You must be logged in to post a comment.