
  |
Out of sample performance summary of our models for the past 1, 2, 4 and 13 week periods. The active active return indicates how the models over- or underperformed the benchmark ETF SPY. Also the YTD, and the 1-, 3-, 5- and 10-year annualized returns are shown in the second table |
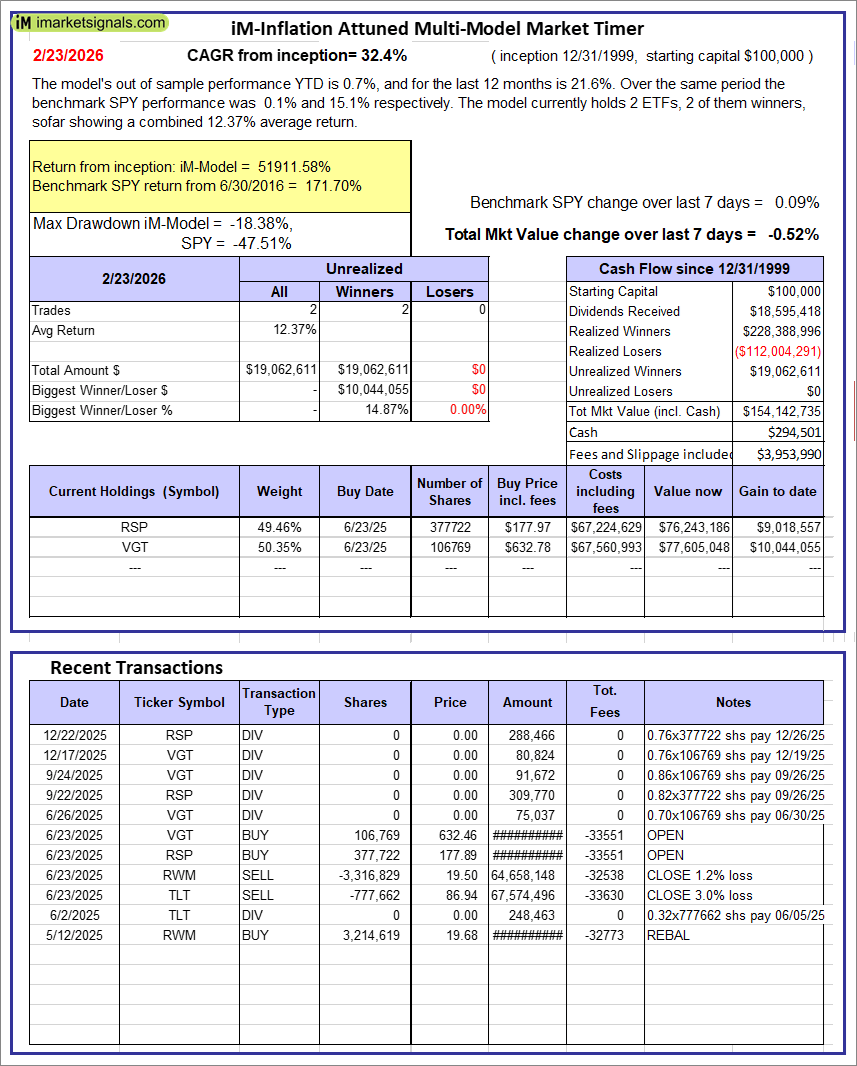 |
iM-Inflation Attuned Multi-Model Market Timer: The model’s out of sample performance YTD is 0.7%, and for the last 12 months is 21.6%. Over the same period the benchmark SPY performance was 0.1% and 15.1% respectively. Over the previous week the market value of the iM-Inflation Attuned Multi-Model Market Timer gained -0.52% at a time when SPY gained 0.09%. A starting capital of $100,000 at inception on 3/24/2017 would have grown to $154,142,735 which includes $294,501 cash and excludes $3,953,990 spent on fees and slippage. |
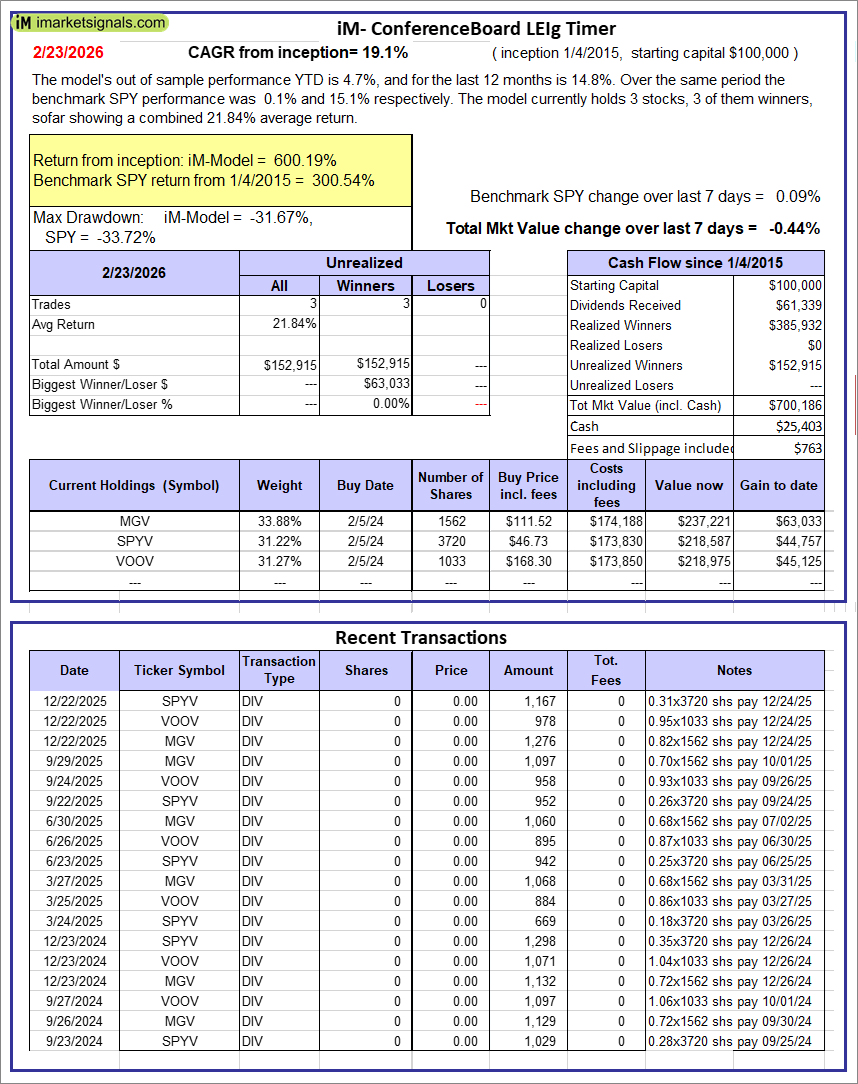 |
iM-Conference Board LEIg Timer: The model’s performance YTD is 14.3%, and for the last 12 months is 7.3%. Over the same period the benchmark SPY performance was 20.1% and 9.4% respectively. Over the previous week the market value of the iM-Conference Board LEIg Timer gained -0.44% at a time when SPY gained 0.09%. A starting capital of $100,000 at inception on 4/5/2017 would have grown to $700,186 which includes $25,403 cash and excludes $763 spent on fees and slippage. |
| iM-FlipSaver 60:40 | 20:80 – 2017: The model’s out of sample performance YTD is 1.5%, and for the last 12 months is 4.1%. Over the same period the benchmark E60B40 performance was 0.7% and 12.3% respectively. Over the previous week the market value of iM-FlipSaver 80:20 | 20:80 gained -0.24% at a time when SPY gained 0.11%. A starting capital of $100,000 at inception on 7/16/2015 would have grown to $182,122 which includes -$11 cash and excludes $5,611 spent on fees and slippage. | |
| iM-FlipSaver 70:30 | 20:80 – 2017: The model’s out of sample performance YTD is 1.5%, and for the last 12 months is 3.5%. Over the same period the benchmark E60B40 performance was 0.7% and 12.3% respectively. Over the previous week the market value of iM-FlipSaver 70:30 | 20:80 gained -0.24% at a time when SPY gained 0.11%. A starting capital of $100,000 at inception on 7/15/2015 would have grown to $189,681 which includes -$90 cash and excludes $5,884 spent on fees and slippage. | |
| iM-FlipSaver 80:20 | 20:80 – 2017: The model’s out of sample performance YTD is 1.5%, and for the last 12 months is 2.8%. Over the same period the benchmark E60B40 performance was 0.7% and 12.3% respectively. Over the previous week the market value of iM-FlipSaver 80:20 | 20:80 gained -0.24% at a time when SPY gained 0.11%. A starting capital of $100,000 at inception on 1/2/2017 would have grown to $197,153 which includes -$155 cash and excludes $6,148 spent on fees and slippage. | |
  |
iM-5HedgeFundSelect: Since inception, on 1/5/2016, the model gained 791.95% while the benchmark SPY gained 294.93% over the same period. Over the previous week the market value of iM-5HedgeFundSelect gained -3.79% at a time when SPY gained 0.09%. A starting capital of $25,000 at inception on 1/5/2016 would have grown to $214,628 which includes -$1,256 cash and excludes $3,008 spent on fees and slippage. |
 |
iM-10LargeHedgeFundSelect: Since inception, on 1/5/2016, the model gained 615.33% while the benchmark SPY gained 294.93% over the same period. Over the previous week the market value of iM-10LargeHedgeFundSelect gained -0.36% at a time when SPY gained 0.09%. A starting capital of $25,000 at inception on 1/5/2016 would have grown to $178,834 which includes $114 cash and excludes $1,951 spent on fees and slippage. |
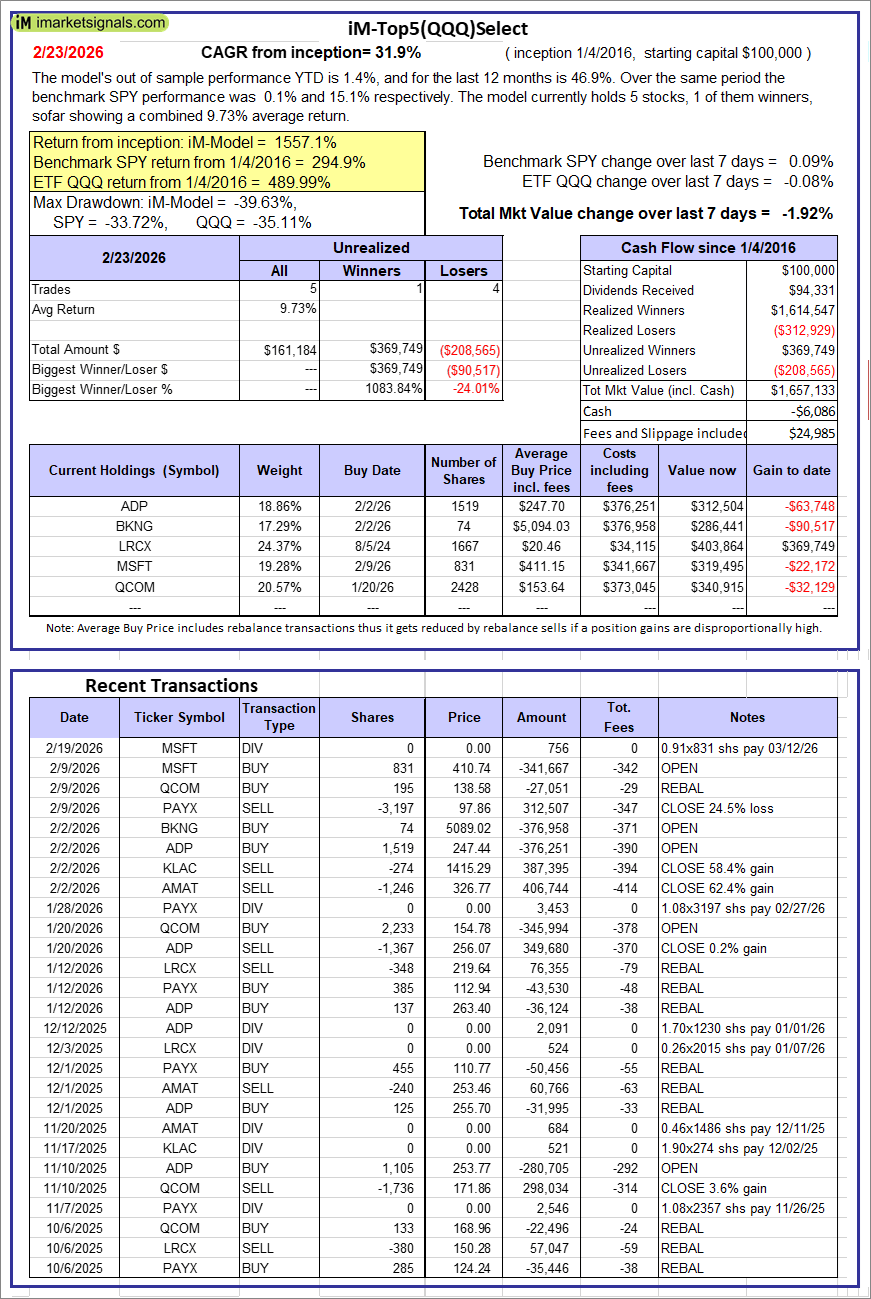  |
iM-Top5(QQQ)Select: Since inception, on 1/5/2016, the model gained 1557.13% while the benchmark SPY gained 294.93% over the same period. Over the previous week the market value of iM-Top5(QQQ)Select gained -1.92% at a time when SPY gained 0.09%. A starting capital of $100,000 at inception on 1/5/2016 would have grown to $1,657,133 which includes -$6,086 cash and excludes $24,985 spent on fees and slippage. |
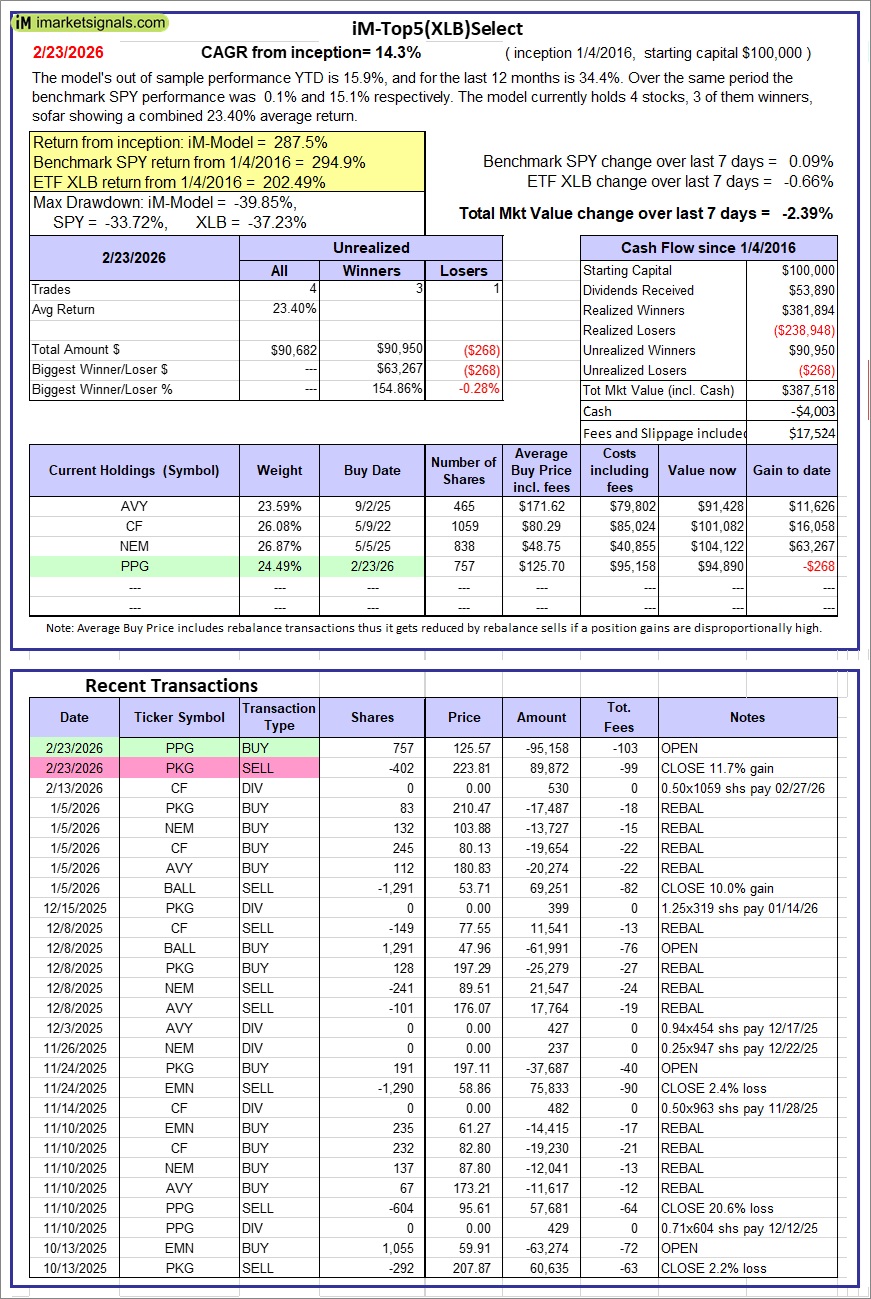  |
iM-Top5(XLB)Select: Since inception, on 1/5/2016, the model gained 287.52% while the benchmark SPY gained 294.93% over the same period. Over the previous week the market value of iM-Top5(XLB)Select gained -2.39% at a time when SPY gained 0.09%. A starting capital of $100,000 at inception on 1/5/2016 would have grown to $387,518 which includes -$4,003 cash and excludes $17,524 spent on fees and slippage. |
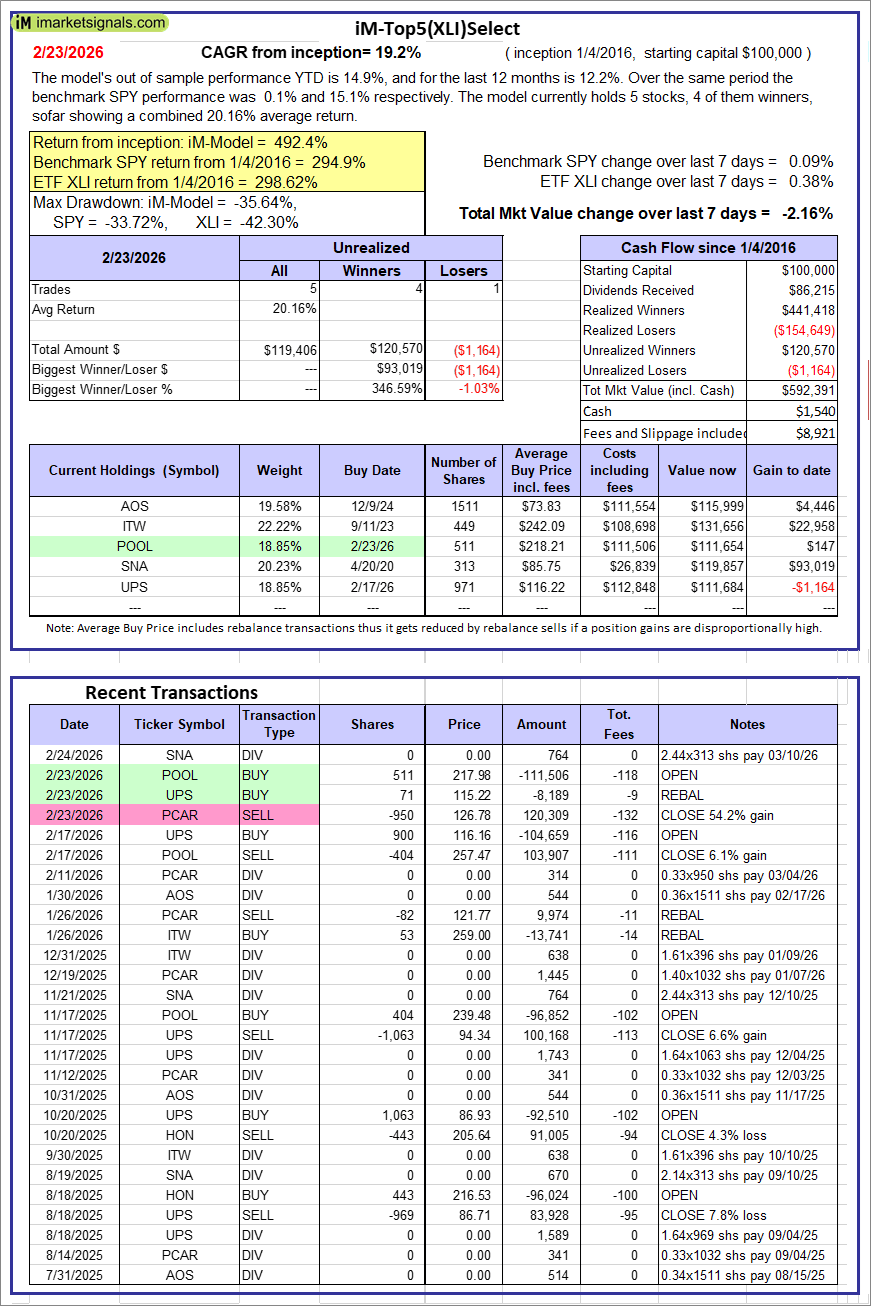  |
iM-Top5(XLI)Select: Since inception, on 1/5/2016, the model gained 492.39% while the benchmark SPY gained 294.93% over the same period. Over the previous week the market value of iM-Top5(XLI)Select gained -2.16% at a time when SPY gained 0.09%. A starting capital of $100,000 at inception on 1/5/2016 would have grown to $592,391 which includes $1,540 cash and excludes $8,921 spent on fees and slippage. |
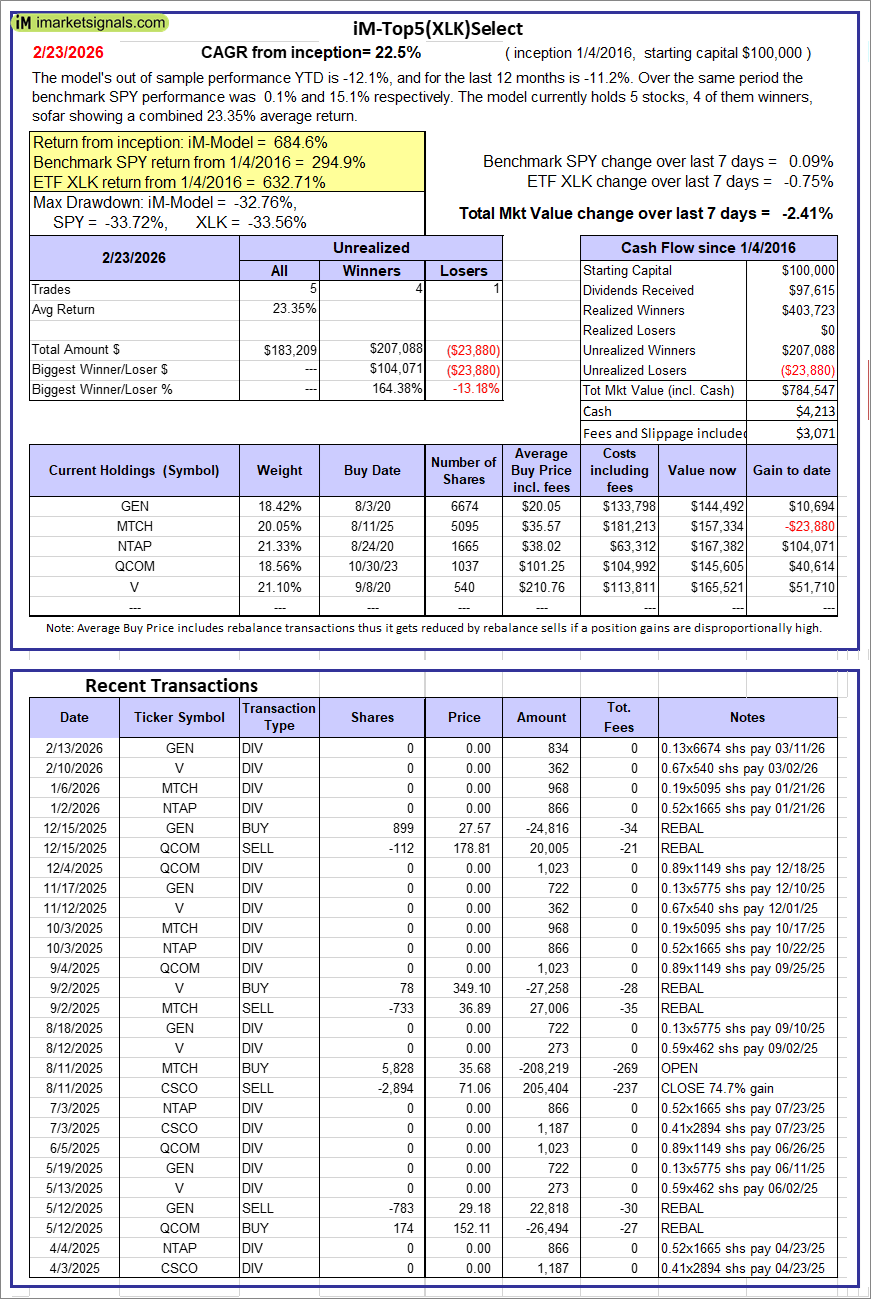  |
iM-Top5(XLK)Select: Since inception, on 1/5/2016, the model gained 684.55% while the benchmark SPY gained 294.93% over the same period. Over the previous week the market value of iM-Top5(XLK)Select gained -2.41% at a time when SPY gained 0.09%. A starting capital of $100,000 at inception on 1/5/2016 would have grown to $784,547 which includes $4,213 cash and excludes $3,071 spent on fees and slippage. |
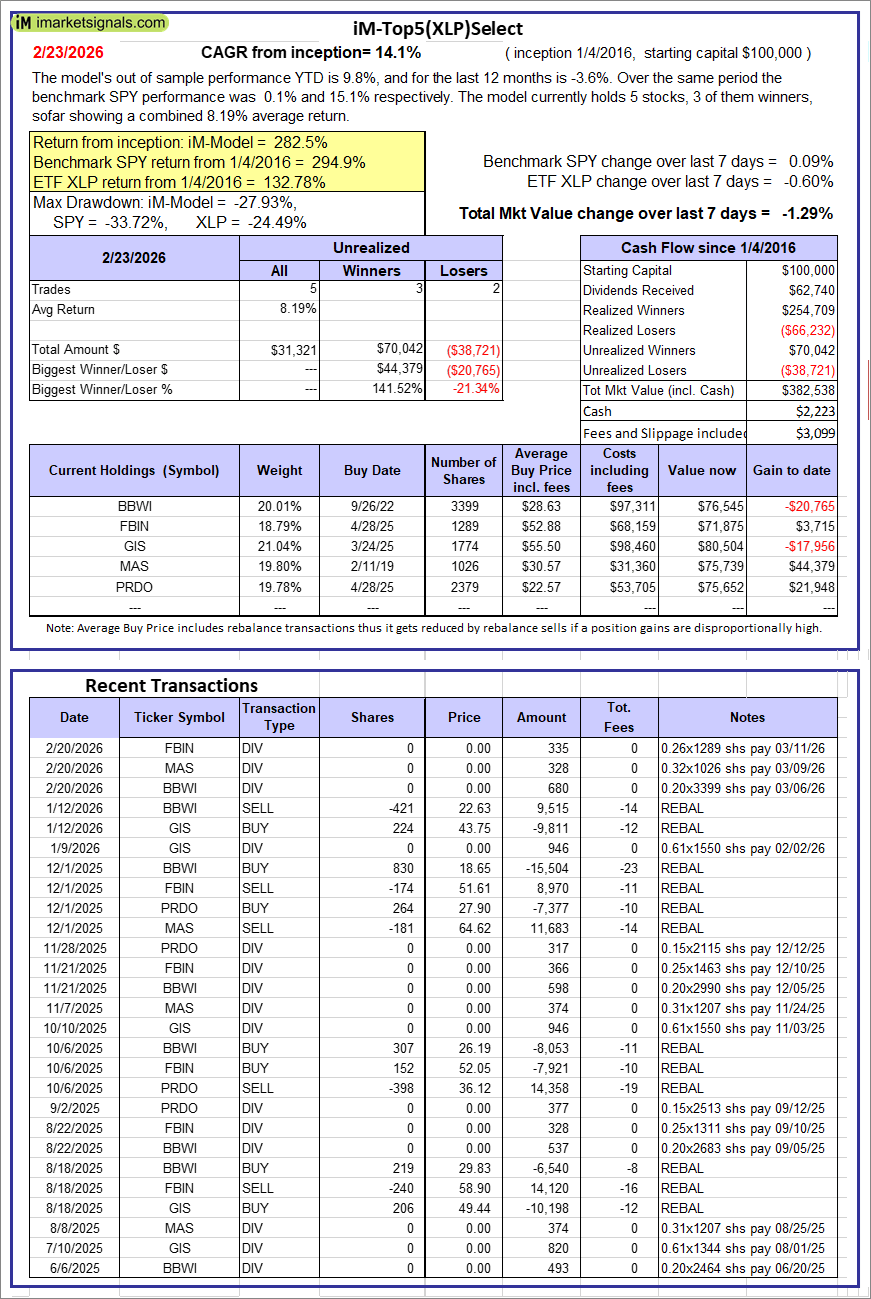  |
iM-Top5(XLP)Select: Since inception, on 1/5/2016, the model gained 282.54% while the benchmark SPY gained 294.93% over the same period. Over the previous week the market value of iM-Top5(XLP)Select gained -1.29% at a time when SPY gained 0.09%. A starting capital of $100,000 at inception on 1/5/2016 would have grown to $382,538 which includes $2,223 cash and excludes $3,099 spent on fees and slippage. |
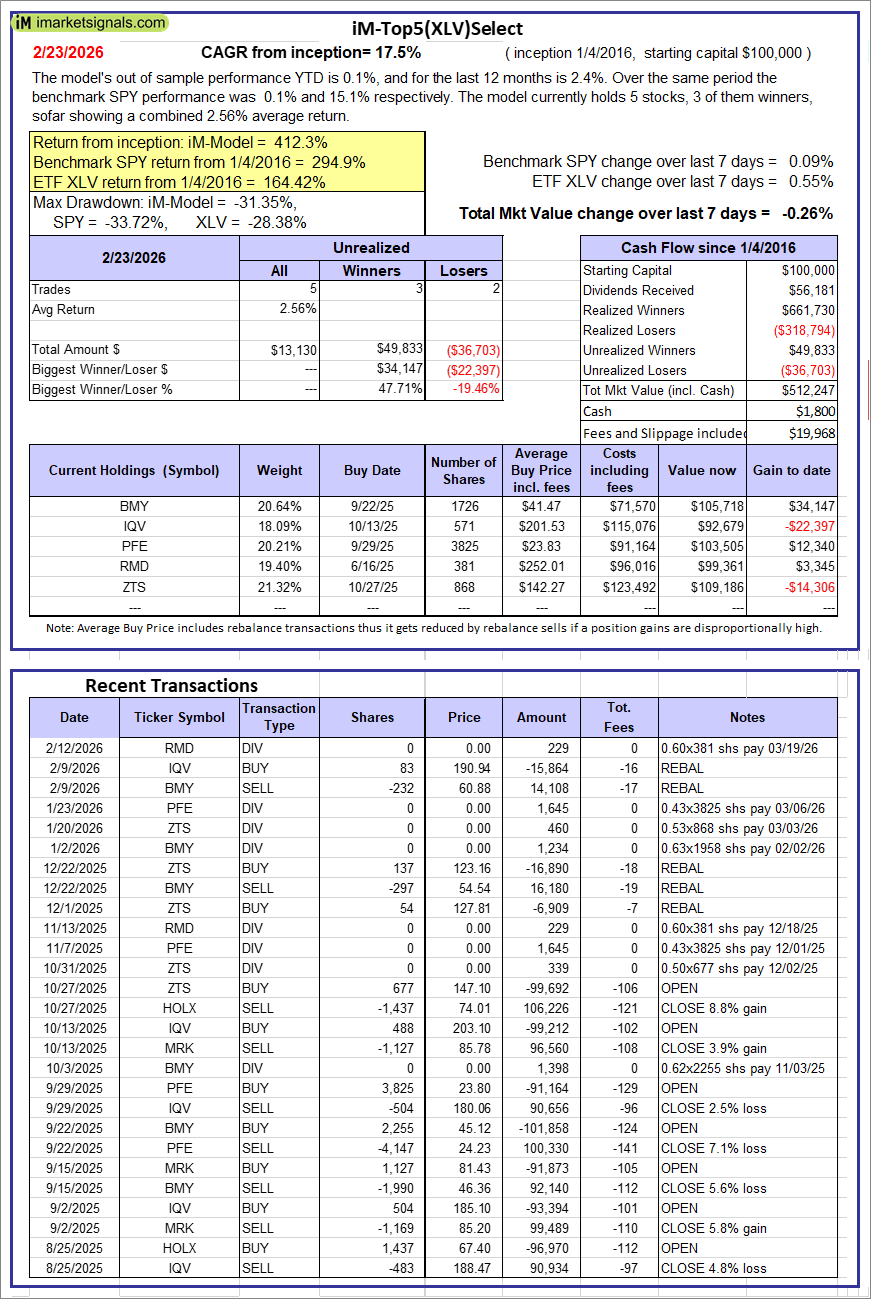  |
iM-Top5(XLV)Select: Since inception, on 1/5/2016, the model gained 412.25% while the benchmark SPY gained 294.93% over the same period. Over the previous week the market value of iM-Top5(XLV)Select gained -0.26% at a time when SPY gained 0.09%. A starting capital of $100,000 at inception on 1/5/2016 would have grown to $512,247 which includes $1,800 cash and excludes $19,968 spent on fees and slippage. |
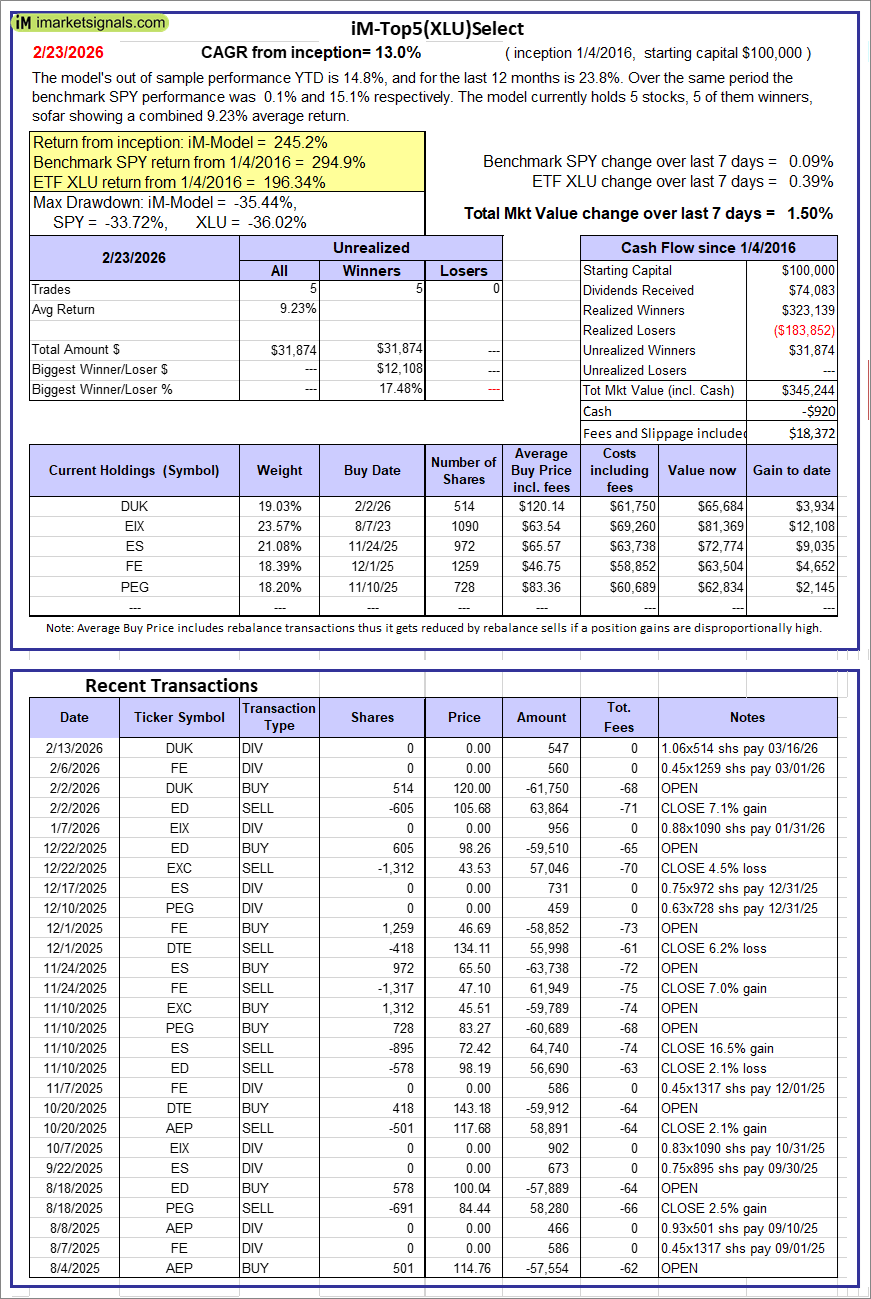  |
iM-Top5(XLU)Select: Since inception, on 1/5/2016, the model gained 245.24% while the benchmark SPY gained 294.93% over the same period. Over the previous week the market value of iM-Top5(XLU)Select gained 1.50% at a time when SPY gained 0.09%. A starting capital of $100,000 at inception on 1/5/2016 would have grown to $345,244 which includes -$920 cash and excludes $18,372 spent on fees and slippage. |
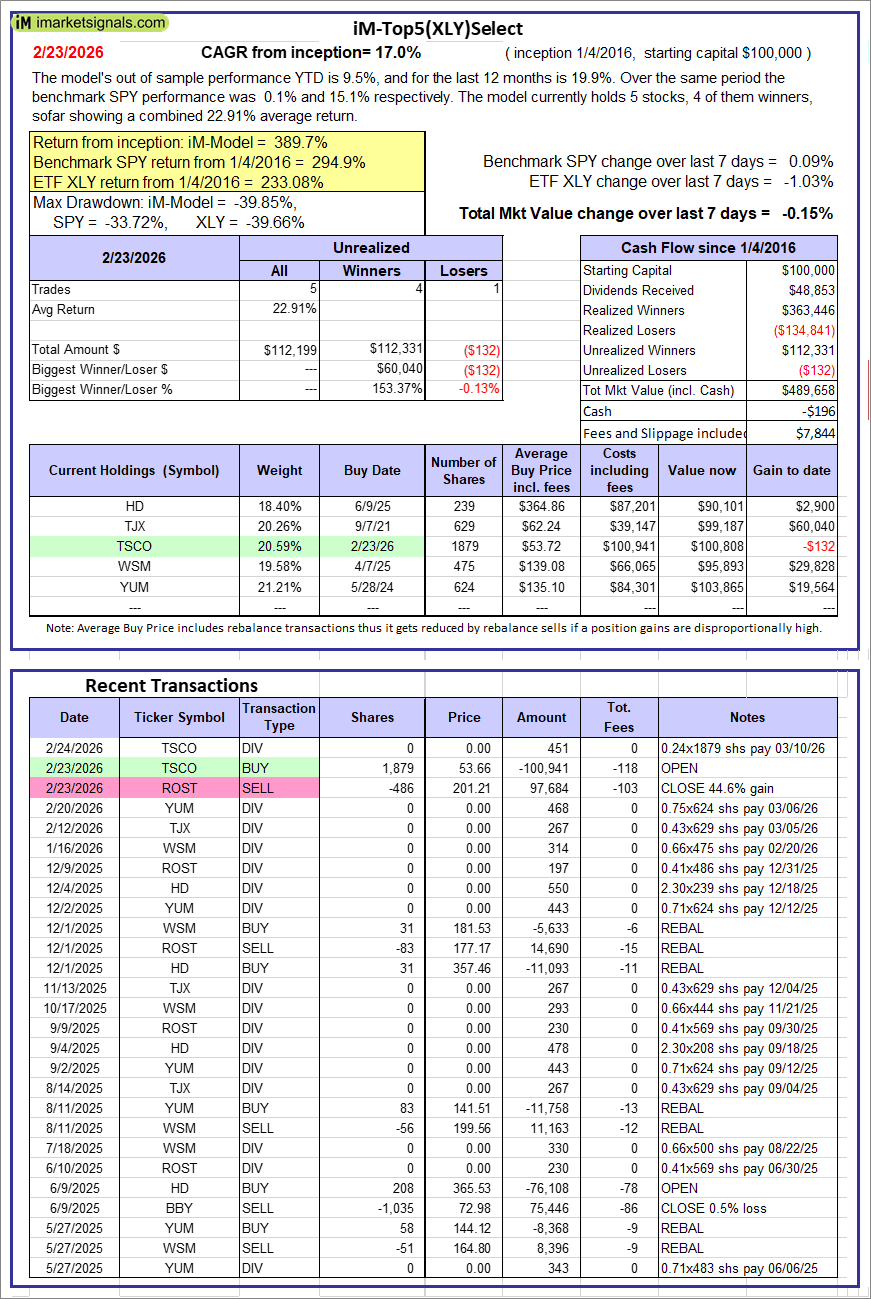  |
iM-Top5(XLY)Select: Since inception, on 1/5/2016, the model gained 389.66% while the benchmark SPY gained 294.93% over the same period. Over the previous week the market value of iM-Top5(XLY)Select gained -0.15% at a time when SPY gained 0.09%. A starting capital of $100,000 at inception on 1/5/2016 would have grown to $489,658 which includes -$196 cash and excludes $7,844 spent on fees and slippage. |
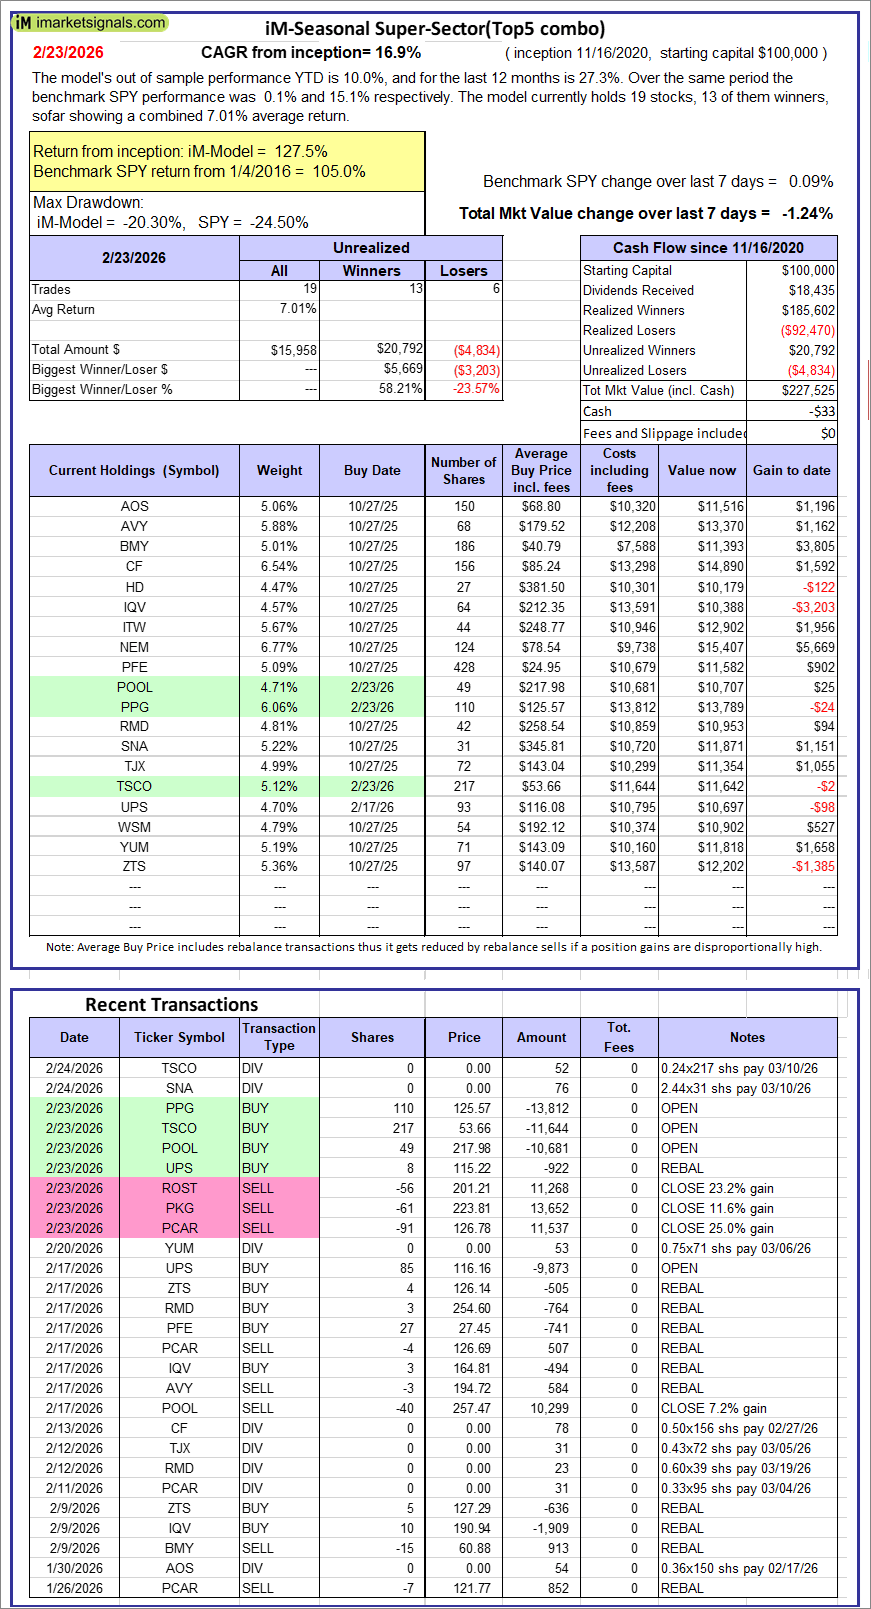 |
iM-Seasonal Super-Sectors (Top5 combo) : Since inception, on 11/17/2020, the model gained 127.53% while the benchmark SPY gained 105.01% over the same period. Over the previous week the market value of iM-Seasonal Super-Sectors (Top5 combo) gained -1.24% at a time when SPY gained 0.09%. A starting capital of $100,000 at inception on 11/17/2020 would have grown to $227,525 which includes -$33 cash and excludes $00 spent on fees and slippage. |
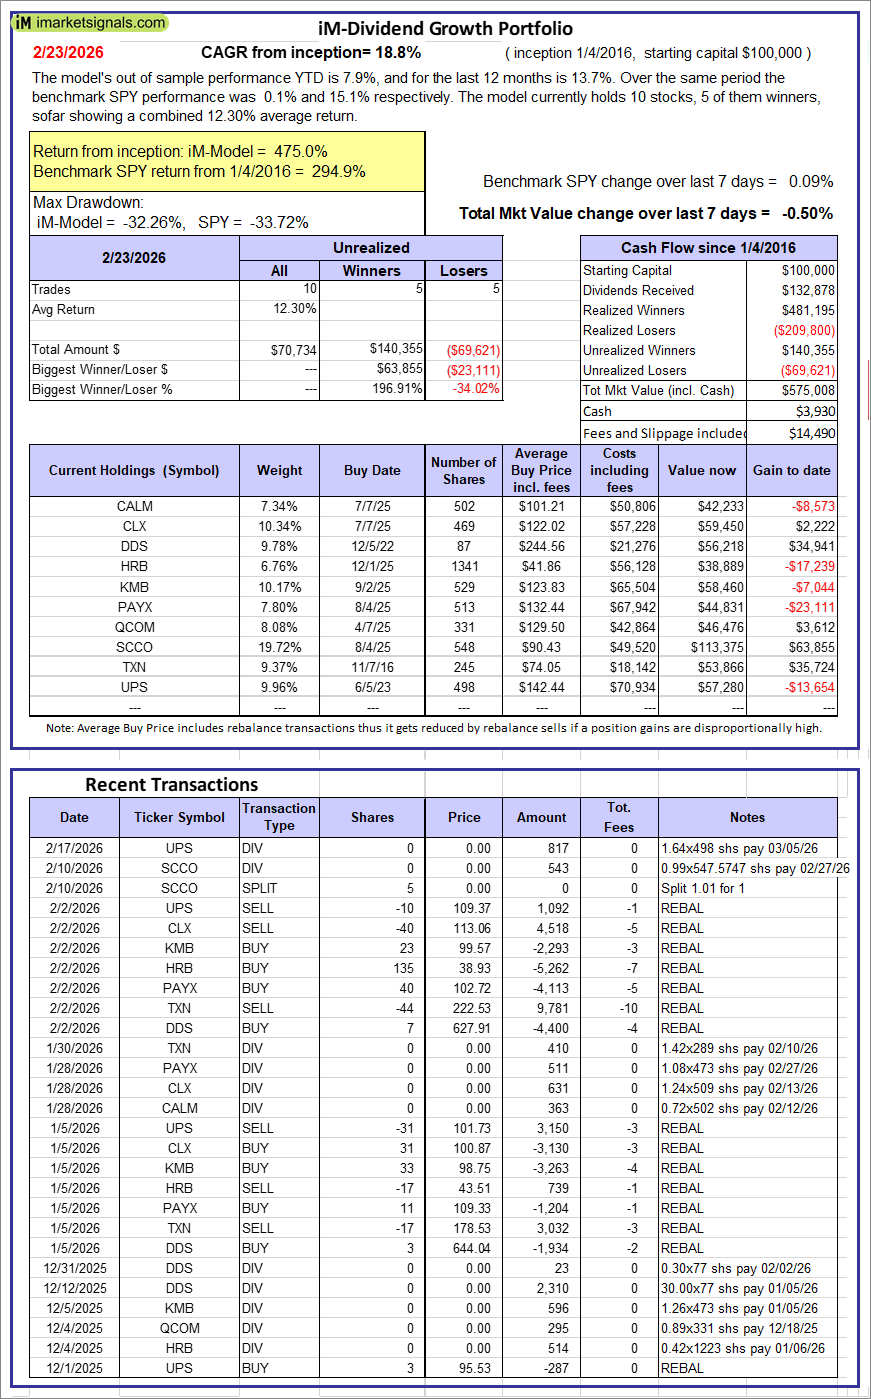 |
iM-Dividend Growth Portfolio: The model’s out of sample performance YTD is 7.9%, and for the last 12 months is 13.7%. Over the same period the benchmark SPY performance was 0.1% and 15.1% respectively. Over the previous week the market value of the iM-Dividend Growth Portfolio gained -0.50% at a time when SPY gained 0.09%. A starting capital of $100,000 at inception on 6/30/2016 would have grown to $575,008 which includes $3,930 cash and excludes $14,490 spent on fees and slippage. |
| iM-Gold Momentum Timer (AU, NEM, SBSW): The model’s out of sample performance YTD is 34.3%, and for the last 12 months is 336.7%. Over the same period the benchmark SPY performance was 0.1% and 15.1% respectively. Over the previous week the market value of iM-Gold Momentum Timer (AU, NEM, SBSW) gained 10.27% at a time when SPY gained 0.09%. A starting capital of $100,000 at inception on 6/30/2016 would have grown to $9,359 which includes $188,159 cash and excludes Gain to date spent on fees and slippage. | |
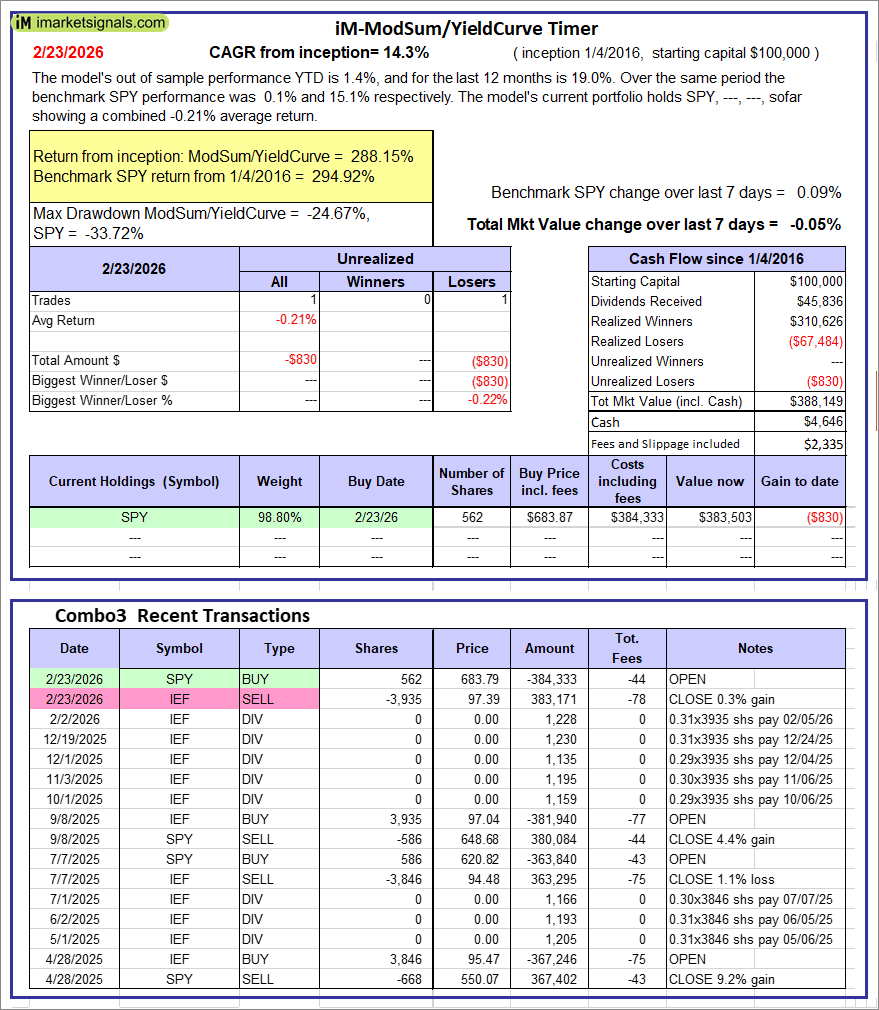 |
iM-ModSum/YieldCurve Timer: The model’s out of sample performance YTD is 1.4%, and for the last 12 months is 19.0%. Over the same period the benchmark SPY performance was 0.1% and 15.1% respectively. Over the previous week the market value of iM-PortSum/YieldCurve Timer gained -0.05% at a time when SPY gained 0.09%. A starting capital of $100,000 at inception on 1/1/2016 would have grown to $388,149 which includes $4,646 cash and excludes $2,335 spent on fees and slippage. |
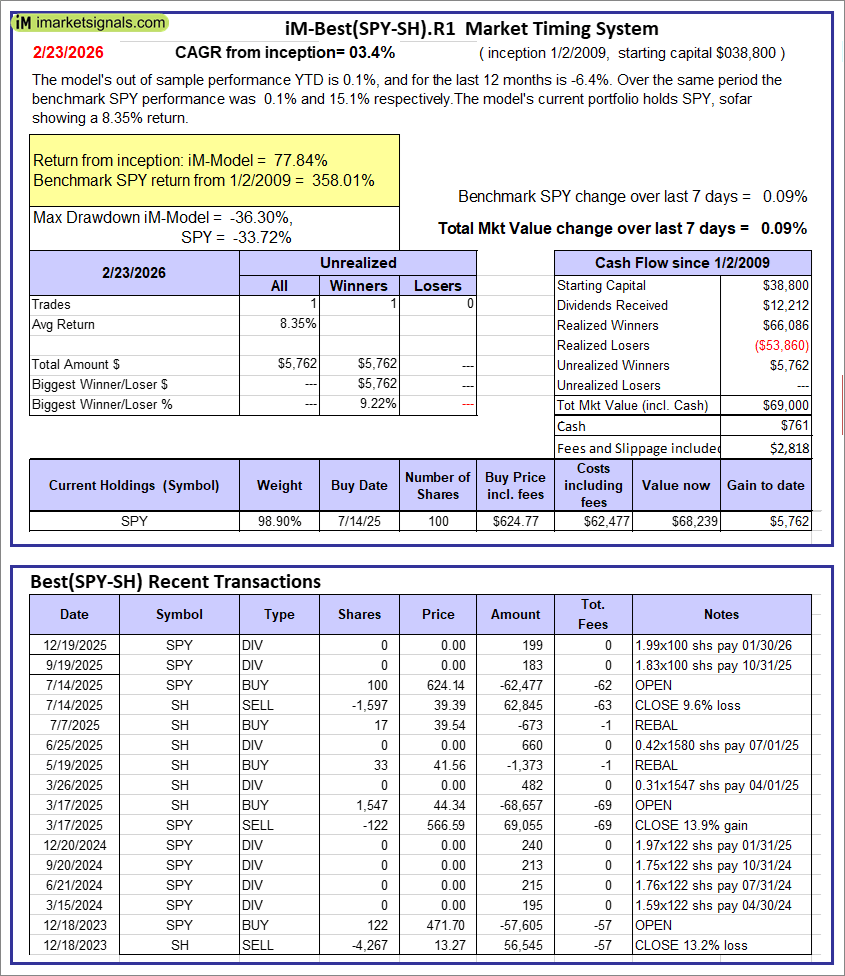 |
iM-Best(SPY-SH).R1: The model’s out of sample performance YTD is 0.1%, and for the last 12 months is -6.4%. Over the same period the benchmark SPY performance was 0.1% and 15.1% respectively. Over the previous week the market value of Best(SPY-SH) gained 0.09% at a time when SPY gained 0.09%. A starting capital of $100,000 at inception on 1/2/2009 would have grown to $69,000 which includes $761 cash and excludes $2,818 spent on fees and slippage. |
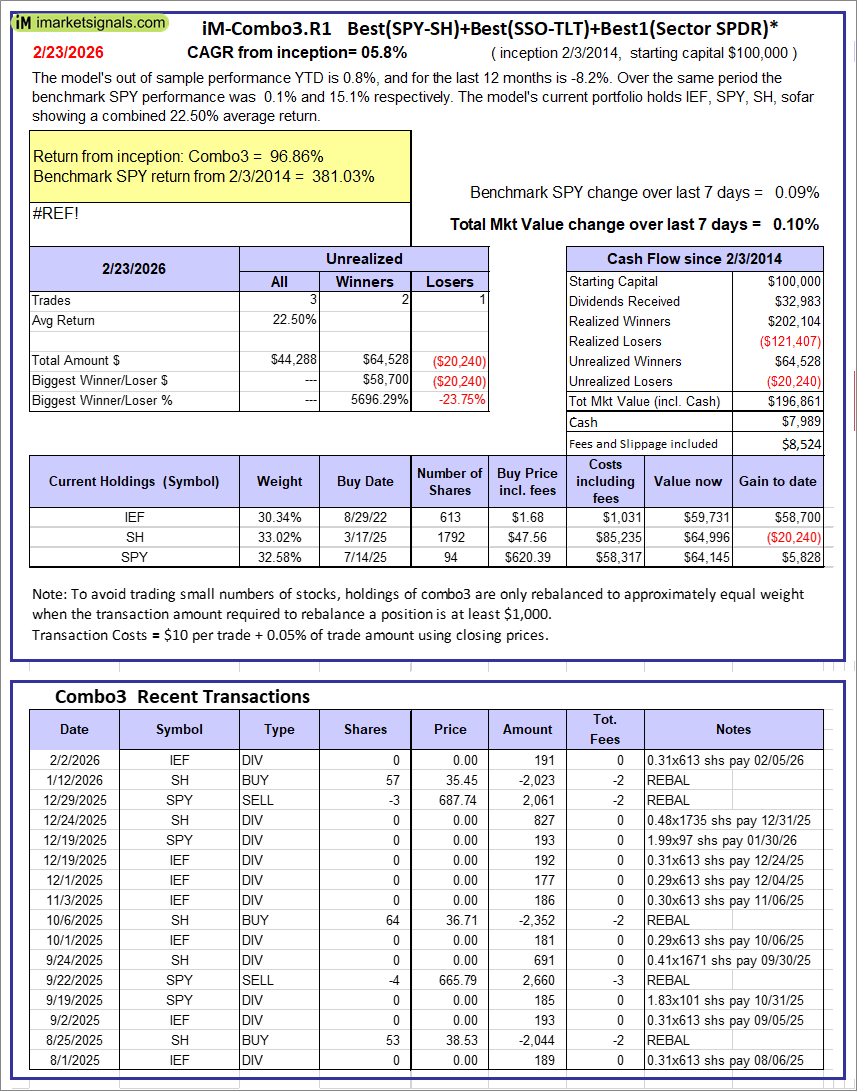 |
iM-Combo3.R1: The model’s out of sample performance YTD is 0.8%, and for the last 12 months is -8.2%. Over the same period the benchmark SPY performance was 0.1% and 15.1% respectively. Over the previous week the market value of iM-Combo3.R1 gained 0.10% at a time when SPY gained 0.09%. A starting capital of $100,000 at inception on 2/3/2014 would have grown to $196,861 which includes $7,989 cash and excludes $8,524 spent on fees and slippage. |
  |
iM-Best10(VDIGX)-Trader: The model’s out of sample performance YTD is -9.9%, and for the last 12 months is -7.3%. Over the same period the benchmark SPY performance was 0.1% and 15.1% respectively. Since inception, on 7/1/2014, the model gained 235.77% while the benchmark SPY gained 323.94% and VDIGX gained 50.09% over the same period. Over the previous week the market value of iM-Best10(VDIGX) gained -2.67% at a time when SPY gained 0.09%. A starting capital of $100,000 at inception on 7/1/2014 would have grown to $335,769 which includes $761 cash and excludes $5,695 spent on fees and slippage. |
|
|
iM 6-Stock Capital Strength Portfolio: The model’s out of sample performance YTD is 16.8%, and for the last 12 months is 9.6%. Over the same period the benchmark SPY performance was 0.1% and 15.1% respectively. Over the previous week the market value of the iM 6-Stock Capital Strength Portfolio gained 1.21% at a time when SPY gained 0.09%. A starting capital of $100,000 at inception on 10/28/2016 would have grown to $300,103 which includes $900 cash and excludes $4,455 spent on fees and slippage. |
 |
iM-Best12(USMV)-Trader: The model’s out of sample performance YTD is 4.0%, and for the last 12 months is 21.1%. Over the same period the benchmark SPY performance was 0.1% and 15.1% respectively. Since inception, on 6/30/2014, the model gained 344.33% while the benchmark SPY gained 323.94% and the ETF USMV gained 218.43% over the same period. Over the previous week the market value of iM-Best12(USMV)-Trader gained -0.90% at a time when SPY gained 0.09%. A starting capital of $100,000 at inception on 6/30/2014 would have grown to $444,331 which includes $803 cash and excludes $8,774 spent on fees and slippage. |
 |
iM-Min Volatility(USMV) Investor (Tax Efficient): The model’s out of sample performance YTD is 0.4%, and for the last 12 months is 23.0%. Over the same period the benchmark SPY performance was 0.1% and 15.1% respectively. Since inception, on 1/3/2013, the model gained 1095.49% while the benchmark SPY gained 485.21% and the ETF USMV gained 485.21% over the same period. Over the previous week the market value of iM-Best12(USMV)Q1 gained -0.05% at a time when SPY gained 0.09%. A starting capital of $100,000 at inception on 1/3/2013 would have grown to $1,195,494 which includes -$872 cash and excludes $15,356 spent on fees and slippage. |
|
|
iM-Bond Market Trader (High-Yield Bond or 10-yr Treasury Bond): The model’s out of sample performance YTD is 1.6%, and for the last 12 months is 6.3%. Over the same period the benchmark BND performance was 1.5% and 7.1% respectively. Over the previous week the market value of the iM-Bond Market Trader (High-Yield Bond or 10-yr Treasury Bond) gained 0.18% at a time when BND gained 0.12%. A starting capital of $10,000 at inception on 1/3/2000 would have grown to $151,459 which includes $497 cash and excludes $2,916 spent on fees and slippage. |
|
|
iM-ModSum/YieldCurve Timer: The model’s out of sample performance YTD is 1.4%, and for the last 12 months is 19.0%. Over the same period the benchmark SPY performance was 0.1% and 15.1% respectively. Over the previous week the market value of iM-PortSum/YieldCurve Timer gained -0.05% at a time when SPY gained 0.09%. A starting capital of $100,000 at inception on 1/1/2016 would have grown to $388,149 which includes $4,646 cash and excludes $2,335 spent on fees and slippage. |
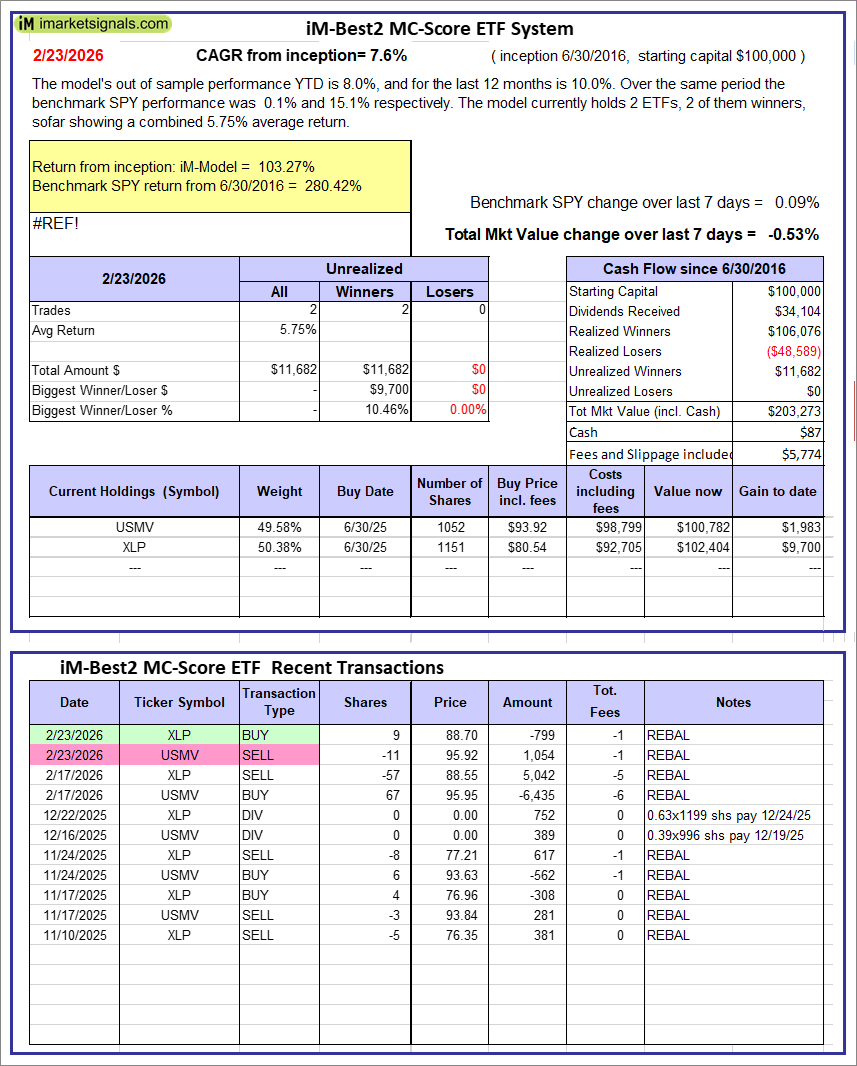 |
iM-Best2 MC-Score ETF System: The model’s out of sample performance YTD is 8.0%, and for the last 12 months is 10.0%. Over the same period the benchmark SPY performance was 0.1% and 15.1% respectively. Over the previous week the market value of the iM-Best2 MC-Score ETF System gained -0.53% at a time when SPY gained 0.09%. A starting capital of $100,000 at inception on 6/30/2016 would have grown to $203,273 which includes $87 cash and excludes $5,774 spent on fees and slippage. |
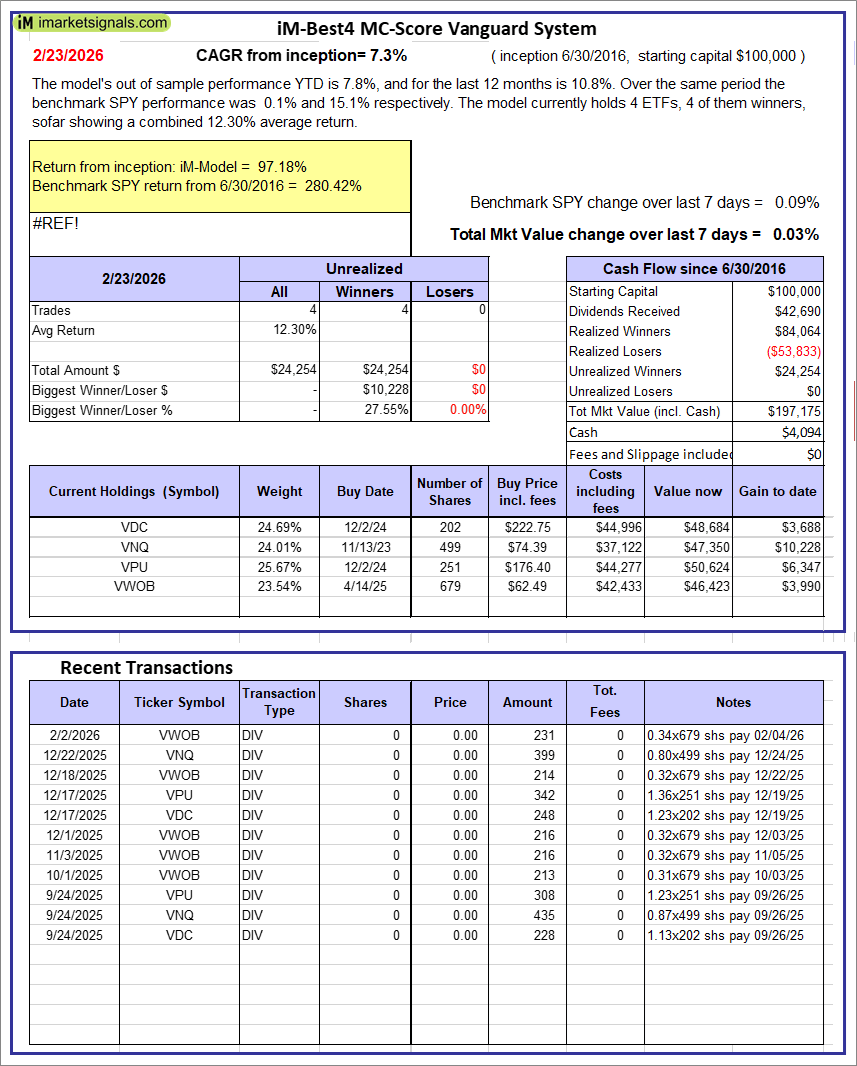 |
iM-Best4 MC-Score Vanguard System: The model’s out of sample performance YTD is 7.8%, and for the last 12 months is 10.8%. Over the same period the benchmark SPY performance was 0.1% and 15.1% respectively. Over the previous week the market value of the iM-Best4 MC-Score Vanguard System gained 0.03% at a time when SPY gained 0.09%. A starting capital of $100,000 at inception on 6/30/2016 would have grown to $197,175 which includes $4,094 cash and excludes $00 spent on fees and slippage. |
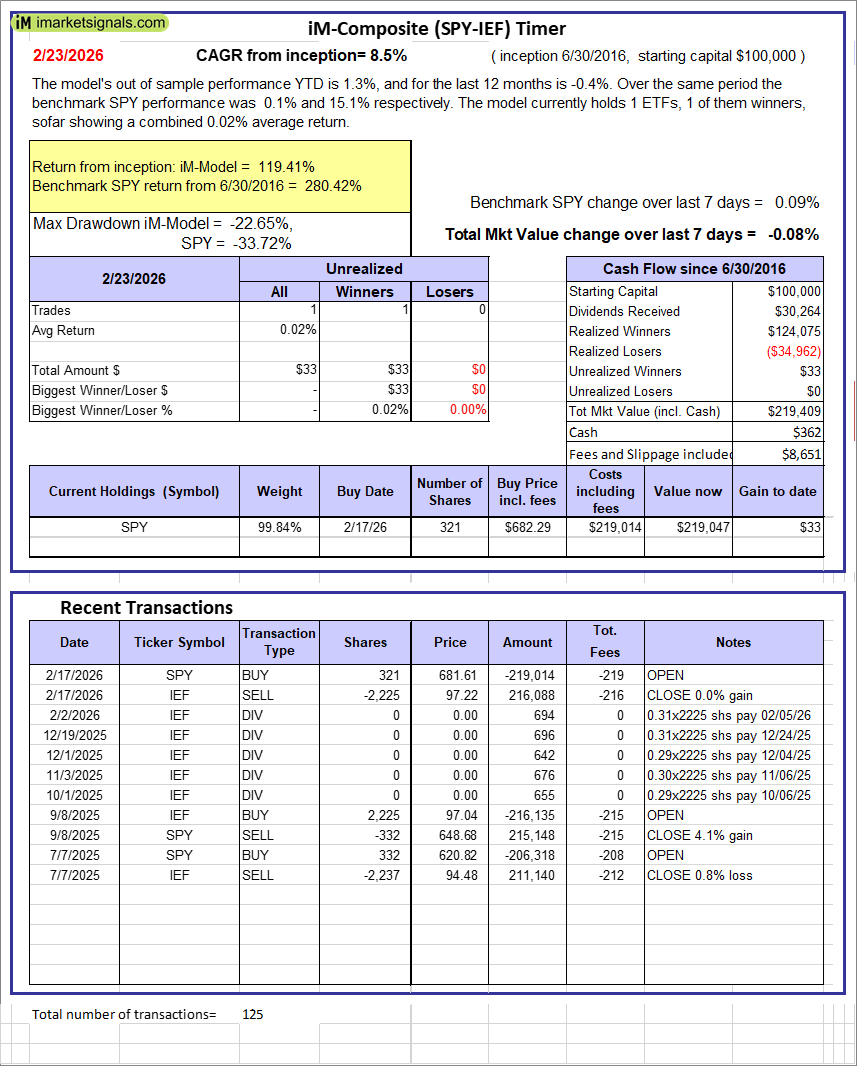 |
iM-Composite (SPY-IEF) Timer: The model’s out of sample performance YTD is 1.3%, and for the last 12 months is -0.4%. Over the same period the benchmark SPY performance was 0.1% and 15.1% respectively. Over the previous week the market value of the iM-Composite (SPY-IEF) Timer gained -0.08% at a time when SPY gained 0.09%. A starting capital of $100,000 at inception on 6/30/2016 would have grown to $219,409 which includes $362 cash and excludes $8,651 spent on fees and slippage. |
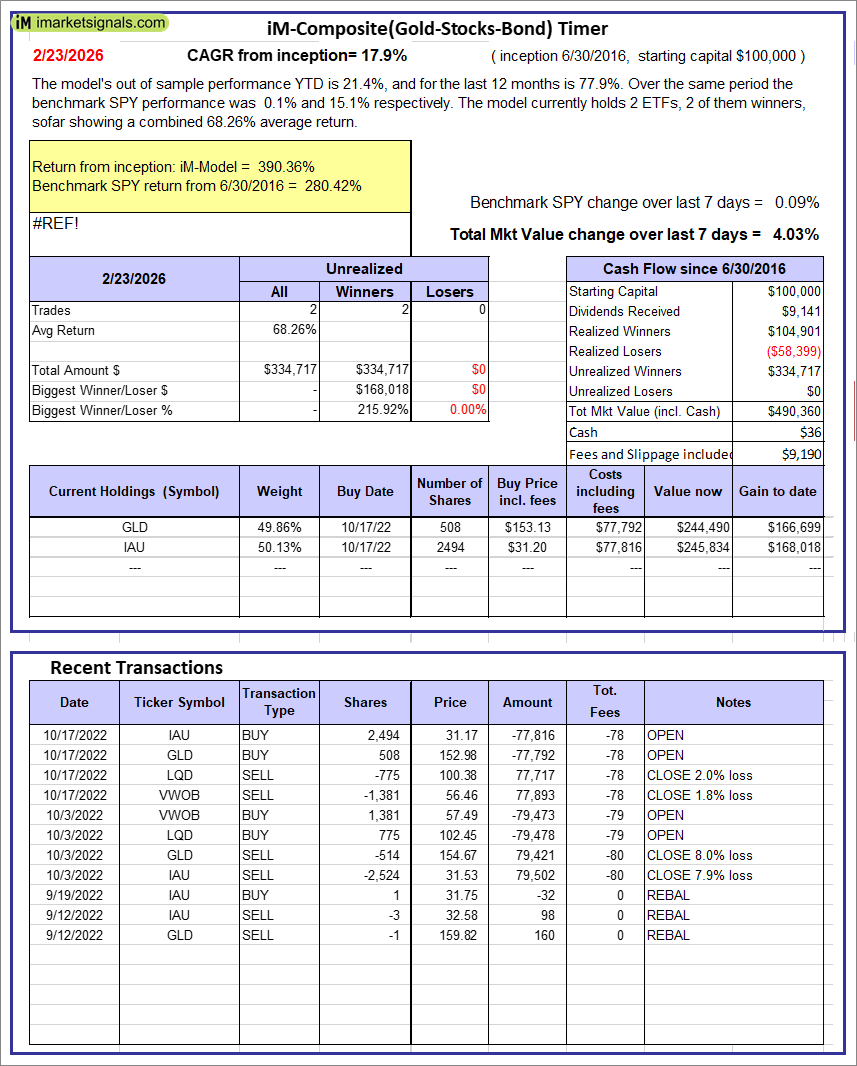 |
iM-Composite(Gold-Stocks-Bond) Timer: The model’s out of sample performance YTD is 21.4%, and for the last 12 months is 77.9%. Over the same period the benchmark SPY performance was 0.1% and 15.1% respectively. Over the previous week the market value of the iM-Composite(Gold-Stocks-Bond) Timer gained 4.03% at a time when SPY gained 0.09%. A starting capital of $100,000 at inception on 6/30/2016 would have grown to $490,360 which includes $36 cash and excludes $9,190 spent on fees and slippage. |
iM-Best Reports – 2/24/2026
Posted in pmp SPY-SH