
  |
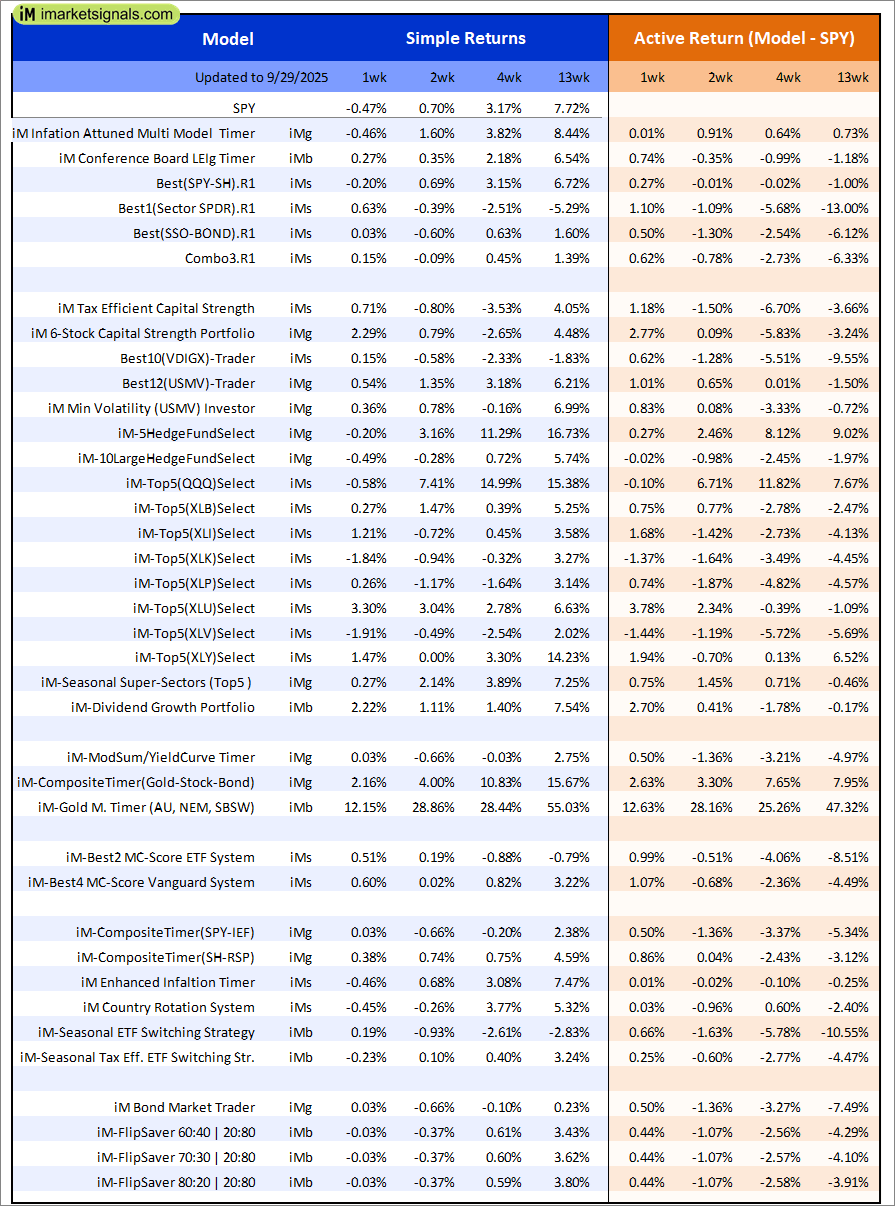
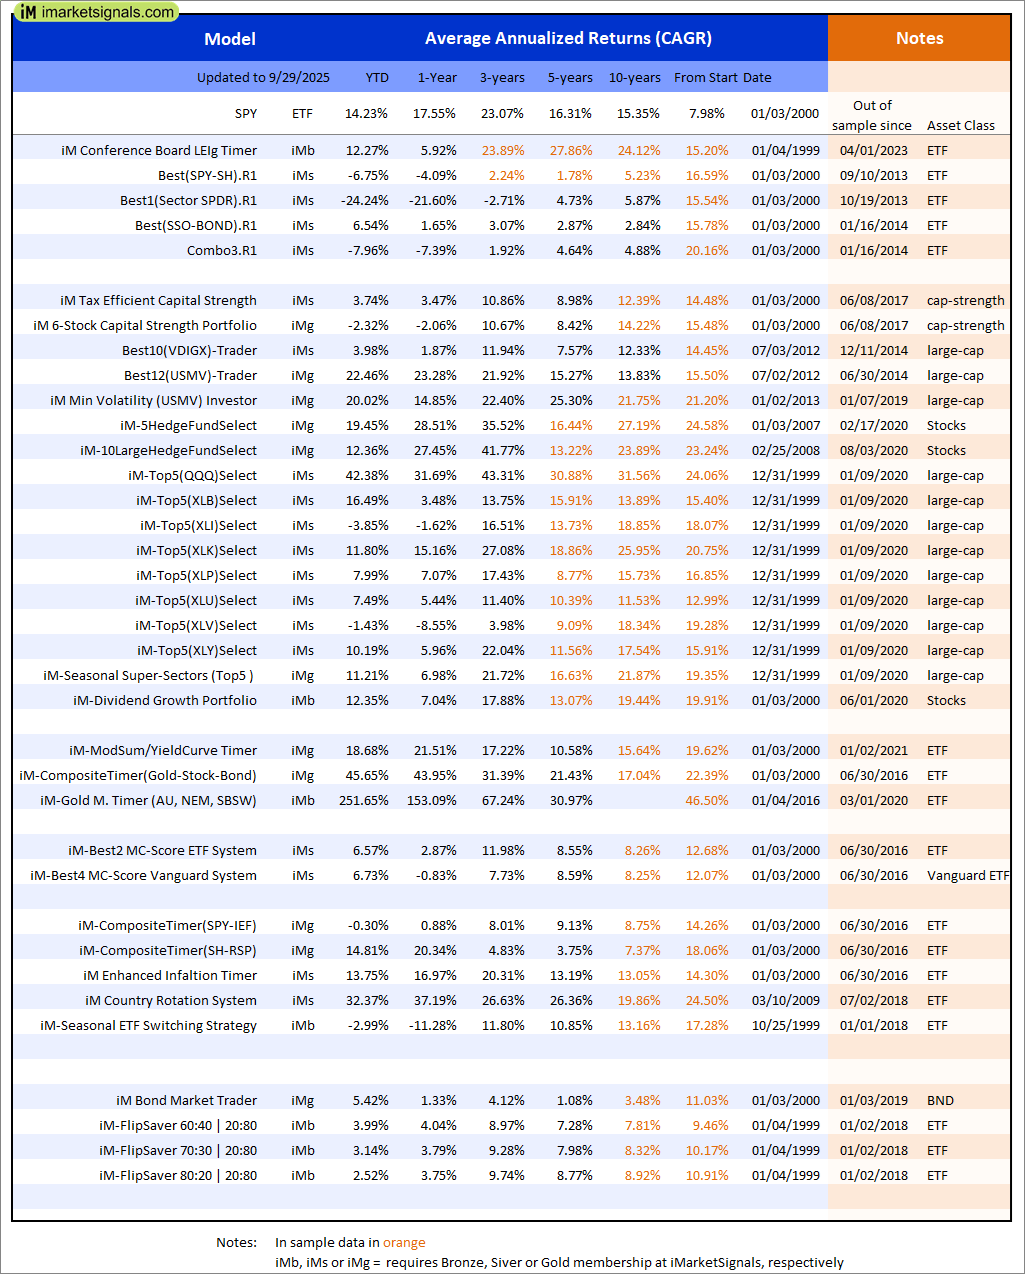
Out of sample performance summary of our models for the past 1, 2, 4 and 13 week periods. The active active return indicates how the models over- or underperformed the benchmark ETF SPY. Also the YTD, and the 1-, 3-, 5- and 10-year annualized returns are shown in the second table |
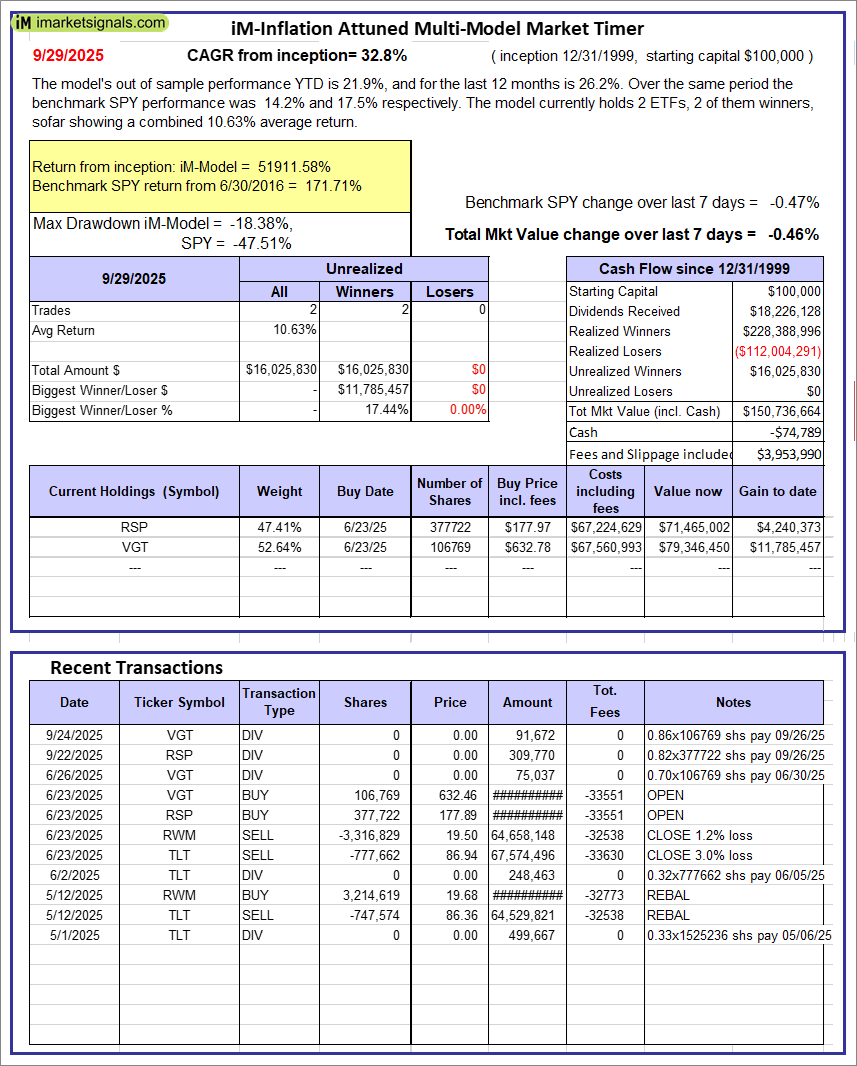 |
iM-Inflation Attuned Multi-Model Market Timer: The model’s out of sample performance YTD is 21.9%, and for the last 12 months is 26.2%. Over the same period the benchmark SPY performance was 14.2% and 17.5% respectively. Over the previous week the market value of the iM-Inflation Attuned Multi-Model Market Timer gained -0.46% at a time when SPY gained -0.47%. A starting capital of $100,000 at inception on 3/24/2017 would have grown to $150,736,664 which includes -$74,789 cash and excludes $3,953,990 spent on fees and slippage. |
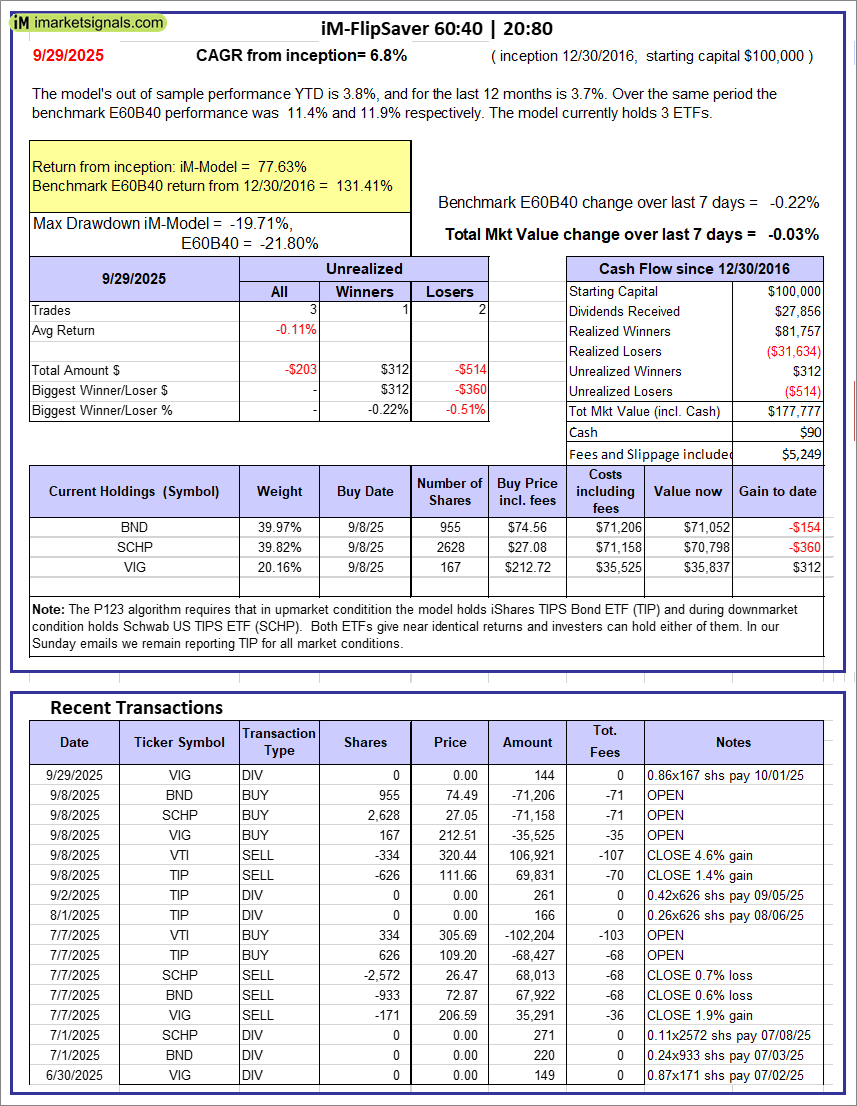 |
iM-FlipSaver 60:40 | 20:80 – 2017: The model’s out of sample performance YTD is 3.8%, and for the last 12 months is 3.7%. Over the same period the benchmark E60B40 performance was 11.4% and 11.9% respectively. Over the previous week the market value of iM-FlipSaver 80:20 | 20:80 gained -0.03% at a time when SPY gained -0.22%. A starting capital of $100,000 at inception on 7/16/2015 would have grown to $177,777 which includes $90 cash and excludes $5,249 spent on fees and slippage. |
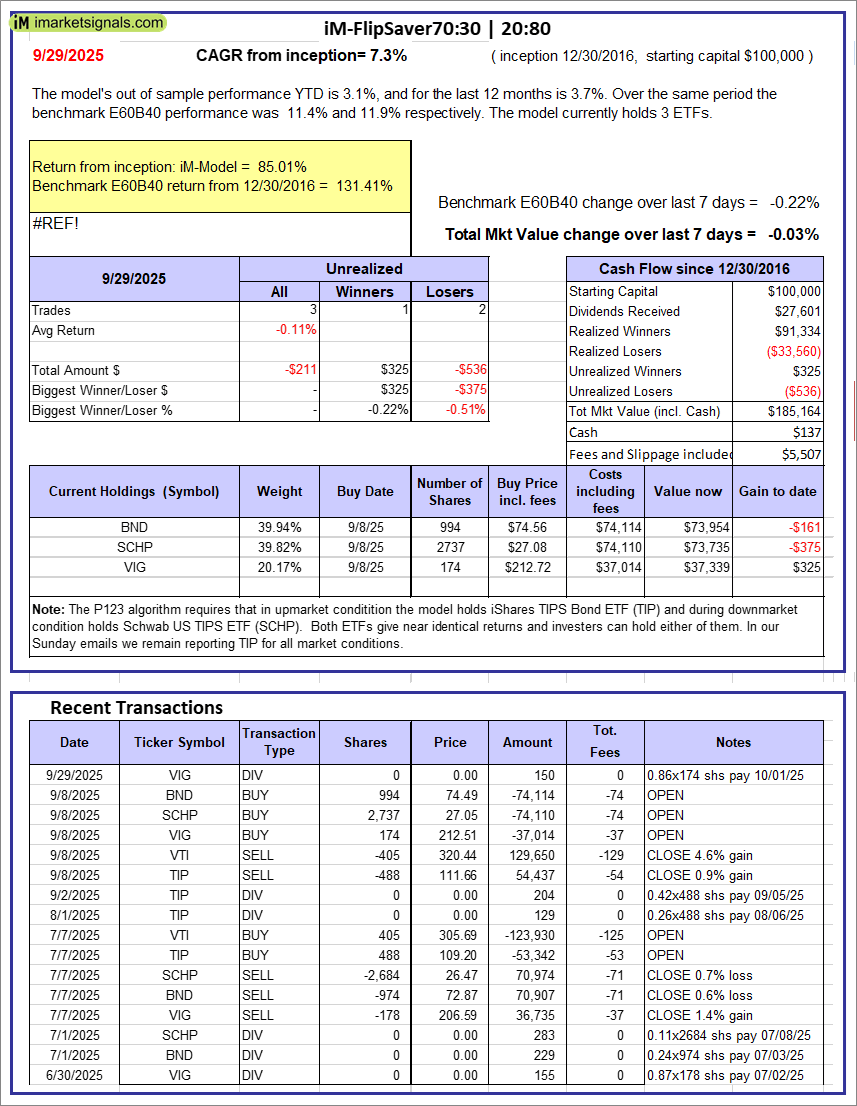 |
iM-FlipSaver 70:30 | 20:80 – 2017: The model’s out of sample performance YTD is 3.1%, and for the last 12 months is 3.7%. Over the same period the benchmark E60B40 performance was 11.4% and 11.9% respectively. Over the previous week the market value of iM-FlipSaver 70:30 | 20:80 gained -0.03% at a time when SPY gained -0.22%. A starting capital of $100,000 at inception on 7/15/2015 would have grown to $185,164 which includes $137 cash and excludes $5,507 spent on fees and slippage. |
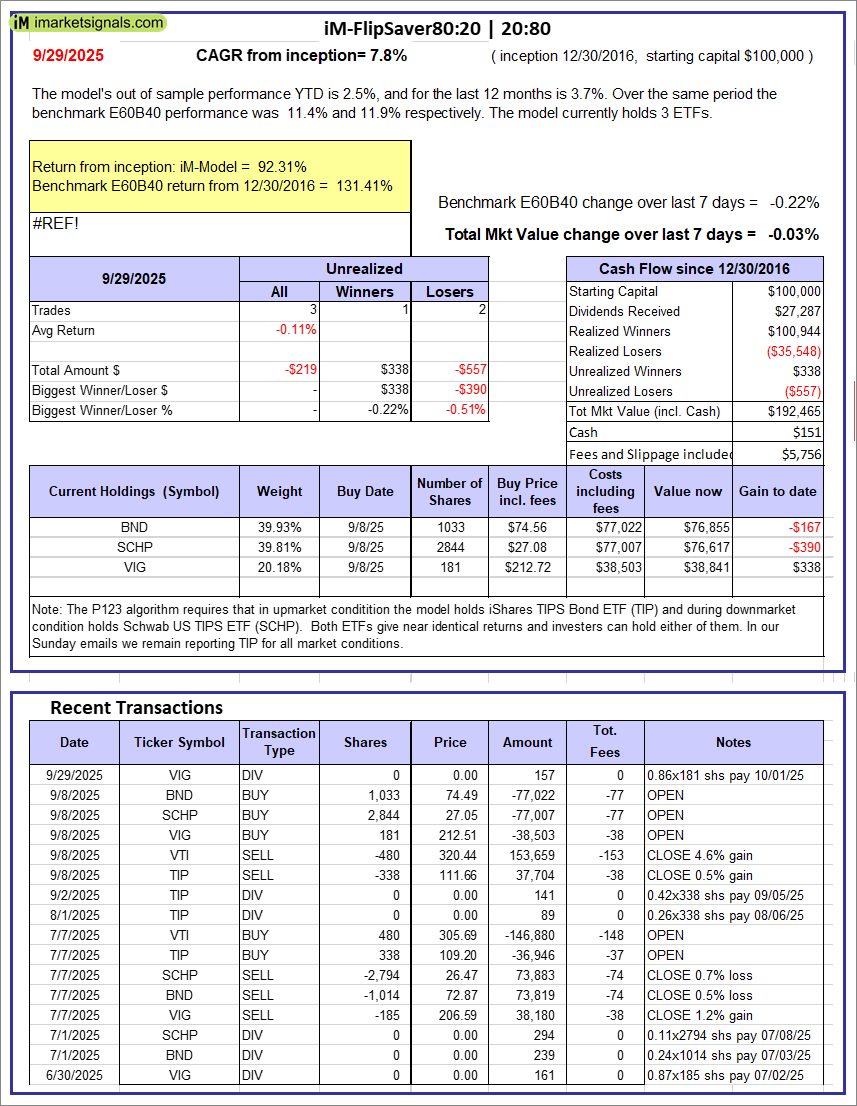 |
iM-FlipSaver 80:20 | 20:80 – 2017: The model’s out of sample performance YTD is 2.5%, and for the last 12 months is 3.7%. Over the same period the benchmark E60B40 performance was 11.4% and 11.9% respectively. Over the previous week the market value of iM-FlipSaver 80:20 | 20:80 gained -0.03% at a time when SPY gained -0.22%. A starting capital of $100,000 at inception on 1/2/2017 would have grown to $192,465 which includes $151 cash and excludes $5,756 spent on fees and slippage. |
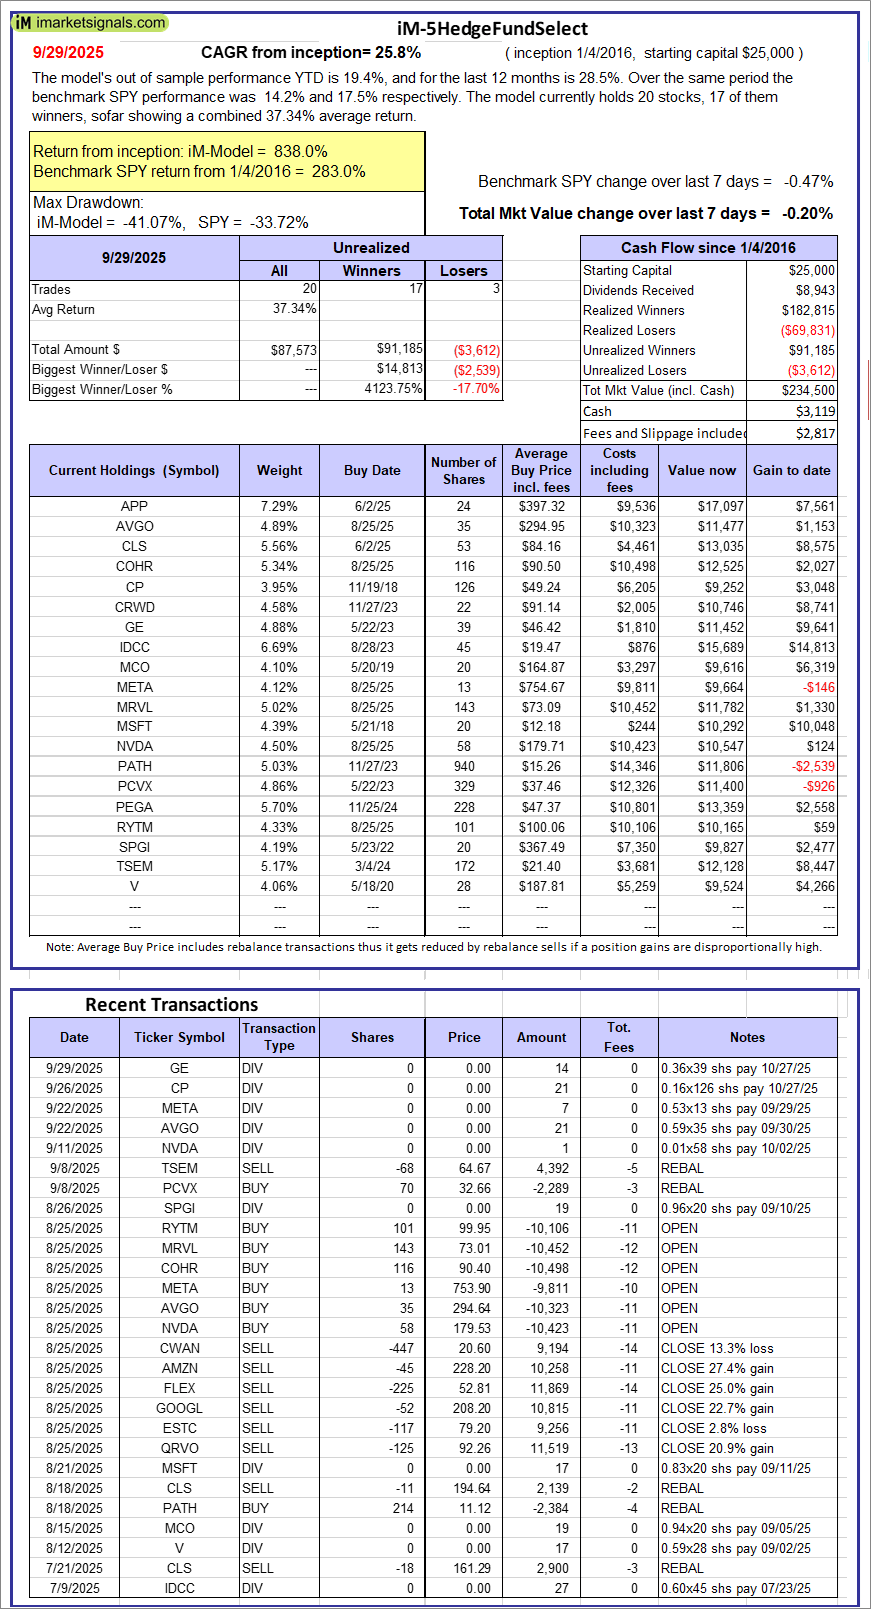 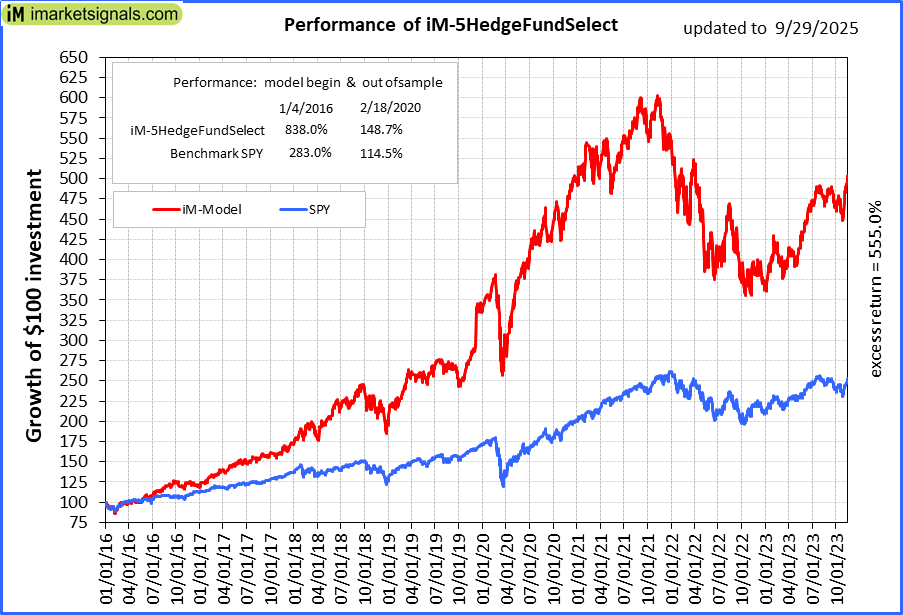 |
iM-5HedgeFundSelect: Since inception, on 1/5/2016, the model gained 838.00% while the benchmark SPY gained 282.97% over the same period. Over the previous week the market value of iM-5HedgeFundSelect gained -0.20% at a time when SPY gained -0.47%. A starting capital of $25,000 at inception on 1/5/2016 would have grown to $234,500 which includes $3,119 cash and excludes $2,817 spent on fees and slippage. |
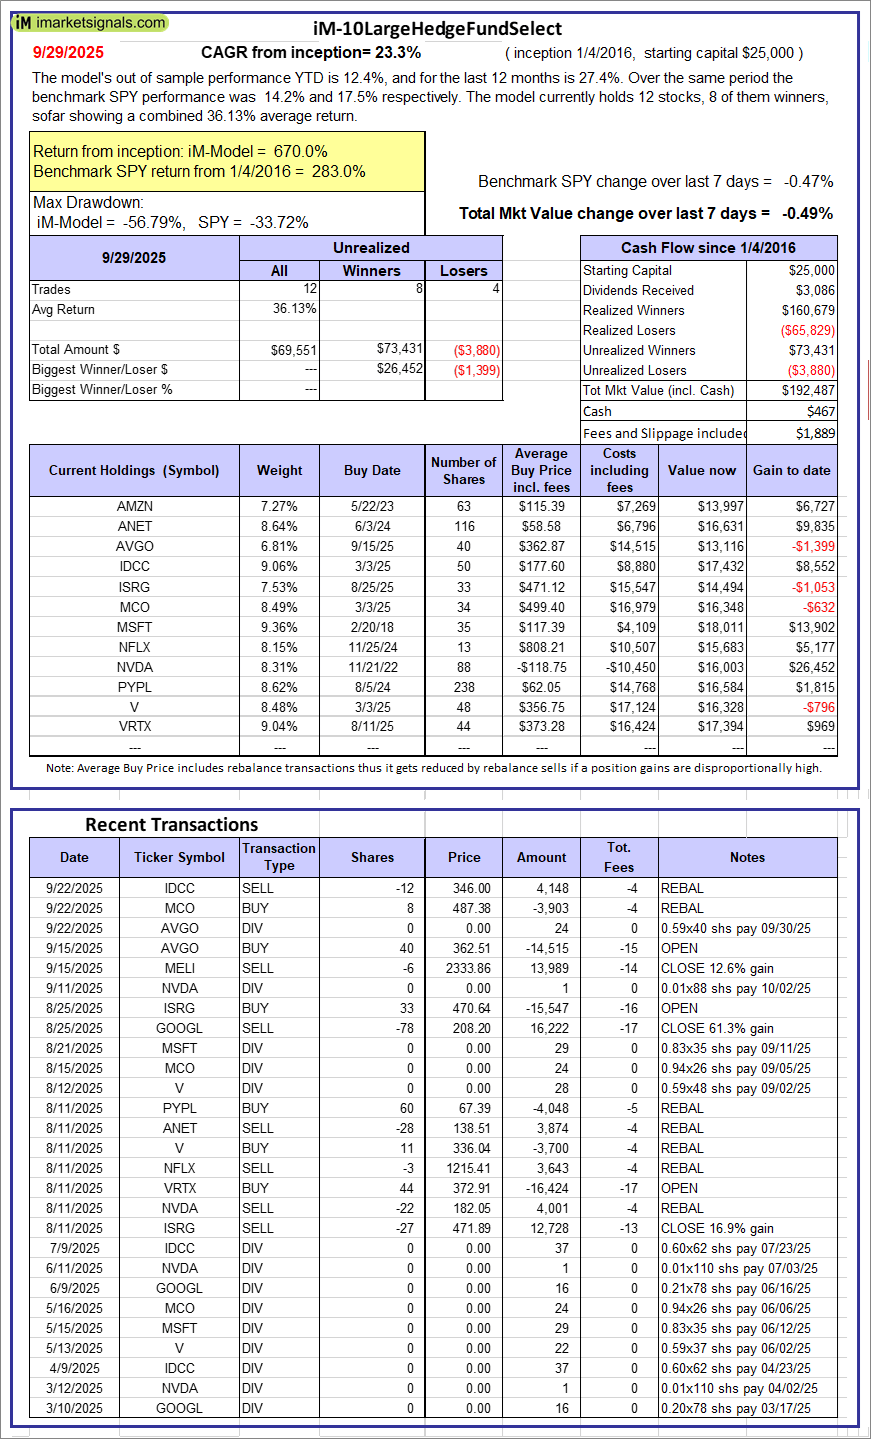 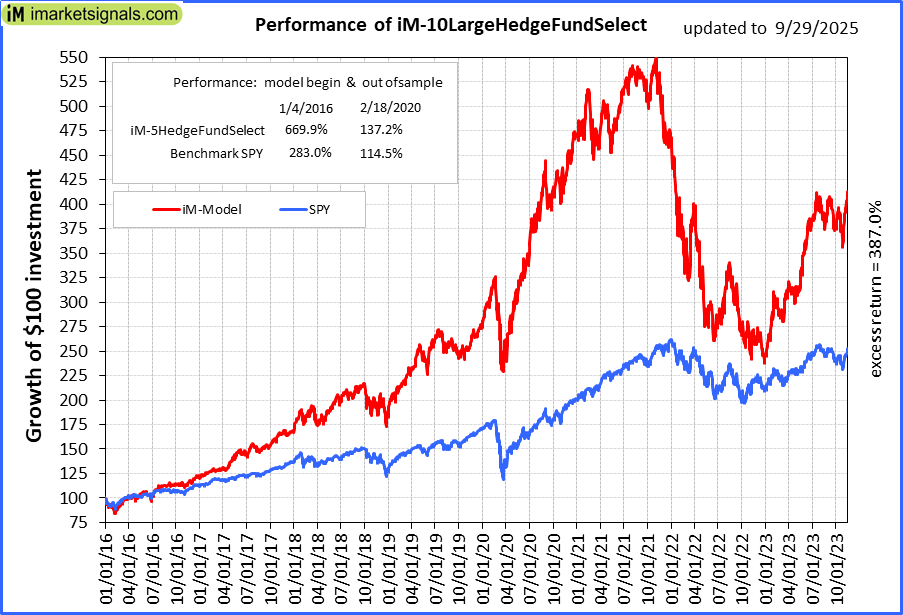 |
iM-10LargeHedgeFundSelect: Since inception, on 1/5/2016, the model gained 669.95% while the benchmark SPY gained 282.97% over the same period. Over the previous week the market value of iM-10LargeHedgeFundSelect gained -0.49% at a time when SPY gained -0.47%. A starting capital of $25,000 at inception on 1/5/2016 would have grown to $192,487 which includes $467 cash and excludes $1,889 spent on fees and slippage. |
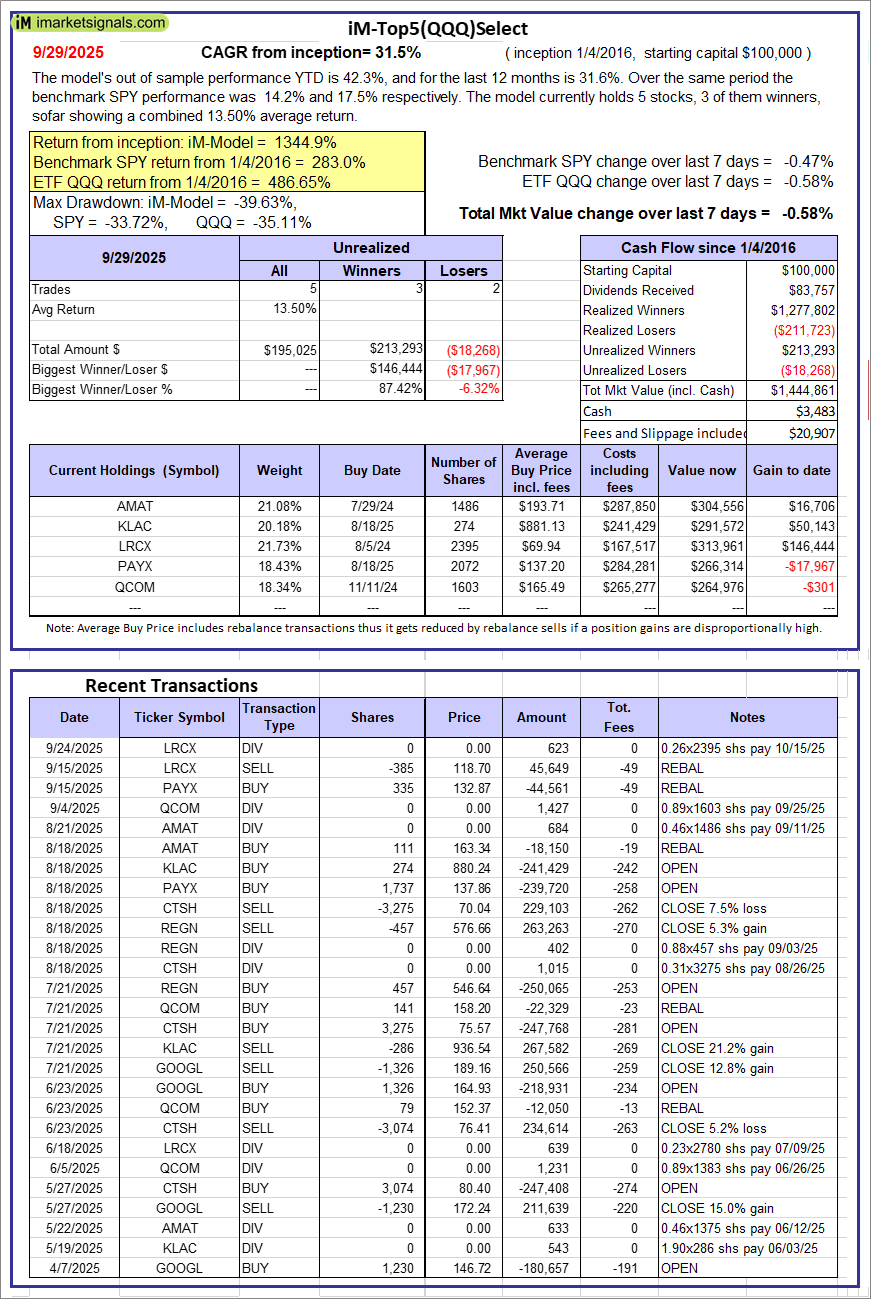 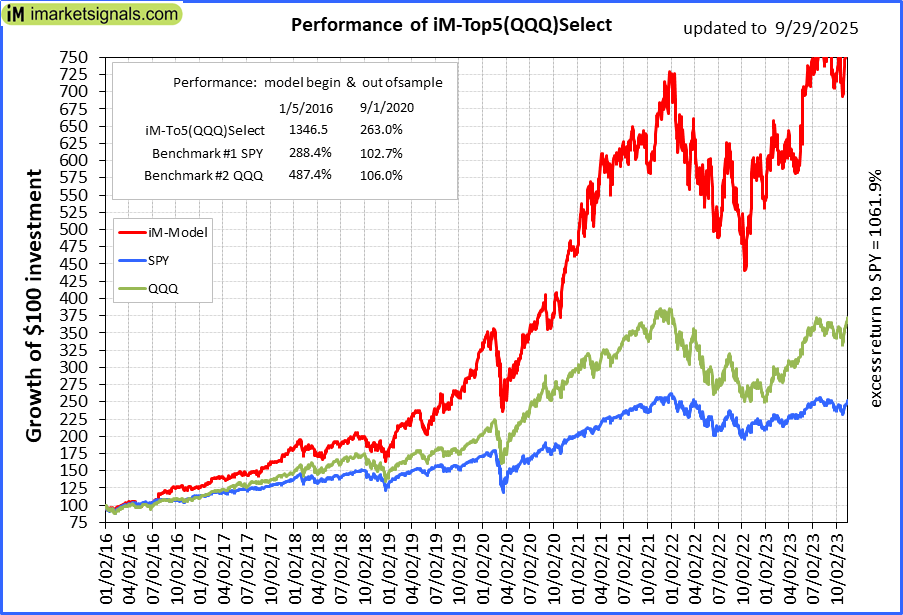 |
iM-Top5(QQQ)Select: Since inception, on 1/5/2016, the model gained 1344.86% while the benchmark SPY gained 282.97% over the same period. Over the previous week the market value of iM-Top5(QQQ)Select gained -0.58% at a time when SPY gained -0.47%. A starting capital of $100,000 at inception on 1/5/2016 would have grown to $1,444,861 which includes $3,483 cash and excludes $20,907 spent on fees and slippage. |
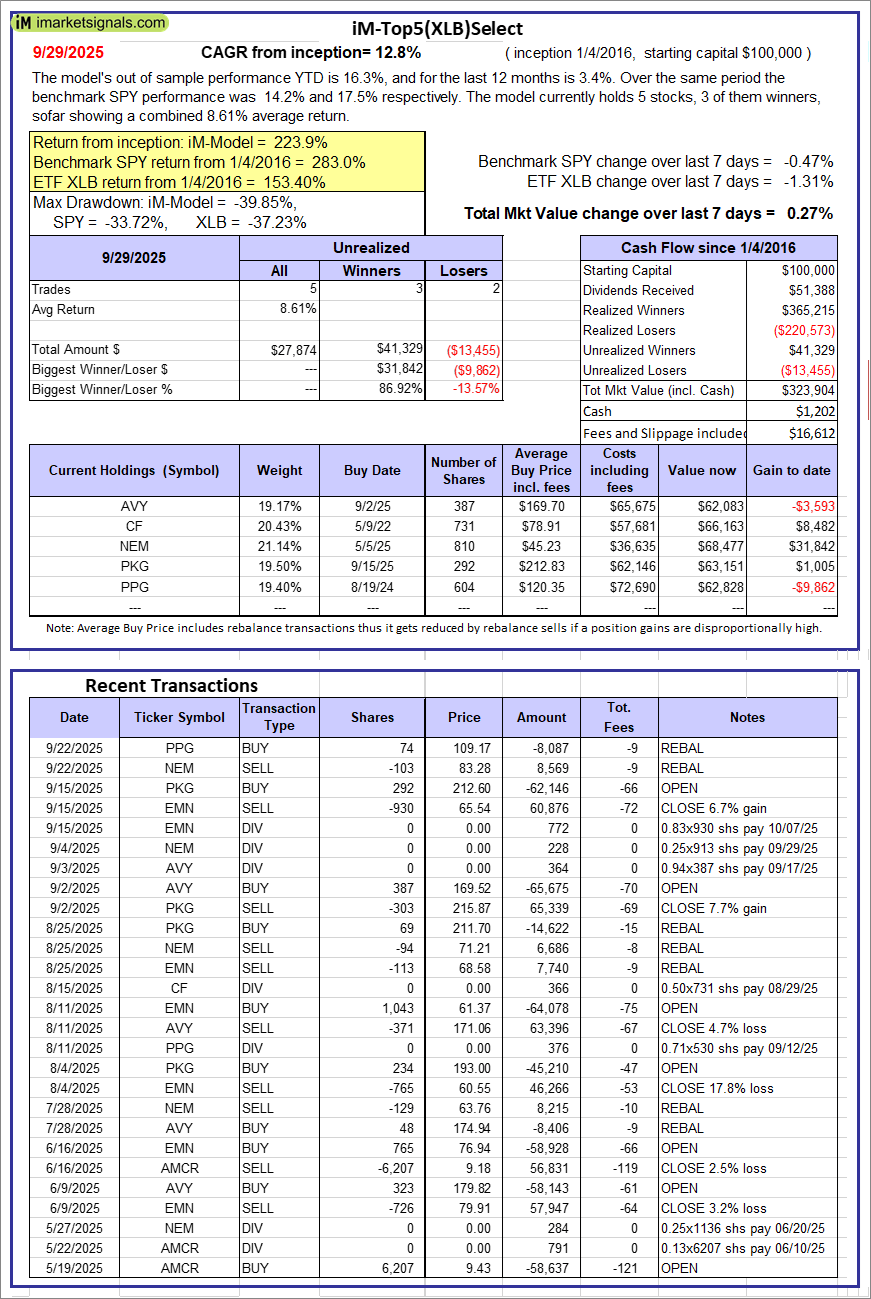 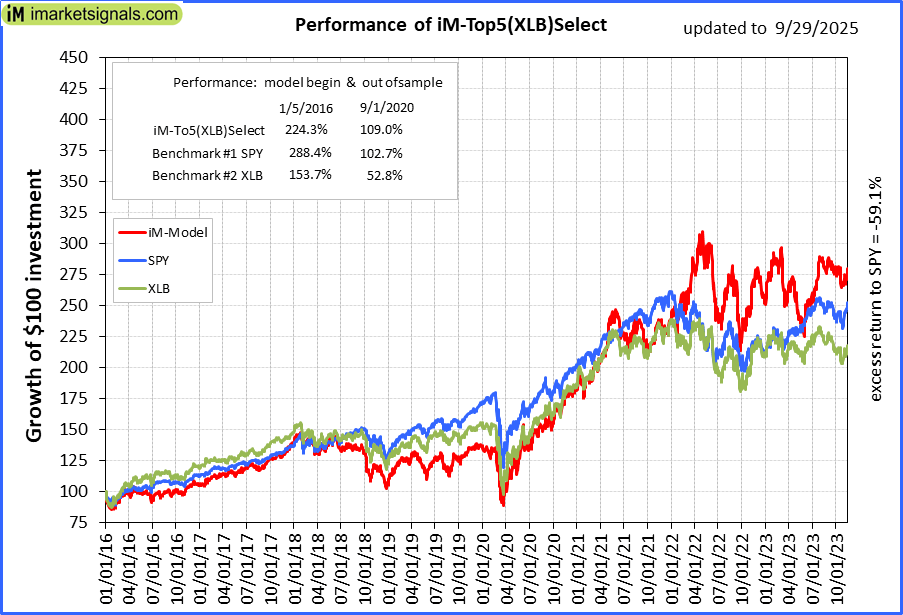 |
iM-Top5(XLB)Select: Since inception, on 1/5/2016, the model gained 223.90% while the benchmark SPY gained 282.97% over the same period. Over the previous week the market value of iM-Top5(XLB)Select gained 0.27% at a time when SPY gained -0.47%. A starting capital of $100,000 at inception on 1/5/2016 would have grown to $323,904 which includes $1,202 cash and excludes $16,612 spent on fees and slippage. |
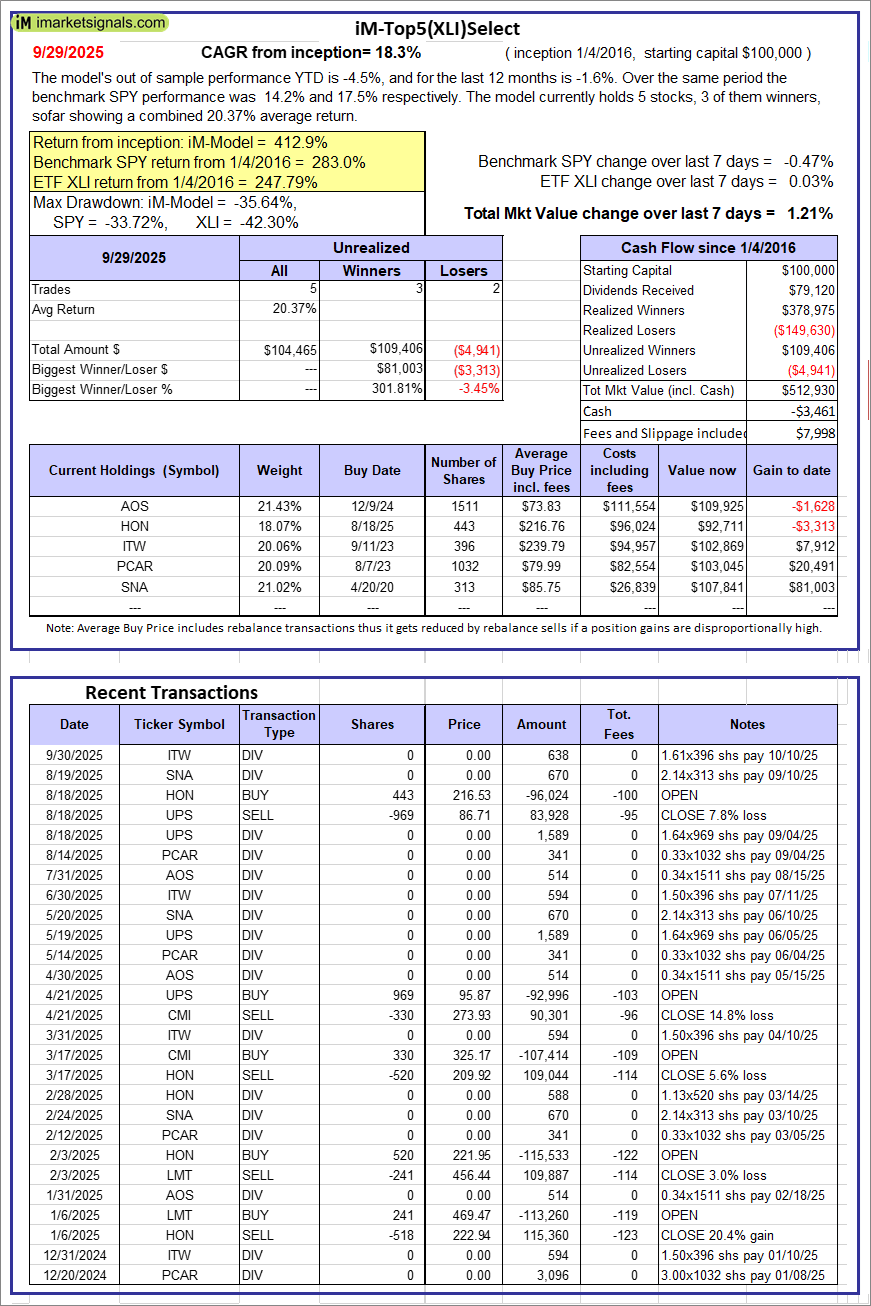 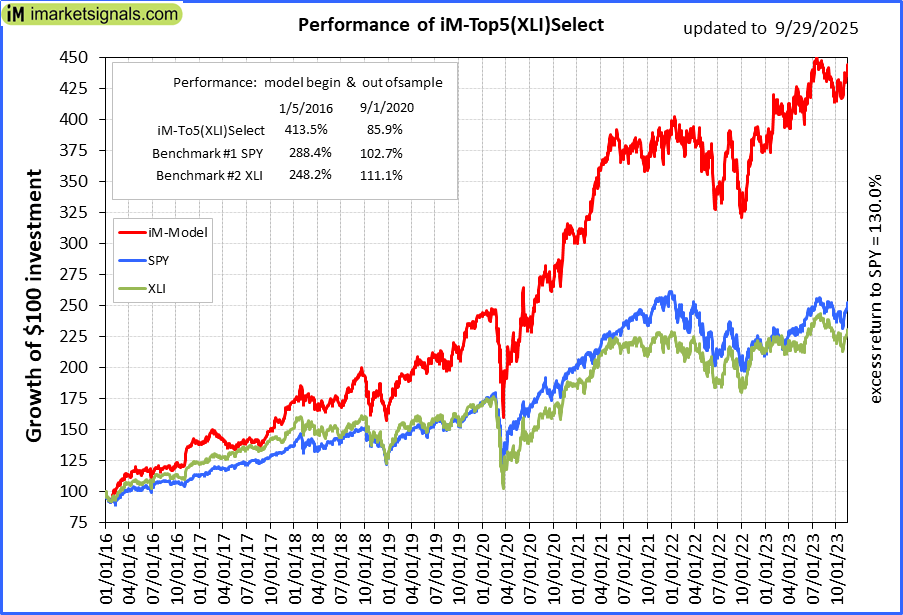 |
iM-Top5(XLI)Select: Since inception, on 1/5/2016, the model gained 412.93% while the benchmark SPY gained 282.97% over the same period. Over the previous week the market value of iM-Top5(XLI)Select gained 1.21% at a time when SPY gained -0.47%. A starting capital of $100,000 at inception on 1/5/2016 would have grown to $512,930 which includes -$3,461 cash and excludes $7,998 spent on fees and slippage. |
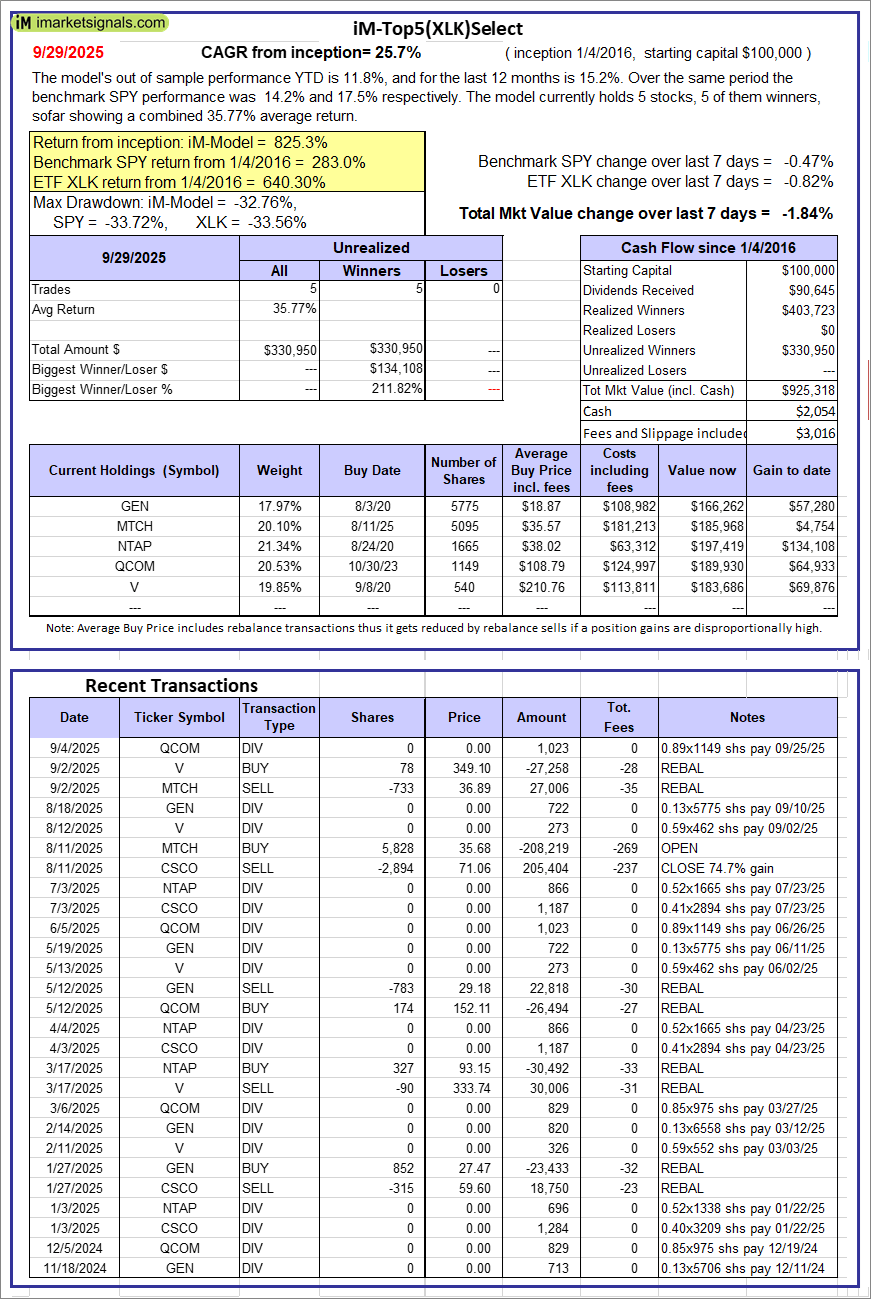 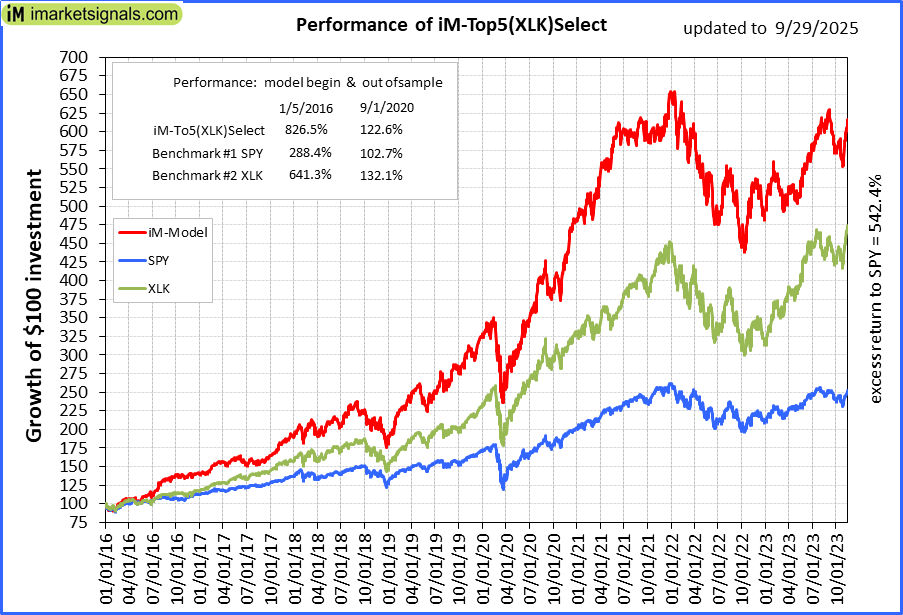 |
iM-Top5(XLK)Select: Since inception, on 1/5/2016, the model gained 825.32% while the benchmark SPY gained 282.97% over the same period. Over the previous week the market value of iM-Top5(XLK)Select gained -1.84% at a time when SPY gained -0.47%. A starting capital of $100,000 at inception on 1/5/2016 would have grown to $925,318 which includes $2,054 cash and excludes $3,016 spent on fees and slippage. |
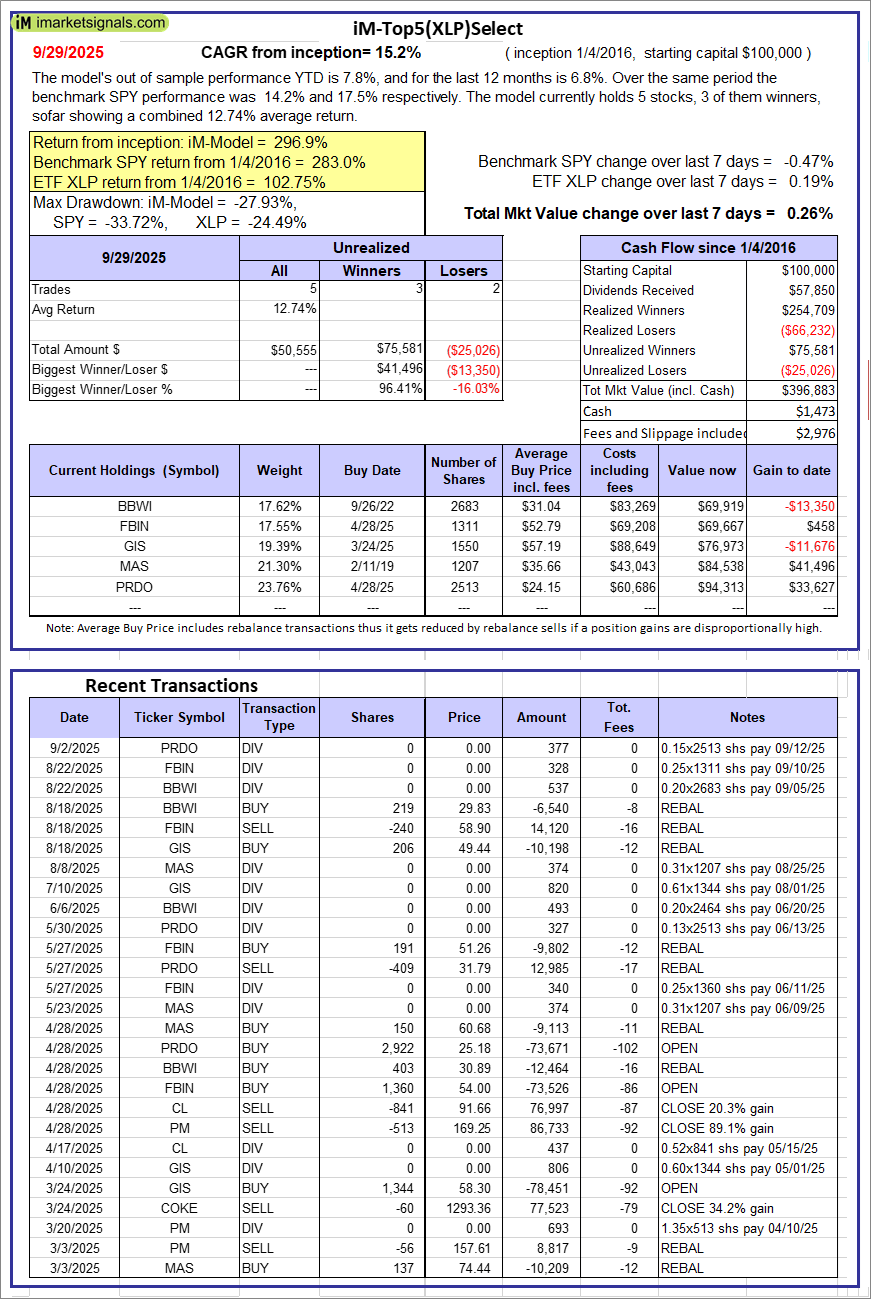 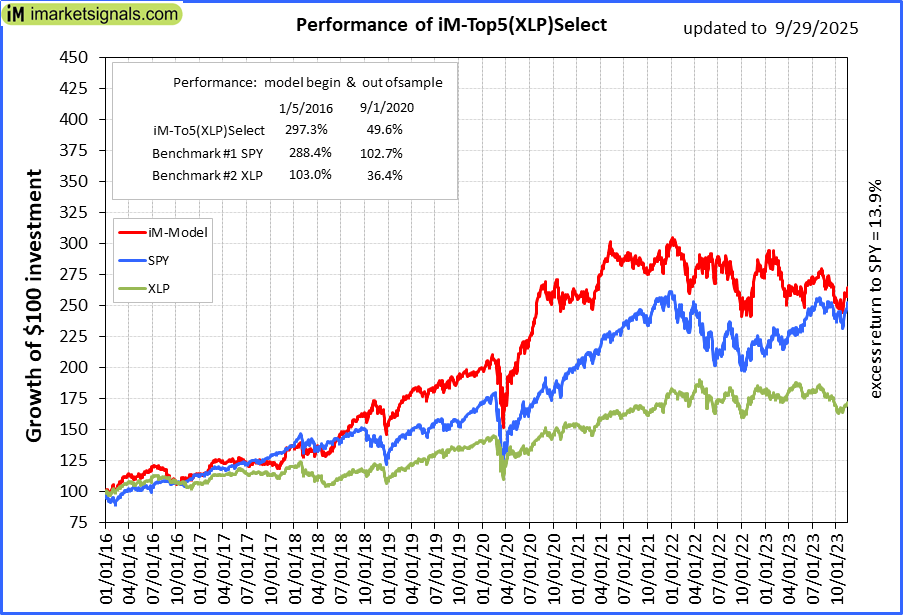 |
iM-Top5(XLP)Select: Since inception, on 1/5/2016, the model gained 296.88% while the benchmark SPY gained 282.97% over the same period. Over the previous week the market value of iM-Top5(XLP)Select gained 0.26% at a time when SPY gained -0.47%. A starting capital of $100,000 at inception on 1/5/2016 would have grown to $396,883 which includes $1,473 cash and excludes $2,976 spent on fees and slippage. |
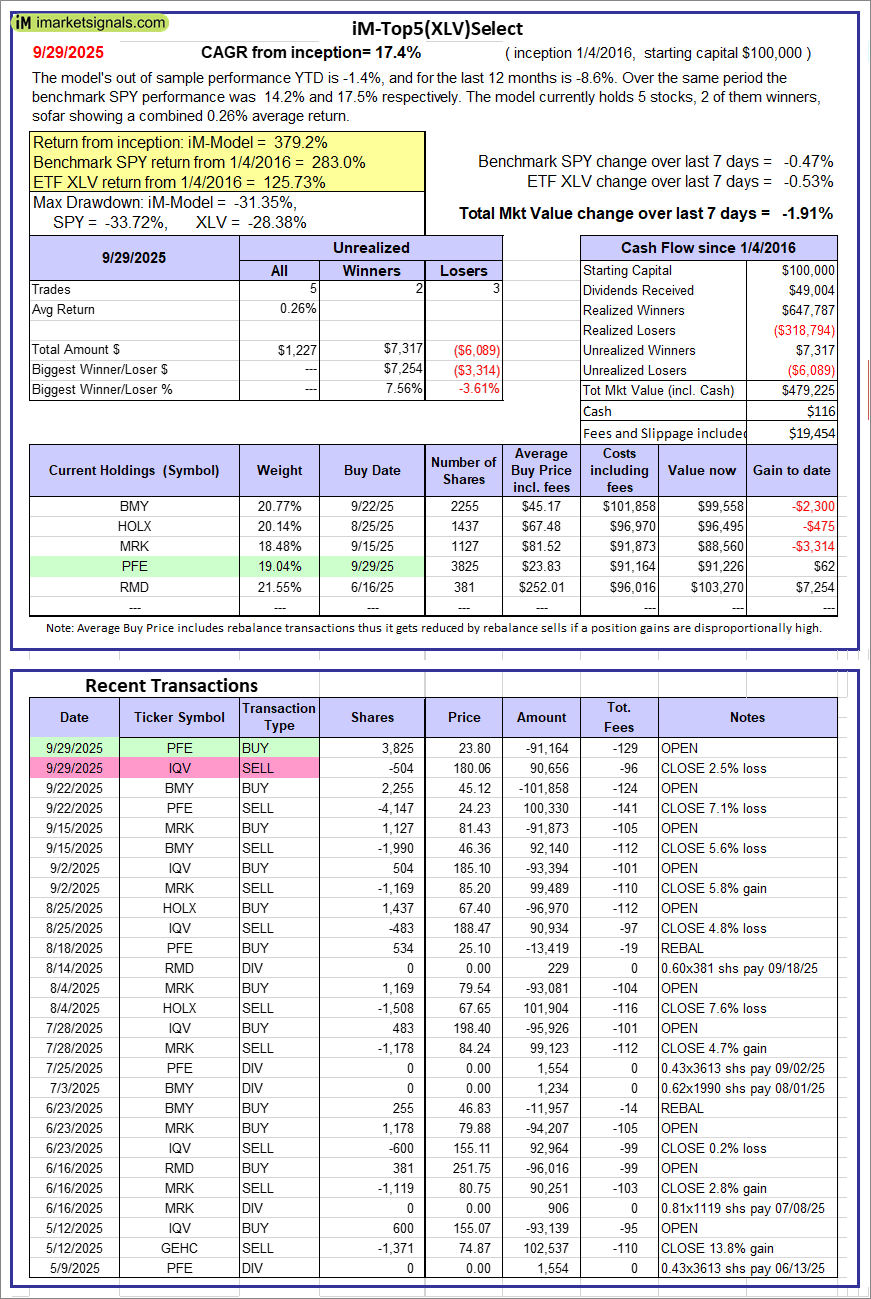 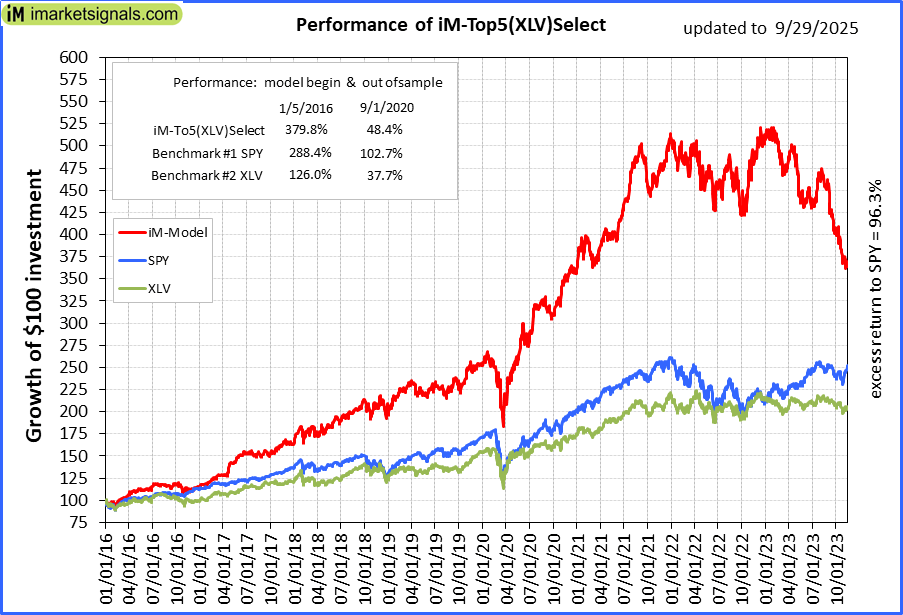 |
iM-Top5(XLV)Select: Since inception, on 1/5/2016, the model gained 379.23% while the benchmark SPY gained 282.97% over the same period. Over the previous week the market value of iM-Top5(XLV)Select gained -1.91% at a time when SPY gained -0.47%. A starting capital of $100,000 at inception on 1/5/2016 would have grown to $479,225 which includes $116 cash and excludes $19,454 spent on fees and slippage. |
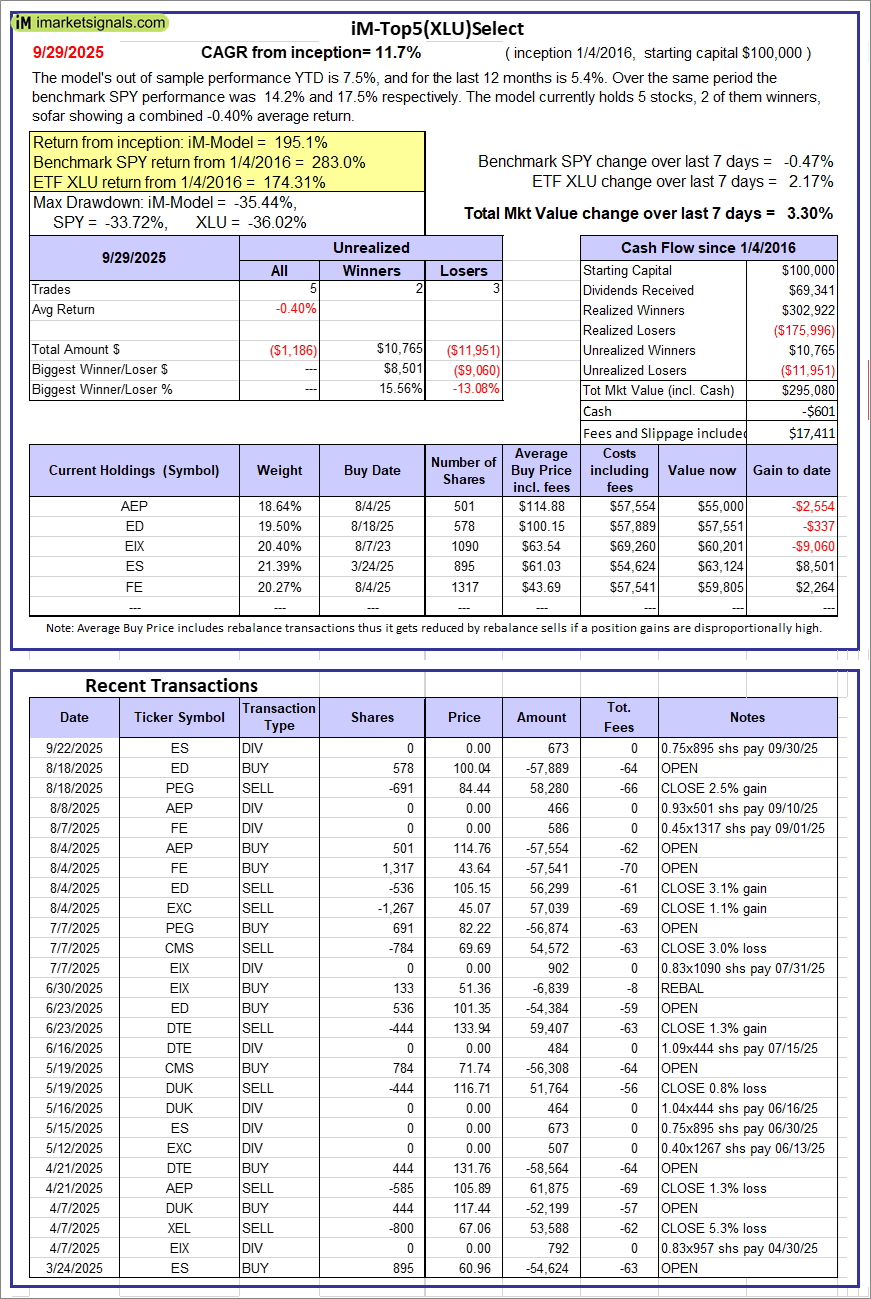 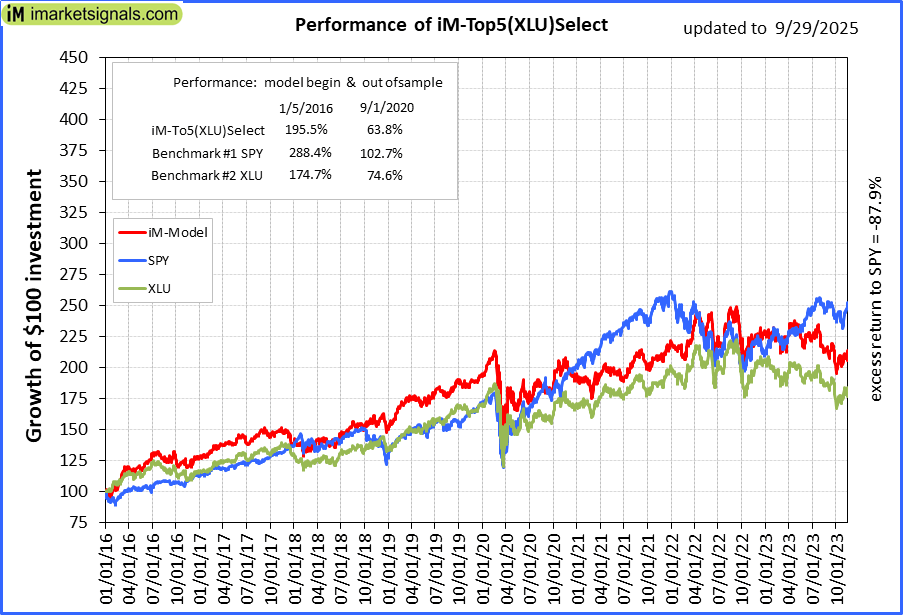 |
iM-Top5(XLU)Select: Since inception, on 1/5/2016, the model gained 195.08% while the benchmark SPY gained 282.97% over the same period. Over the previous week the market value of iM-Top5(XLU)Select gained 3.30% at a time when SPY gained -0.47%. A starting capital of $100,000 at inception on 1/5/2016 would have grown to $295,080 which includes -$601 cash and excludes $17,411 spent on fees and slippage. |
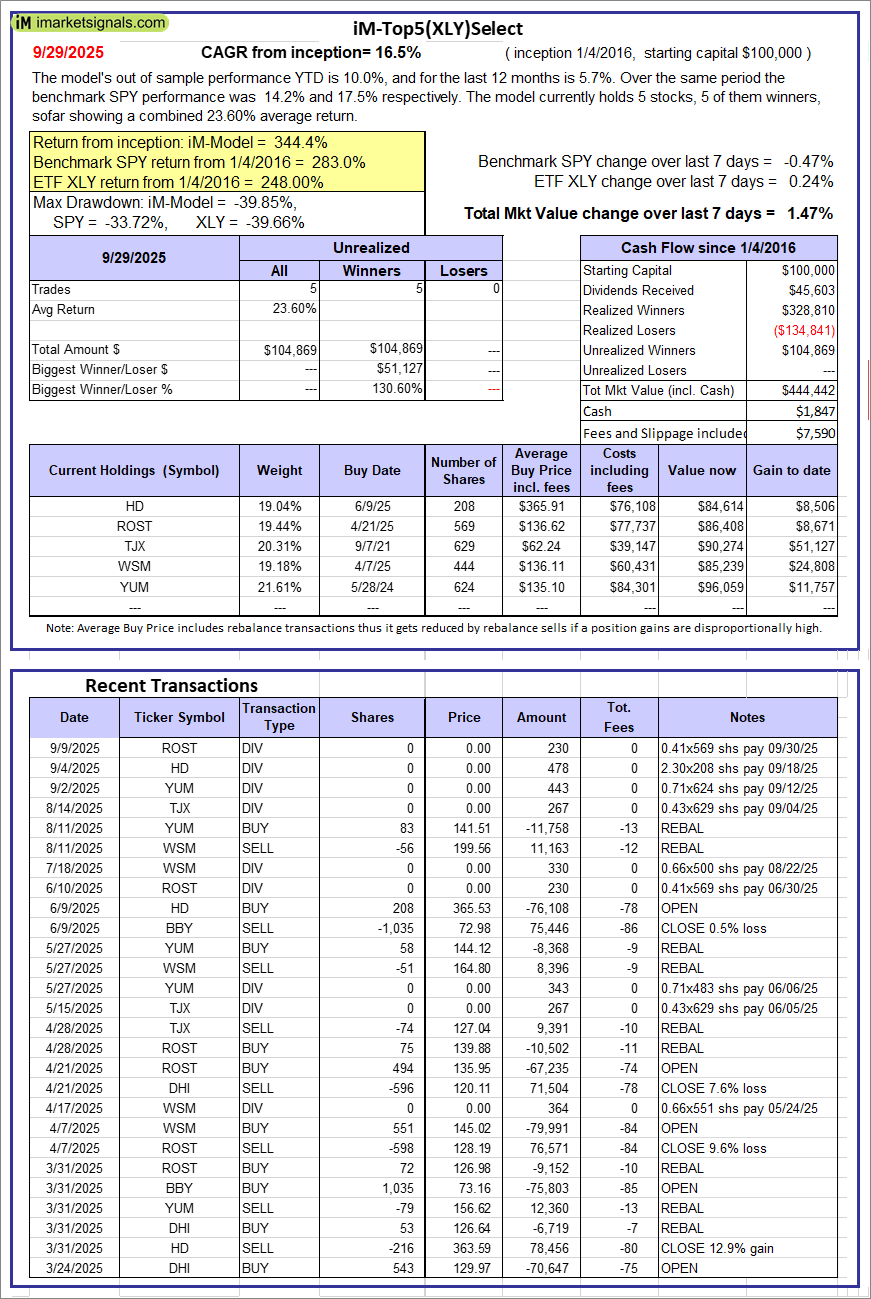 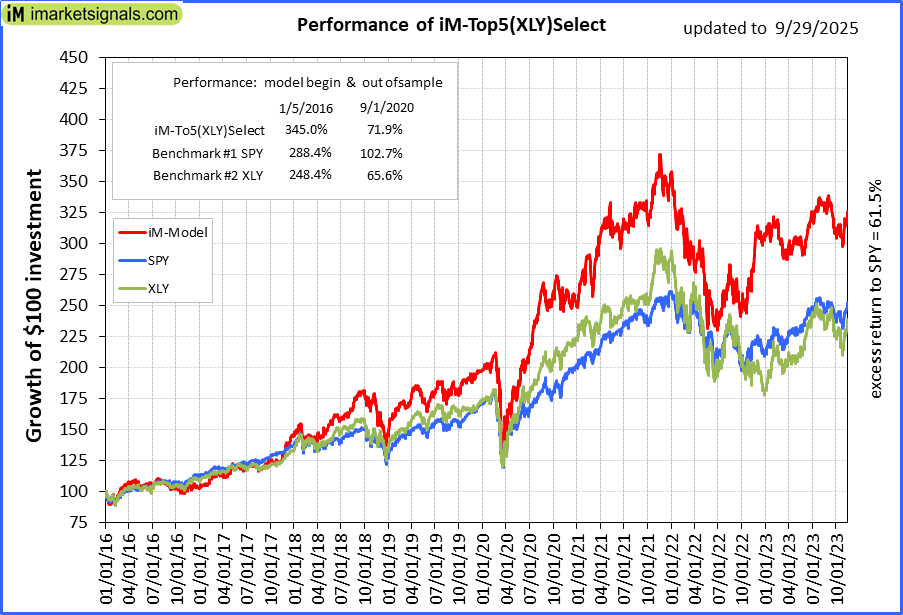 |
iM-Top5(XLY)Select: Since inception, on 1/5/2016, the model gained 344.44% while the benchmark SPY gained 282.97% over the same period. Over the previous week the market value of iM-Top5(XLY)Select gained 1.47% at a time when SPY gained -0.47%. A starting capital of $100,000 at inception on 1/5/2016 would have grown to $444,442 which includes $1,847 cash and excludes $7,590 spent on fees and slippage. |
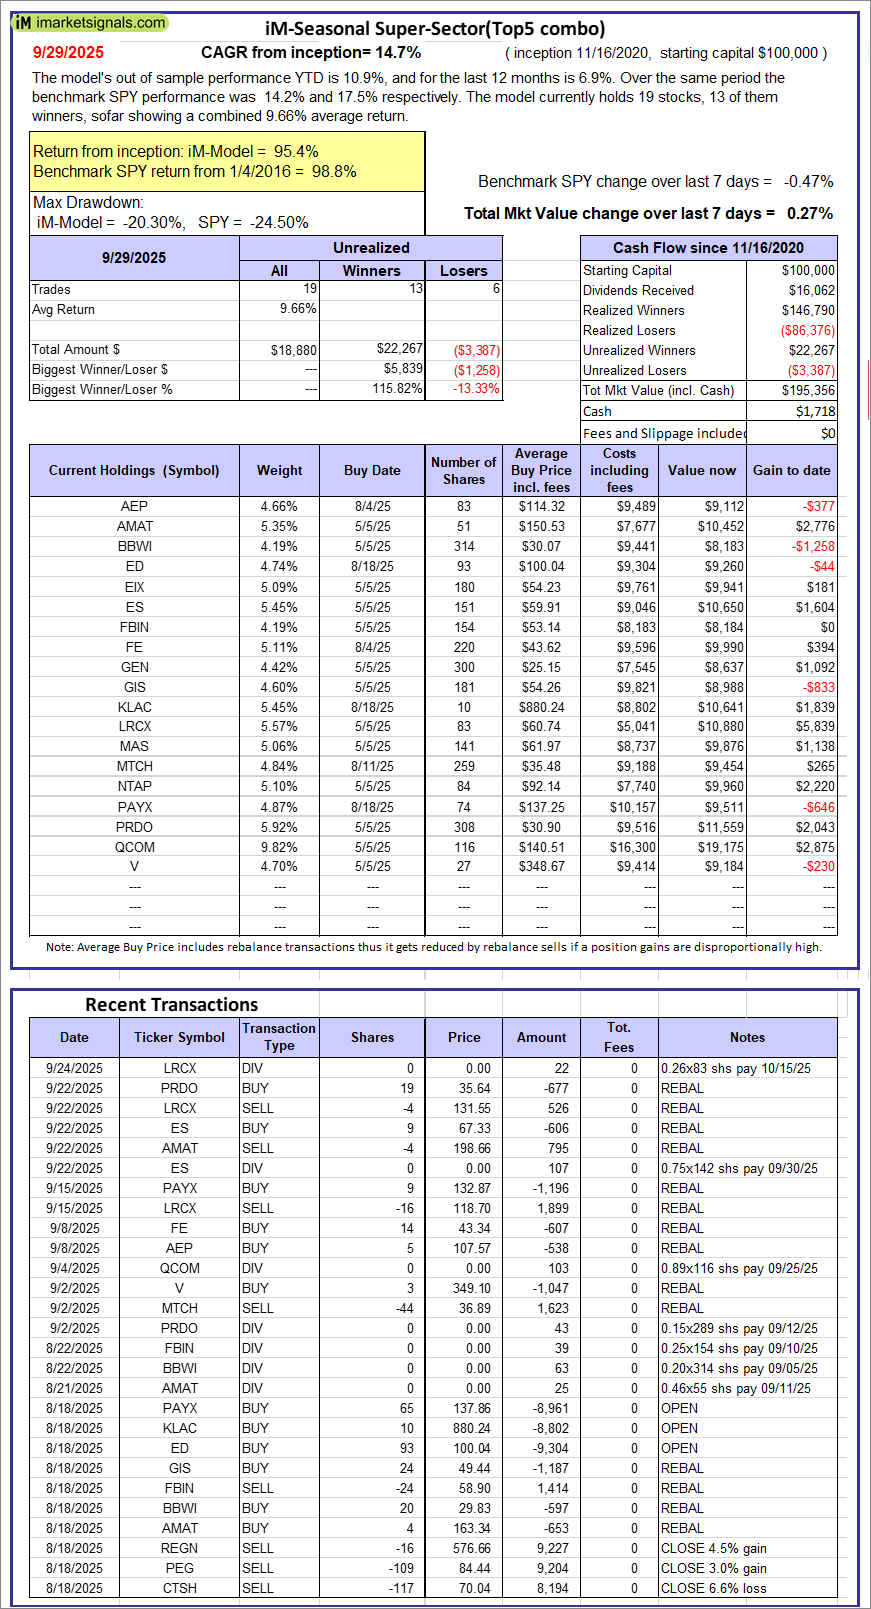 |
iM-Seasonal Super-Sectors (Top5 combo) : Since inception, on 11/17/2020, the model gained 95.36% while the benchmark SPY gained 98.80% over the same period. Over the previous week the market value of iM-Seasonal Super-Sectors (Top5 combo) gained 0.27% at a time when SPY gained -0.47%. A starting capital of $100,000 at inception on 11/17/2020 would have grown to $195,356 which includes $1,718 cash and excludes $00 spent on fees and slippage. |
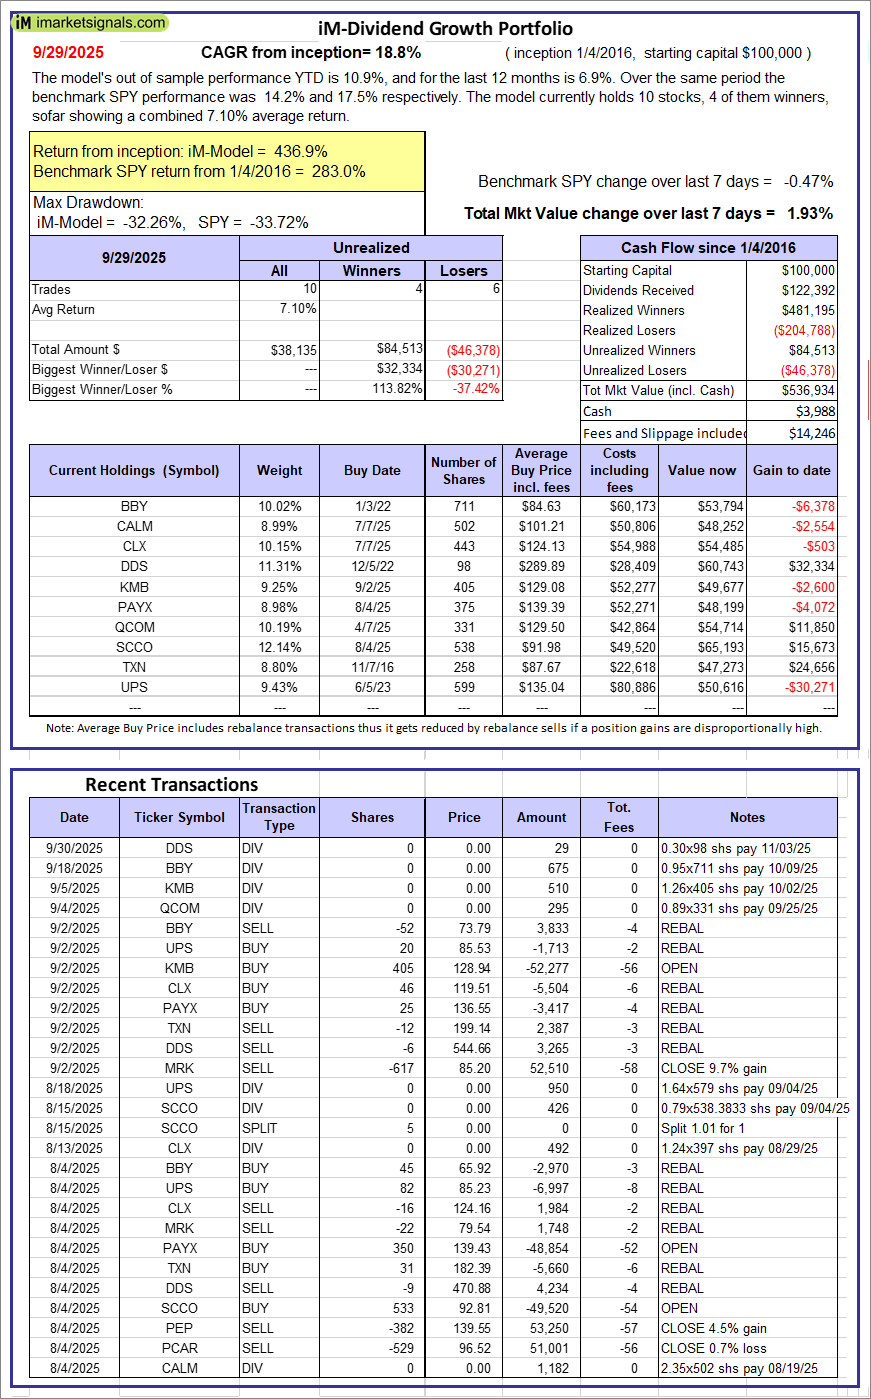 |
iM-Dividend Growth Portfolio: The model’s out of sample performance YTD is 10.9%, and for the last 12 months is 6.9%. Over the same period the benchmark SPY performance was 14.2% and 17.5% respectively. Over the previous week the market value of the iM-Dividend Growth Portfolio gained 1.93% at a time when SPY gained -0.47%. A starting capital of $100,000 at inception on 6/30/2016 would have grown to $536,934 which includes $3,988 cash and excludes $14,246 spent on fees and slippage. |
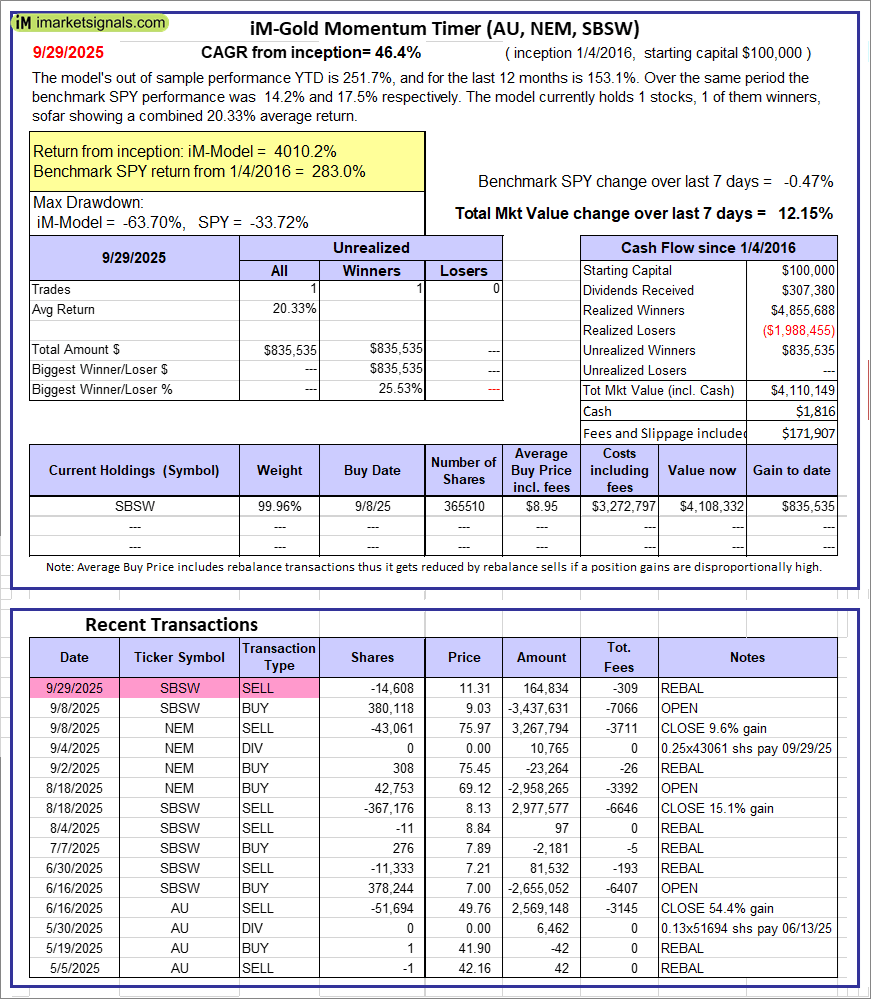 |
iM-Gold Momentum Timer (AU, NEM, SBSW): The model’s out of sample performance YTD is 251.7%, and for the last 12 months is 153.1%. Over the same period the benchmark SPY performance was 14.2% and 17.5% respectively. Over the previous week the market value of iM-Gold Momentum Timer (AU, NEM, SBSW) gained 12.15% at a time when SPY gained -0.47%. A starting capital of $100,000 at inception on 6/30/2016 would have grown to $1,816 which includes $171,907 cash and excludes Gain to date spent on fees and slippage. |
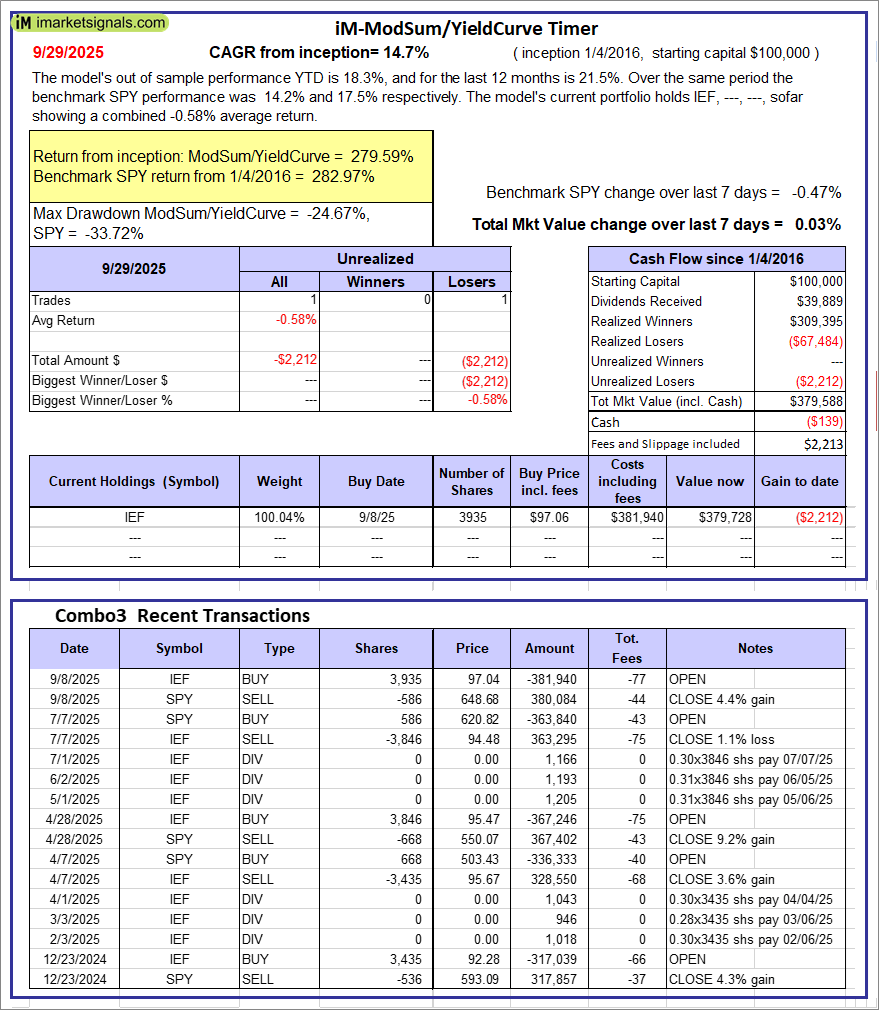 |
iM-ModSum/YieldCurve Timer: The model’s out of sample performance YTD is 18.3%, and for the last 12 months is 21.5%. Over the same period the benchmark SPY performance was 14.2% and 17.5% respectively. Over the previous week the market value of iM-PortSum/YieldCurve Timer gained 0.03% at a time when SPY gained -0.47%. A starting capital of $100,000 at inception on 1/1/2016 would have grown to $379,588 which includes -$139 cash and excludes $2,213 spent on fees and slippage. |
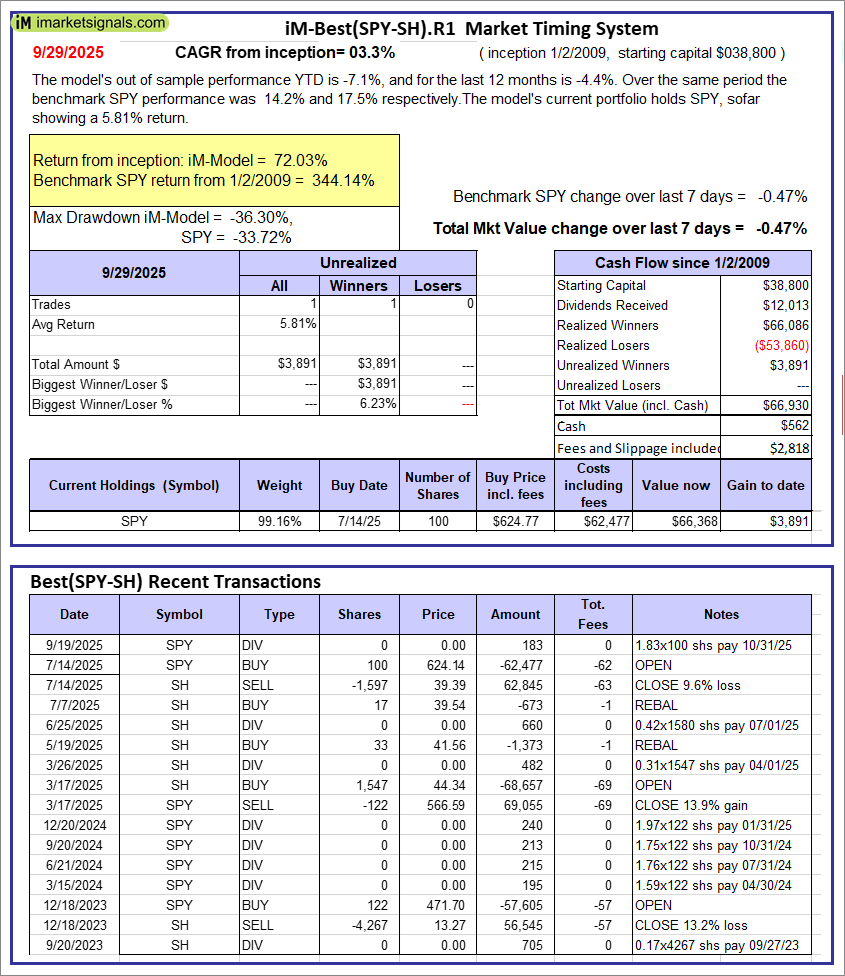 |
iM-Best(SPY-SH).R1: The model’s out of sample performance YTD is -7.1%, and for the last 12 months is -4.4%. Over the same period the benchmark SPY performance was 14.2% and 17.5% respectively. Over the previous week the market value of Best(SPY-SH) gained -0.47% at a time when SPY gained -0.47%. A starting capital of $100,000 at inception on 1/2/2009 would have grown to $66,930 which includes $562 cash and excludes $2,818 spent on fees and slippage. |
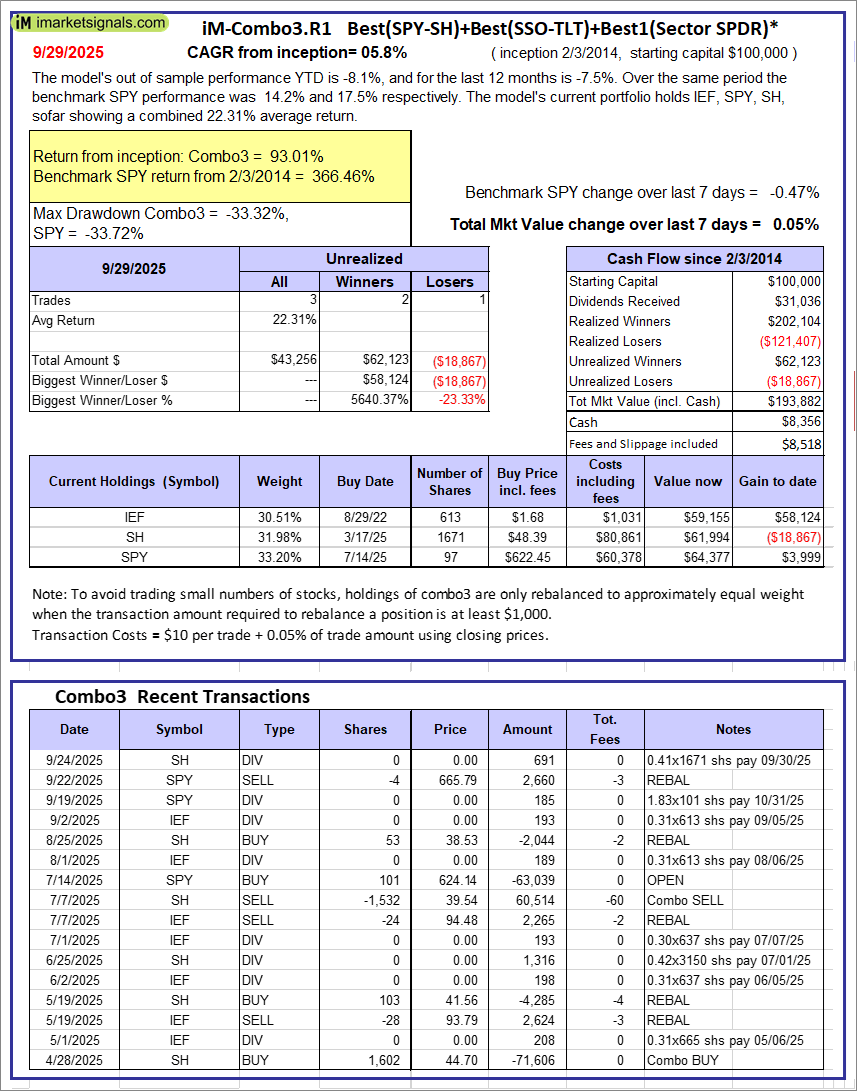 |
iM-Combo3.R1: The model’s out of sample performance YTD is -8.1%, and for the last 12 months is -7.5%. Over the same period the benchmark SPY performance was 14.2% and 17.5% respectively. Over the previous week the market value of iM-Combo3.R1 gained 0.05% at a time when SPY gained -0.47%. A starting capital of $100,000 at inception on 2/3/2014 would have grown to $193,882 which includes $8,356 cash and excludes $8,518 spent on fees and slippage. |
 |
iM-Combo5: The model’s out of sample performance YTD is 2.0%, and for the last 12 months is -17.5%. Over the same period the benchmark SPY performance was 8.7% and -3.8% respectively. Over the previous week the market value of iM-Combo5 gained -1.07% at a time when SPY gained 1.06%. A starting capital of $100,000 at inception on 2/22/2016 would have grown to $156,429 which includes $869 cash and excludes $0 spent on fees and slippage. |
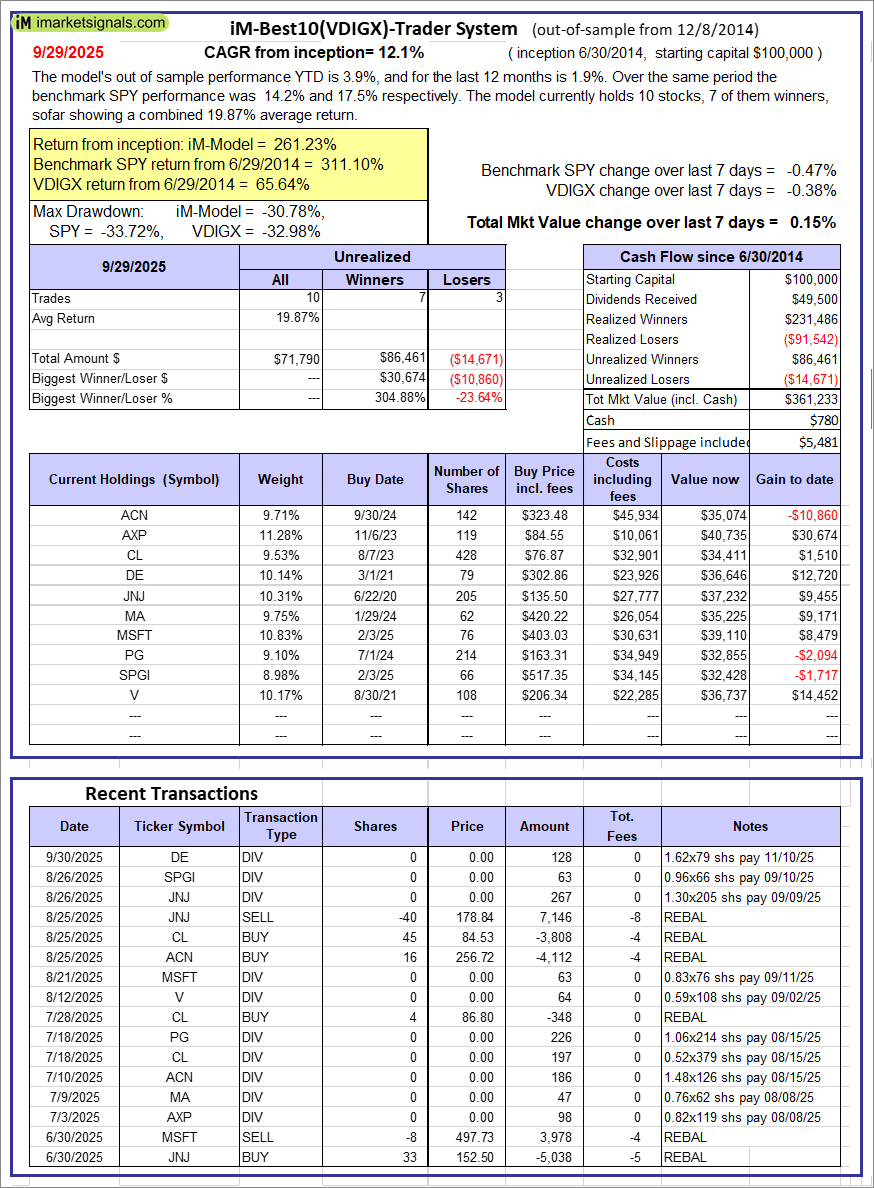 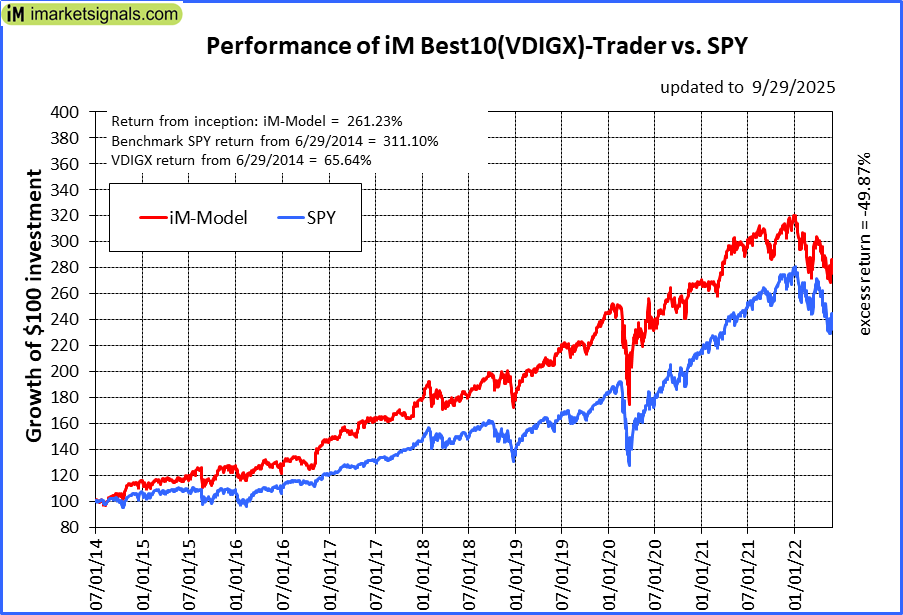 |
iM-Best10(VDIGX)-Trader: The model’s out of sample performance YTD is 3.9%, and for the last 12 months is 1.9%. Over the same period the benchmark SPY performance was 14.2% and 17.5% respectively. Since inception, on 7/1/2014, the model gained 261.23% while the benchmark SPY gained 311.10% and VDIGX gained 65.64% over the same period. Over the previous week the market value of iM-Best10(VDIGX) gained 0.15% at a time when SPY gained -0.47%. A starting capital of $100,000 at inception on 7/1/2014 would have grown to $361,233 which includes $780 cash and excludes $5,481 spent on fees and slippage. |
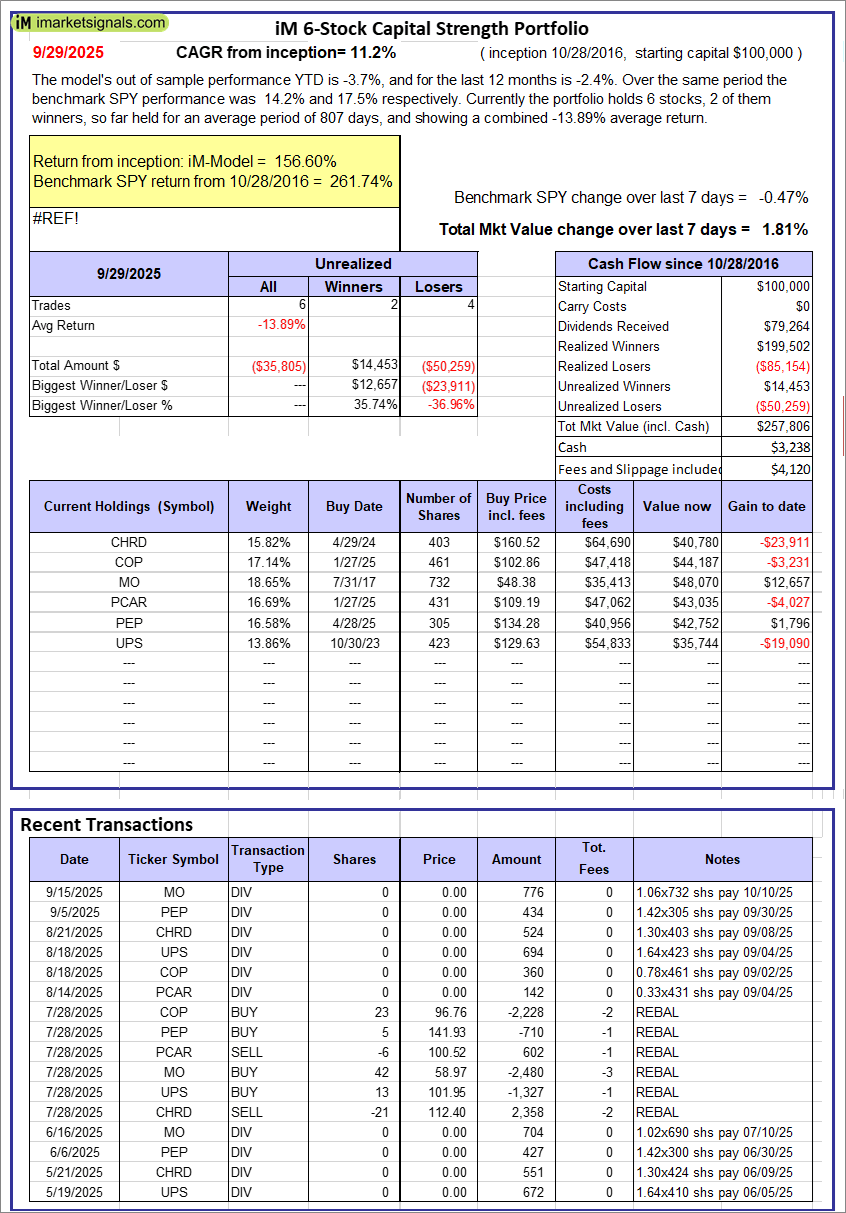 |
iM 6-Stock Capital Strength Portfolio: The model’s out of sample performance YTD is -3.7%, and for the last 12 months is -2.4%. Over the same period the benchmark SPY performance was 14.2% and 17.5% respectively. Over the previous week the market value of the iM 6-Stock Capital Strength Portfolio gained 1.81% at a time when SPY gained -0.47%. A starting capital of $100,000 at inception on 10/28/2016 would have grown to $257,806 which includes $3,238 cash and excludes $4,120 spent on fees and slippage. |
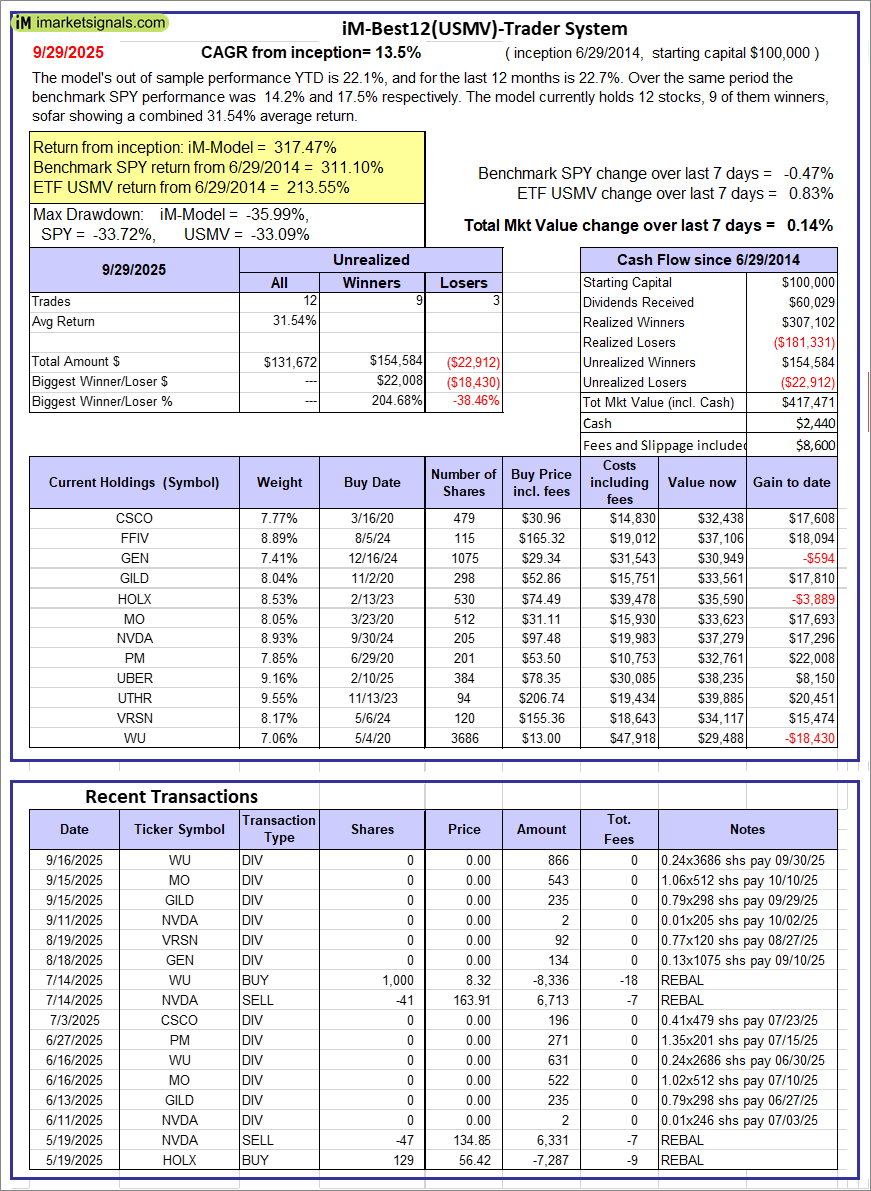 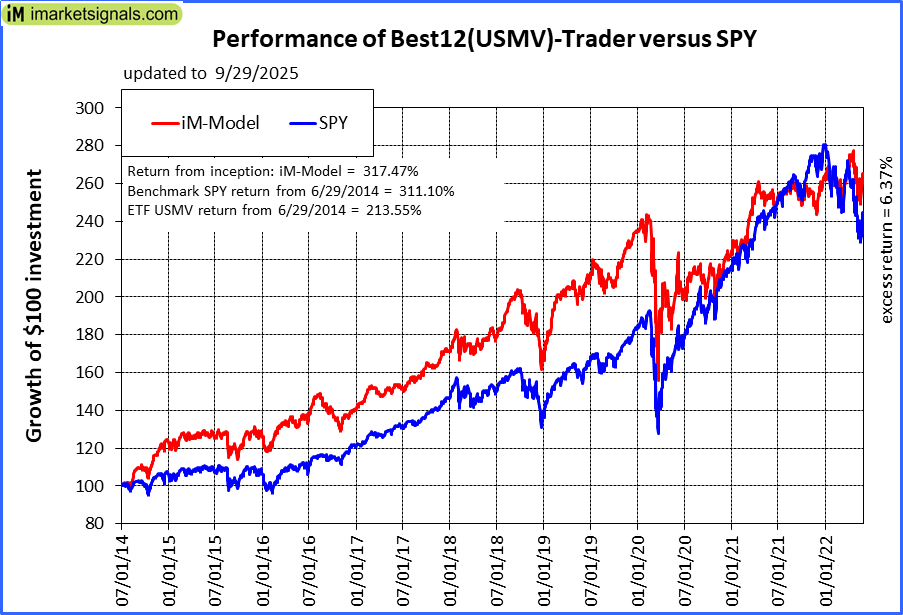 |
iM-Best12(USMV)-Trader: The model’s out of sample performance YTD is 22.1%, and for the last 12 months is 22.7%. Over the same period the benchmark SPY performance was 14.2% and 17.5% respectively. Since inception, on 6/30/2014, the model gained 317.47% while the benchmark SPY gained 311.10% and the ETF USMV gained 213.55% over the same period. Over the previous week the market value of iM-Best12(USMV)-Trader gained 0.14% at a time when SPY gained -0.47%. A starting capital of $100,000 at inception on 6/30/2014 would have grown to $417,471 which includes $2,440 cash and excludes $8,600 spent on fees and slippage. |
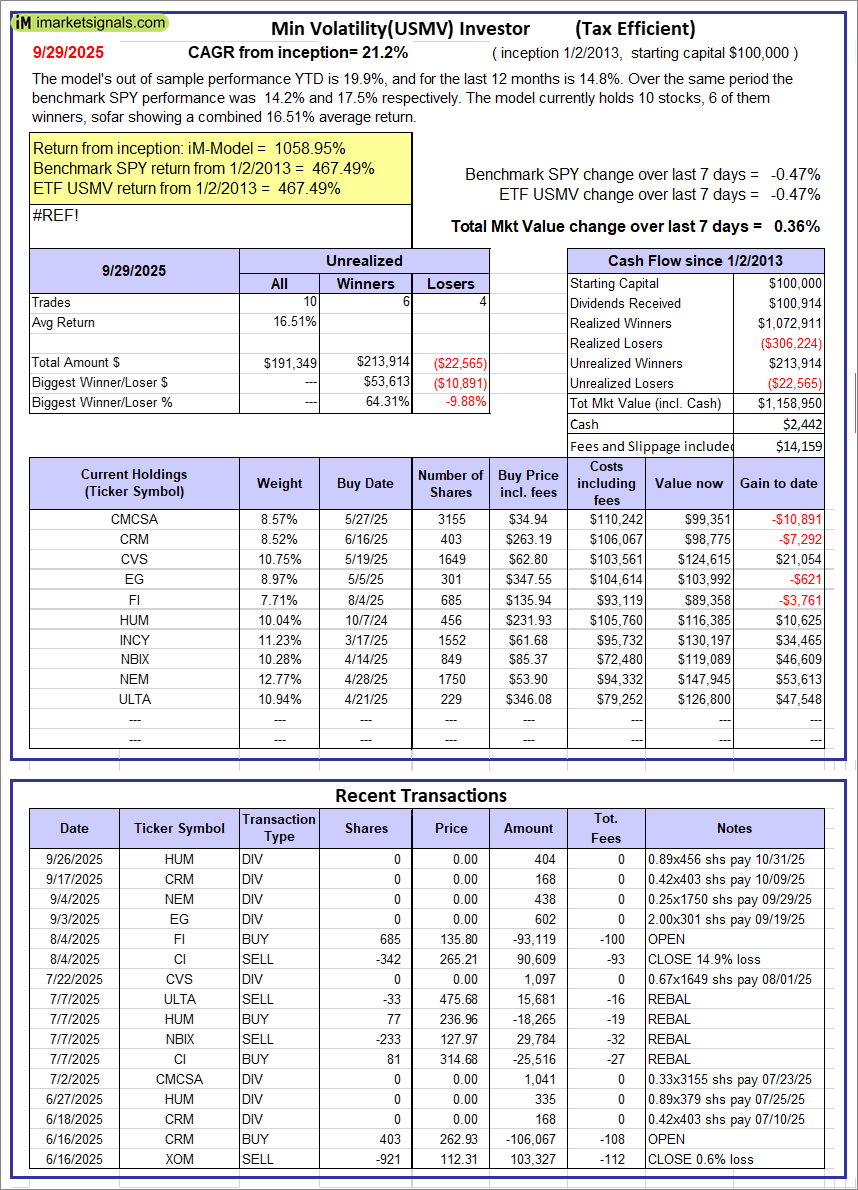 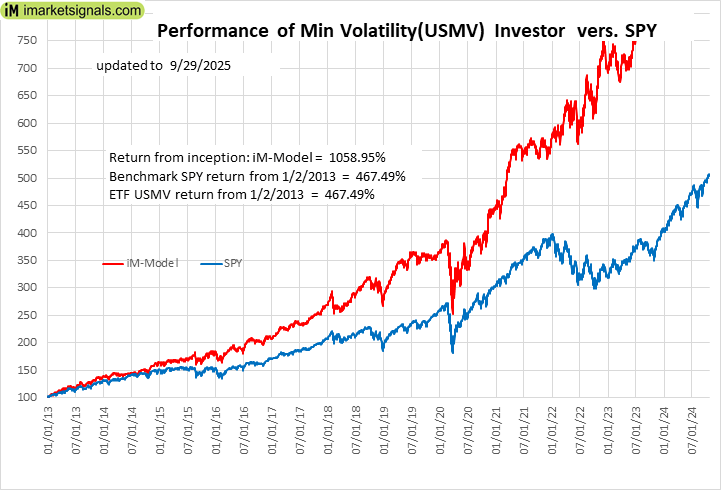 |
iM-Min Volatility(USMV) Investor (Tax Efficient): The model’s out of sample performance YTD is 19.9%, and for the last 12 months is 14.8%. Over the same period the benchmark SPY performance was 14.2% and 17.5% respectively. Since inception, on 1/3/2013, the model gained 1058.95% while the benchmark SPY gained 467.49% and the ETF USMV gained 467.49% over the same period. Over the previous week the market value of iM-Best12(USMV)Q1 gained 0.36% at a time when SPY gained -0.47%. A starting capital of $100,000 at inception on 1/3/2013 would have grown to $1,158,950 which includes $2,442 cash and excludes $14,159 spent on fees and slippage. |
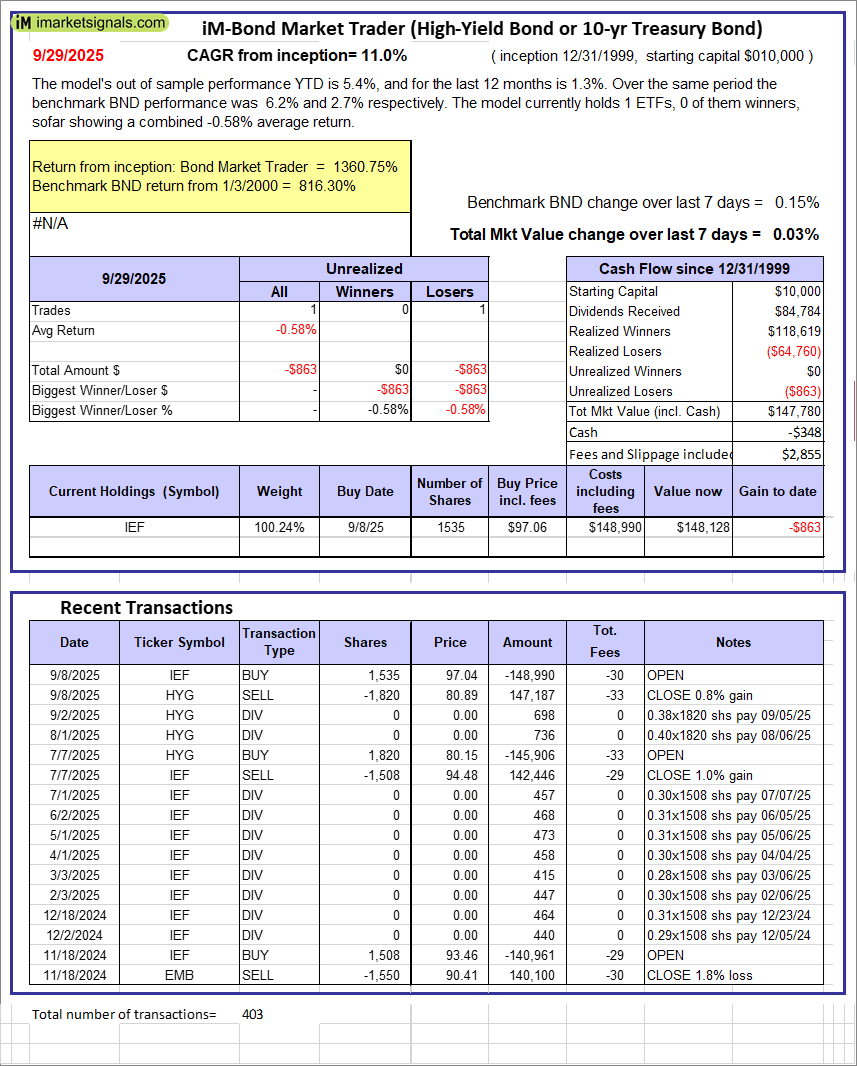 |
iM-Bond Market Trader (High-Yield Bond or 10-yr Treasury Bond): The model’s out of sample performance YTD is 5.4%, and for the last 12 months is 1.3%. Over the same period the benchmark BND performance was 6.2% and 2.7% respectively. Over the previous week the market value of the iM-Bond Market Trader (High-Yield Bond or 10-yr Treasury Bond) gained 0.03% at a time when BND gained 0.15%. A starting capital of $10,000 at inception on 1/3/2000 would have grown to $147,780 which includes -$348 cash and excludes $2,855 spent on fees and slippage. |
|
|
iM-ModSum/YieldCurve Timer: The model’s out of sample performance YTD is 18.3%, and for the last 12 months is 21.5%. Over the same period the benchmark SPY performance was 14.2% and 17.5% respectively. Over the previous week the market value of iM-PortSum/YieldCurve Timer gained 0.03% at a time when SPY gained -0.47%. A starting capital of $100,000 at inception on 1/1/2016 would have grown to $379,588 which includes -$139 cash and excludes $2,213 spent on fees and slippage. |
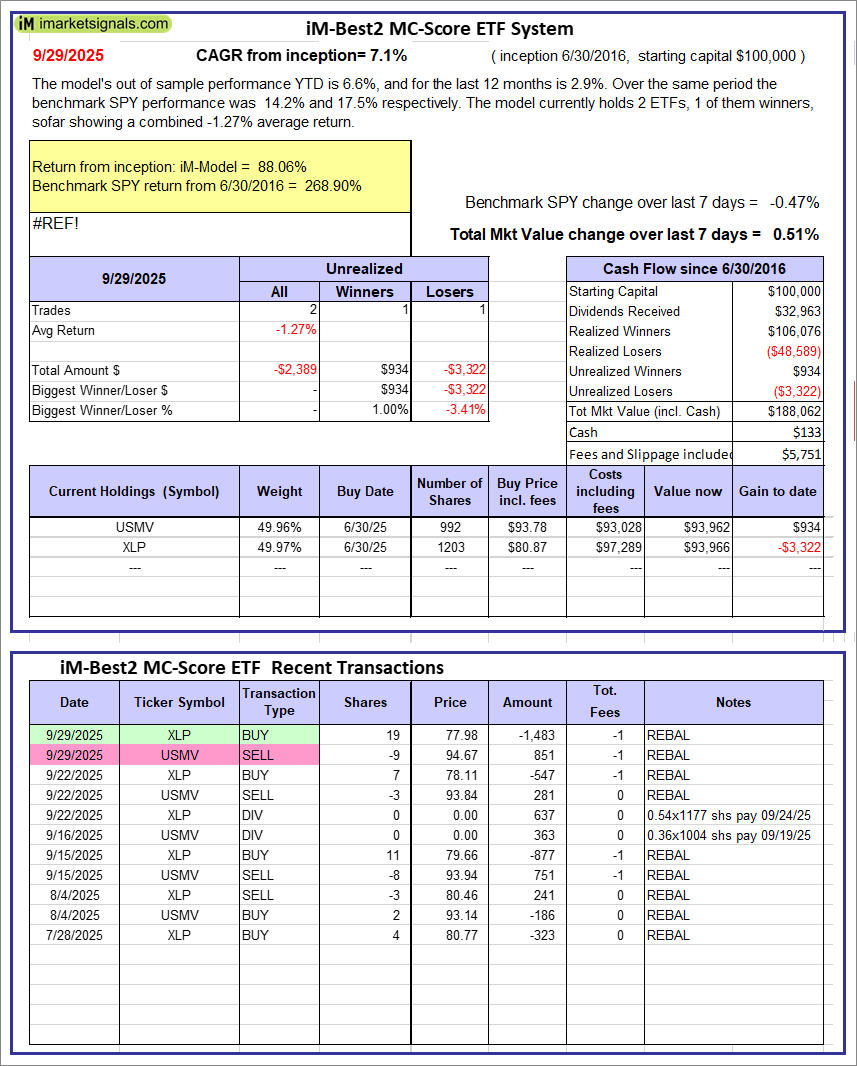 |
iM-Best2 MC-Score ETF System: The model’s out of sample performance YTD is 6.6%, and for the last 12 months is 2.9%. Over the same period the benchmark SPY performance was 14.2% and 17.5% respectively. Over the previous week the market value of the iM-Best2 MC-Score ETF System gained 0.51% at a time when SPY gained -0.47%. A starting capital of $100,000 at inception on 6/30/2016 would have grown to $188,062 which includes $133 cash and excludes $5,751 spent on fees and slippage. |
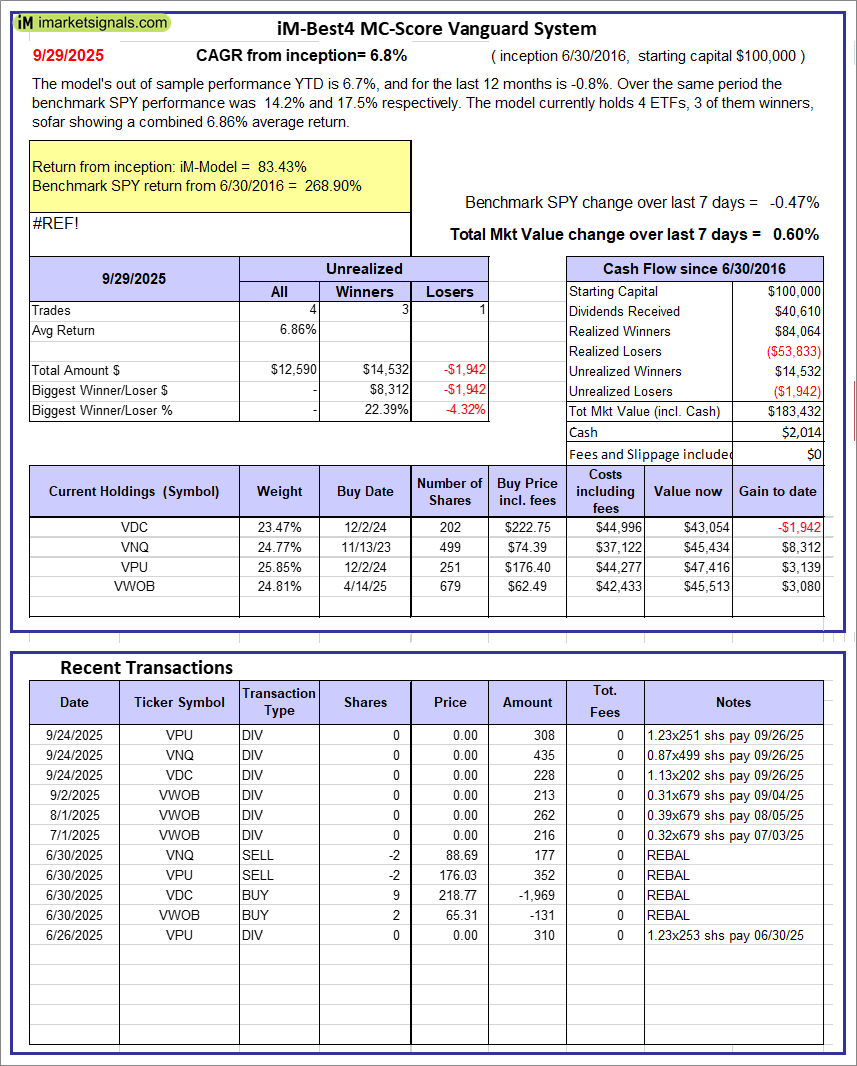 |
iM-Best4 MC-Score Vanguard System: The model’s out of sample performance YTD is 6.7%, and for the last 12 months is -0.8%. Over the same period the benchmark SPY performance was 14.2% and 17.5% respectively. Over the previous week the market value of the iM-Best4 MC-Score Vanguard System gained 0.60% at a time when SPY gained -0.47%. A starting capital of $100,000 at inception on 6/30/2016 would have grown to $183,432 which includes $2,014 cash and excludes $00 spent on fees and slippage. |
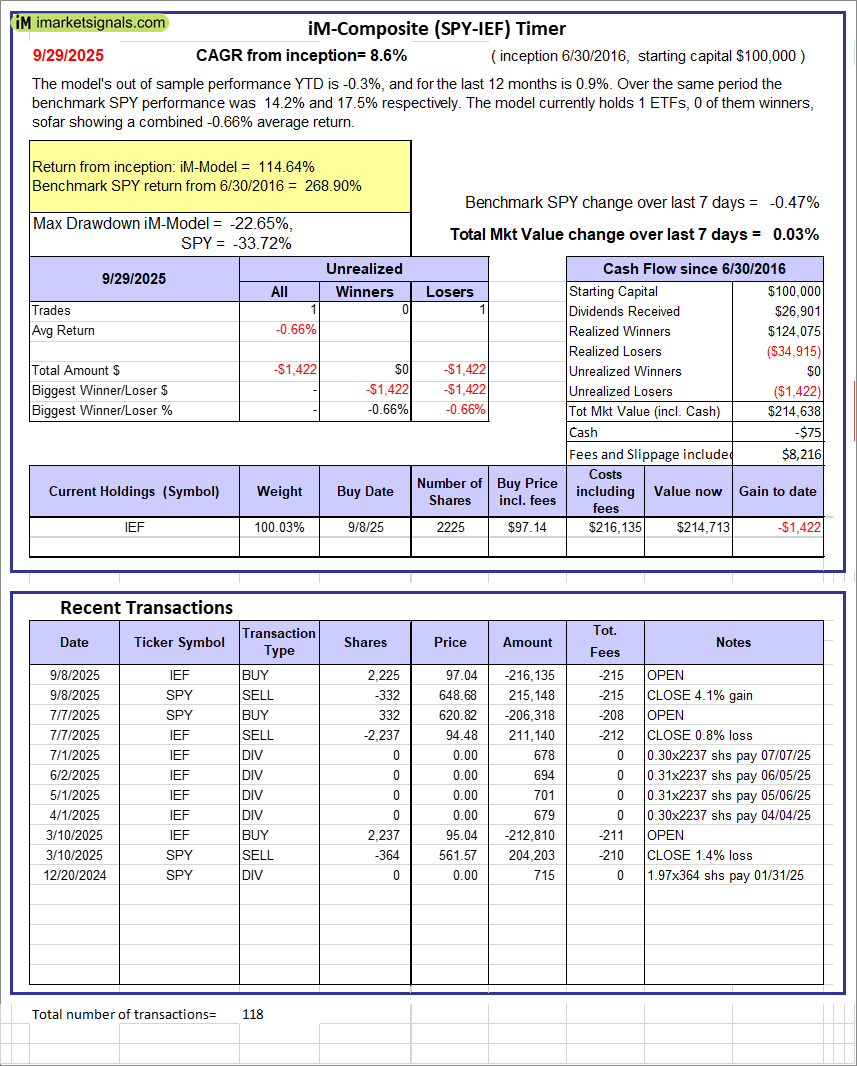 |
iM-Composite (SPY-IEF) Timer: The model’s out of sample performance YTD is -0.3%, and for the last 12 months is 0.9%. Over the same period the benchmark SPY performance was 14.2% and 17.5% respectively. Over the previous week the market value of the iM-Composite (SPY-IEF) Timer gained 0.03% at a time when SPY gained -0.47%. A starting capital of $100,000 at inception on 6/30/2016 would have grown to $214,638 which includes -$75 cash and excludes $8,216 spent on fees and slippage. |
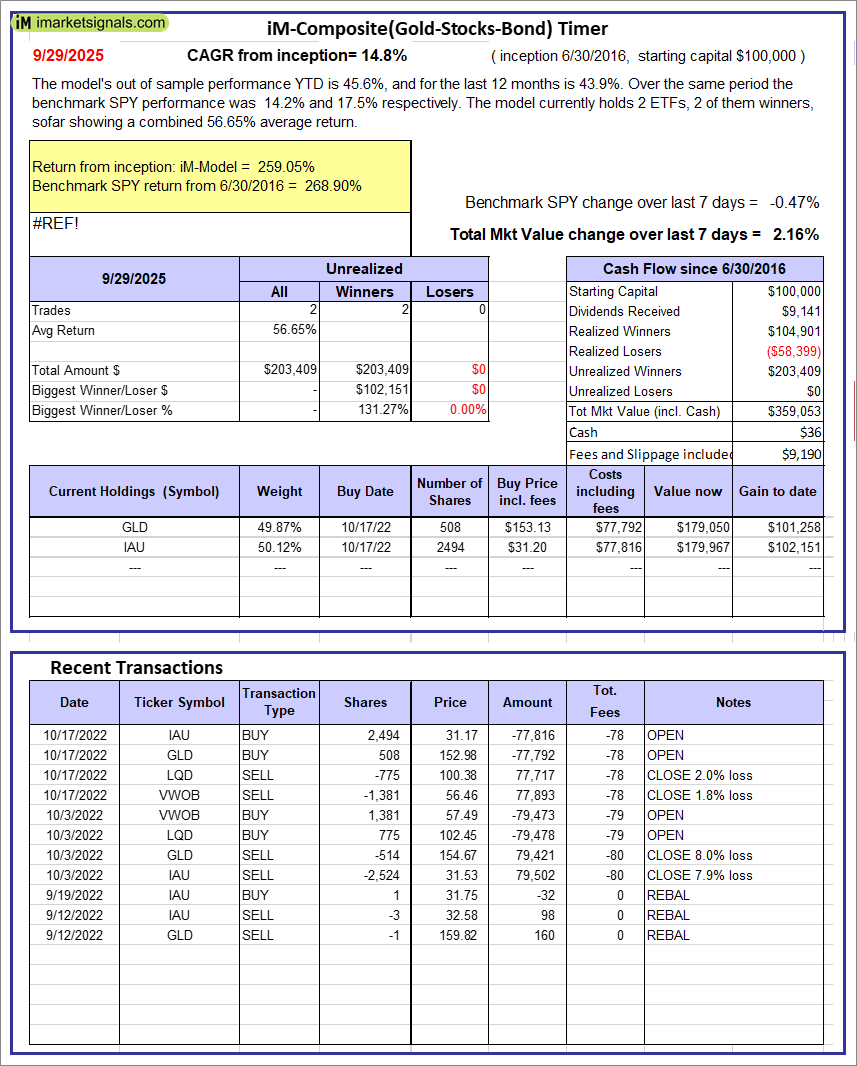 |
iM-Composite(Gold-Stocks-Bond) Timer: The model’s out of sample performance YTD is 45.6%, and for the last 12 months is 43.9%. Over the same period the benchmark SPY performance was 14.2% and 17.5% respectively. Over the previous week the market value of the iM-Composite(Gold-Stocks-Bond) Timer gained 2.16% at a time when SPY gained -0.47%. A starting capital of $100,000 at inception on 6/30/2016 would have grown to $359,053 which includes $36 cash and excludes $9,190 spent on fees and slippage. |
iM-Best Reports – 9/29/2025
Posted in pmp SPY-SH
Leave a Reply
You must be logged in to post a comment.