
  |
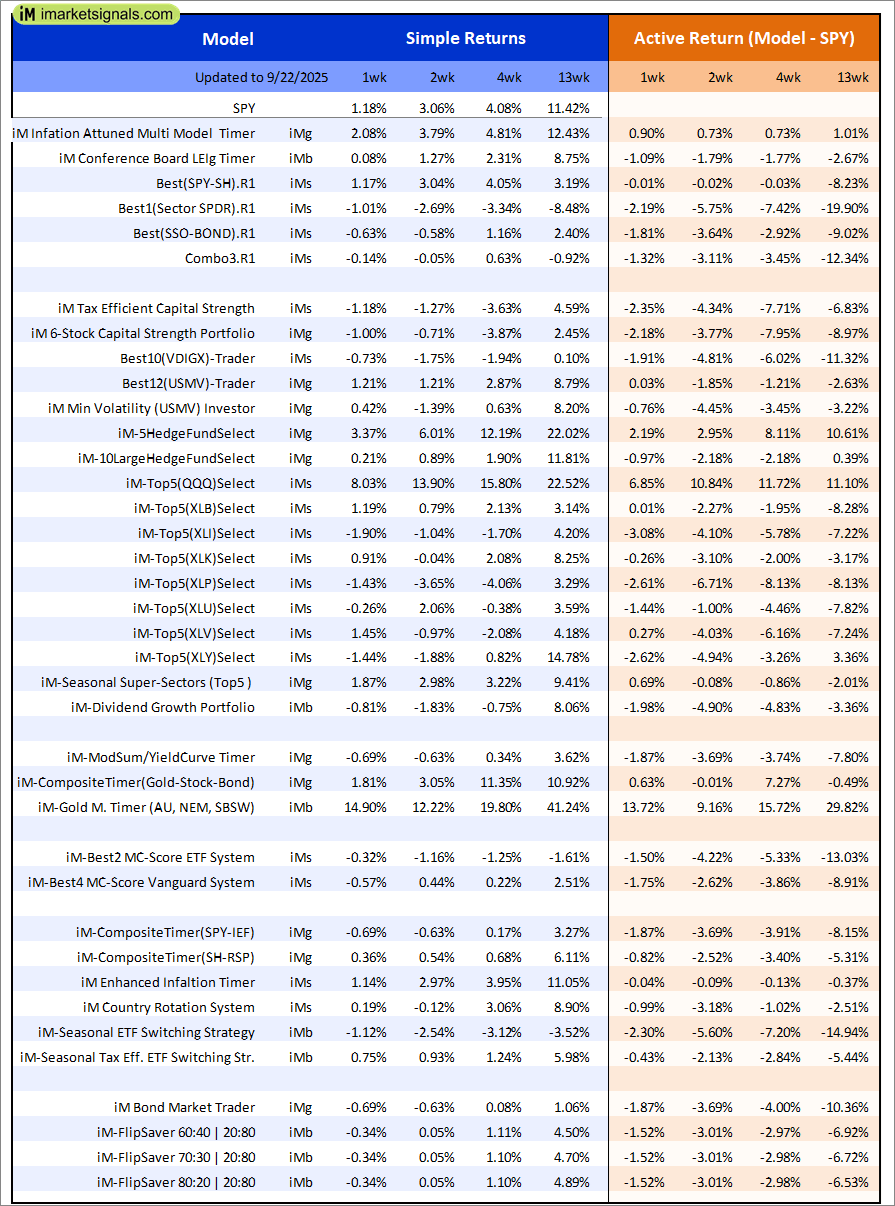
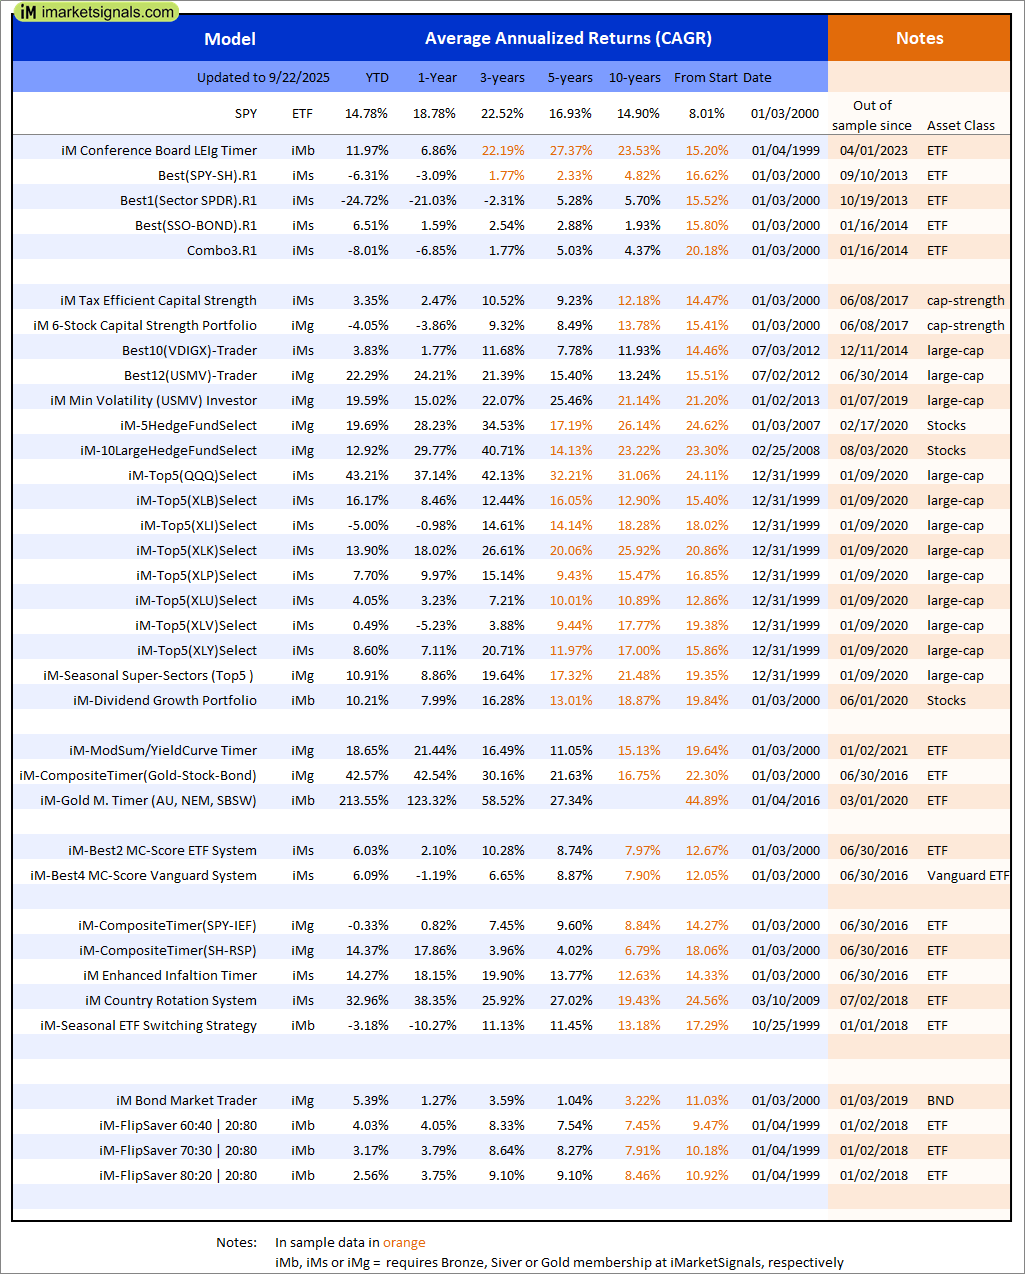
Out of sample performance summary of our models for the past 1, 2, 4 and 13 week periods. The active active return indicates how the models over- or underperformed the benchmark ETF SPY. Also the YTD, and the 1-, 3-, 5- and 10-year annualized returns are shown in the second table |
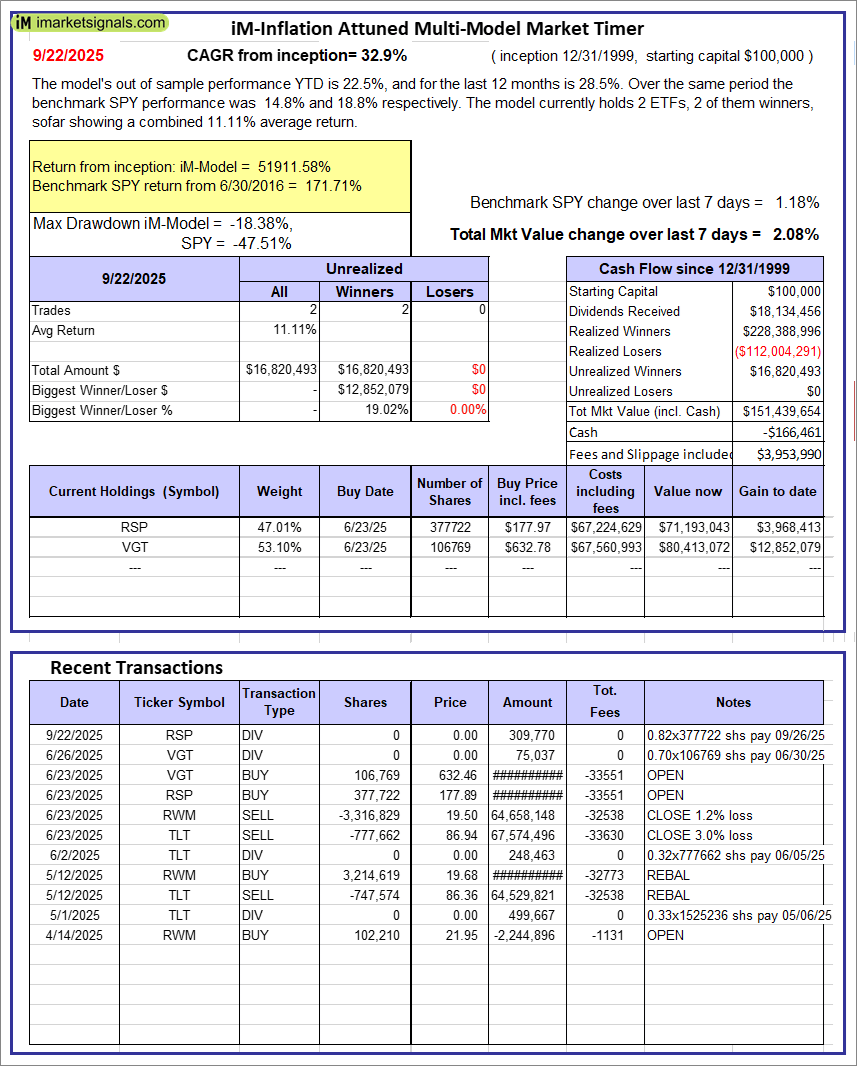 |
iM-Inflation Attuned Multi-Model Market Timer: The model’s out of sample performance YTD is 22.5%, and for the last 12 months is 28.5%. Over the same period the benchmark SPY performance was 14.8% and 18.8% respectively. Over the previous week the market value of the iM-Inflation Attuned Multi-Model Market Timer gained 2.08% at a time when SPY gained 1.18%. A starting capital of $100,000 at inception on 3/24/2017 would have grown to $151,439,654 which includes -$166,461 cash and excludes $3,953,990 spent on fees and slippage. |
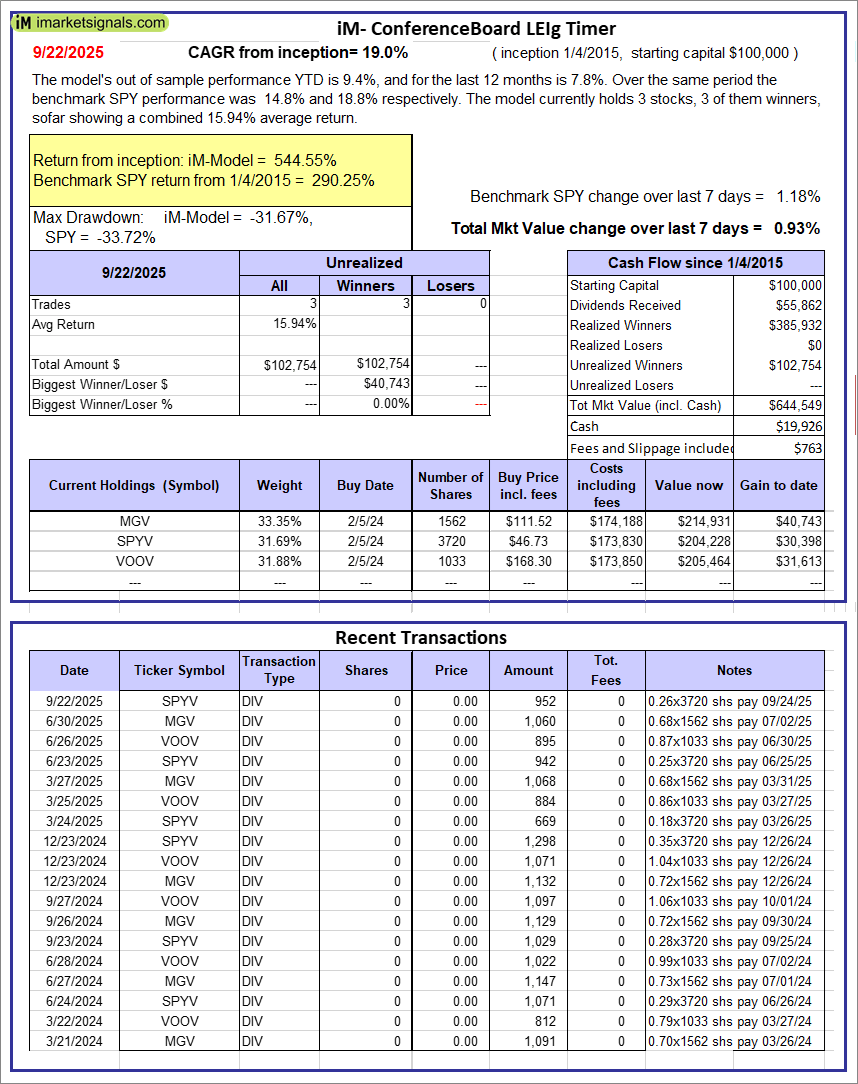 |
iM-Conference Board LEIg Timer: The model’s performance YTD is 14.3%, and for the last 12 months is 7.3%. Over the same period the benchmark SPY performance was 20.1% and 9.4% respectively. Over the previous week the market value of the iM-Conference Board LEIg Timer gained 0.93% at a time when SPY gained 1.18%. A starting capital of $100,000 at inception on 4/5/2017 would have grown to $644,549 which includes $19,926 cash and excludes $763 spent on fees and slippage. |
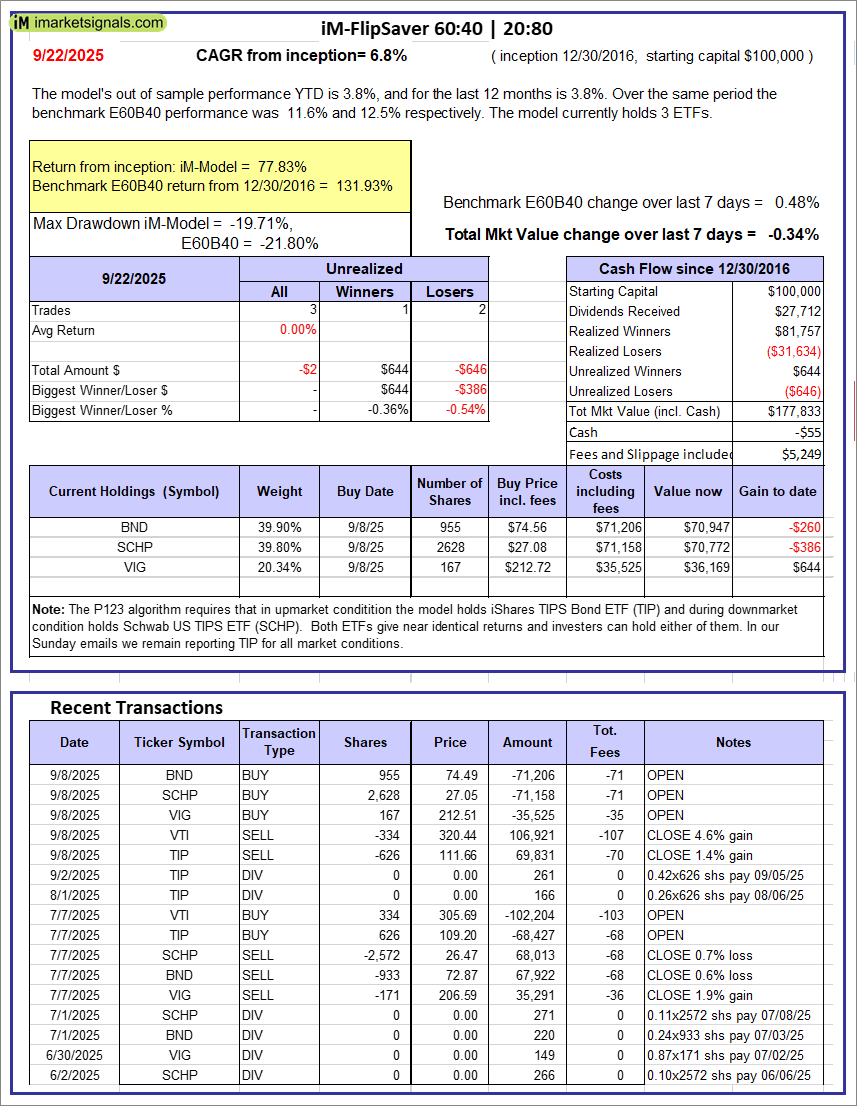 |
iM-FlipSaver 60:40 | 20:80 – 2017: The model’s out of sample performance YTD is 3.8%, and for the last 12 months is 3.8%. Over the same period the benchmark E60B40 performance was 11.6% and 12.5% respectively. Over the previous week the market value of iM-FlipSaver 80:20 | 20:80 gained -0.34% at a time when SPY gained 0.48%. A starting capital of $100,000 at inception on 7/16/2015 would have grown to $177,833 which includes -$55 cash and excludes $5,249 spent on fees and slippage. |
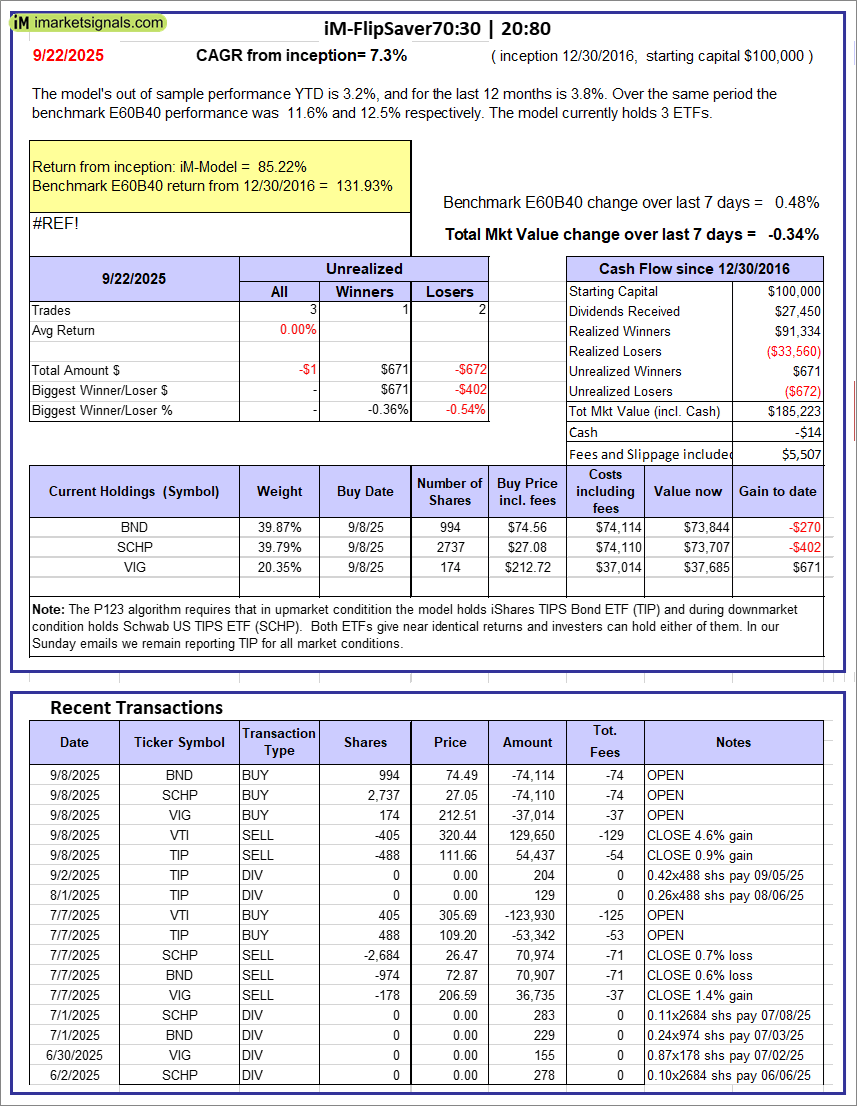 |
iM-FlipSaver 70:30 | 20:80 – 2017: The model’s out of sample performance YTD is 3.2%, and for the last 12 months is 3.8%. Over the same period the benchmark E60B40 performance was 11.6% and 12.5% respectively. Over the previous week the market value of iM-FlipSaver 70:30 | 20:80 gained -0.34% at a time when SPY gained 0.48%. A starting capital of $100,000 at inception on 7/15/2015 would have grown to $185,223 which includes -$14 cash and excludes $5,507 spent on fees and slippage. |
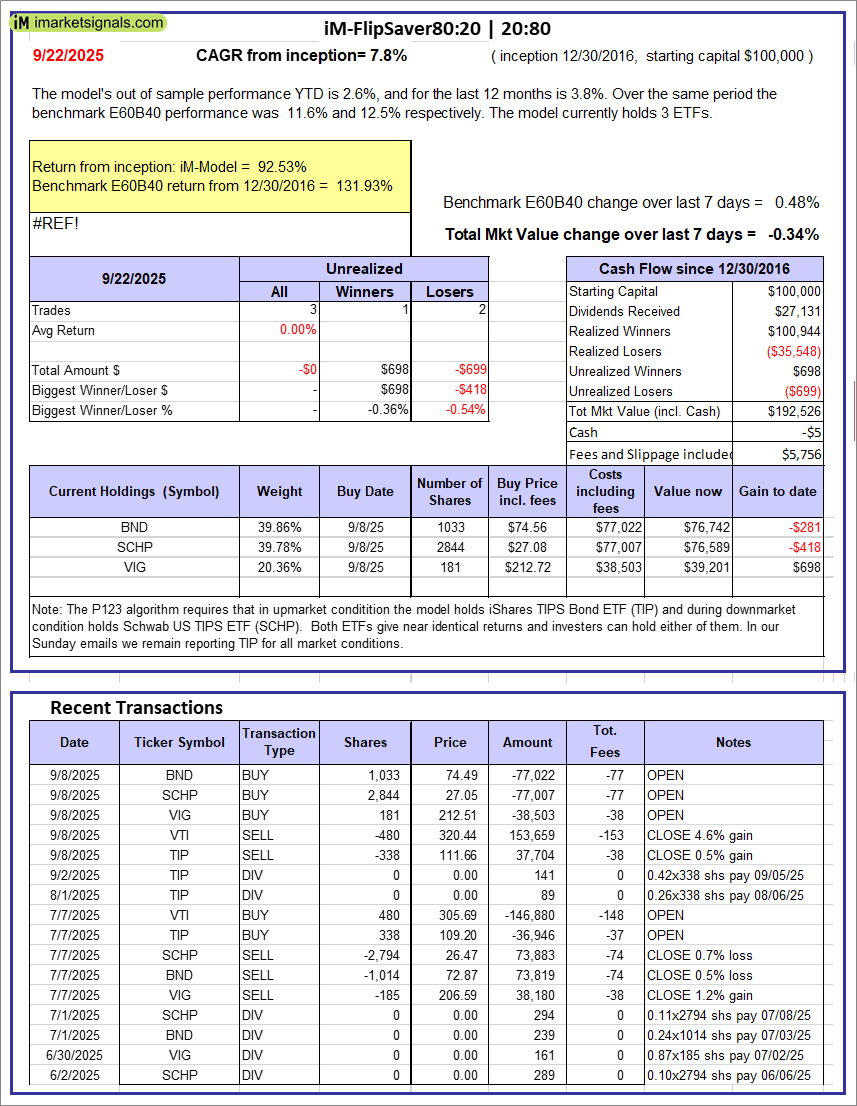 |
iM-FlipSaver 80:20 | 20:80 – 2017: The model’s out of sample performance YTD is 2.6%, and for the last 12 months is 3.8%. Over the same period the benchmark E60B40 performance was 11.6% and 12.5% respectively. Over the previous week the market value of iM-FlipSaver 80:20 | 20:80 gained -0.34% at a time when SPY gained 0.48%. A starting capital of $100,000 at inception on 1/2/2017 would have grown to $192,526 which includes -$5 cash and excludes $5,756 spent on fees and slippage. |
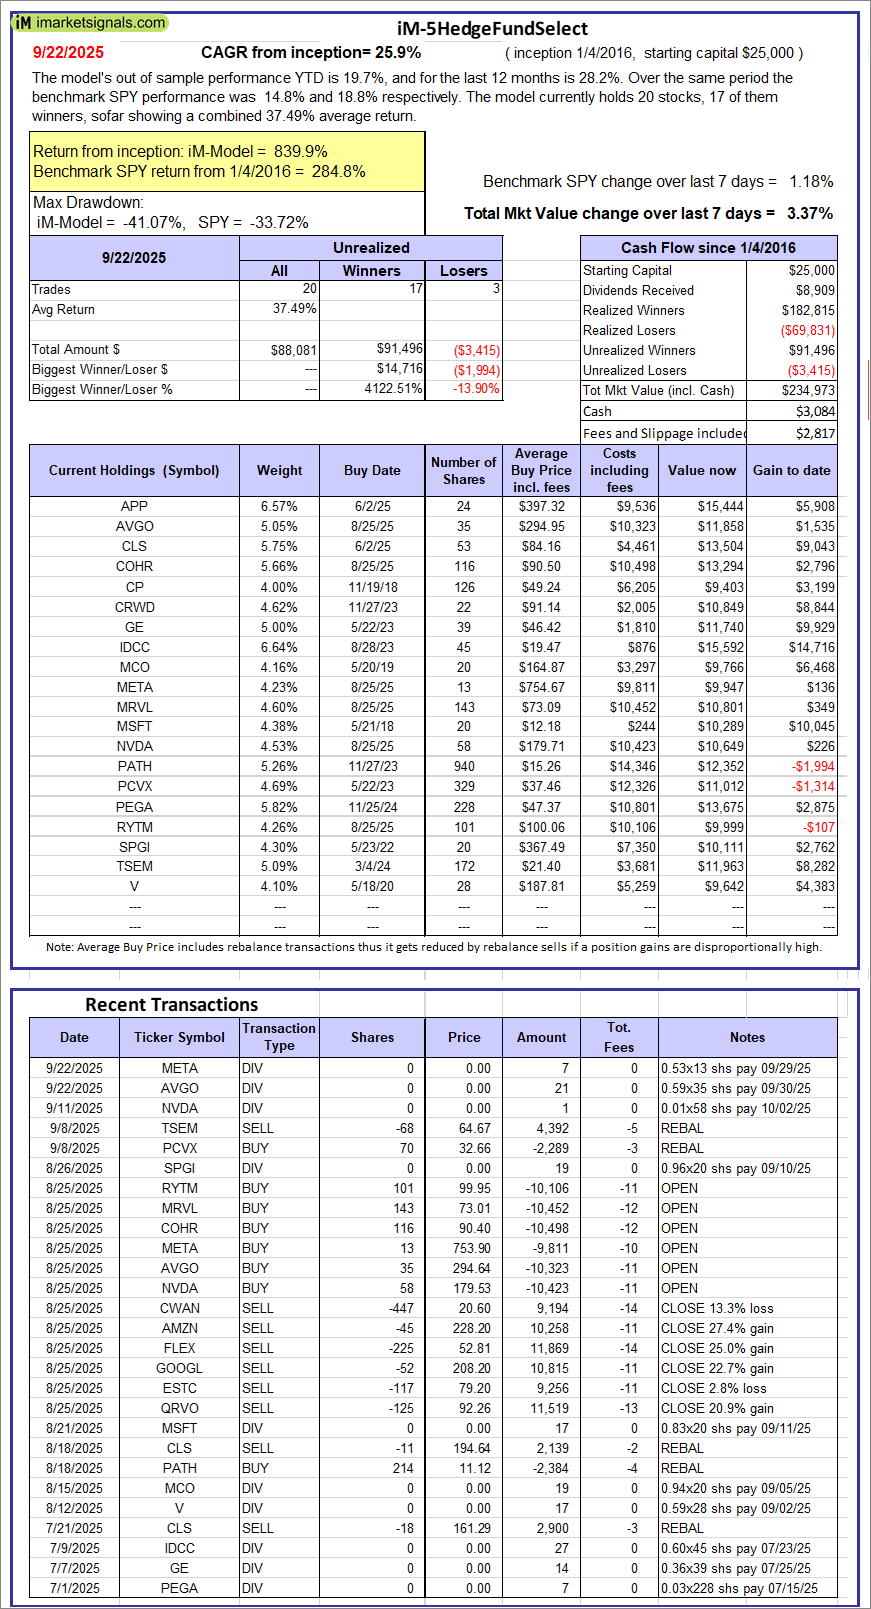 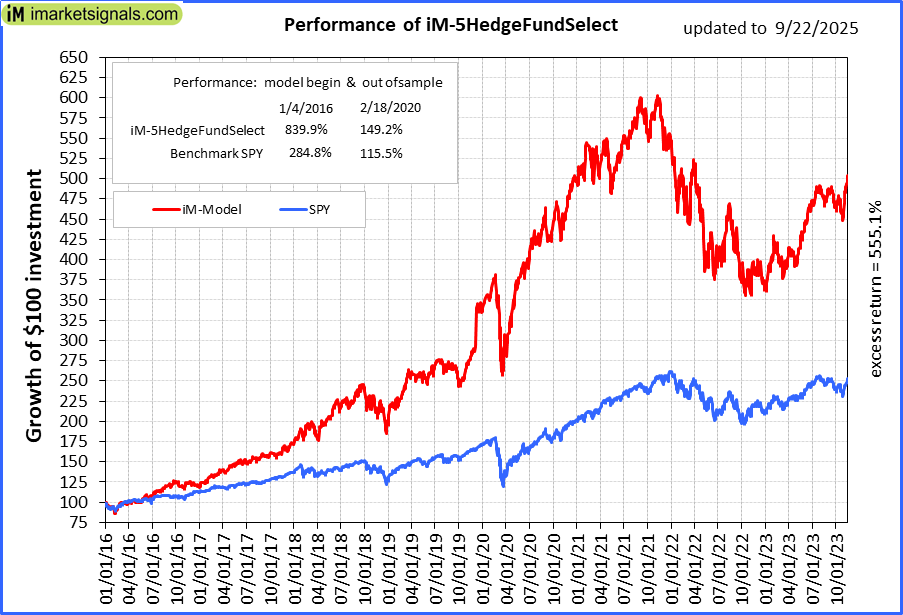 |
iM-5HedgeFundSelect: Since inception, on 1/5/2016, the model gained 839.89% while the benchmark SPY gained 284.79% over the same period. Over the previous week the market value of iM-5HedgeFundSelect gained 3.37% at a time when SPY gained 1.18%. A starting capital of $25,000 at inception on 1/5/2016 would have grown to $234,973 which includes $3,084 cash and excludes $2,817 spent on fees and slippage. |
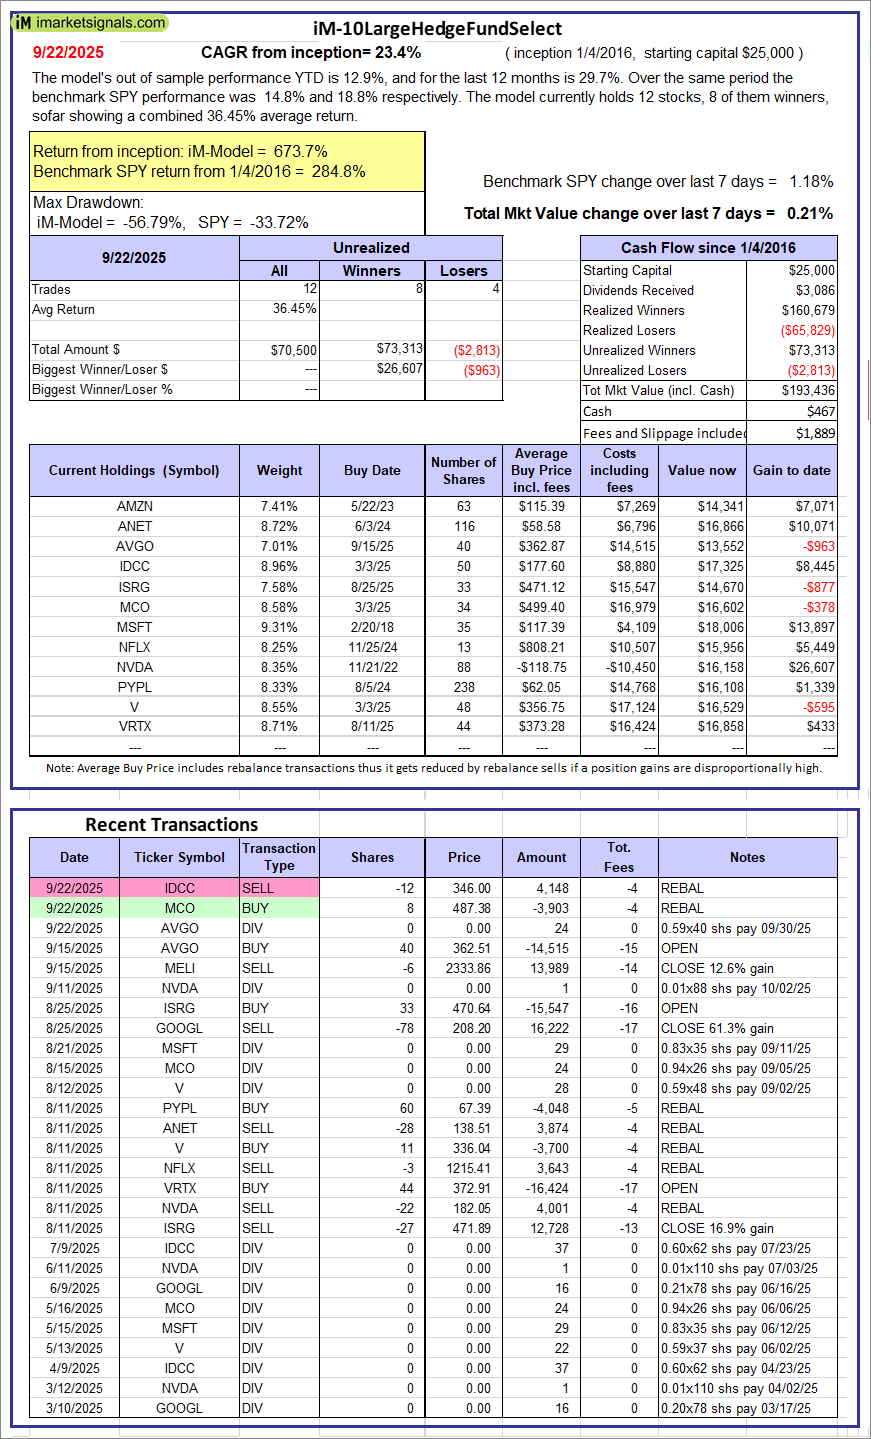 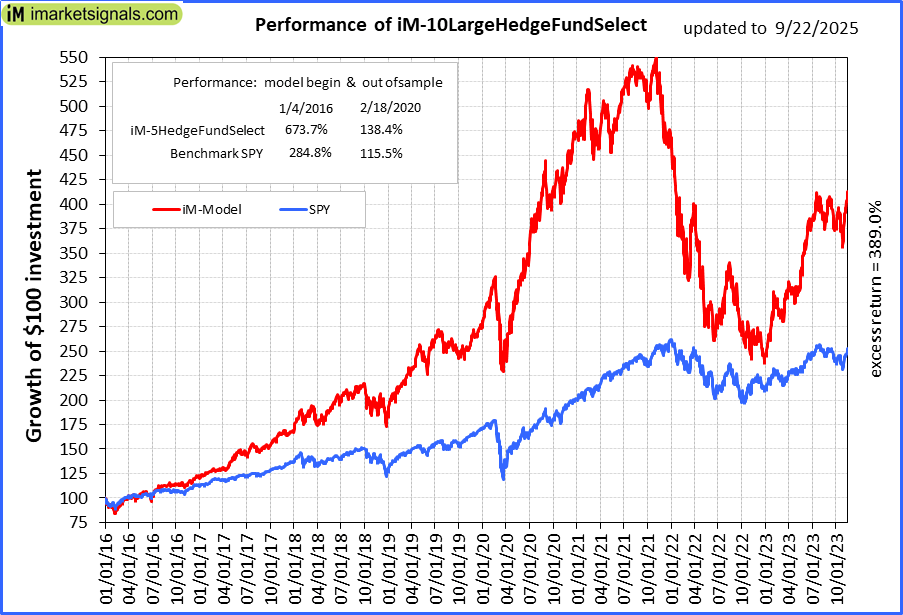 |
iM-10LargeHedgeFundSelect: Since inception, on 1/5/2016, the model gained 673.74% while the benchmark SPY gained 284.79% over the same period. Over the previous week the market value of iM-10LargeHedgeFundSelect gained 0.21% at a time when SPY gained 1.18%. A starting capital of $25,000 at inception on 1/5/2016 would have grown to $193,436 which includes $467 cash and excludes $1,889 spent on fees and slippage. |
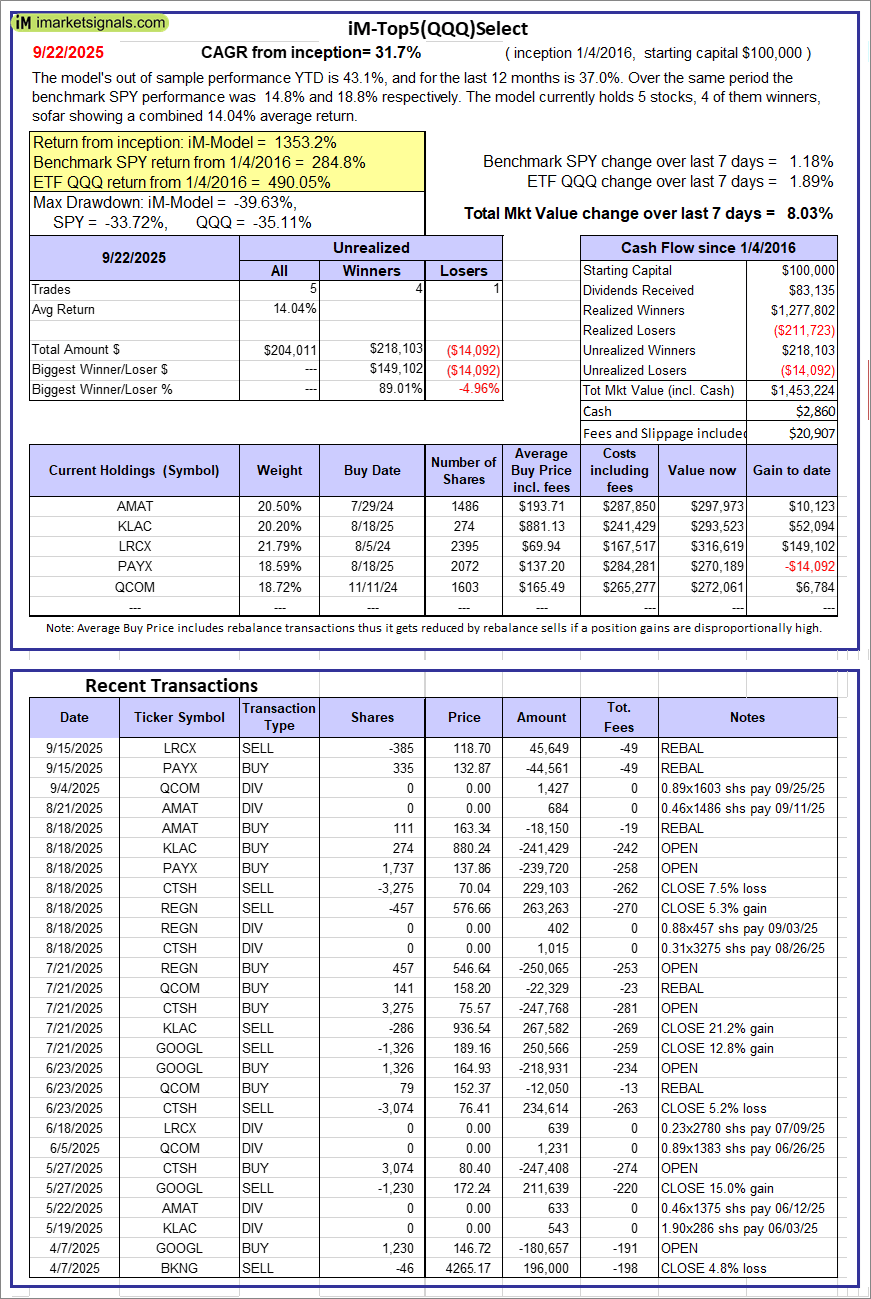 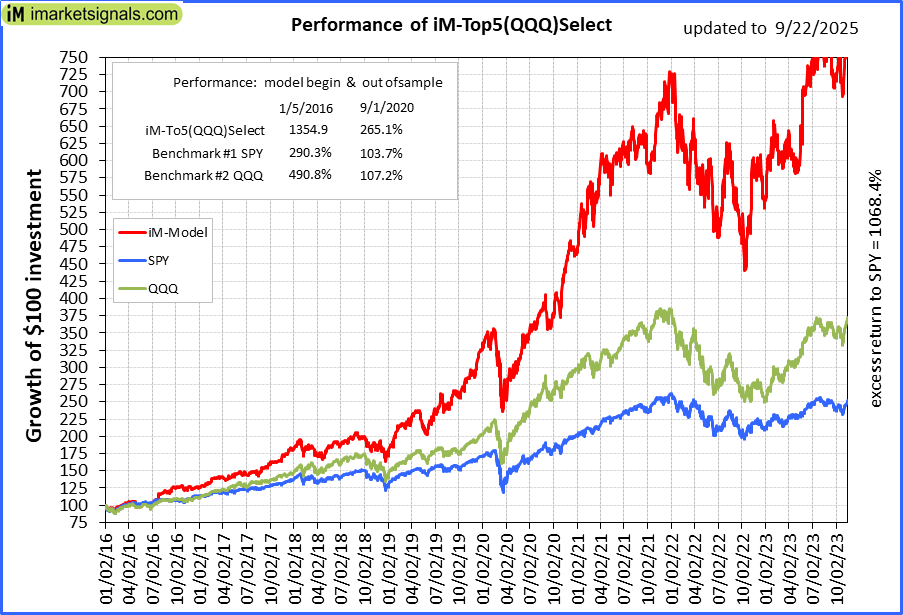 |
iM-Top5(QQQ)Select: Since inception, on 1/5/2016, the model gained 1353.22% while the benchmark SPY gained 284.79% over the same period. Over the previous week the market value of iM-Top5(QQQ)Select gained 8.03% at a time when SPY gained 1.18%. A starting capital of $100,000 at inception on 1/5/2016 would have grown to $1,453,224 which includes $2,860 cash and excludes $20,907 spent on fees and slippage. |
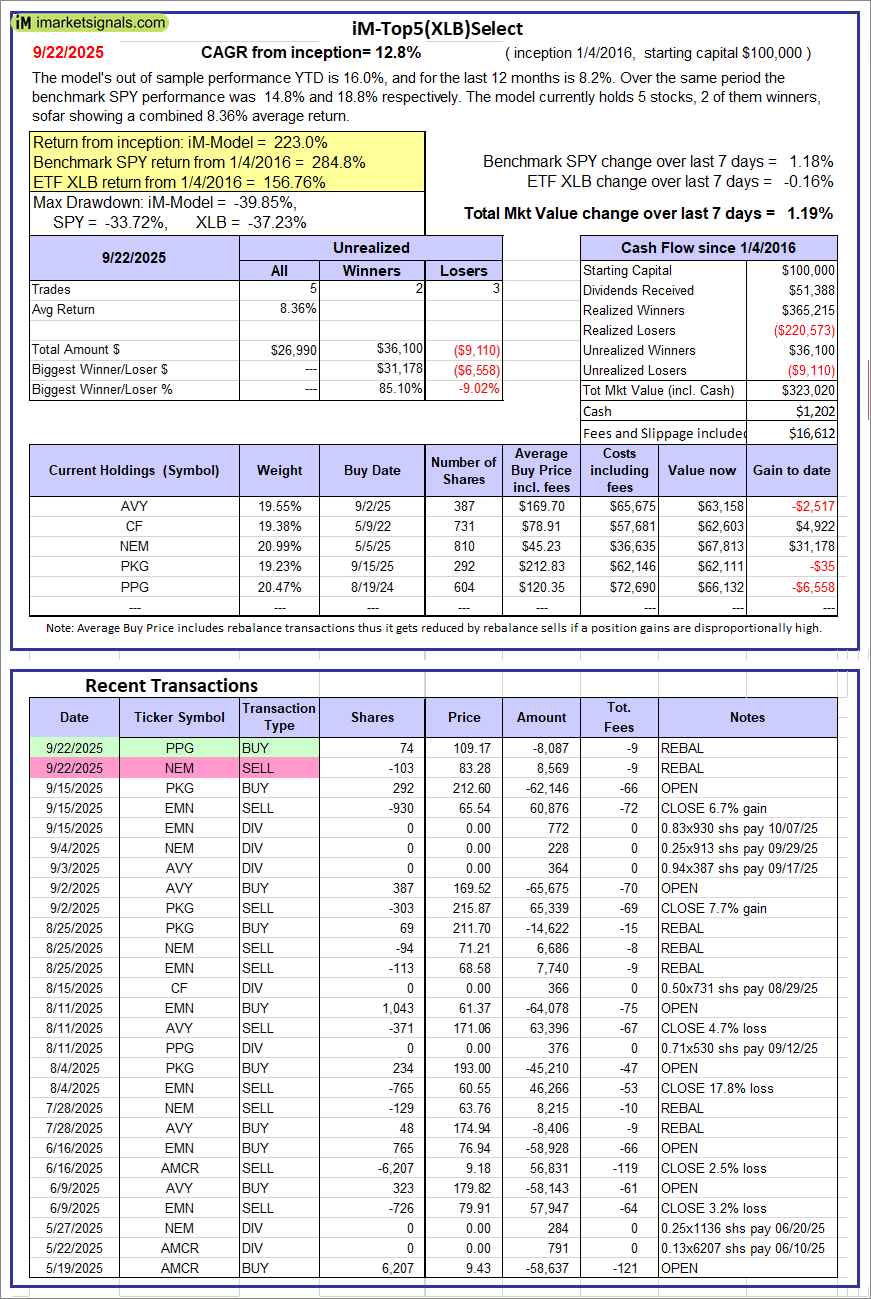 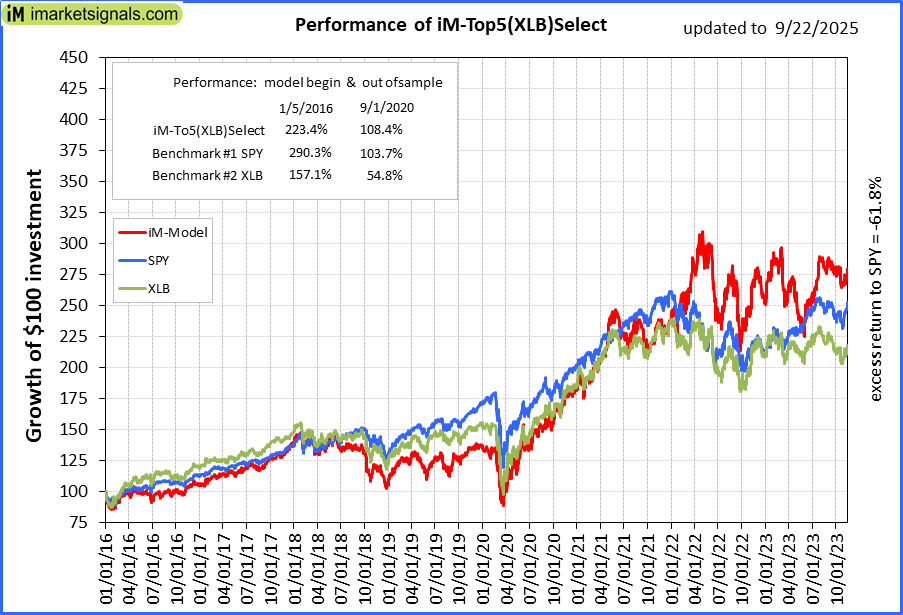 |
iM-Top5(XLB)Select: Since inception, on 1/5/2016, the model gained 223.02% while the benchmark SPY gained 284.79% over the same period. Over the previous week the market value of iM-Top5(XLB)Select gained 1.19% at a time when SPY gained 1.18%. A starting capital of $100,000 at inception on 1/5/2016 would have grown to $323,020 which includes $1,202 cash and excludes $16,612 spent on fees and slippage. |
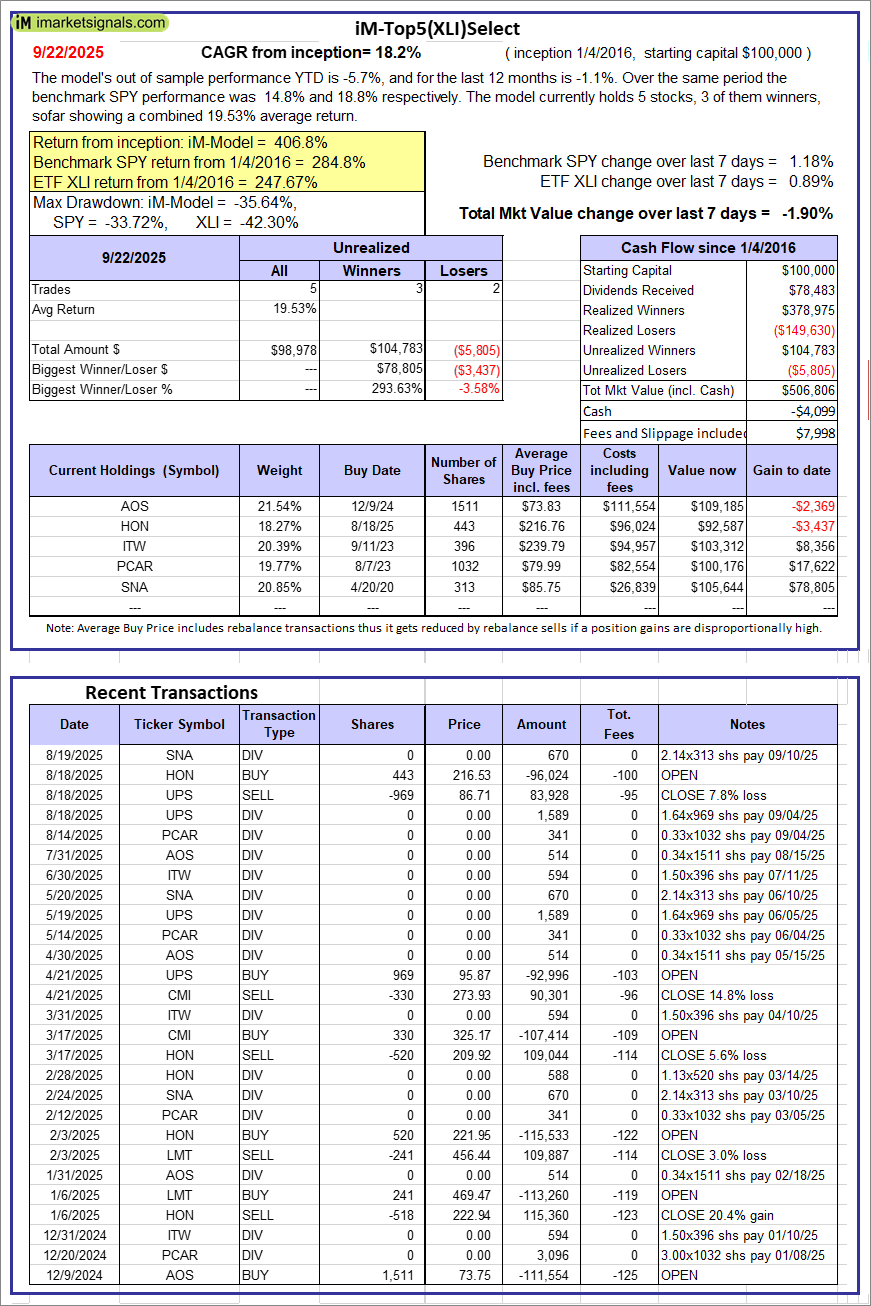 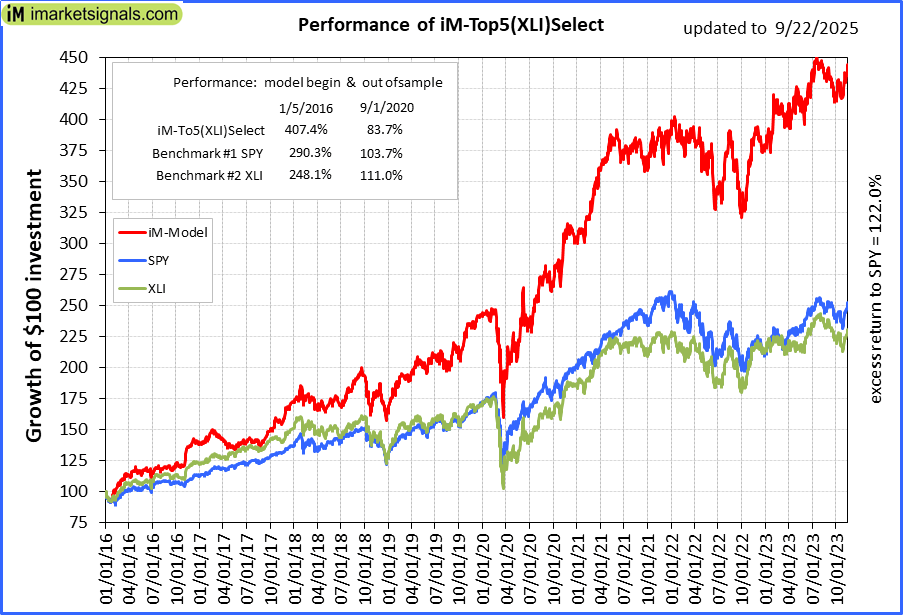 |
iM-Top5(XLI)Select: Since inception, on 1/5/2016, the model gained 406.81% while the benchmark SPY gained 284.79% over the same period. Over the previous week the market value of iM-Top5(XLI)Select gained -1.90% at a time when SPY gained 1.18%. A starting capital of $100,000 at inception on 1/5/2016 would have grown to $506,806 which includes -$4,099 cash and excludes $7,998 spent on fees and slippage. |
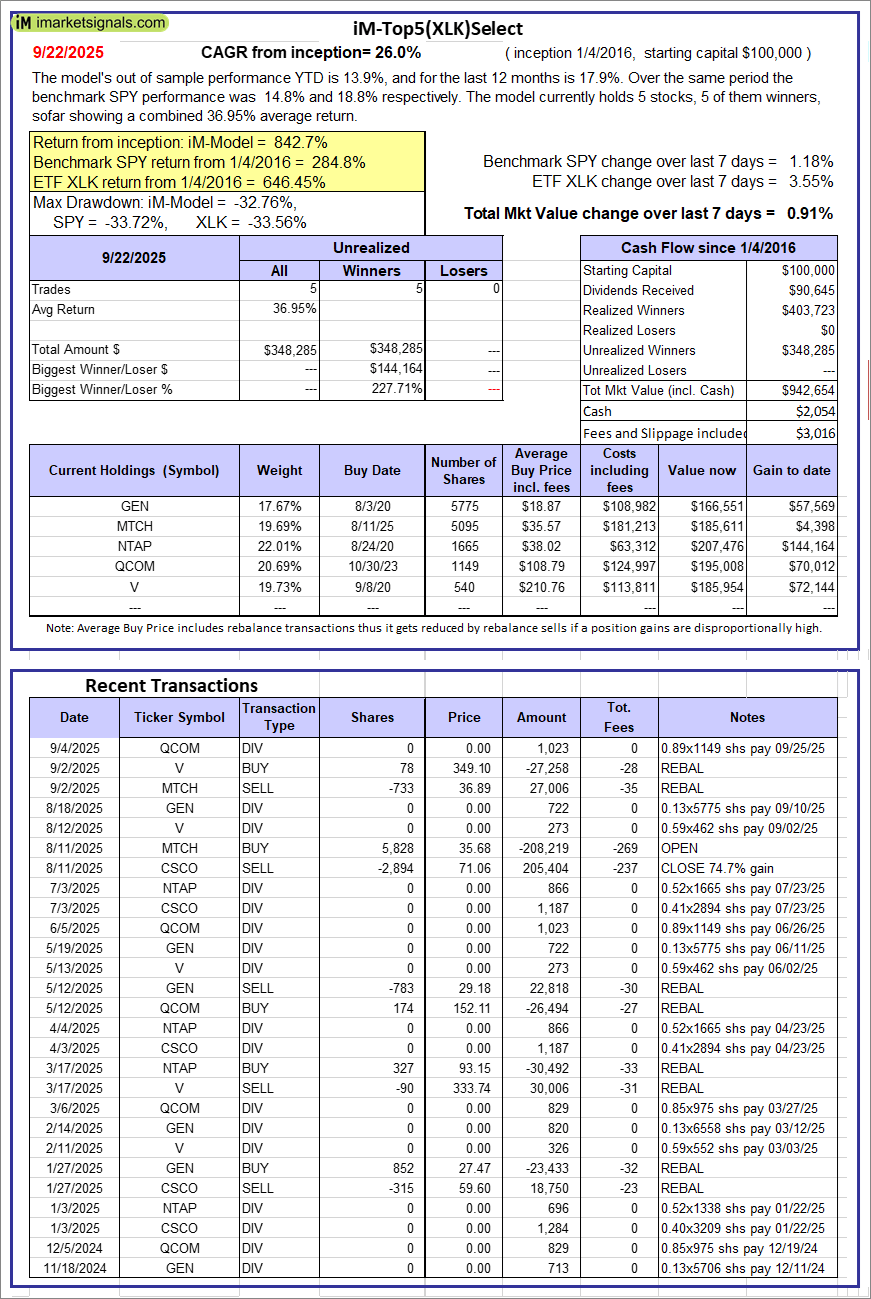 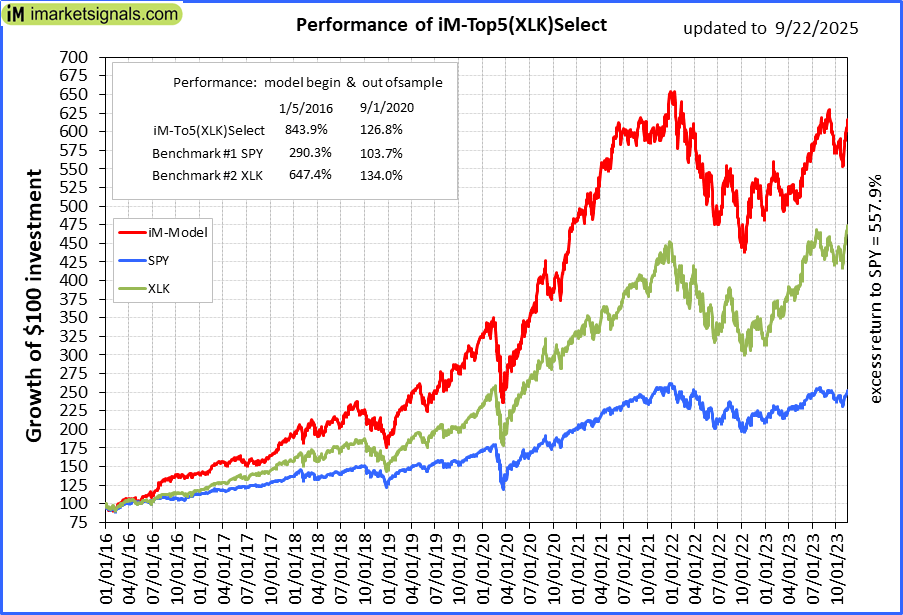 |
iM-Top5(XLK)Select: Since inception, on 1/5/2016, the model gained 842.65% while the benchmark SPY gained 284.79% over the same period. Over the previous week the market value of iM-Top5(XLK)Select gained 0.91% at a time when SPY gained 1.18%. A starting capital of $100,000 at inception on 1/5/2016 would have grown to $942,654 which includes $2,054 cash and excludes $3,016 spent on fees and slippage. |
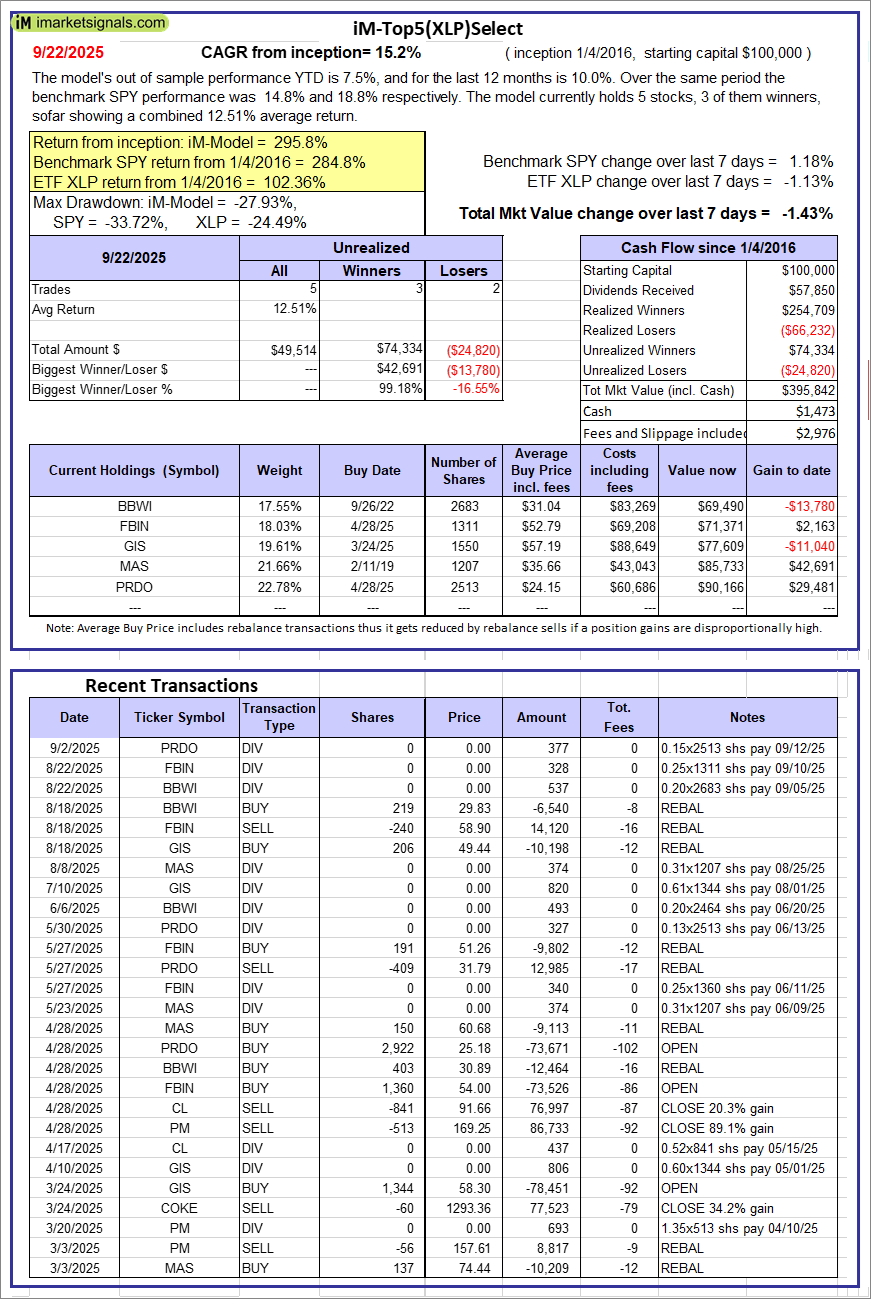 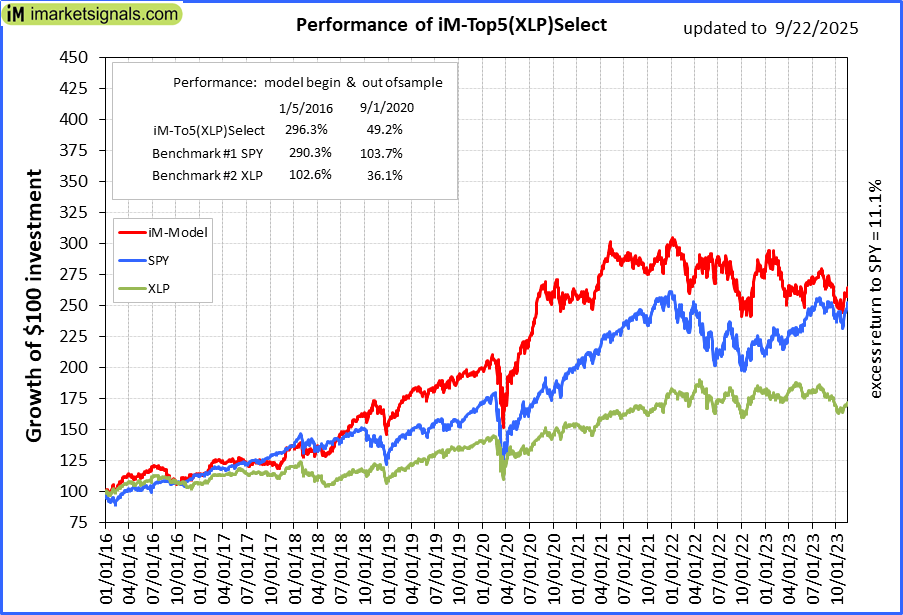 |
iM-Top5(XLP)Select: Since inception, on 1/5/2016, the model gained 295.84% while the benchmark SPY gained 284.79% over the same period. Over the previous week the market value of iM-Top5(XLP)Select gained -1.43% at a time when SPY gained 1.18%. A starting capital of $100,000 at inception on 1/5/2016 would have grown to $395,842 which includes $1,473 cash and excludes $2,976 spent on fees and slippage. |
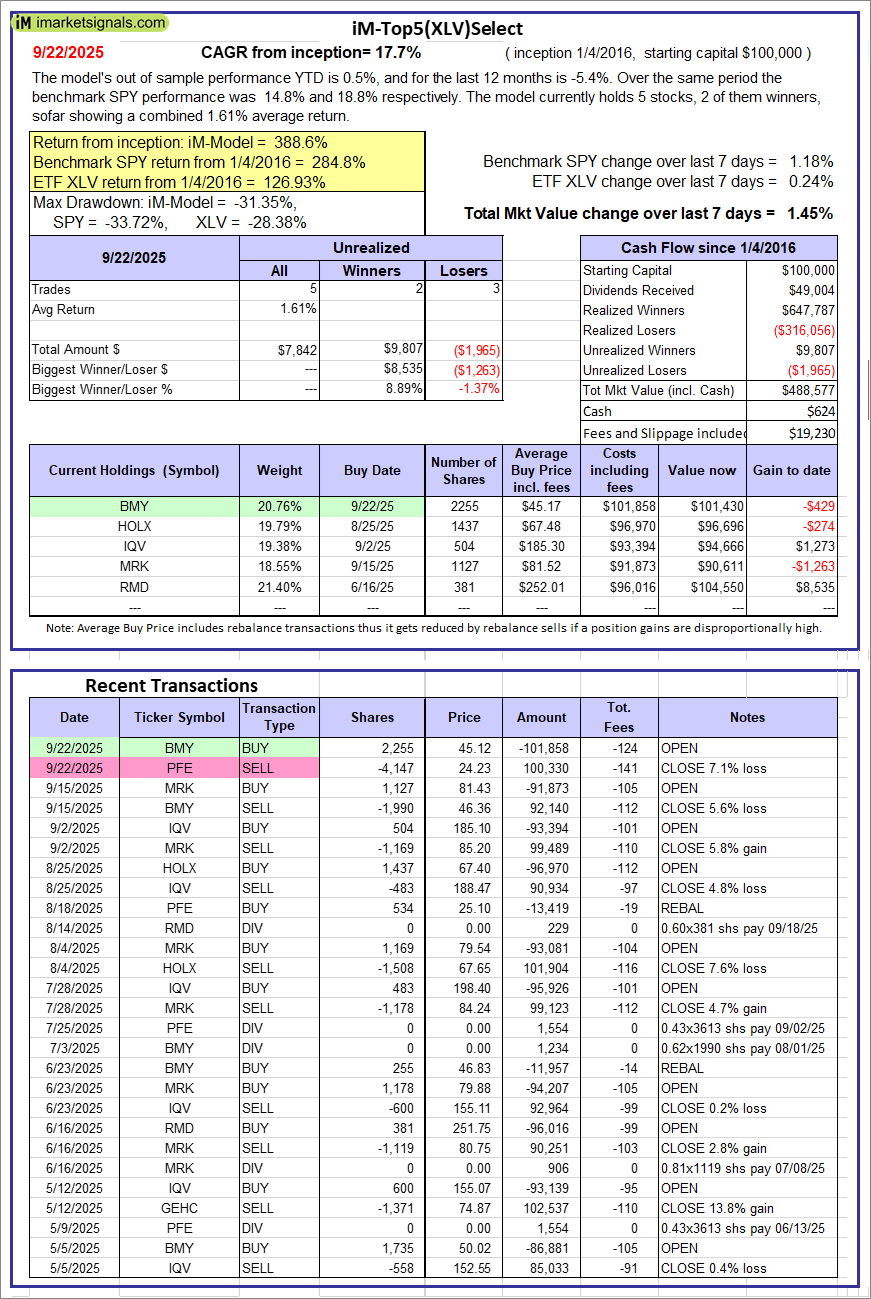 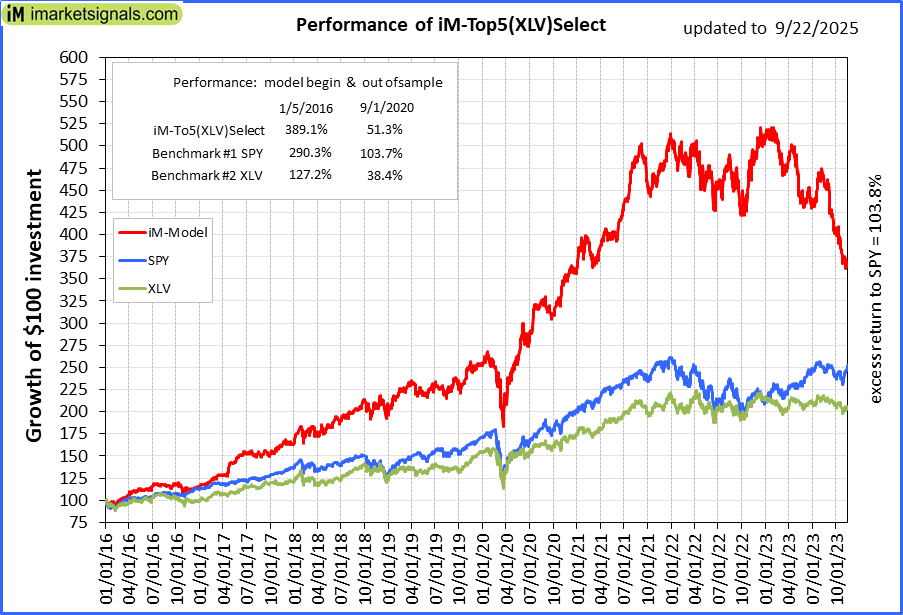 |
iM-Top5(XLV)Select: Since inception, on 1/5/2016, the model gained 388.58% while the benchmark SPY gained 284.79% over the same period. Over the previous week the market value of iM-Top5(XLV)Select gained 1.45% at a time when SPY gained 1.18%. A starting capital of $100,000 at inception on 1/5/2016 would have grown to $488,577 which includes $624 cash and excludes $19,230 spent on fees and slippage. |
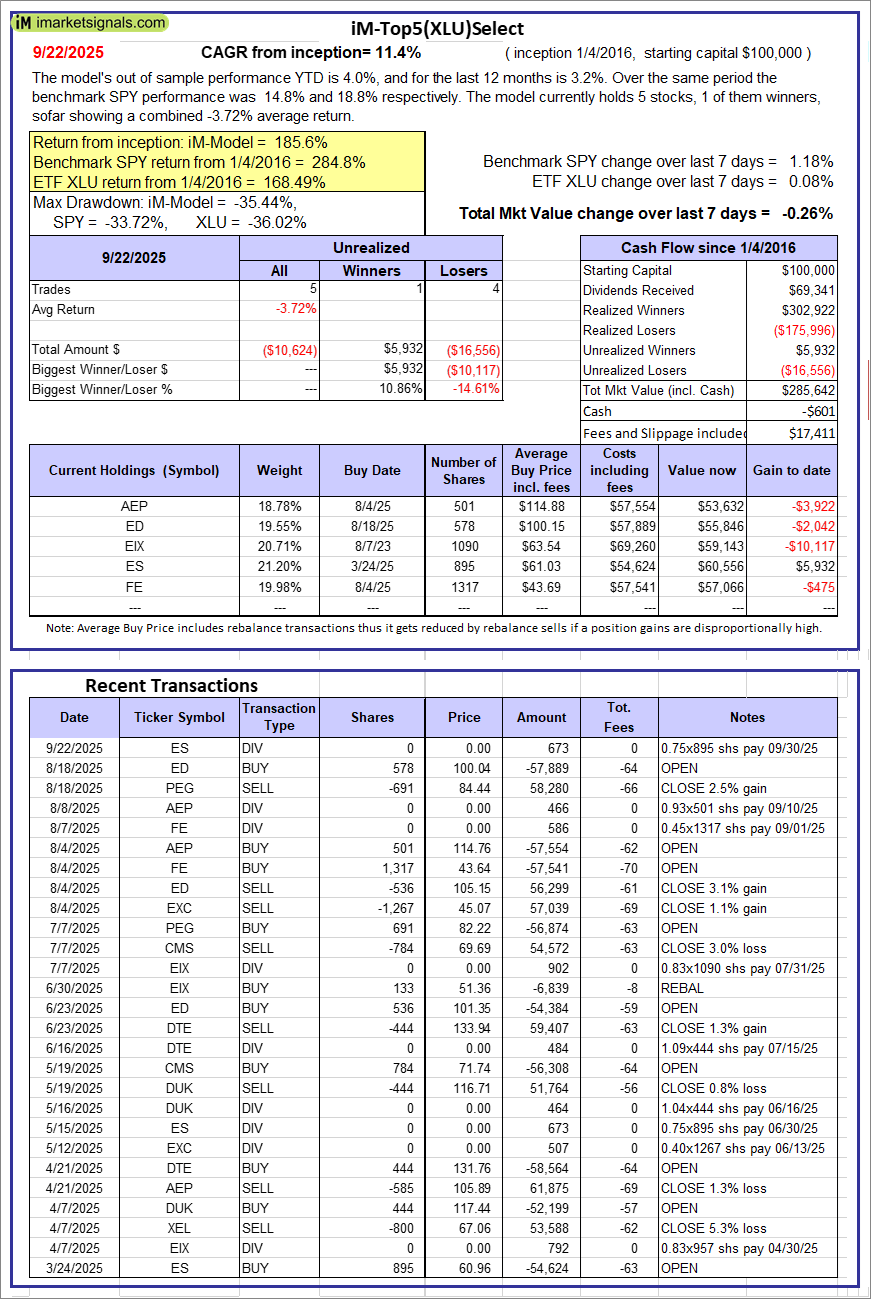 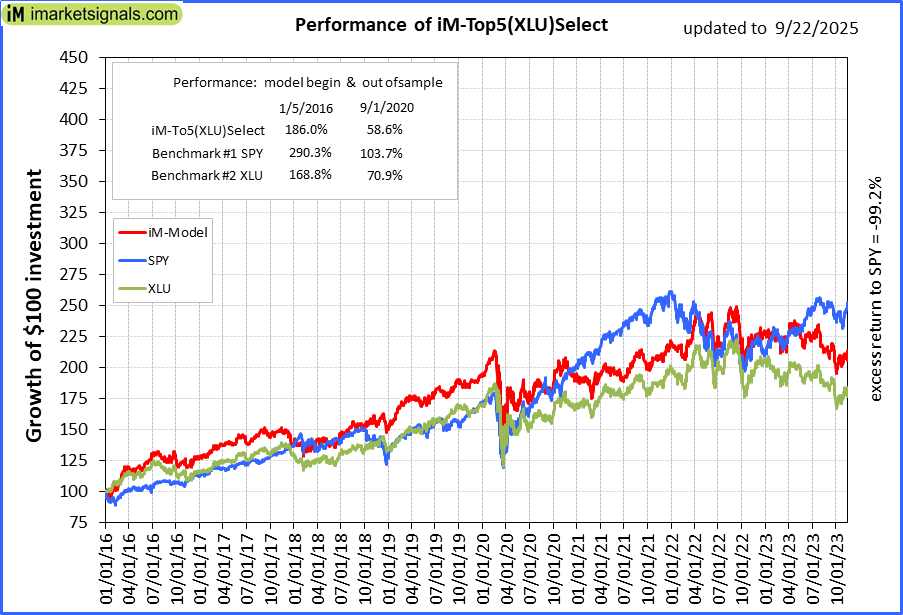 |
iM-Top5(XLU)Select: Since inception, on 1/5/2016, the model gained 185.64% while the benchmark SPY gained 284.79% over the same period. Over the previous week the market value of iM-Top5(XLU)Select gained -0.26% at a time when SPY gained 1.18%. A starting capital of $100,000 at inception on 1/5/2016 would have grown to $285,642 which includes -$601 cash and excludes $17,411 spent on fees and slippage. |
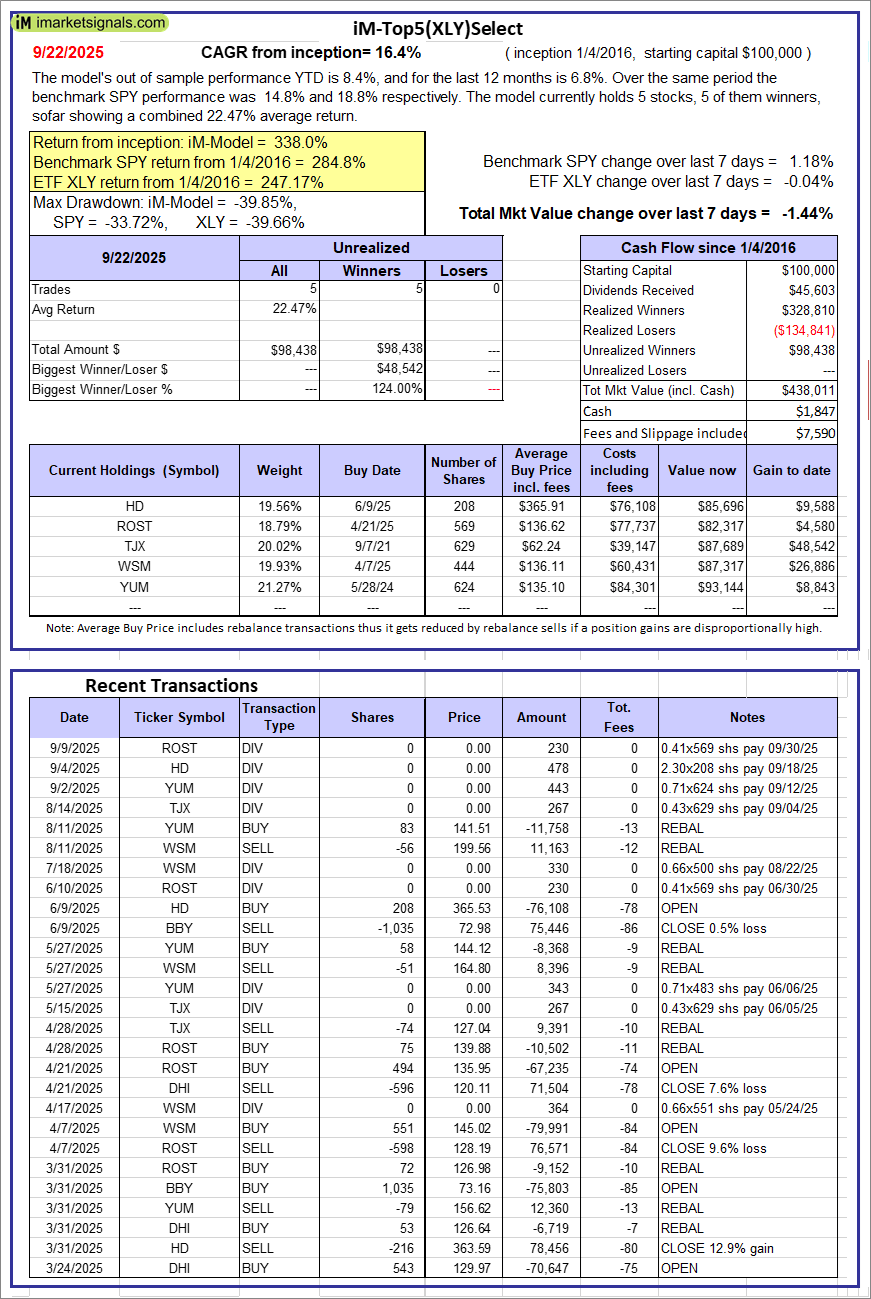 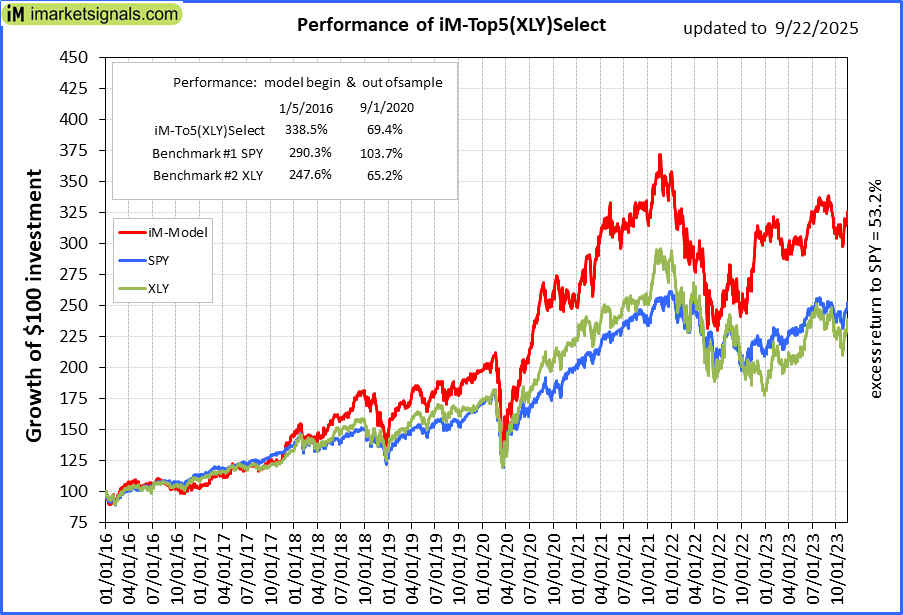 |
iM-Top5(XLY)Select: Since inception, on 1/5/2016, the model gained 338.01% while the benchmark SPY gained 284.79% over the same period. Over the previous week the market value of iM-Top5(XLY)Select gained -1.44% at a time when SPY gained 1.18%. A starting capital of $100,000 at inception on 1/5/2016 would have grown to $438,011 which includes $1,847 cash and excludes $7,590 spent on fees and slippage. |
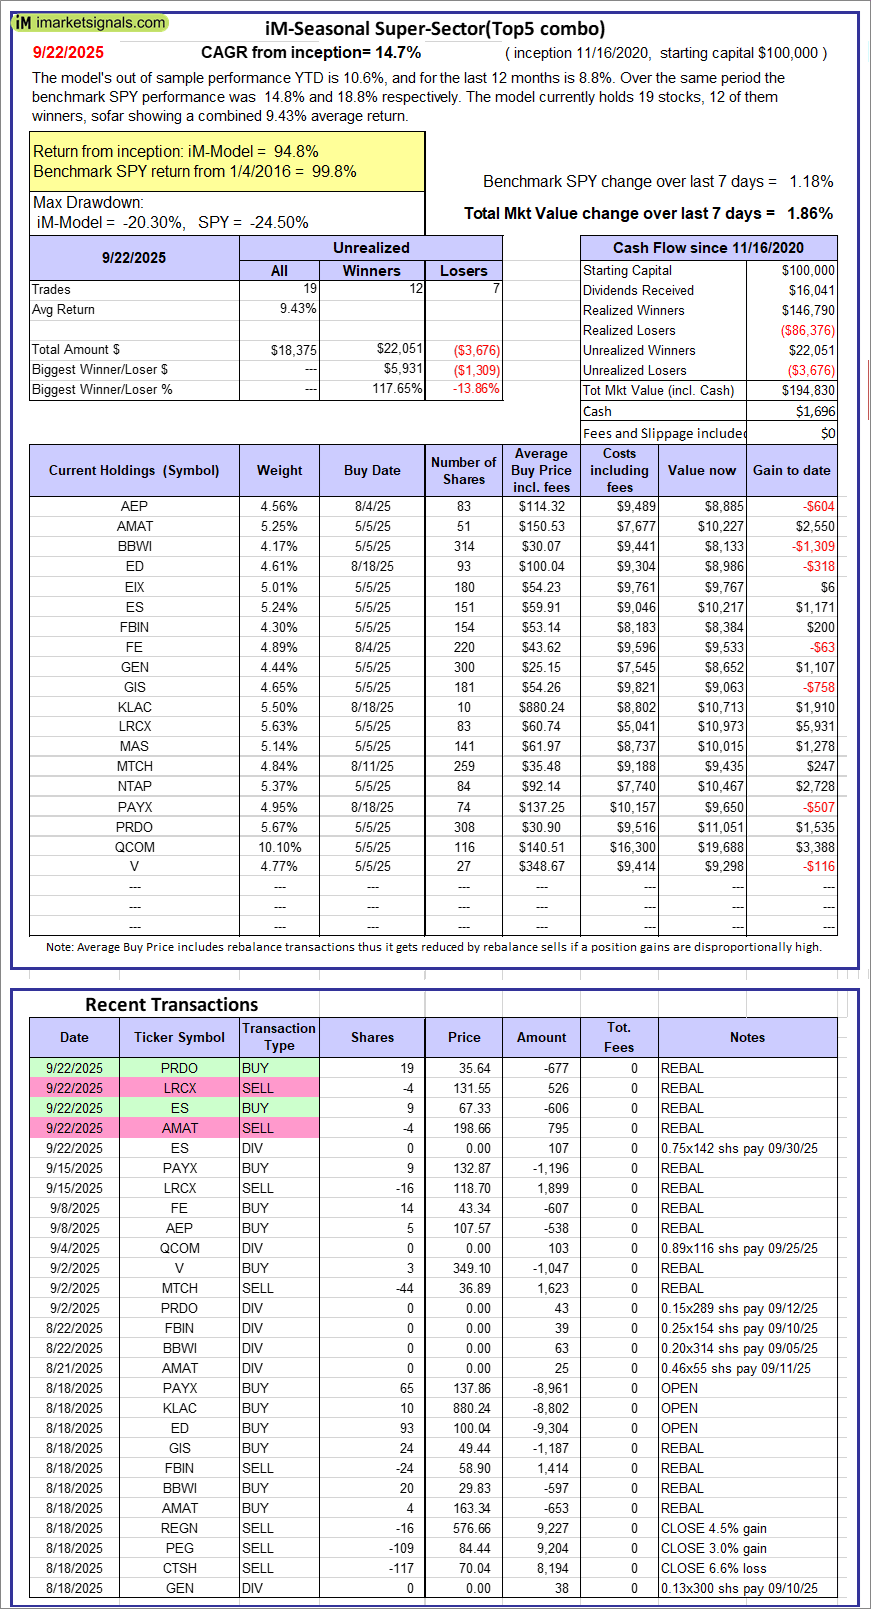 |
iM-Seasonal Super-Sectors (Top5 combo) : Since inception, on 11/17/2020, the model gained 94.83% while the benchmark SPY gained 99.75% over the same period. Over the previous week the market value of iM-Seasonal Super-Sectors (Top5 combo) gained 1.86% at a time when SPY gained 1.18%. A starting capital of $100,000 at inception on 11/17/2020 would have grown to $194,830 which includes $1,696 cash and excludes $00 spent on fees and slippage. |
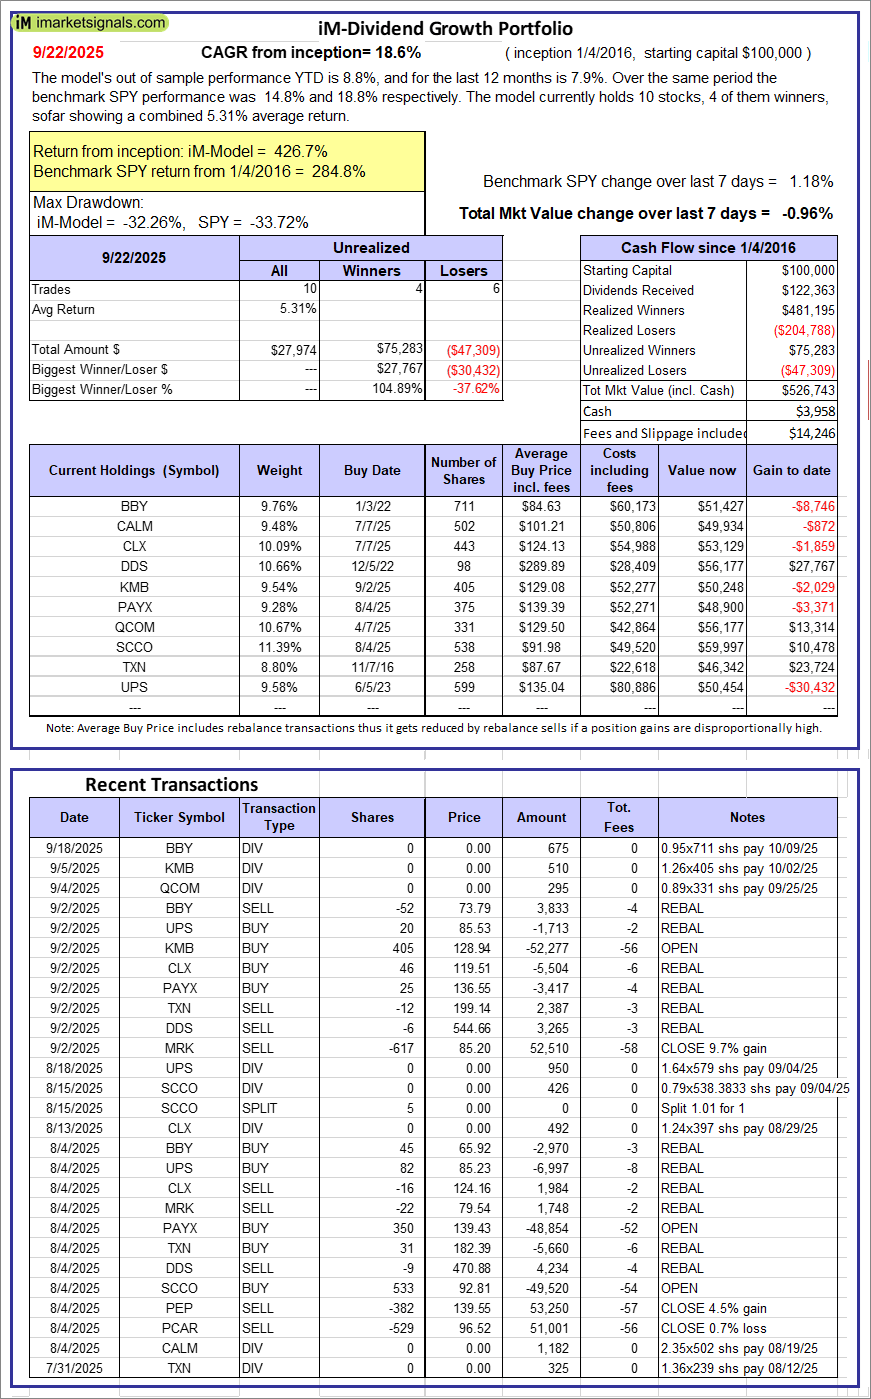 |
iM-Dividend Growth Portfolio: The model’s out of sample performance YTD is 8.8%, and for the last 12 months is 7.9%. Over the same period the benchmark SPY performance was 14.8% and 18.8% respectively. Over the previous week the market value of the iM-Dividend Growth Portfolio gained -0.96% at a time when SPY gained 1.18%. A starting capital of $100,000 at inception on 6/30/2016 would have grown to $526,743 which includes $3,958 cash and excludes $14,246 spent on fees and slippage. |
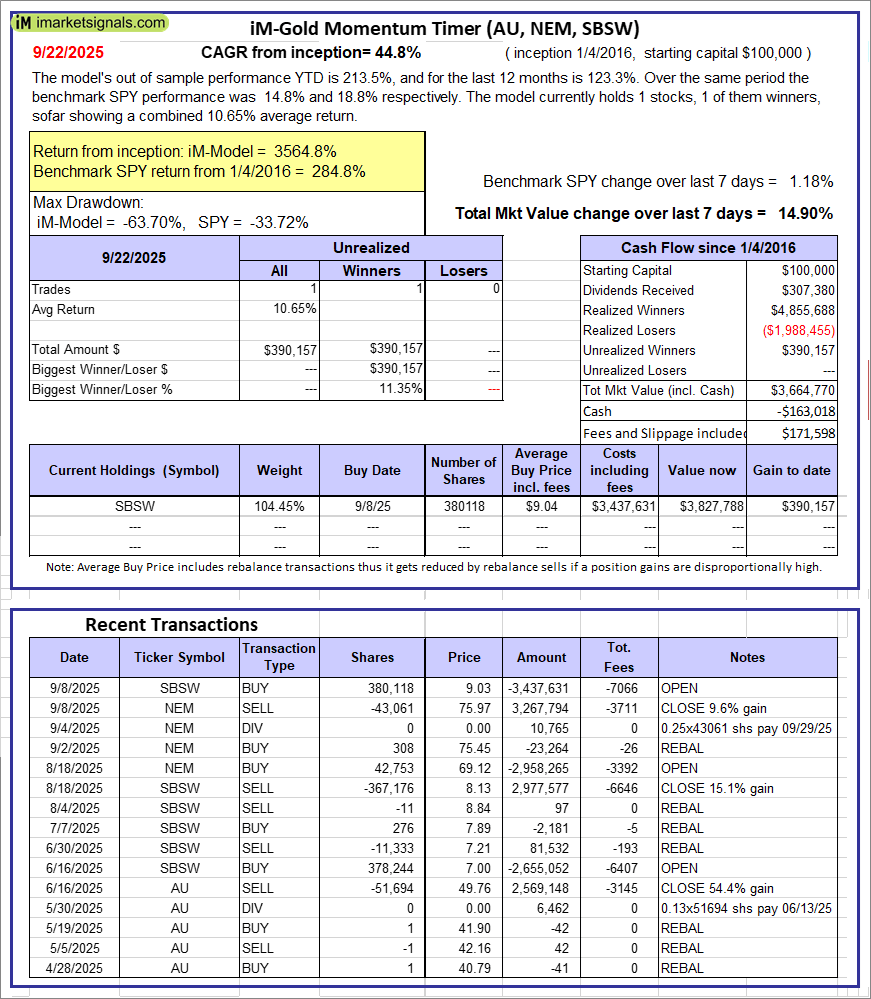 |
iM-Gold Momentum Timer (AU, NEM, SBSW): The model’s out of sample performance YTD is 213.5%, and for the last 12 months is 123.3%. Over the same period the benchmark SPY performance was 14.8% and 18.8% respectively. Over the previous week the market value of iM-Gold Momentum Timer (AU, NEM, SBSW) gained 14.90% at a time when SPY gained 1.18%. A starting capital of $100,000 at inception on 6/30/2016 would have grown to -$163,018 which includes $171,598 cash and excludes Gain to date spent on fees and slippage. |
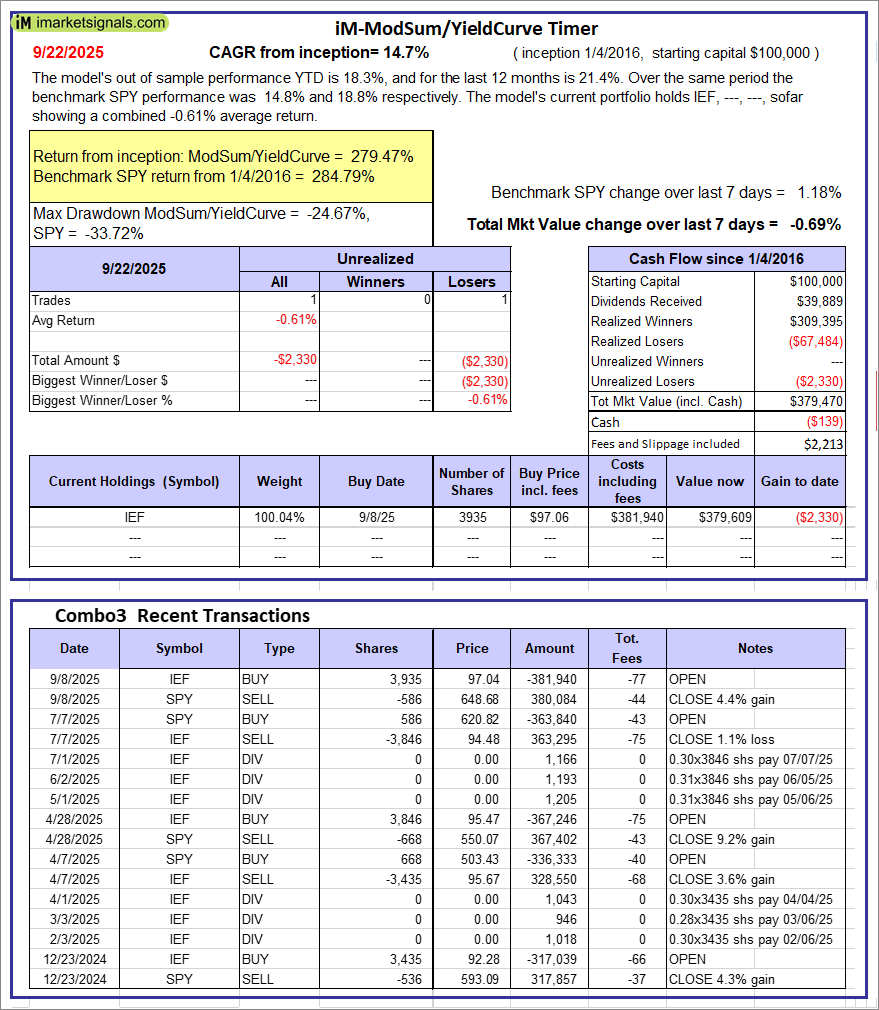 |
iM-ModSum/YieldCurve Timer: The model’s out of sample performance YTD is 18.3%, and for the last 12 months is 21.4%. Over the same period the benchmark SPY performance was 14.8% and 18.8% respectively. Over the previous week the market value of iM-PortSum/YieldCurve Timer gained -0.69% at a time when SPY gained 1.18%. A starting capital of $100,000 at inception on 1/1/2016 would have grown to $379,470 which includes -$139 cash and excludes $2,213 spent on fees and slippage. |
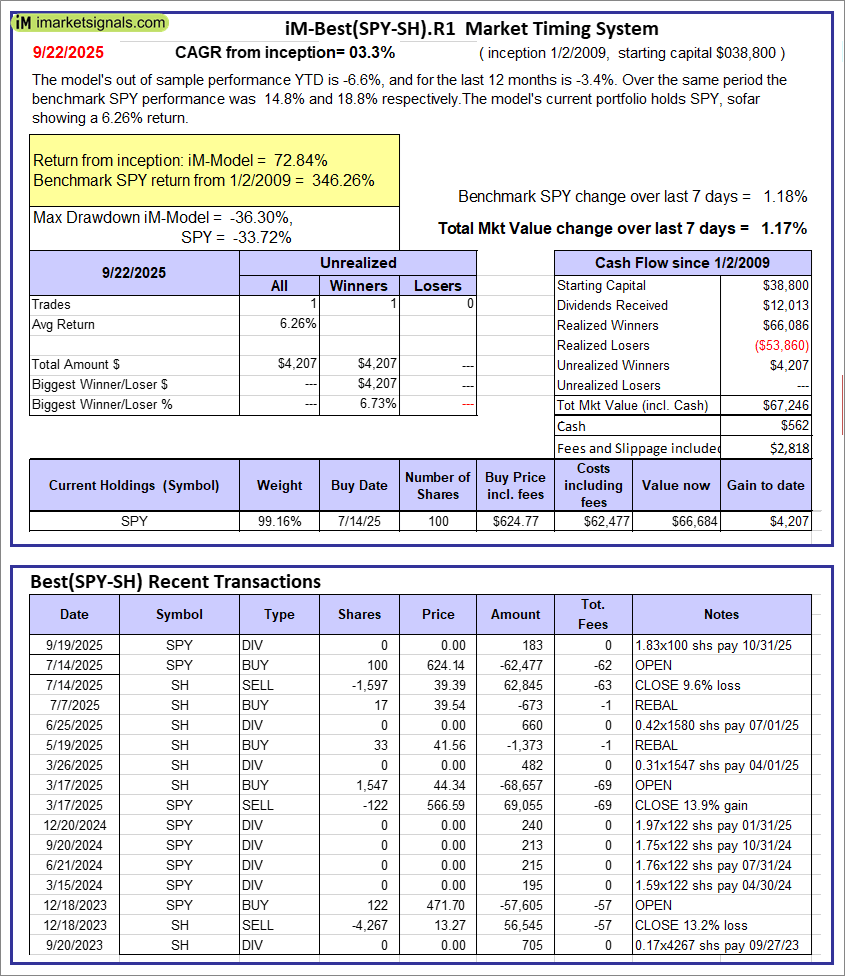 |
iM-Best(SPY-SH).R1: The model’s out of sample performance YTD is -6.6%, and for the last 12 months is -3.4%. Over the same period the benchmark SPY performance was 14.8% and 18.8% respectively. Over the previous week the market value of Best(SPY-SH) gained 1.17% at a time when SPY gained 1.18%. A starting capital of $100,000 at inception on 1/2/2009 would have grown to $67,246 which includes $562 cash and excludes $2,818 spent on fees and slippage. |
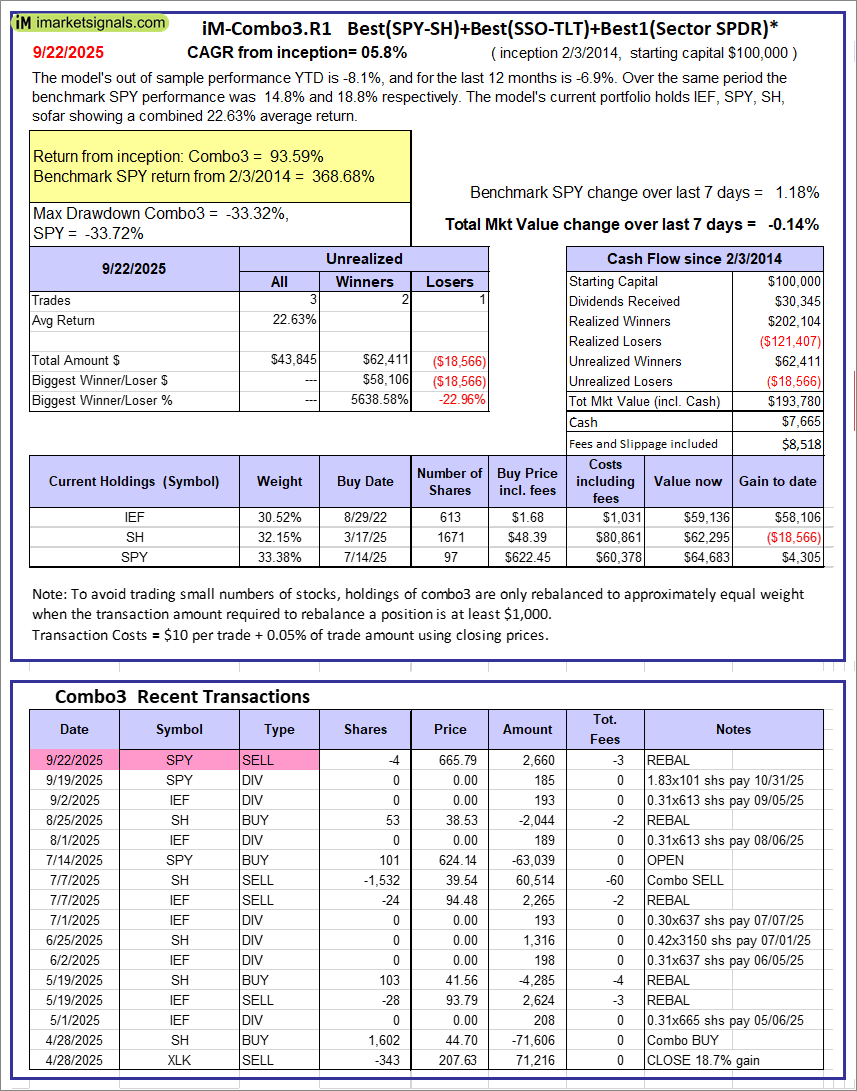 |
iM-Combo3.R1: The model’s out of sample performance YTD is -8.1%, and for the last 12 months is -6.9%. Over the same period the benchmark SPY performance was 14.8% and 18.8% respectively. Over the previous week the market value of iM-Combo3.R1 gained -0.14% at a time when SPY gained 1.18%. A starting capital of $100,000 at inception on 2/3/2014 would have grown to $193,780 which includes $7,665 cash and excludes $8,518 spent on fees and slippage. |
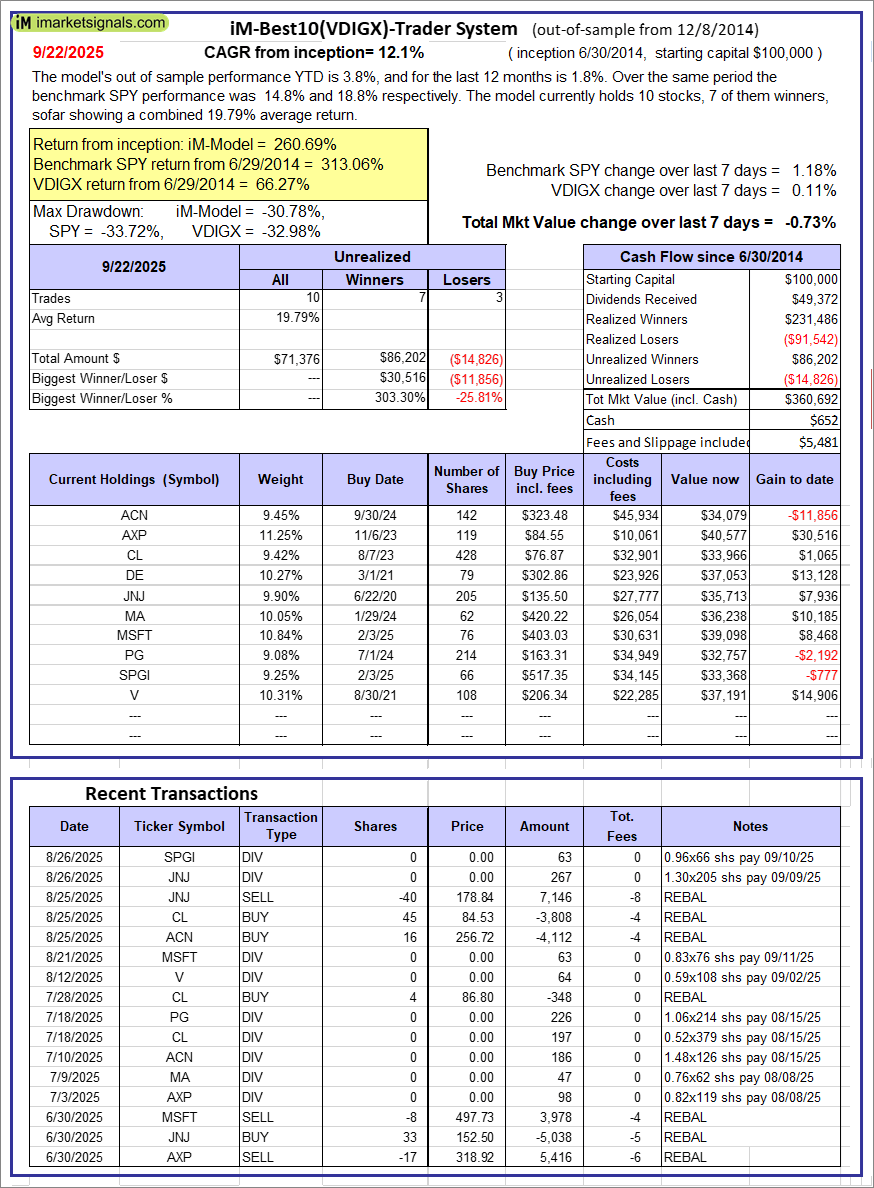 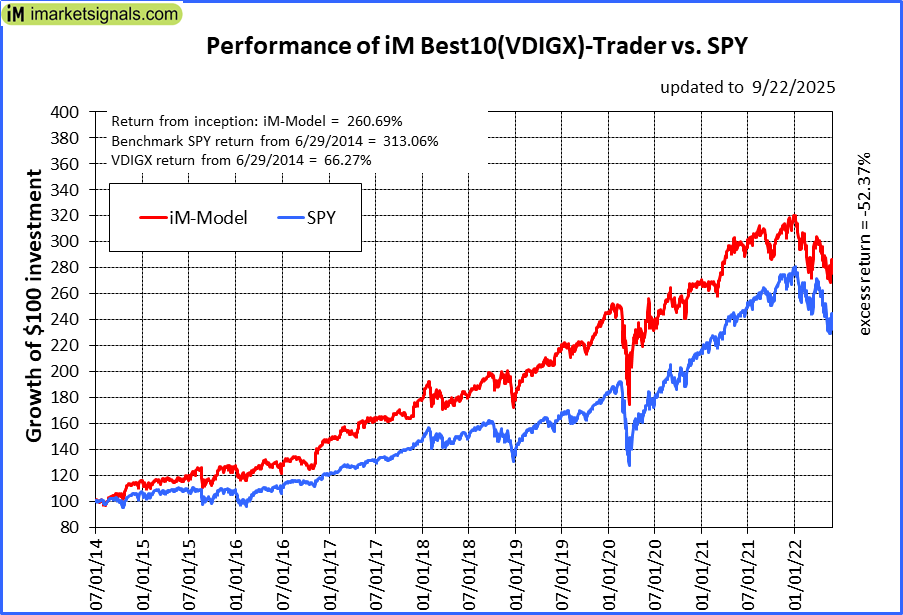 |
iM-Best10(VDIGX)-Trader: The model’s out of sample performance YTD is 3.8%, and for the last 12 months is 1.8%. Over the same period the benchmark SPY performance was 14.8% and 18.8% respectively. Since inception, on 7/1/2014, the model gained 260.69% while the benchmark SPY gained 313.06% and VDIGX gained 66.27% over the same period. Over the previous week the market value of iM-Best10(VDIGX) gained -0.73% at a time when SPY gained 1.18%. A starting capital of $100,000 at inception on 7/1/2014 would have grown to $360,692 which includes $652 cash and excludes $5,481 spent on fees and slippage. |
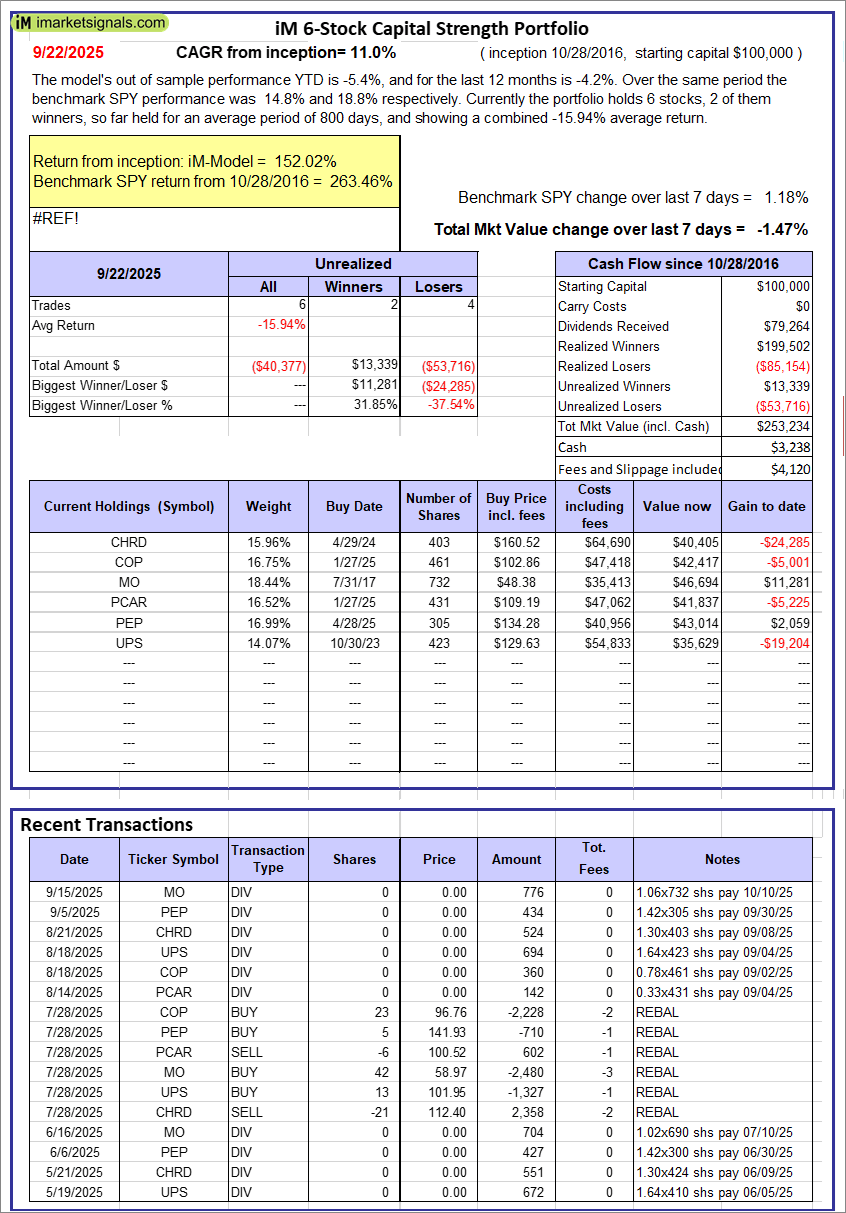 |
iM 6-Stock Capital Strength Portfolio: The model’s out of sample performance YTD is -5.4%, and for the last 12 months is -4.2%. Over the same period the benchmark SPY performance was 14.8% and 18.8% respectively. Over the previous week the market value of the iM 6-Stock Capital Strength Portfolio gained -1.47% at a time when SPY gained 1.18%. A starting capital of $100,000 at inception on 10/28/2016 would have grown to $253,234 which includes $3,238 cash and excludes $4,120 spent on fees and slippage. |
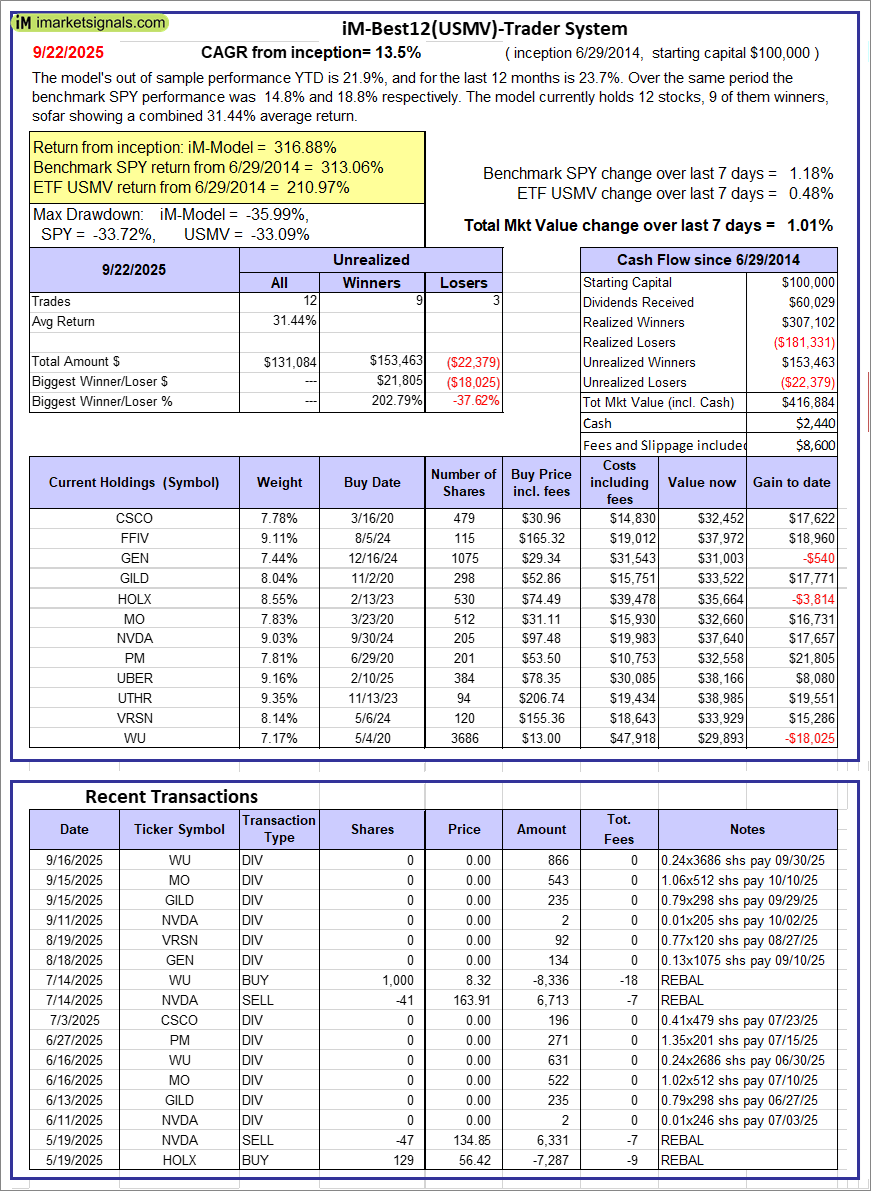 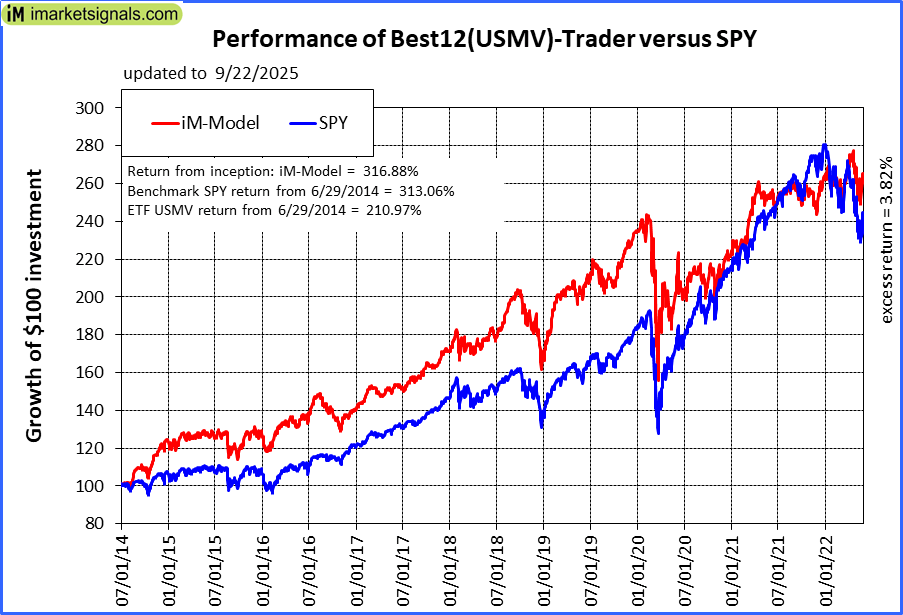 |
iM-Best12(USMV)-Trader: The model’s out of sample performance YTD is 21.9%, and for the last 12 months is 23.7%. Over the same period the benchmark SPY performance was 14.8% and 18.8% respectively. Since inception, on 6/30/2014, the model gained 316.88% while the benchmark SPY gained 313.06% and the ETF USMV gained 210.97% over the same period. Over the previous week the market value of iM-Best12(USMV)-Trader gained 1.01% at a time when SPY gained 1.18%. A starting capital of $100,000 at inception on 6/30/2014 would have grown to $416,884 which includes $2,440 cash and excludes $8,600 spent on fees and slippage. |
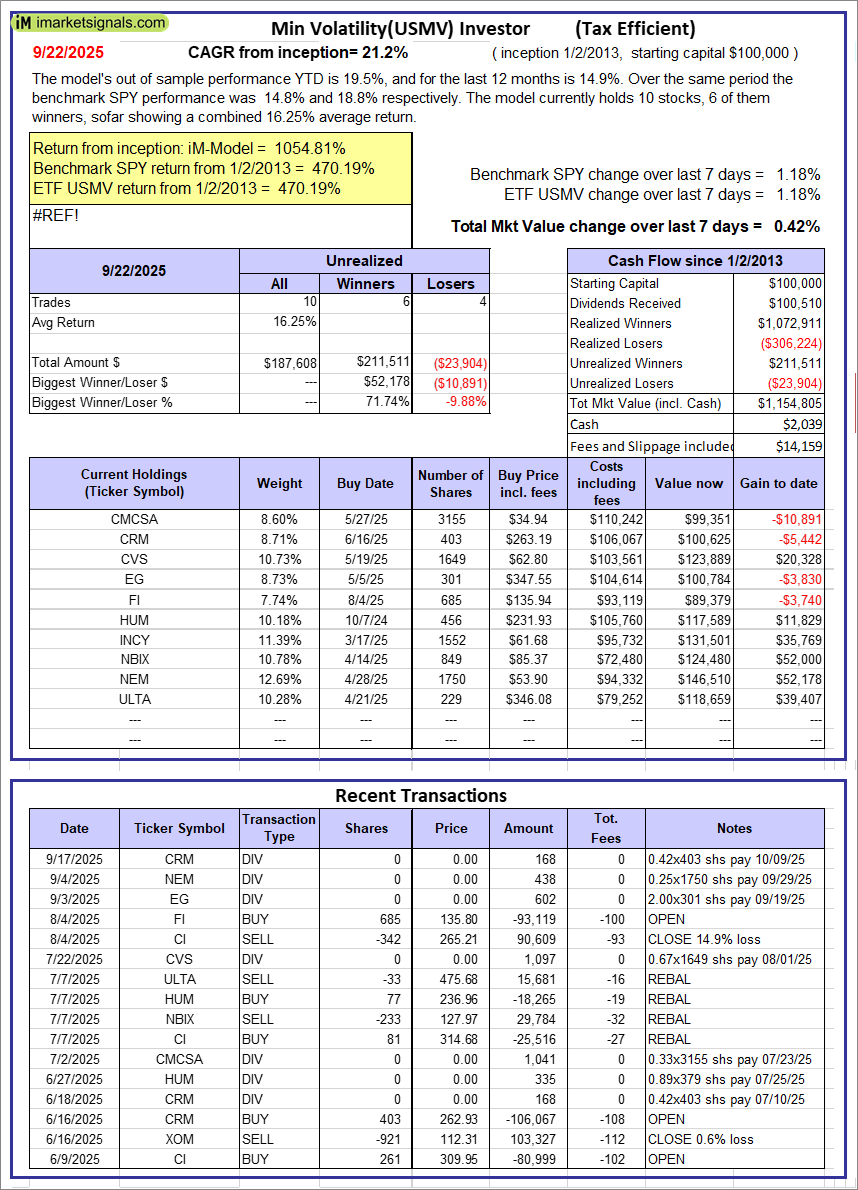 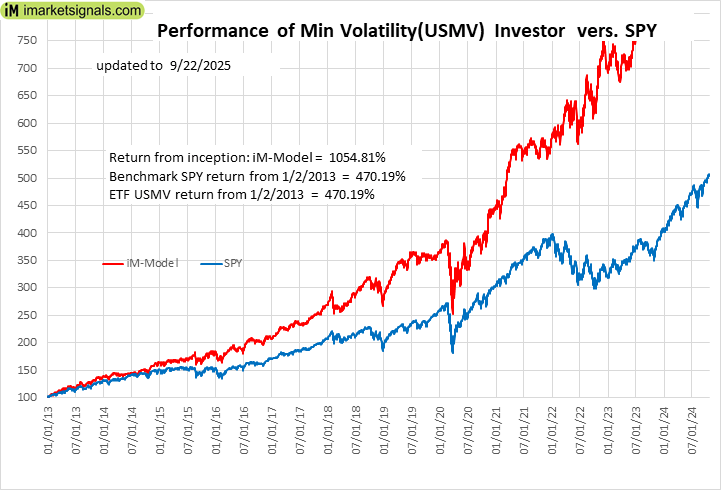 |
iM-Min Volatility(USMV) Investor (Tax Efficient): The model’s out of sample performance YTD is 19.5%, and for the last 12 months is 14.9%. Over the same period the benchmark SPY performance was 14.8% and 18.8% respectively. Since inception, on 1/3/2013, the model gained 1054.81% while the benchmark SPY gained 470.19% and the ETF USMV gained 470.19% over the same period. Over the previous week the market value of iM-Best12(USMV)Q1 gained 0.42% at a time when SPY gained 1.18%. A starting capital of $100,000 at inception on 1/3/2013 would have grown to $1,154,805 which includes $2,039 cash and excludes $14,159 spent on fees and slippage. |
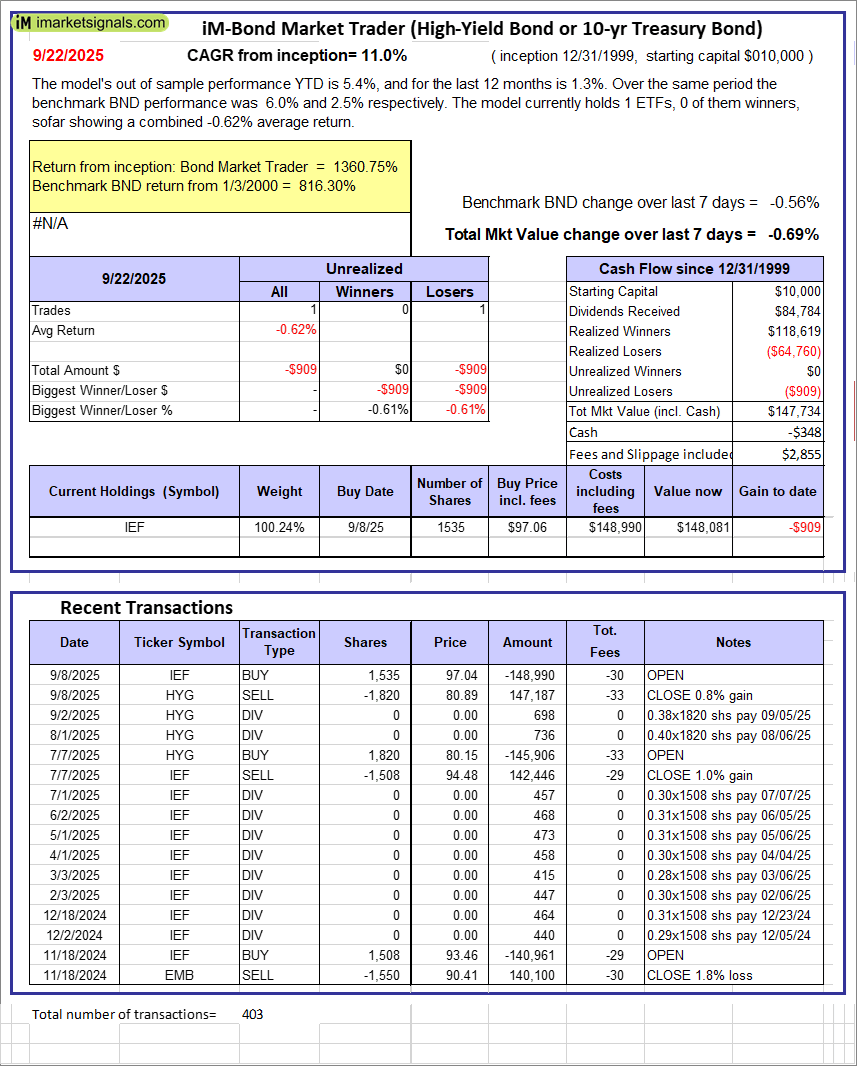 |
iM-Bond Market Trader (High-Yield Bond or 10-yr Treasury Bond): The model’s out of sample performance YTD is 5.4%, and for the last 12 months is 1.3%. Over the same period the benchmark BND performance was 6.0% and 2.5% respectively. Over the previous week the market value of the iM-Bond Market Trader (High-Yield Bond or 10-yr Treasury Bond) gained -0.69% at a time when BND gained -0.56%. A starting capital of $10,000 at inception on 1/3/2000 would have grown to $147,734 which includes -$348 cash and excludes $2,855 spent on fees and slippage. |
|
|
iM-ModSum/YieldCurve Timer: The model’s out of sample performance YTD is 18.3%, and for the last 12 months is 21.4%. Over the same period the benchmark SPY performance was 14.8% and 18.8% respectively. Over the previous week the market value of iM-PortSum/YieldCurve Timer gained -0.69% at a time when SPY gained 1.18%. A starting capital of $100,000 at inception on 1/1/2016 would have grown to $379,470 which includes -$139 cash and excludes $2,213 spent on fees and slippage. |
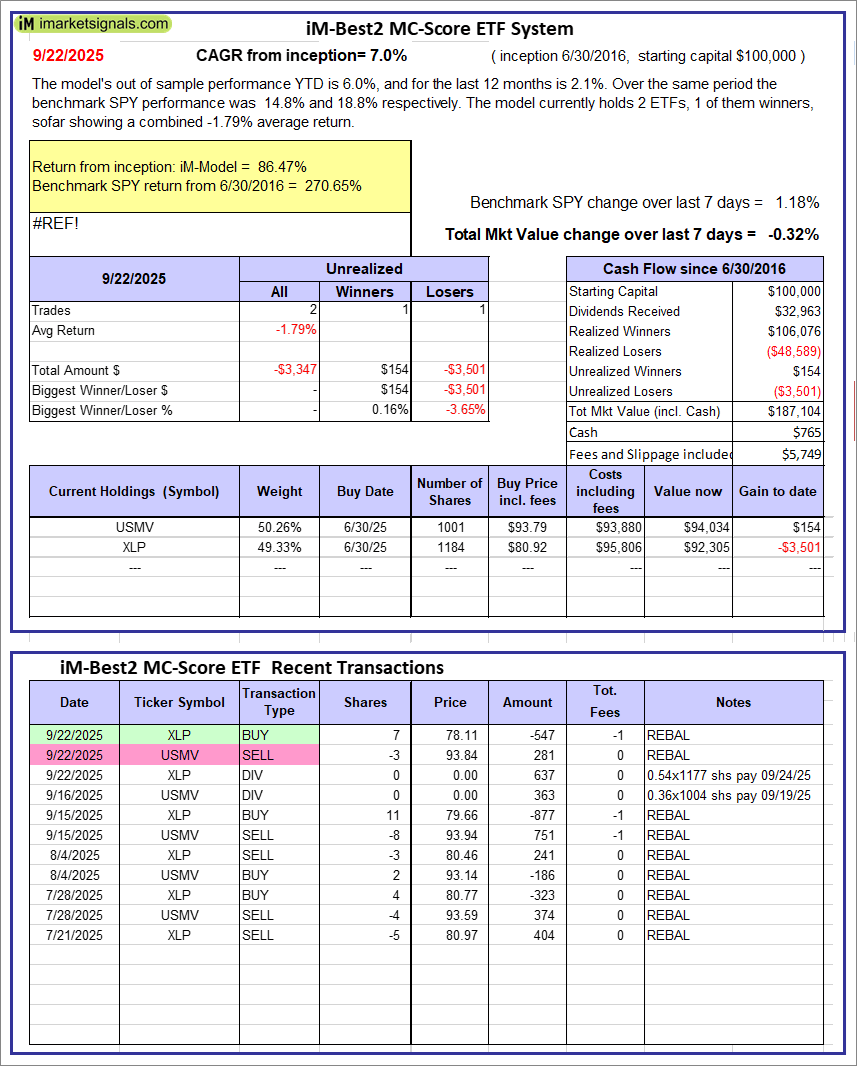 |
iM-Best2 MC-Score ETF System: The model’s out of sample performance YTD is 6.0%, and for the last 12 months is 2.1%. Over the same period the benchmark SPY performance was 14.8% and 18.8% respectively. Over the previous week the market value of the iM-Best2 MC-Score ETF System gained -0.32% at a time when SPY gained 1.18%. A starting capital of $100,000 at inception on 6/30/2016 would have grown to $187,104 which includes $765 cash and excludes $5,749 spent on fees and slippage. |
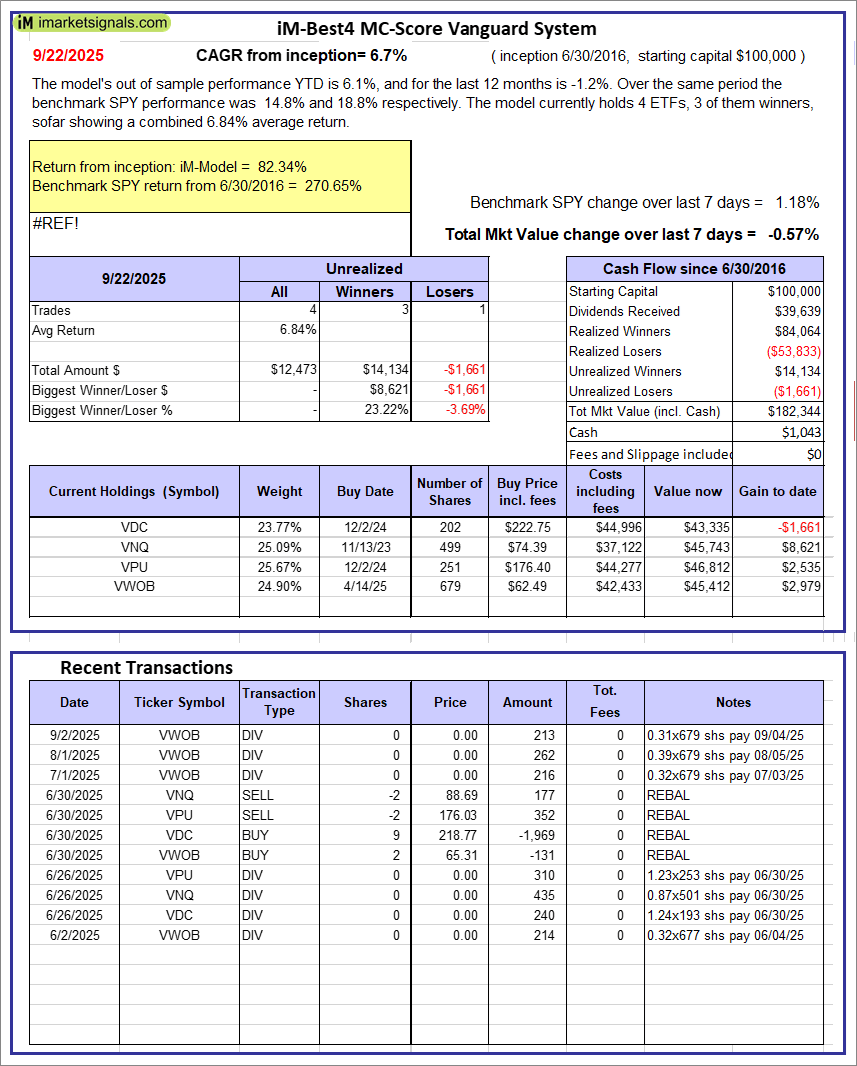 |
iM-Best4 MC-Score Vanguard System: The model’s out of sample performance YTD is 6.1%, and for the last 12 months is -1.2%. Over the same period the benchmark SPY performance was 14.8% and 18.8% respectively. Over the previous week the market value of the iM-Best4 MC-Score Vanguard System gained -0.57% at a time when SPY gained 1.18%. A starting capital of $100,000 at inception on 6/30/2016 would have grown to $182,344 which includes $1,043 cash and excludes $00 spent on fees and slippage. |
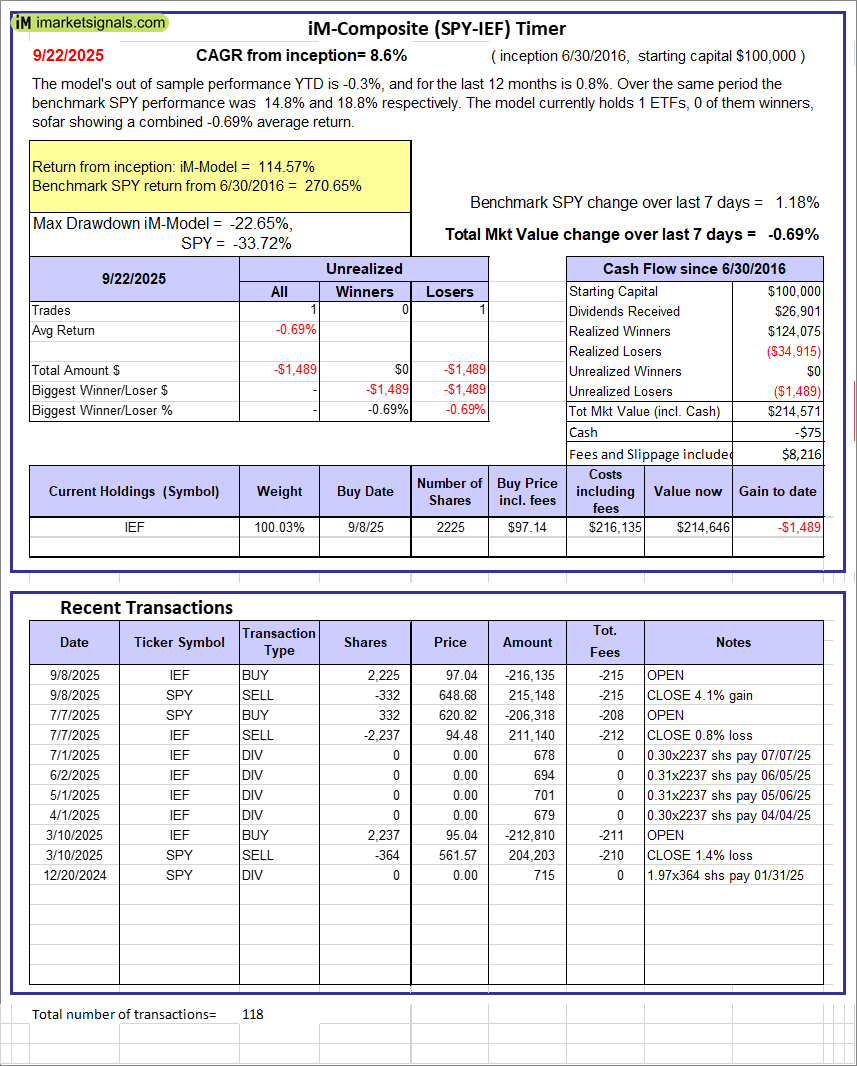 |
iM-Composite (SPY-IEF) Timer: The model’s out of sample performance YTD is -0.3%, and for the last 12 months is 0.8%. Over the same period the benchmark SPY performance was 14.8% and 18.8% respectively. Over the previous week the market value of the iM-Composite (SPY-IEF) Timer gained -0.69% at a time when SPY gained 1.18%. A starting capital of $100,000 at inception on 6/30/2016 would have grown to $214,571 which includes -$75 cash and excludes $8,216 spent on fees and slippage. |
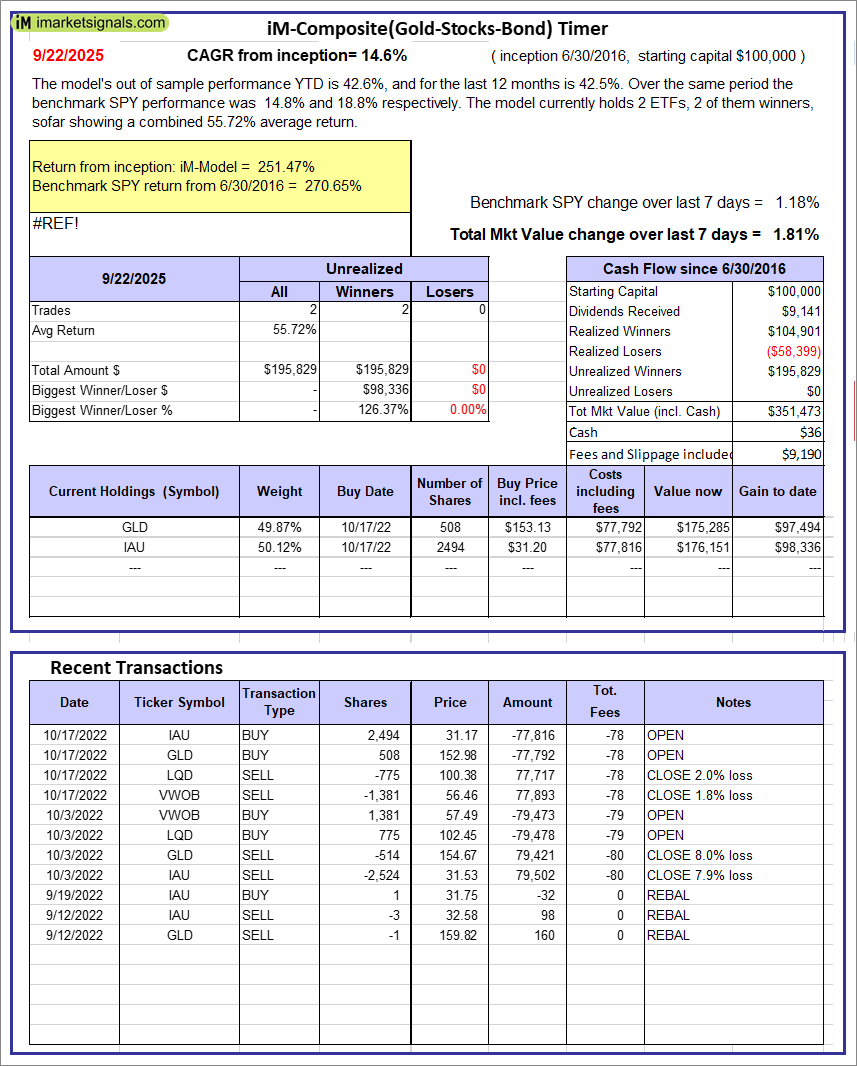 |
iM-Composite(Gold-Stocks-Bond) Timer: The model’s out of sample performance YTD is 42.6%, and for the last 12 months is 42.5%. Over the same period the benchmark SPY performance was 14.8% and 18.8% respectively. Over the previous week the market value of the iM-Composite(Gold-Stocks-Bond) Timer gained 1.81% at a time when SPY gained 1.18%. A starting capital of $100,000 at inception on 6/30/2016 would have grown to $351,473 which includes $36 cash and excludes $9,190 spent on fees and slippage. |
iM-Best Reports – 9/22/2025
Posted in pmp SPY-SH
Leave a Reply
You must be logged in to post a comment.