
  |
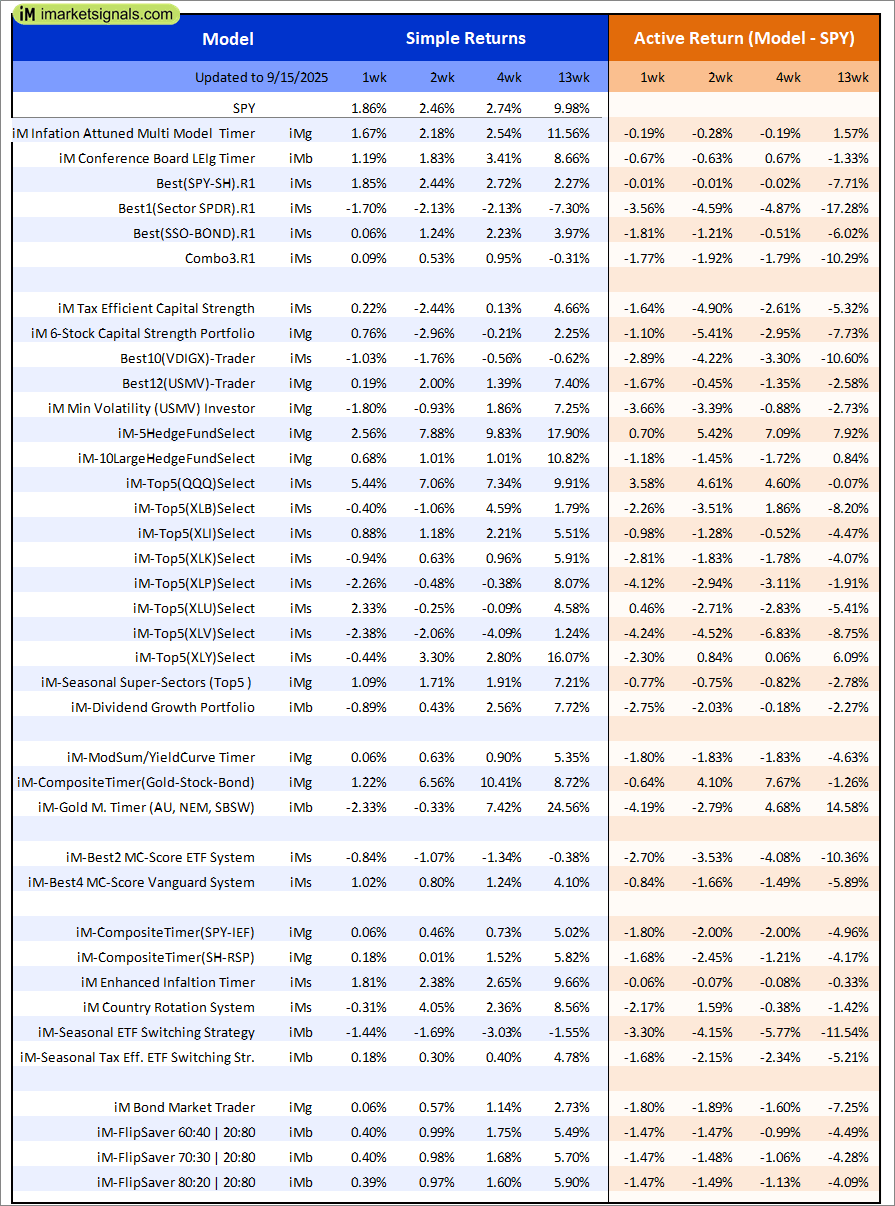
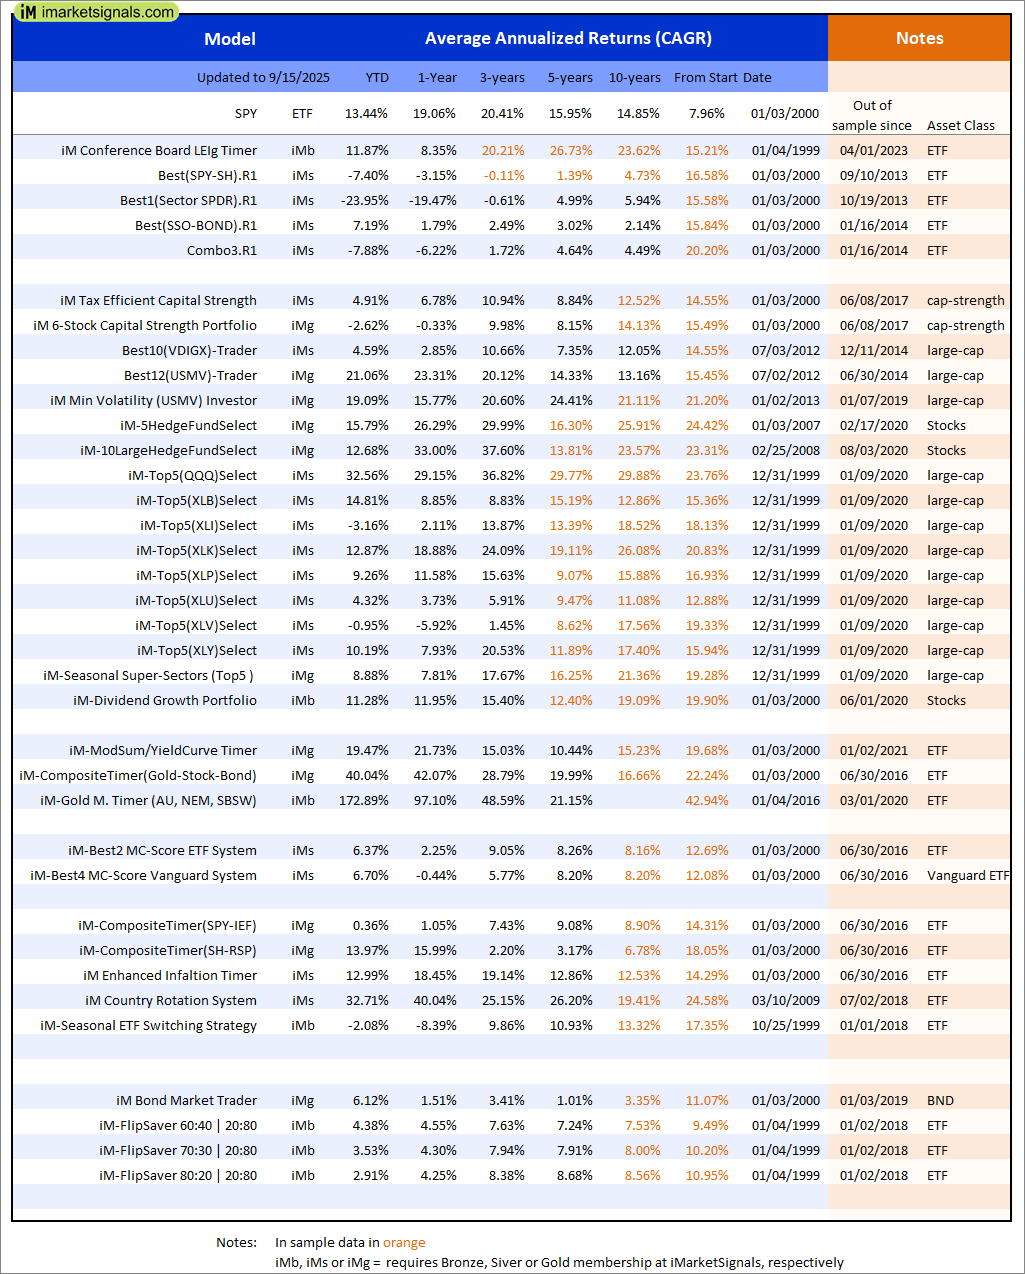
Out of sample performance summary of our models for the past 1, 2, 4 and 13 week periods. The active active return indicates how the models over- or underperformed the benchmark ETF SPY. Also the YTD, and the 1-, 3-, 5- and 10-year annualized returns are shown in the second table |
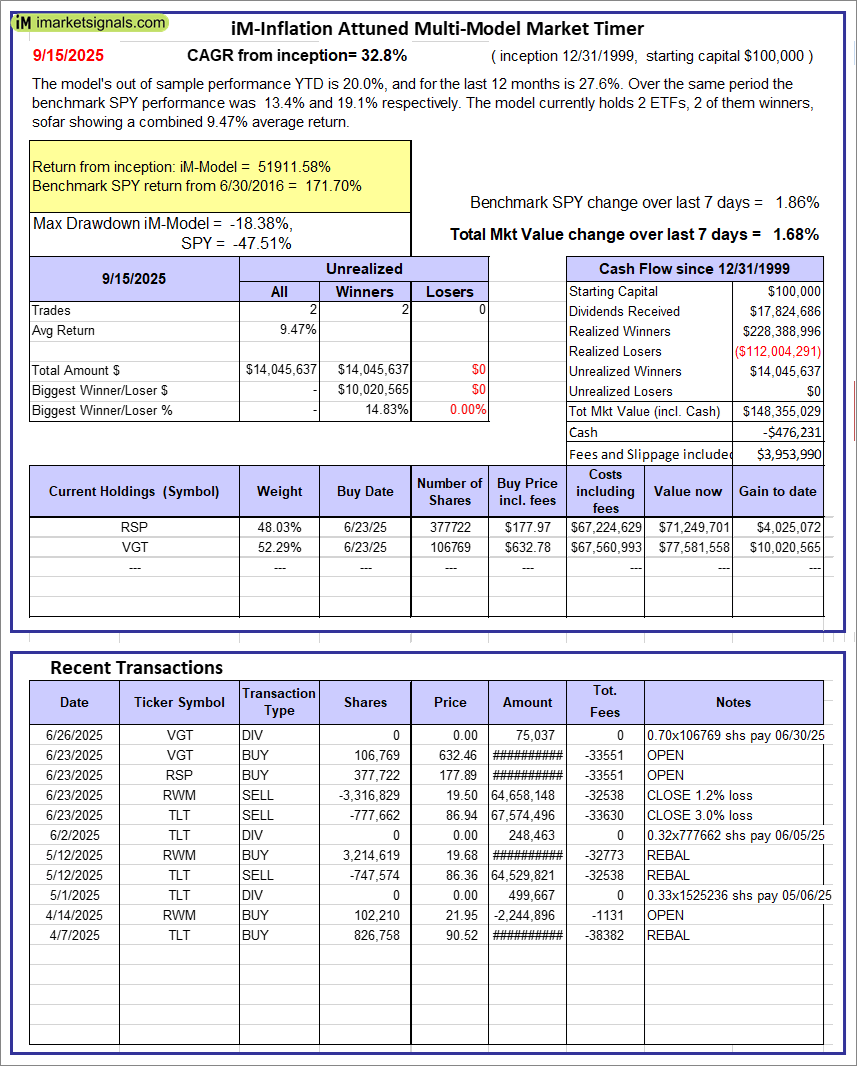 |
iM-Inflation Attuned Multi-Model Market Timer: The model’s out of sample performance YTD is 20.0%, and for the last 12 months is 27.6%. Over the same period the benchmark SPY performance was 13.4% and 19.1% respectively. Over the previous week the market value of the iM-Inflation Attuned Multi-Model Market Timer gained 1.68% at a time when SPY gained 1.86%. A starting capital of $100,000 at inception on 3/24/2017 would have grown to $148,355,029 which includes -$476,231 cash and excludes $3,953,990 spent on fees and slippage. |
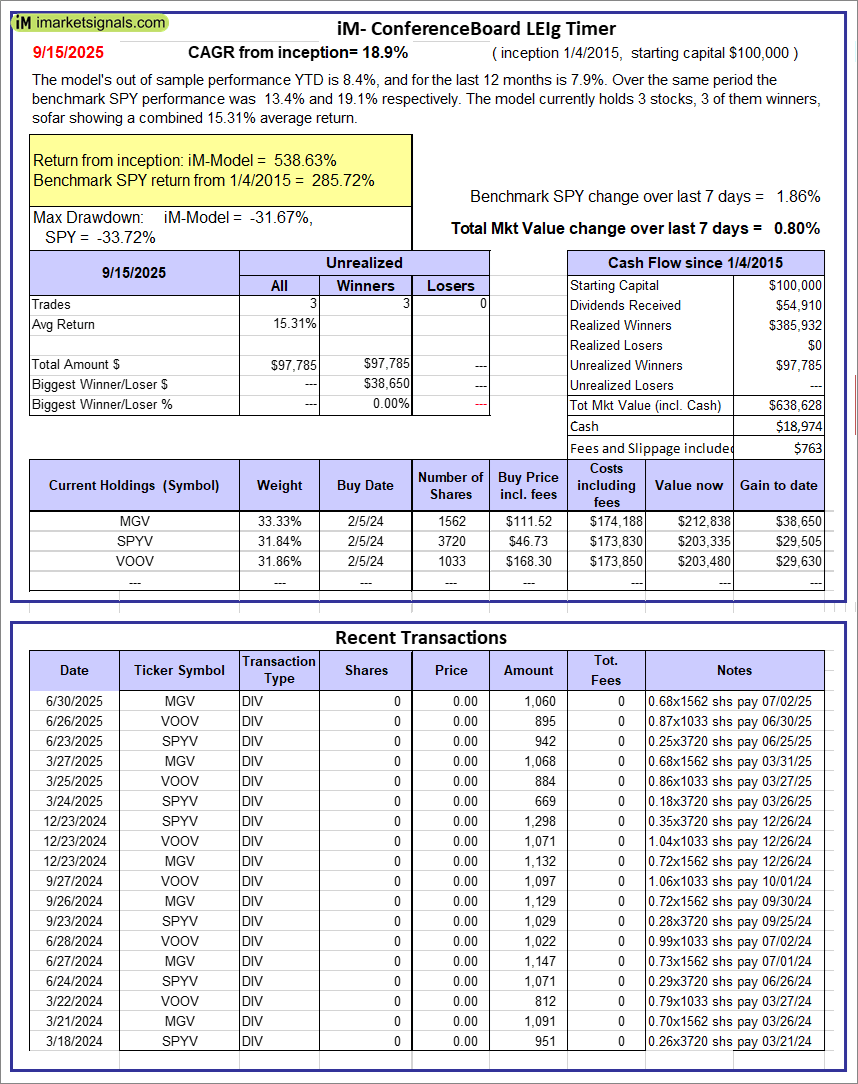 |
iM-Conference Board LEIg Timer: The model’s performance YTD is 14.3%, and for the last 12 months is 7.3%. Over the same period the benchmark SPY performance was 20.1% and 9.4% respectively. Over the previous week the market value of the iM-Conference Board LEIg Timer gained 0.80% at a time when SPY gained 1.86%. A starting capital of $100,000 at inception on 4/5/2017 would have grown to $638,628 which includes $18,974 cash and excludes $763 spent on fees and slippage. |
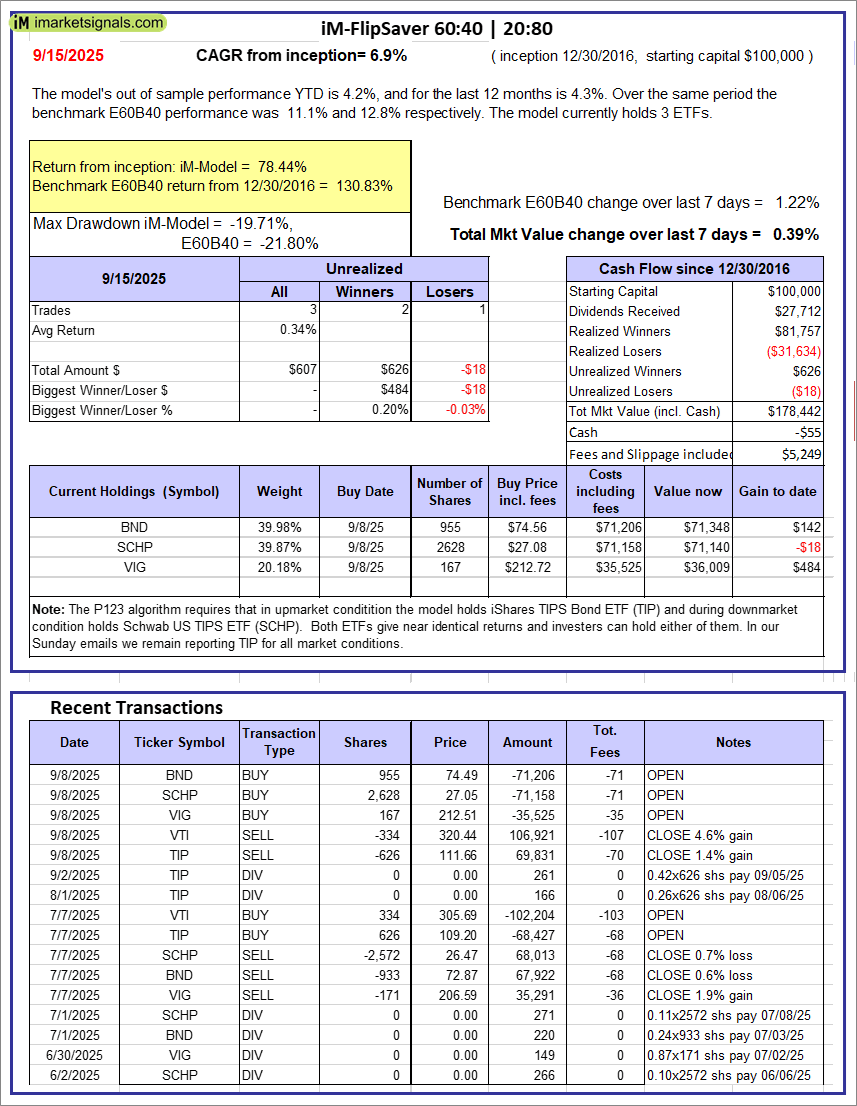 |
iM-FlipSaver 60:40 | 20:80 – 2017: The model’s out of sample performance YTD is 4.2%, and for the last 12 months is 4.3%. Over the same period the benchmark E60B40 performance was 11.1% and 12.8% respectively. Over the previous week the market value of iM-FlipSaver 80:20 | 20:80 gained 0.39% at a time when SPY gained 1.22%. A starting capital of $100,000 at inception on 7/16/2015 would have grown to $178,442 which includes -$55 cash and excludes $5,249 spent on fees and slippage. |
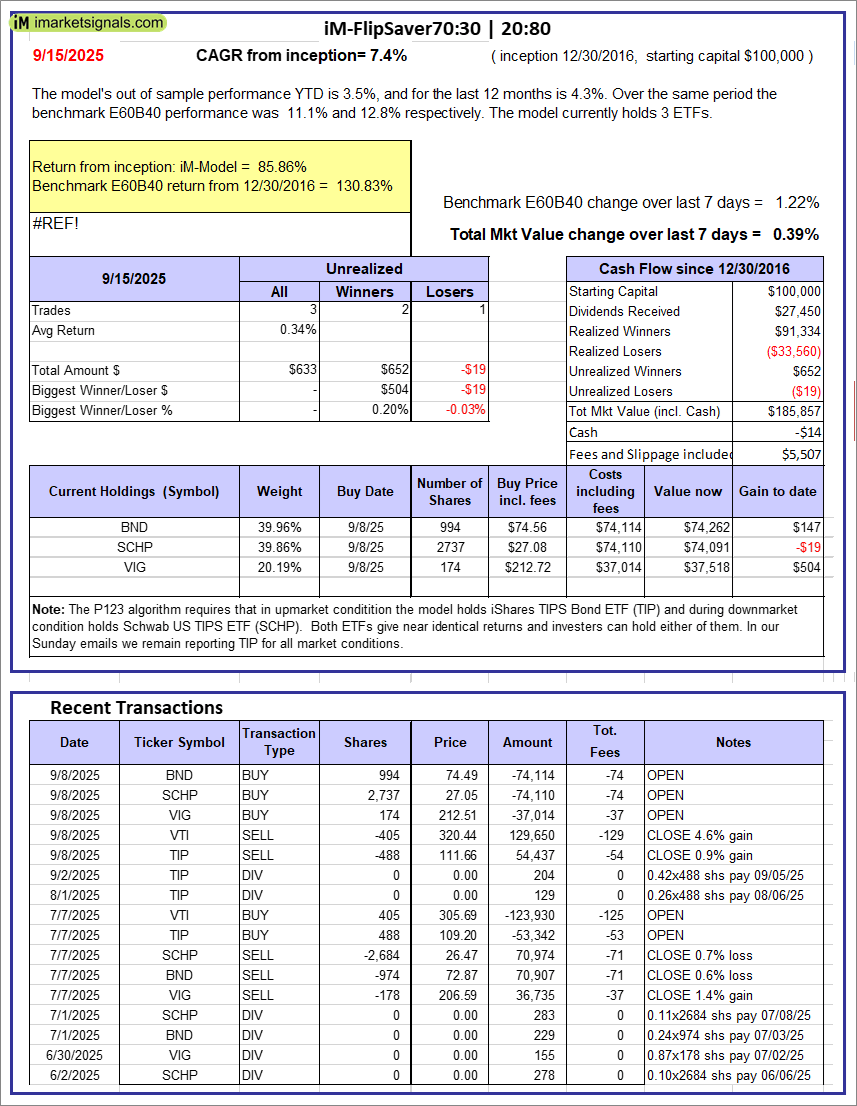 |
iM-FlipSaver 70:30 | 20:80 – 2017: The model’s out of sample performance YTD is 3.5%, and for the last 12 months is 4.3%. Over the same period the benchmark E60B40 performance was 11.1% and 12.8% respectively. Over the previous week the market value of iM-FlipSaver 70:30 | 20:80 gained 0.39% at a time when SPY gained 1.22%. A starting capital of $100,000 at inception on 7/15/2015 would have grown to $185,857 which includes -$14 cash and excludes $5,507 spent on fees and slippage. |
 |
iM-FlipSaver 80:20 | 20:80 – 2017: The model’s out of sample performance YTD is 2.9%, and for the last 12 months is 4.2%. Over the same period the benchmark E60B40 performance was 11.1% and 12.8% respectively. Over the previous week the market value of iM-FlipSaver 80:20 | 20:80 gained 0.39% at a time when SPY gained 1.22%. A starting capital of $100,000 at inception on 1/2/2017 would have grown to $193,185 which includes -$5 cash and excludes $5,756 spent on fees and slippage. |
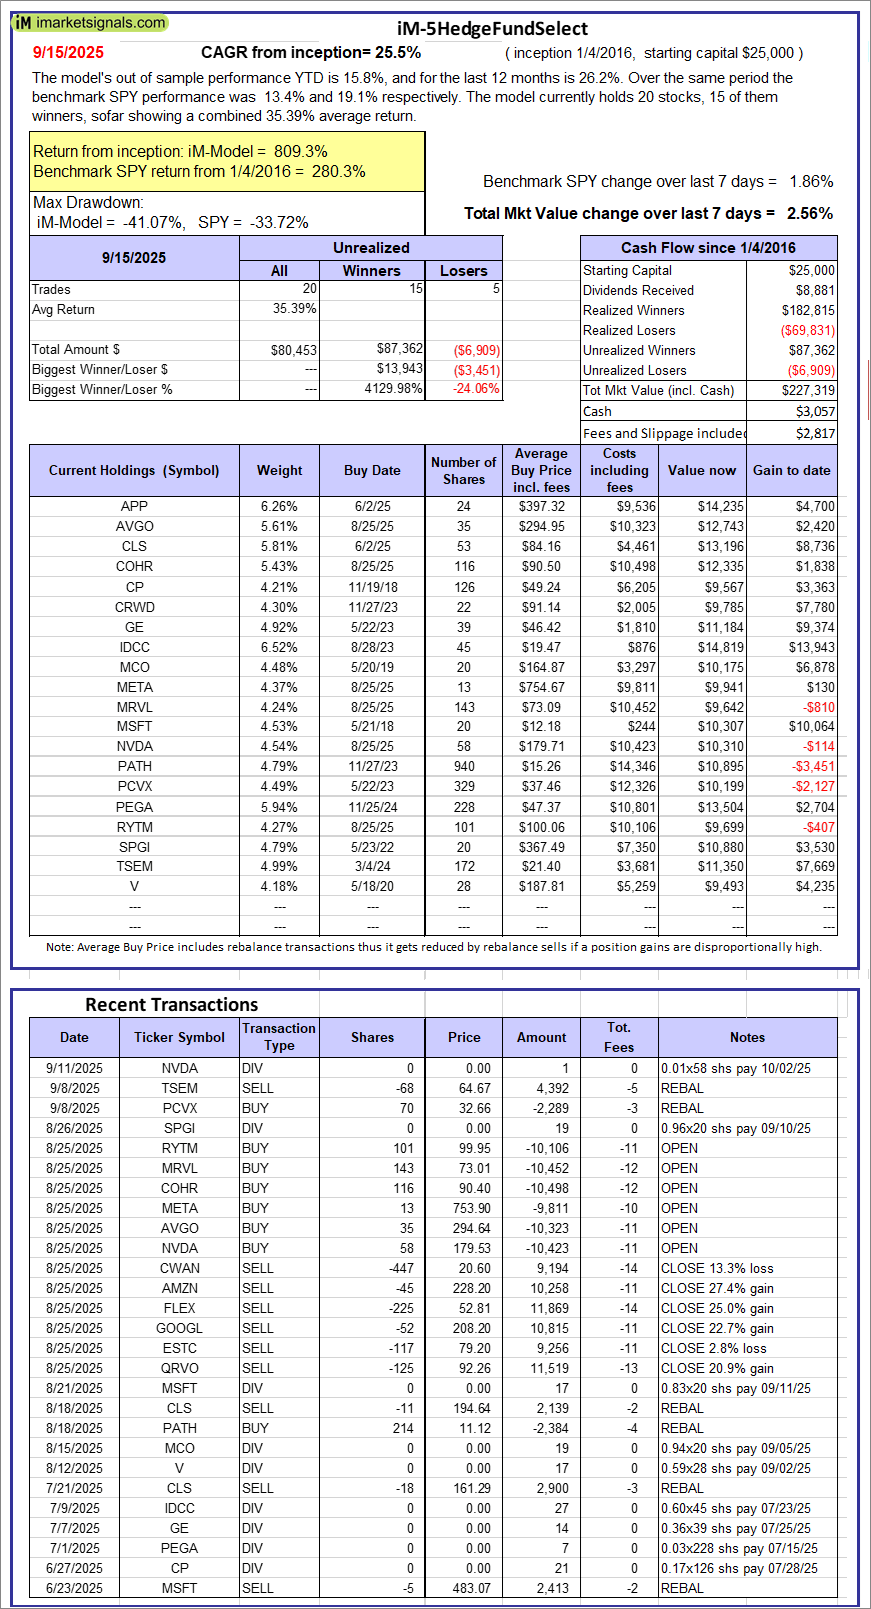 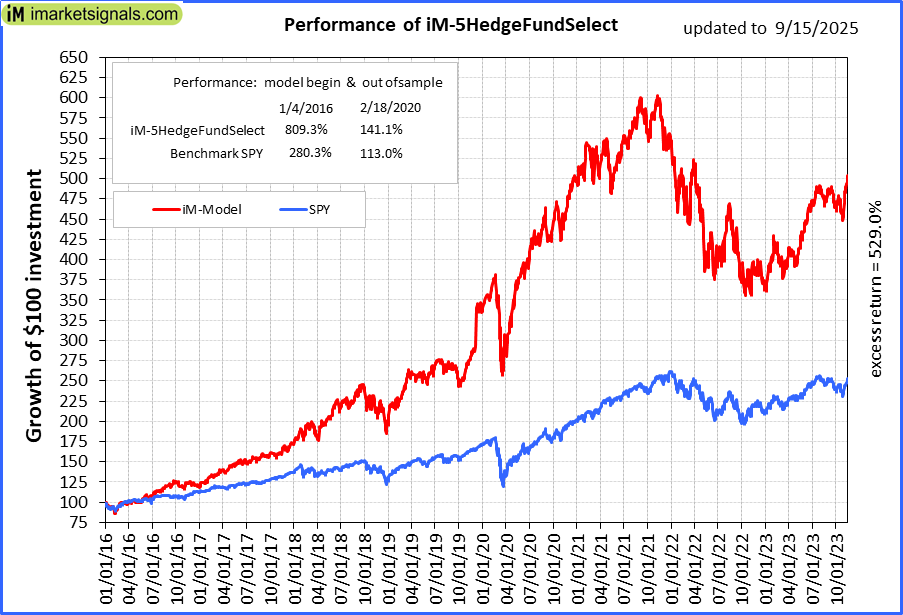 |
iM-5HedgeFundSelect: Since inception, on 1/5/2016, the model gained 809.27% while the benchmark SPY gained 280.32% over the same period. Over the previous week the market value of iM-5HedgeFundSelect gained 2.56% at a time when SPY gained 1.86%. A starting capital of $25,000 at inception on 1/5/2016 would have grown to $227,319 which includes $3,057 cash and excludes $2,817 spent on fees and slippage. |
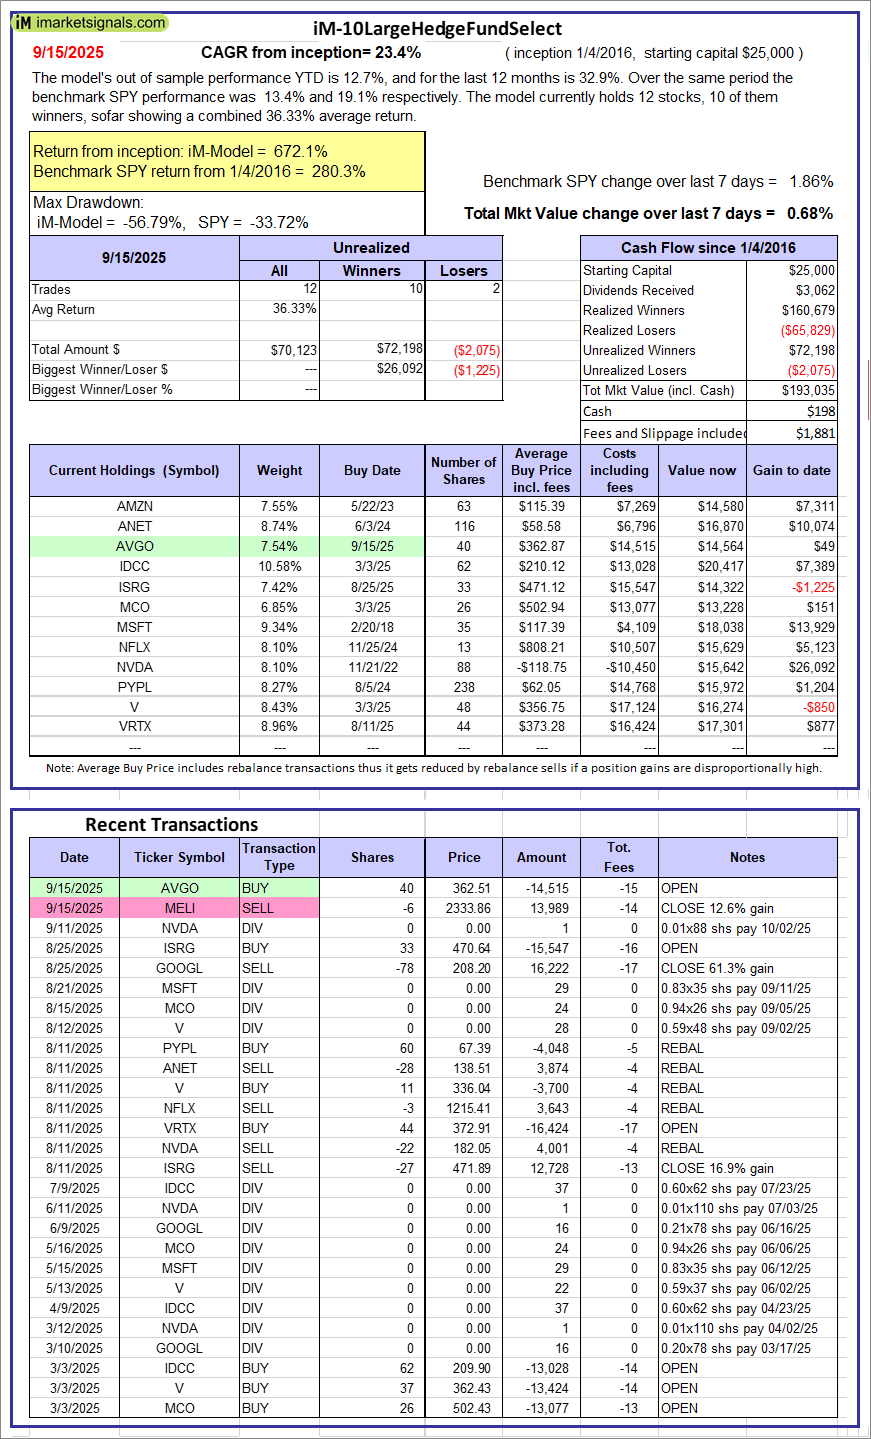 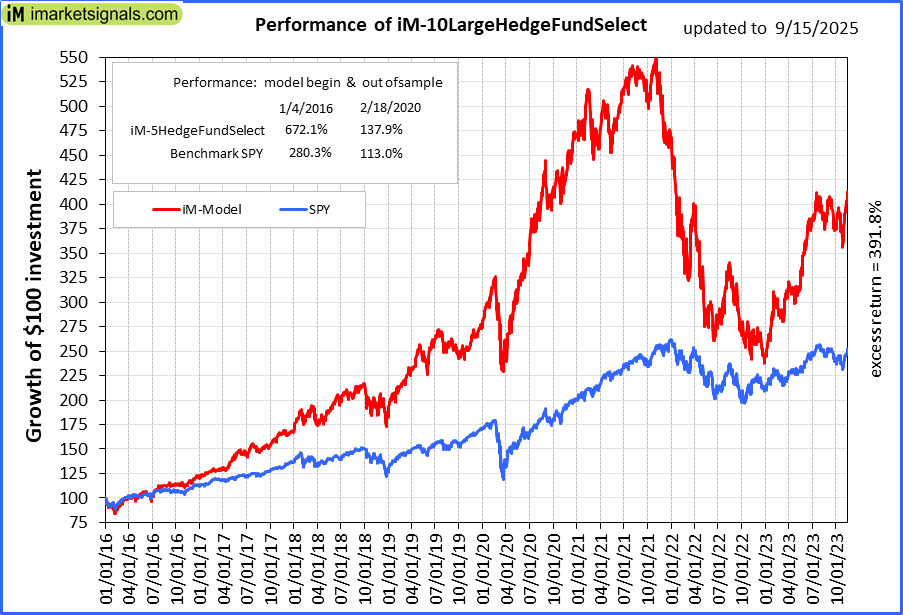 |
iM-10LargeHedgeFundSelect: Since inception, on 1/5/2016, the model gained 672.14% while the benchmark SPY gained 280.32% over the same period. Over the previous week the market value of iM-10LargeHedgeFundSelect gained 0.68% at a time when SPY gained 1.86%. A starting capital of $25,000 at inception on 1/5/2016 would have grown to $193,035 which includes $198 cash and excludes $1,881 spent on fees and slippage. |
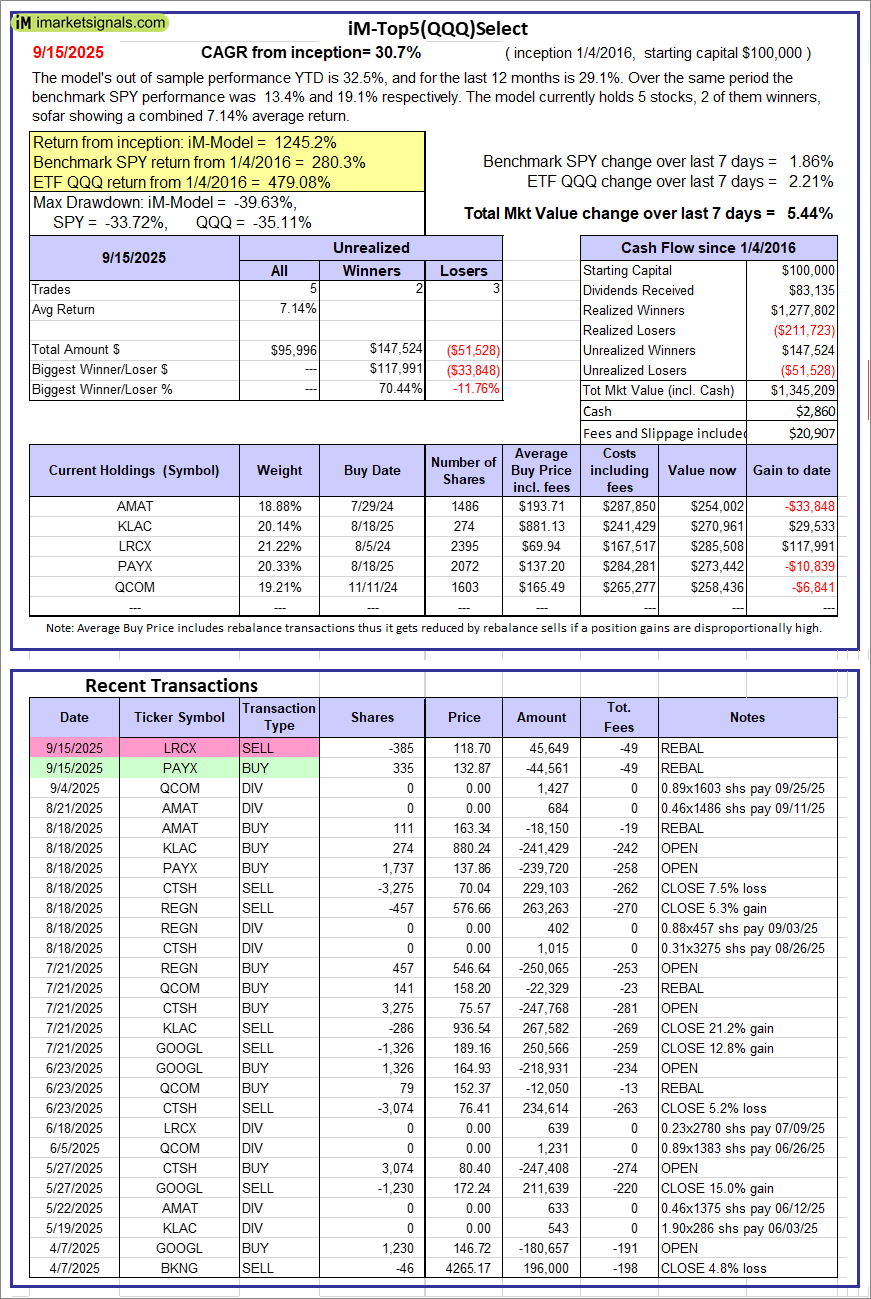 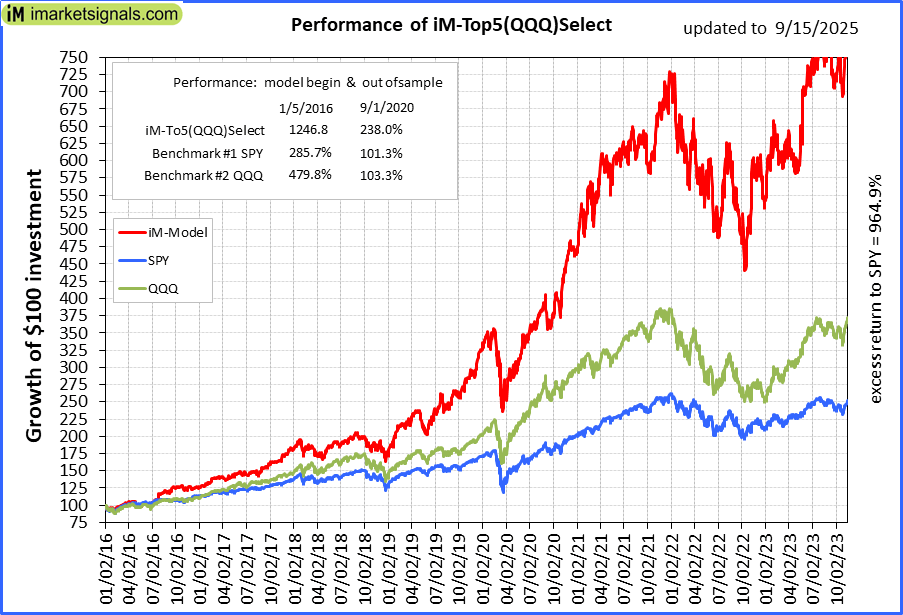 |
iM-Top5(QQQ)Select: Since inception, on 1/5/2016, the model gained 1245.21% while the benchmark SPY gained 280.32% over the same period. Over the previous week the market value of iM-Top5(QQQ)Select gained 5.44% at a time when SPY gained 1.86%. A starting capital of $100,000 at inception on 1/5/2016 would have grown to $1,345,209 which includes $2,860 cash and excludes $20,907 spent on fees and slippage. |
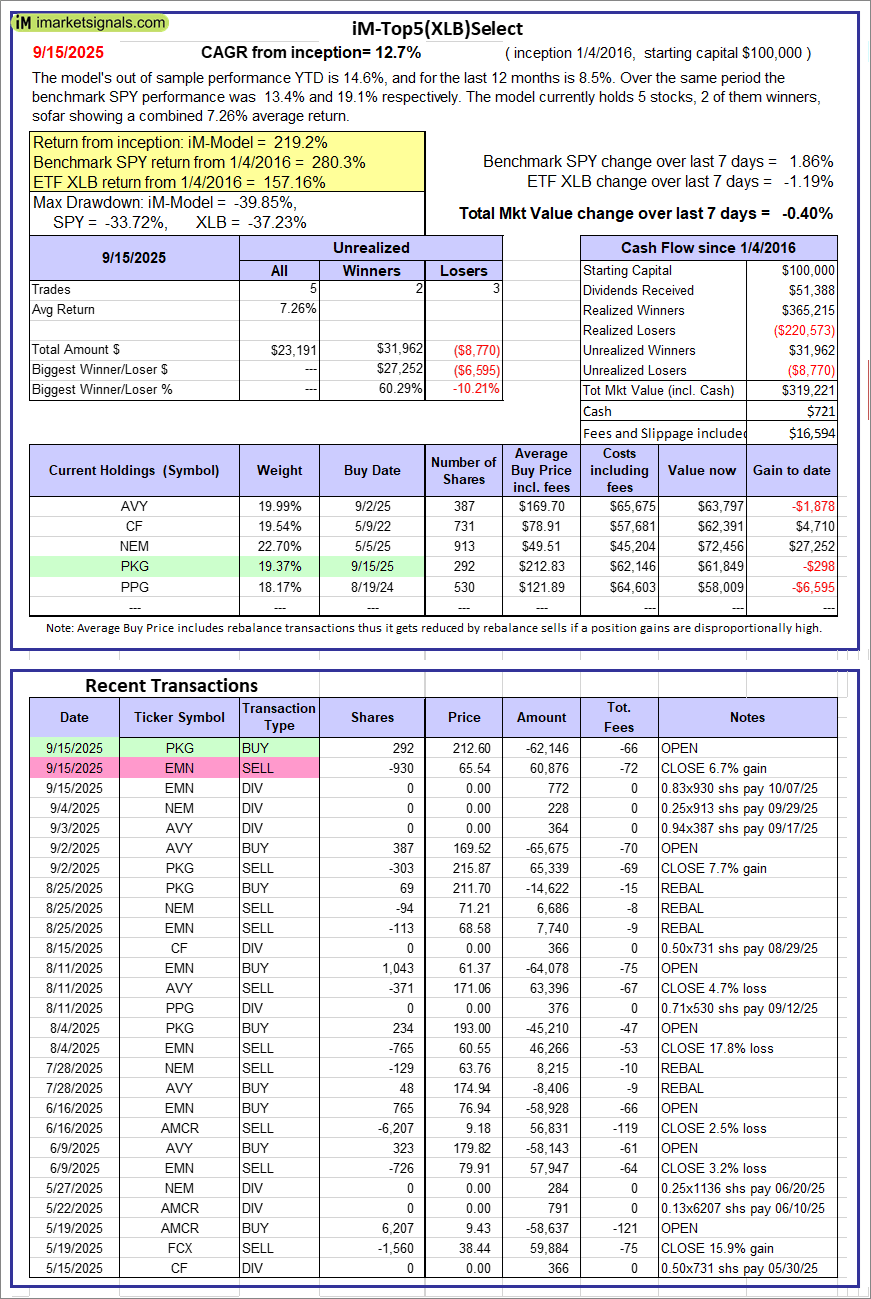 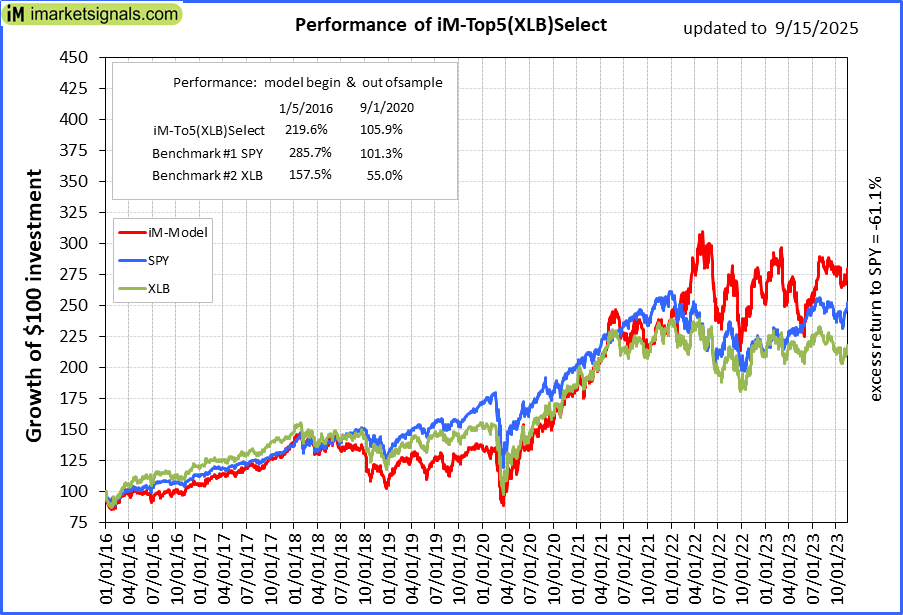 |
iM-Top5(XLB)Select: Since inception, on 1/5/2016, the model gained 219.22% while the benchmark SPY gained 280.32% over the same period. Over the previous week the market value of iM-Top5(XLB)Select gained -0.40% at a time when SPY gained 1.86%. A starting capital of $100,000 at inception on 1/5/2016 would have grown to $319,221 which includes $721 cash and excludes $16,594 spent on fees and slippage. |
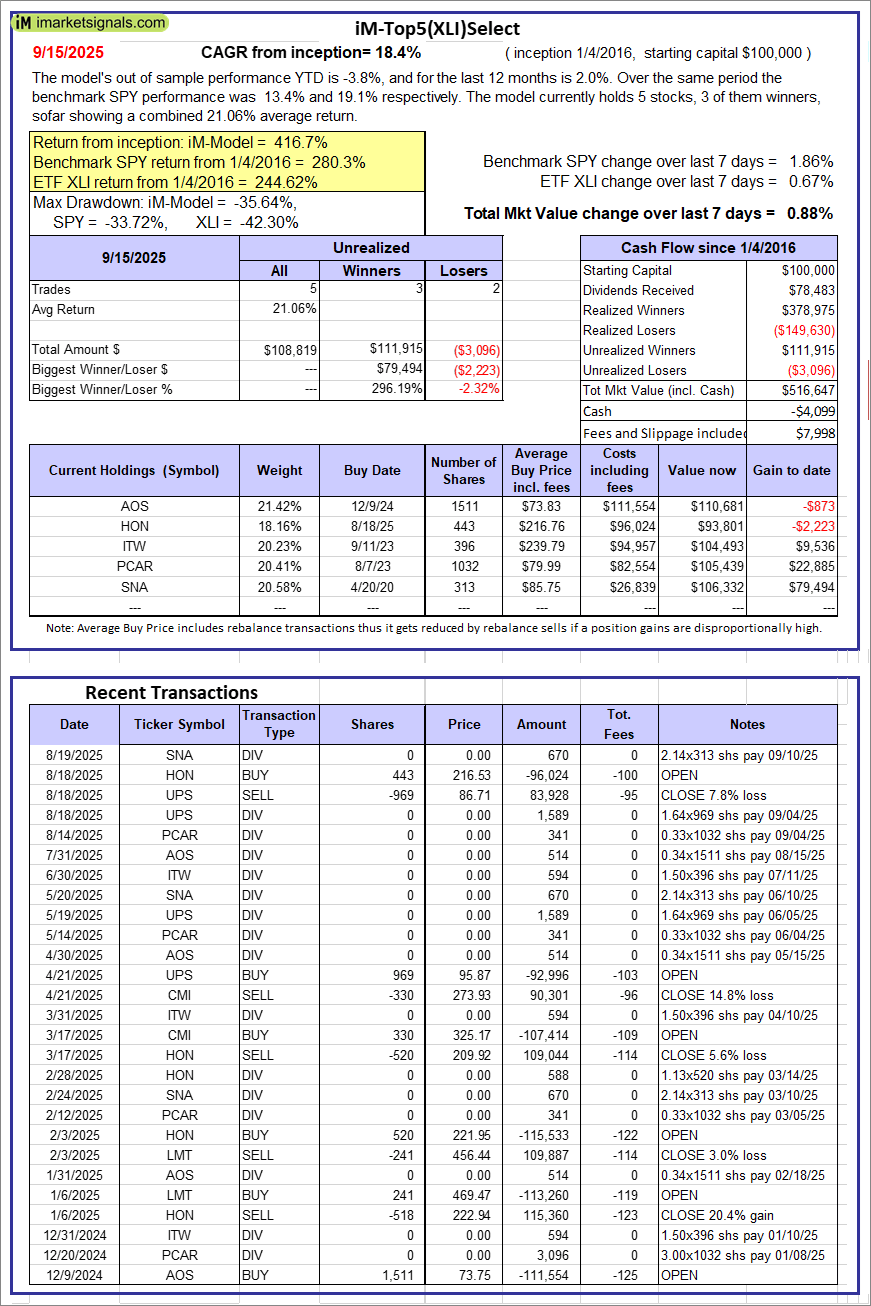 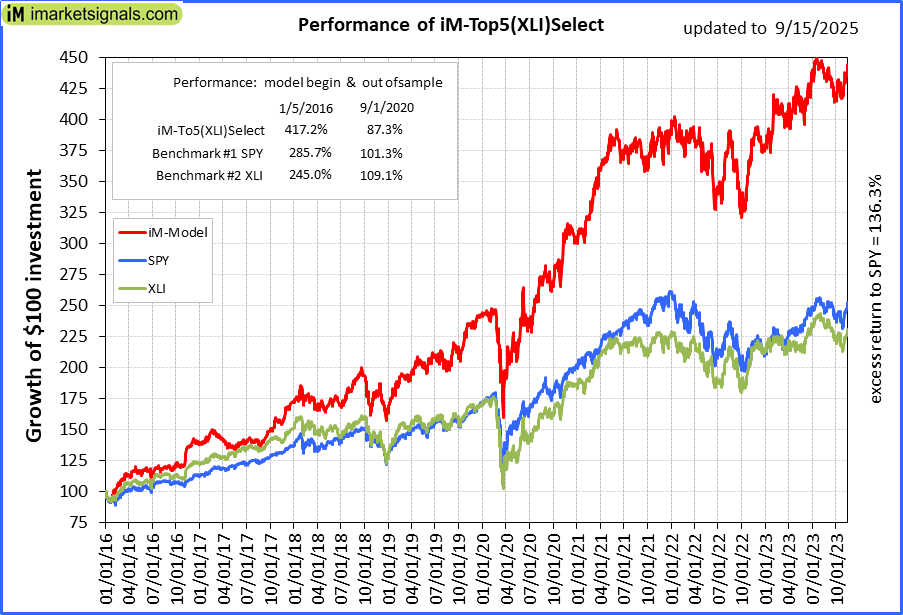 |
iM-Top5(XLI)Select: Since inception, on 1/5/2016, the model gained 416.65% while the benchmark SPY gained 280.32% over the same period. Over the previous week the market value of iM-Top5(XLI)Select gained 0.88% at a time when SPY gained 1.86%. A starting capital of $100,000 at inception on 1/5/2016 would have grown to $516,647 which includes -$4,099 cash and excludes $7,998 spent on fees and slippage. |
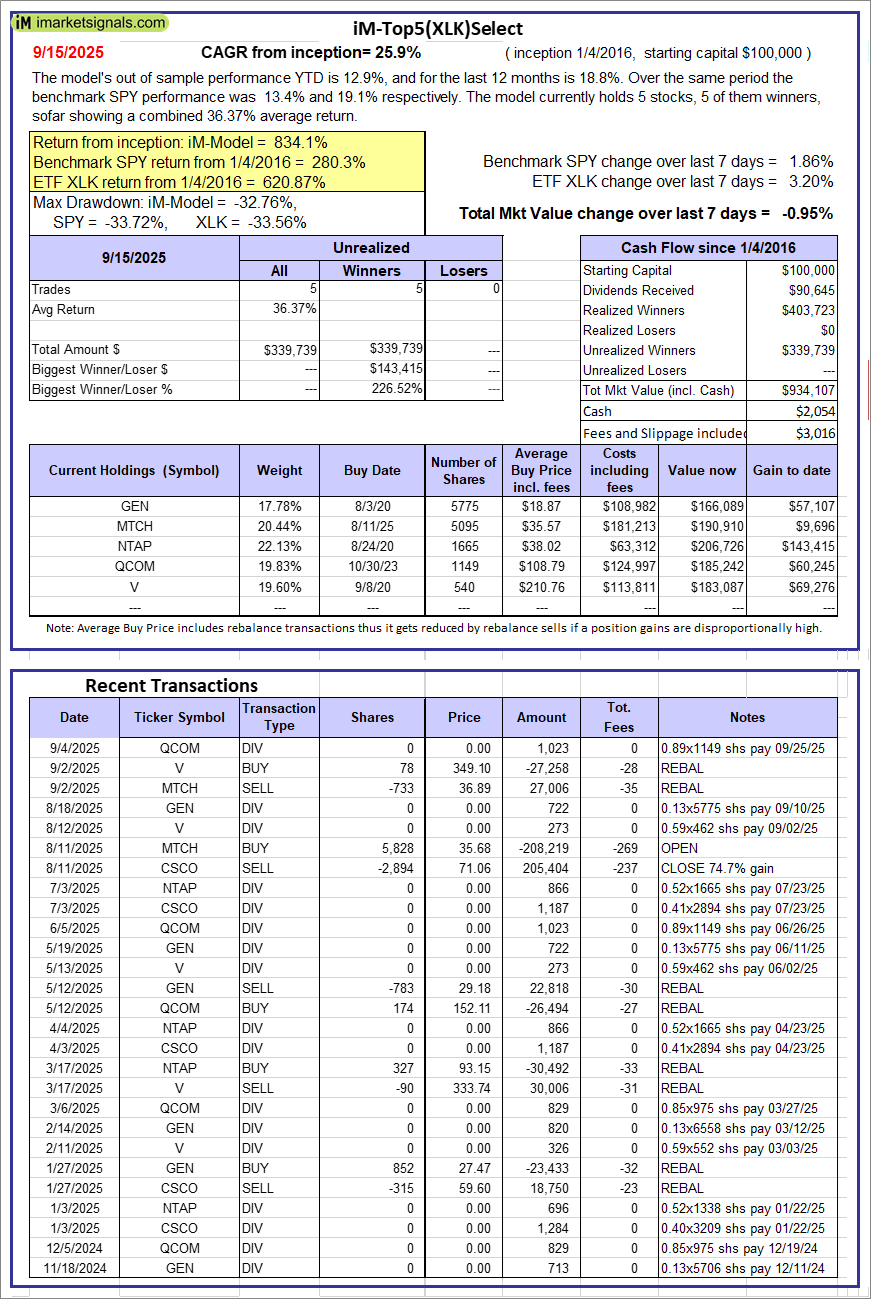 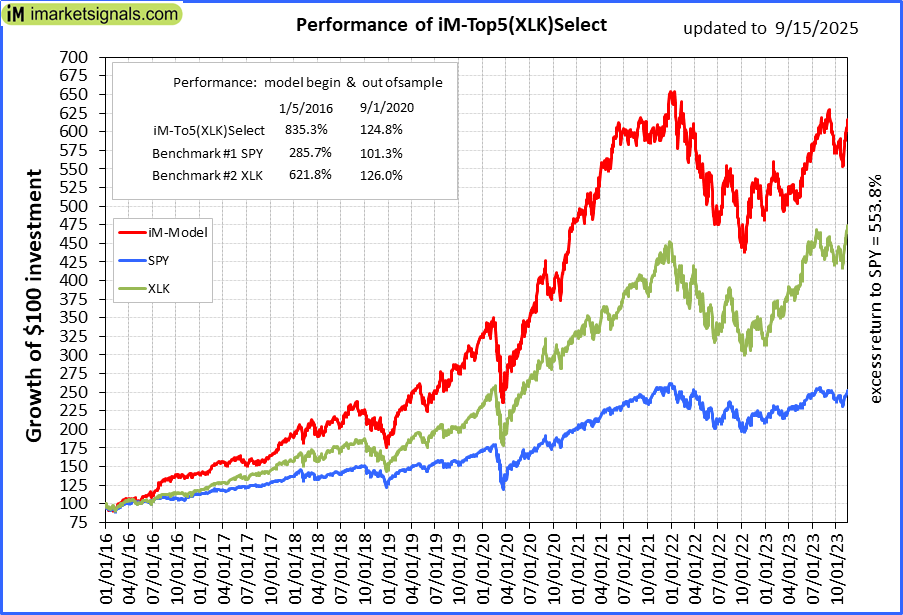 |
iM-Top5(XLK)Select: Since inception, on 1/5/2016, the model gained 834.11% while the benchmark SPY gained 280.32% over the same period. Over the previous week the market value of iM-Top5(XLK)Select gained -0.95% at a time when SPY gained 1.86%. A starting capital of $100,000 at inception on 1/5/2016 would have grown to $934,107 which includes $2,054 cash and excludes $3,016 spent on fees and slippage. |
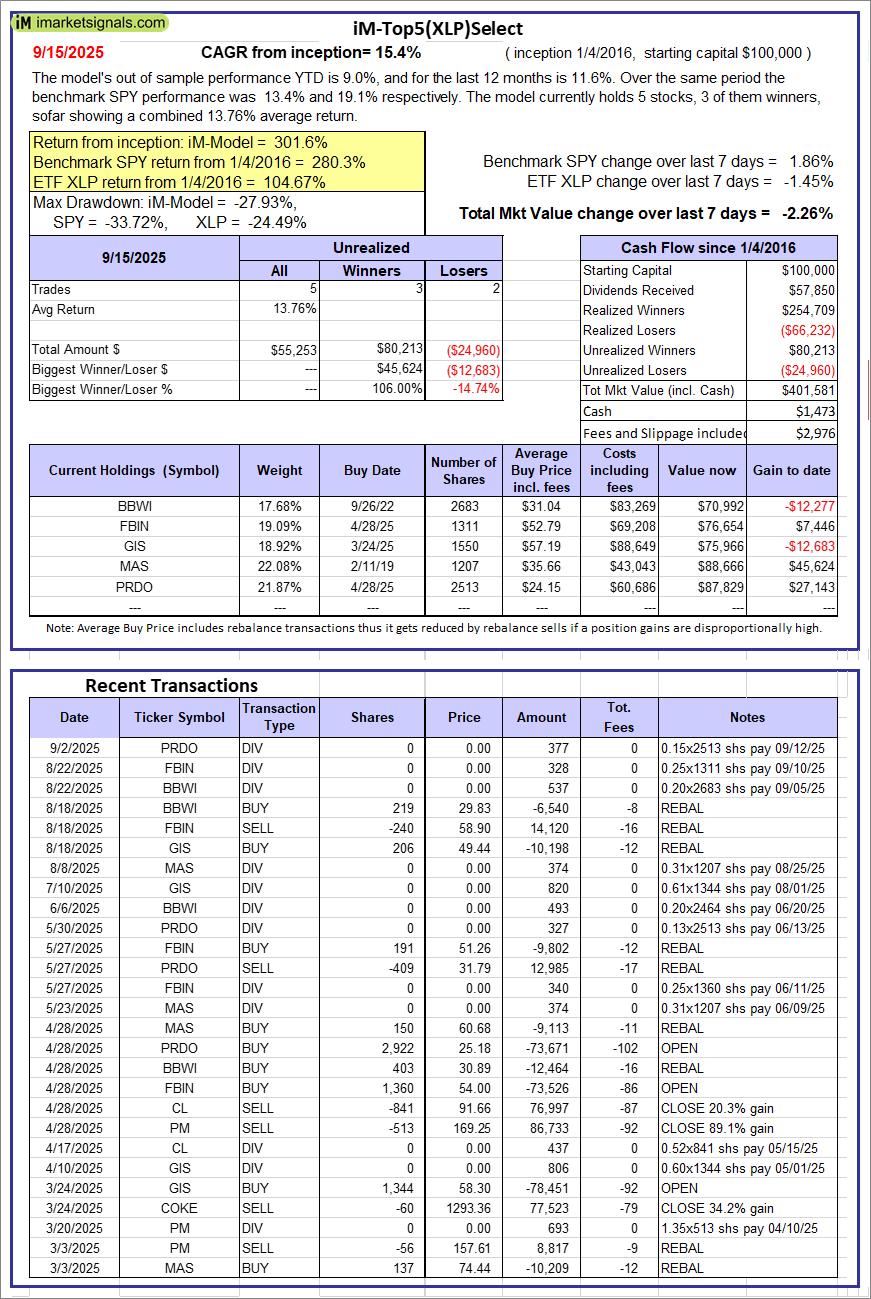 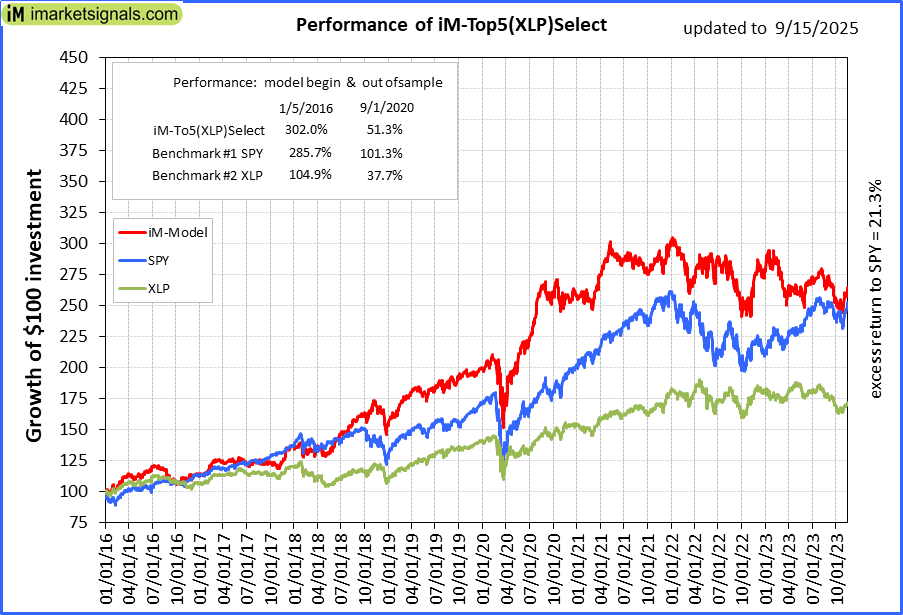 |
iM-Top5(XLP)Select: Since inception, on 1/5/2016, the model gained 301.58% while the benchmark SPY gained 280.32% over the same period. Over the previous week the market value of iM-Top5(XLP)Select gained -2.26% at a time when SPY gained 1.86%. A starting capital of $100,000 at inception on 1/5/2016 would have grown to $401,581 which includes $1,473 cash and excludes $2,976 spent on fees and slippage. |
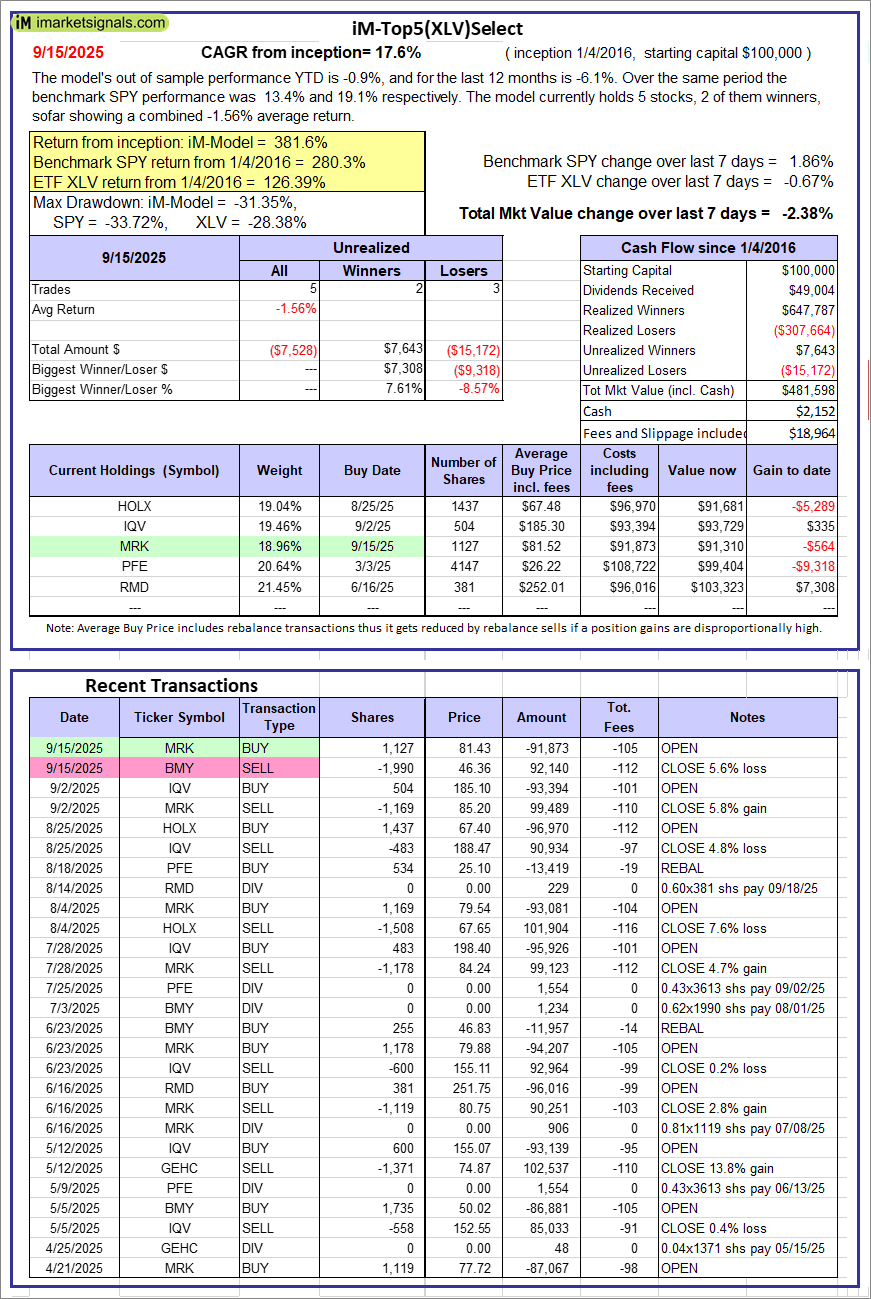 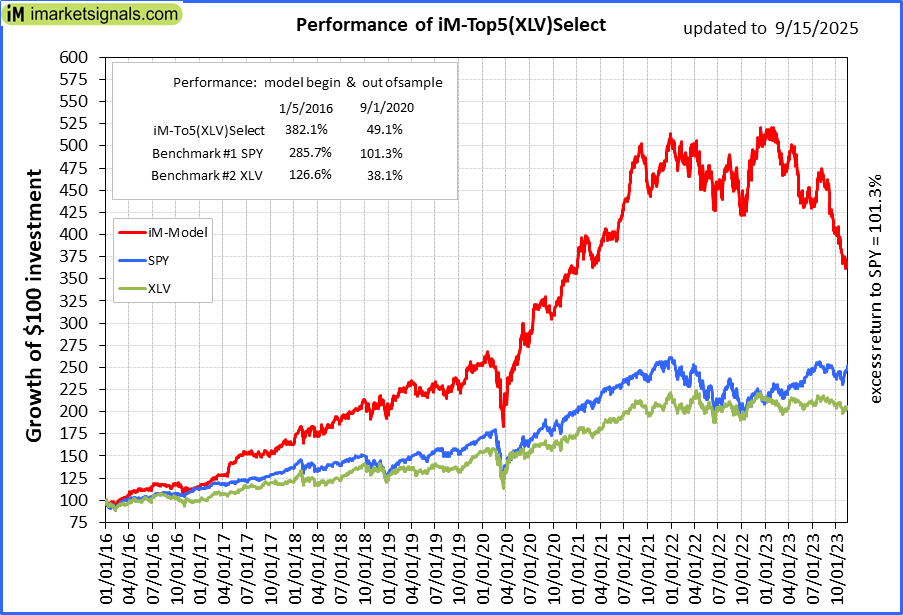 |
iM-Top5(XLV)Select: Since inception, on 1/5/2016, the model gained 381.60% while the benchmark SPY gained 280.32% over the same period. Over the previous week the market value of iM-Top5(XLV)Select gained -2.38% at a time when SPY gained 1.86%. A starting capital of $100,000 at inception on 1/5/2016 would have grown to $481,598 which includes $2,152 cash and excludes $18,964 spent on fees and slippage. |
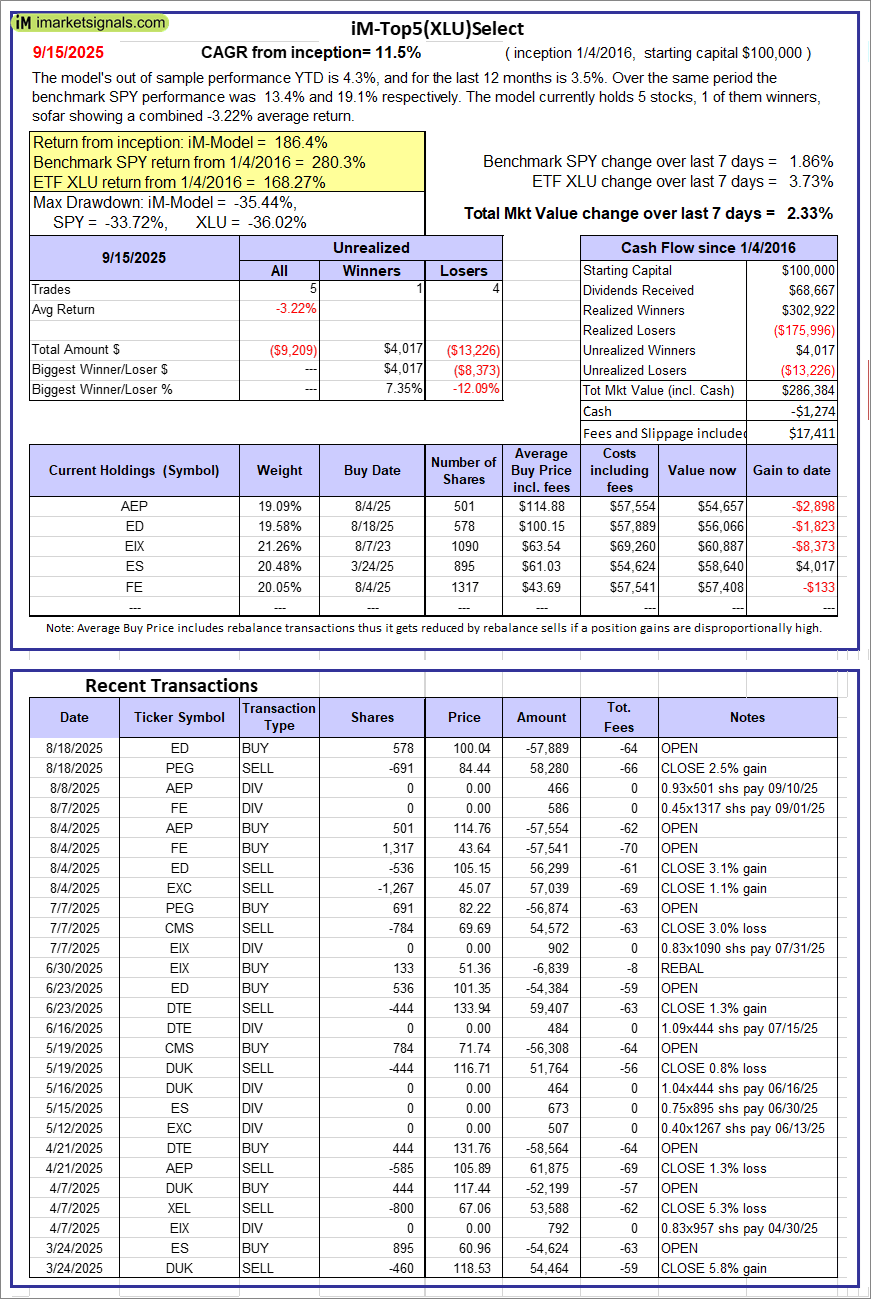 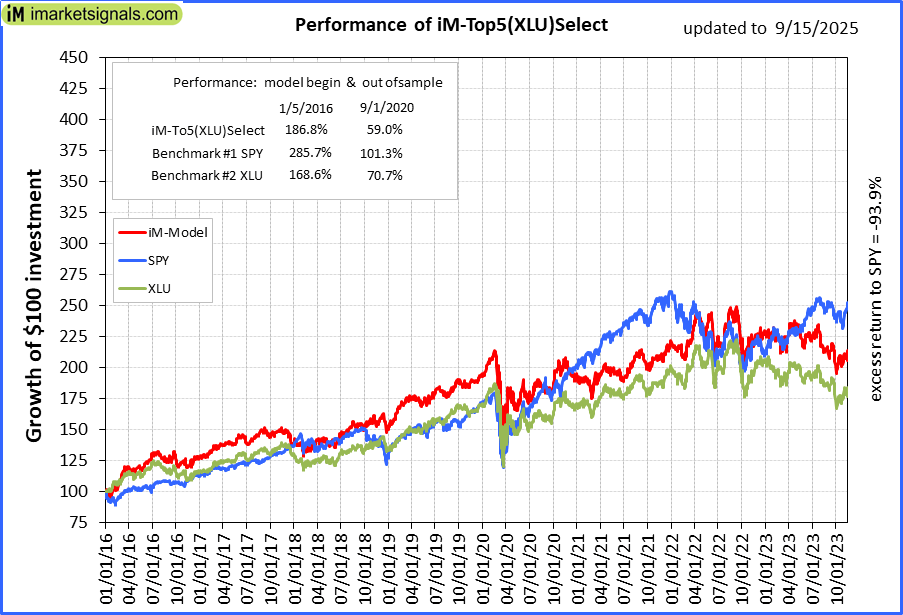 |
iM-Top5(XLU)Select: Since inception, on 1/5/2016, the model gained 186.38% while the benchmark SPY gained 280.32% over the same period. Over the previous week the market value of iM-Top5(XLU)Select gained 2.33% at a time when SPY gained 1.86%. A starting capital of $100,000 at inception on 1/5/2016 would have grown to $286,384 which includes -$1,274 cash and excludes $17,411 spent on fees and slippage. |
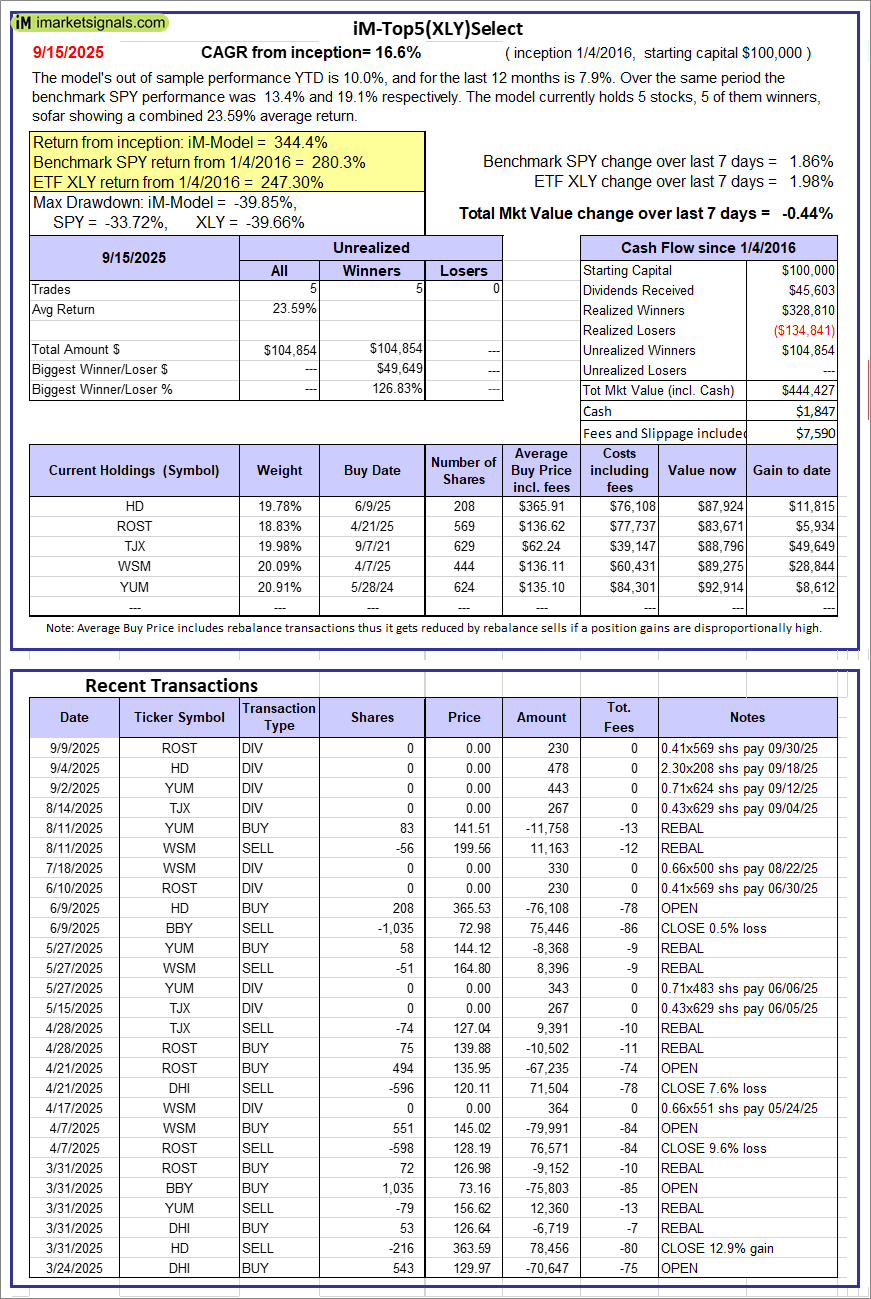 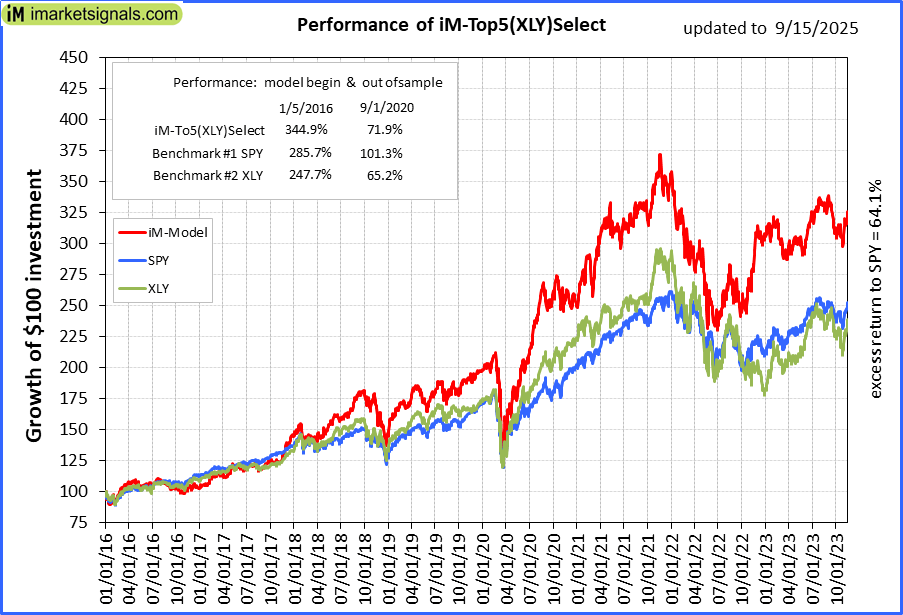 |
iM-Top5(XLY)Select: Since inception, on 1/5/2016, the model gained 344.43% while the benchmark SPY gained 280.32% over the same period. Over the previous week the market value of iM-Top5(XLY)Select gained -0.44% at a time when SPY gained 1.86%. A starting capital of $100,000 at inception on 1/5/2016 would have grown to $444,427 which includes $1,847 cash and excludes $7,590 spent on fees and slippage. |
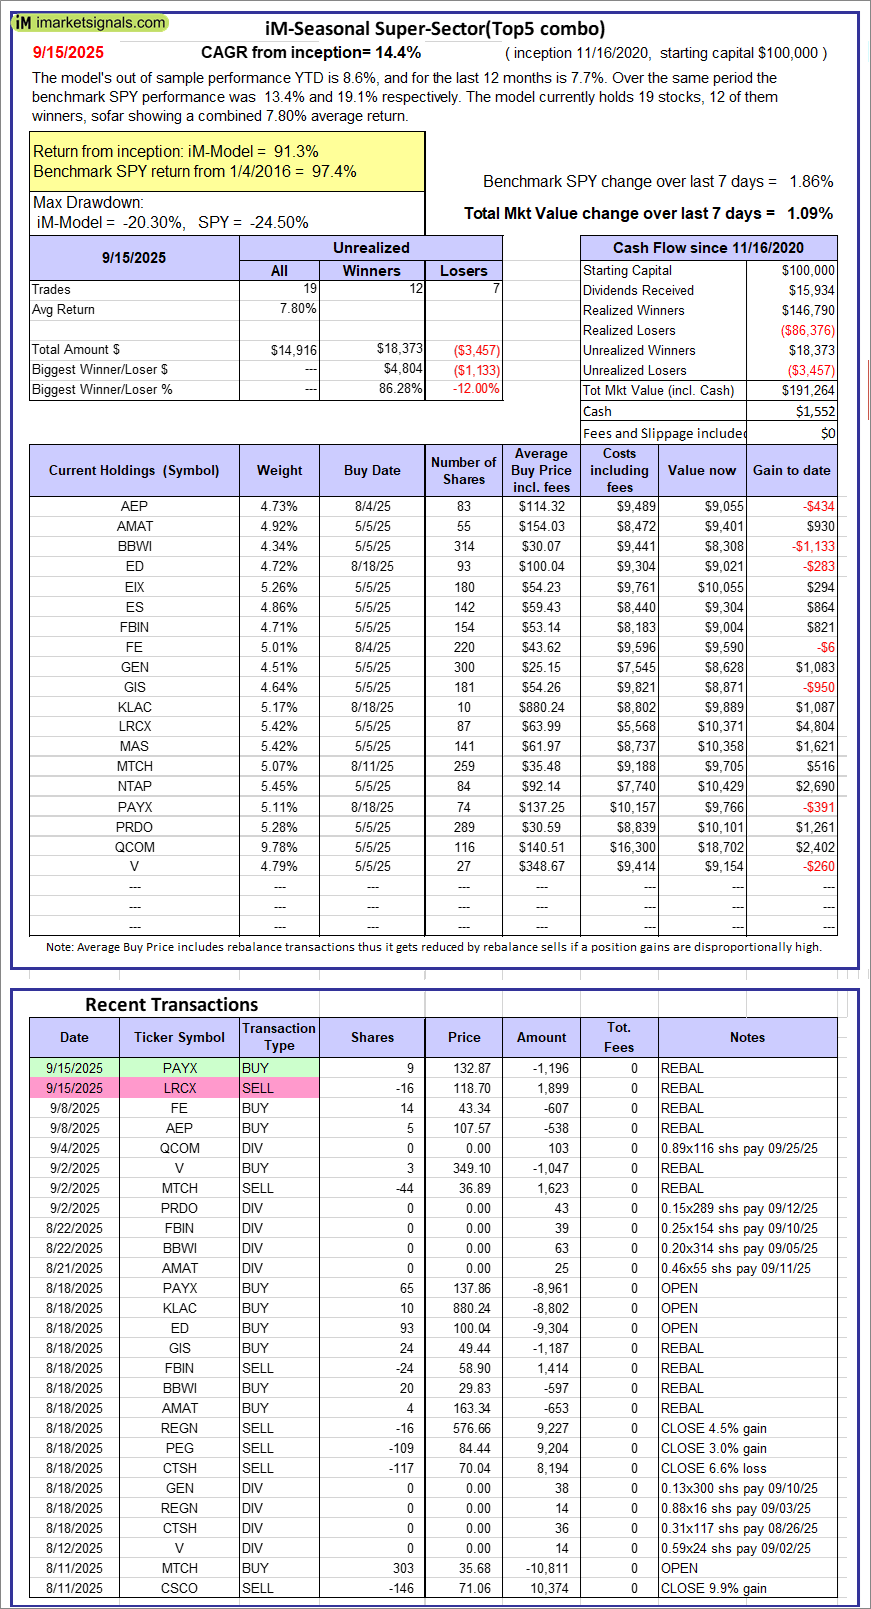 |
iM-Seasonal Super-Sectors (Top5 combo) : Since inception, on 11/17/2020, the model gained 91.26% while the benchmark SPY gained 97.42% over the same period. Over the previous week the market value of iM-Seasonal Super-Sectors (Top5 combo) gained 1.09% at a time when SPY gained 1.86%. A starting capital of $100,000 at inception on 11/17/2020 would have grown to $191,264 which includes $1,552 cash and excludes $00 spent on fees and slippage. |
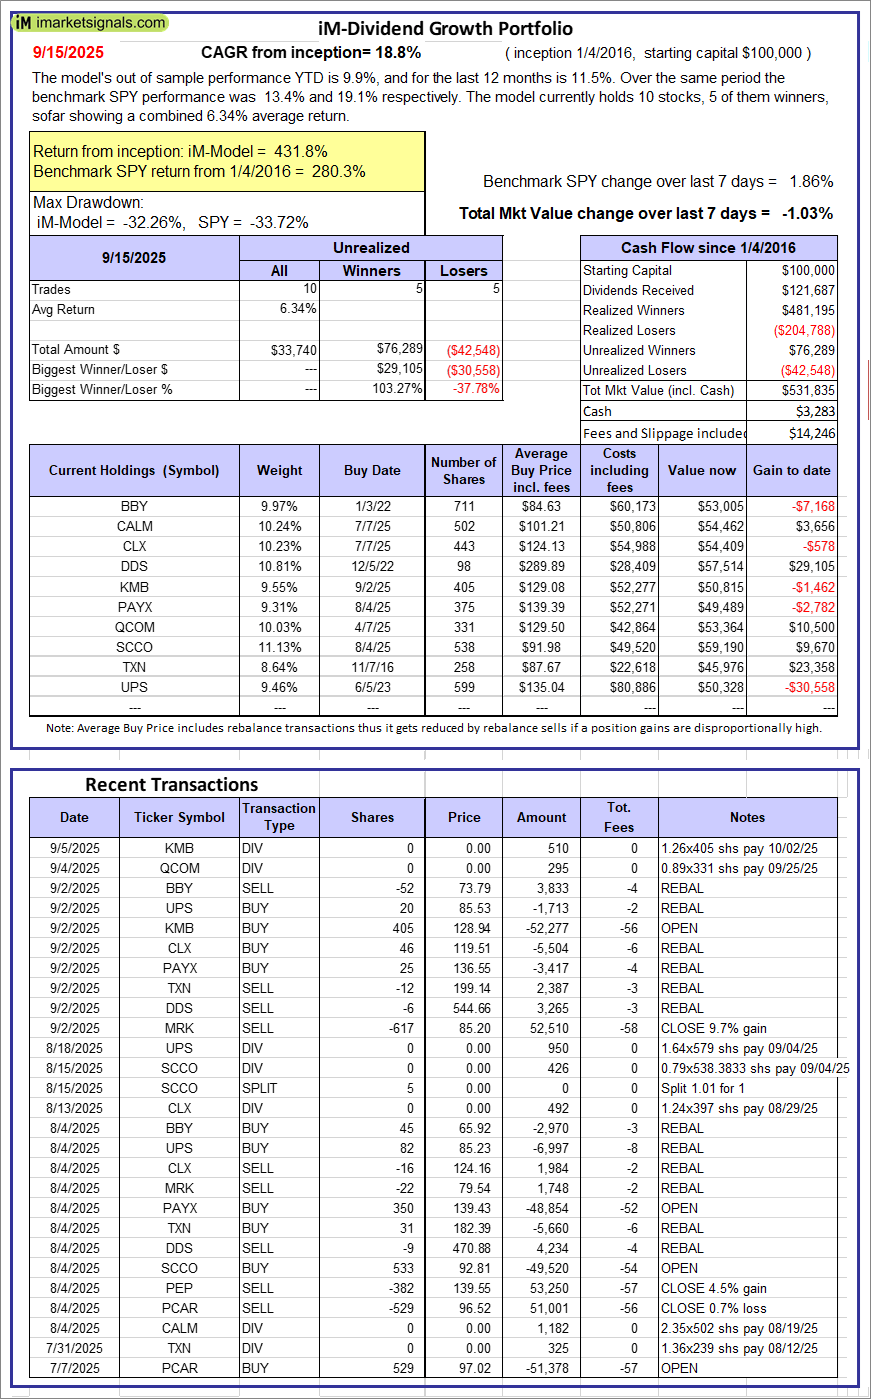 |
iM-Dividend Growth Portfolio: The model’s out of sample performance YTD is 9.9%, and for the last 12 months is 11.5%. Over the same period the benchmark SPY performance was 13.4% and 19.1% respectively. Over the previous week the market value of the iM-Dividend Growth Portfolio gained -1.03% at a time when SPY gained 1.86%. A starting capital of $100,000 at inception on 6/30/2016 would have grown to $531,835 which includes $3,283 cash and excludes $14,246 spent on fees and slippage. |
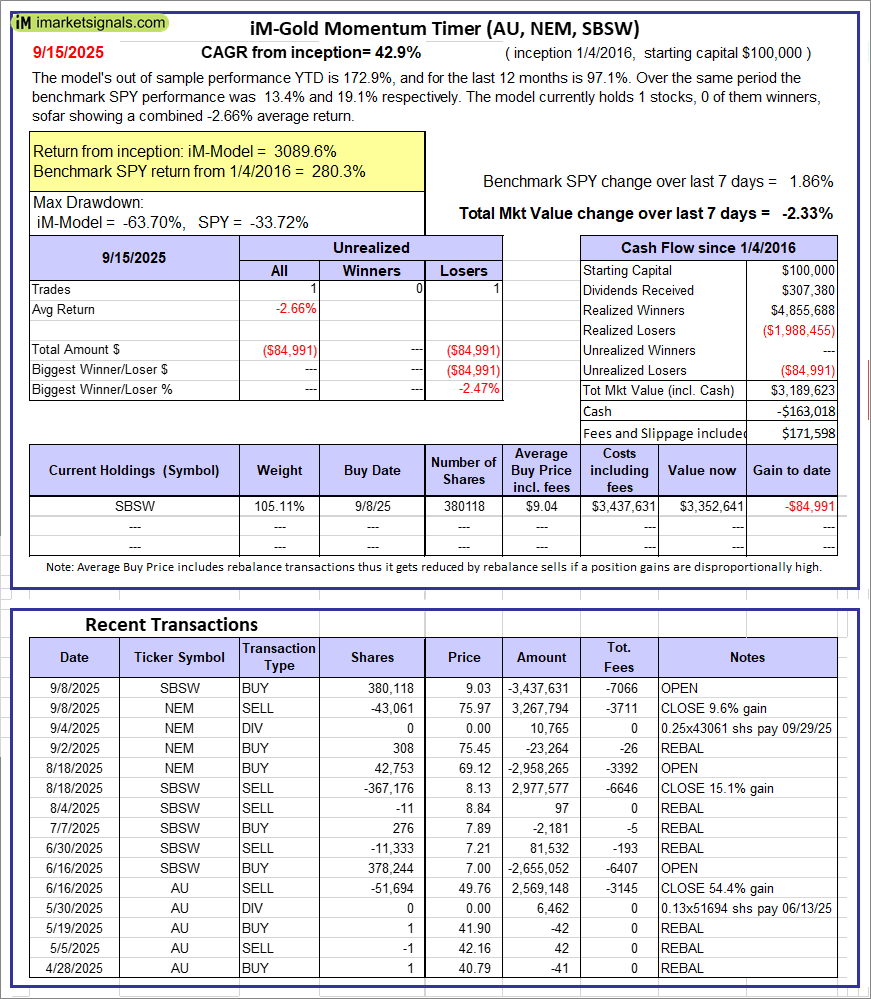 |
iM-Gold Momentum Timer (AU, NEM, SBSW): The model’s out of sample performance YTD is 172.9%, and for the last 12 months is 97.1%. Over the same period the benchmark SPY performance was 13.4% and 19.1% respectively. Over the previous week the market value of iM-Gold Momentum Timer (AU, NEM, SBSW) gained -2.33% at a time when SPY gained 1.86%. A starting capital of $100,000 at inception on 6/30/2016 would have grown to -$163,018 which includes $171,598 cash and excludes Gain to date spent on fees and slippage. |
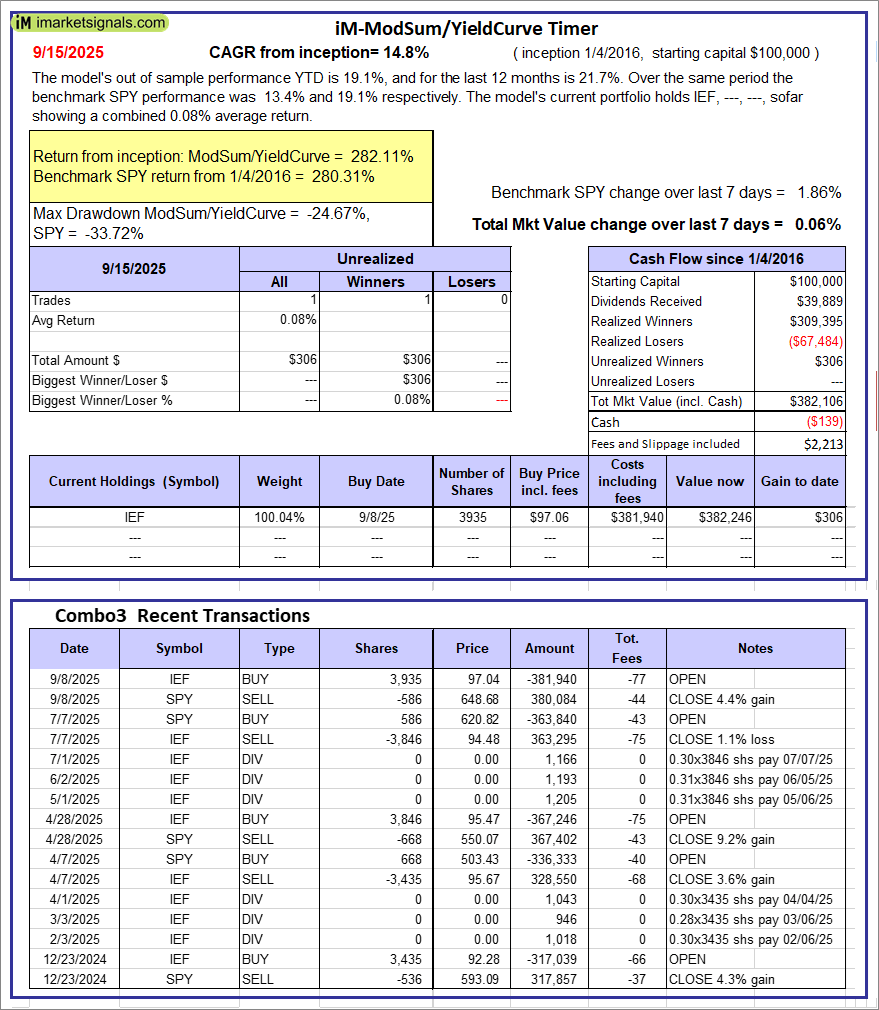 |
iM-ModSum/YieldCurve Timer: The model’s out of sample performance YTD is 19.1%, and for the last 12 months is 21.7%. Over the same period the benchmark SPY performance was 13.4% and 19.1% respectively. Over the previous week the market value of iM-PortSum/YieldCurve Timer gained 0.06% at a time when SPY gained 1.86%. A starting capital of $100,000 at inception on 1/1/2016 would have grown to $382,106 which includes -$139 cash and excludes $2,213 spent on fees and slippage. |
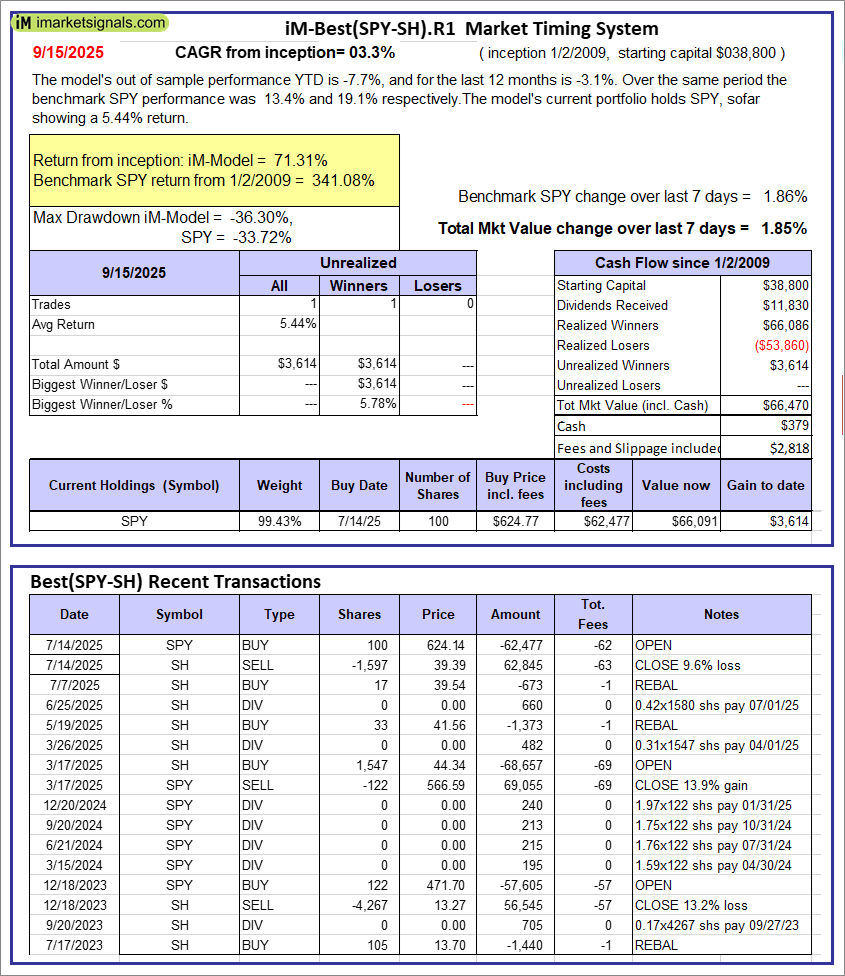 |
iM-Best(SPY-SH).R1: The model’s out of sample performance YTD is -7.7%, and for the last 12 months is -3.1%. Over the same period the benchmark SPY performance was 13.4% and 19.1% respectively. Over the previous week the market value of Best(SPY-SH) gained 1.85% at a time when SPY gained 1.86%. A starting capital of $100,000 at inception on 1/2/2009 would have grown to $66,470 which includes $379 cash and excludes $2,818 spent on fees and slippage. |
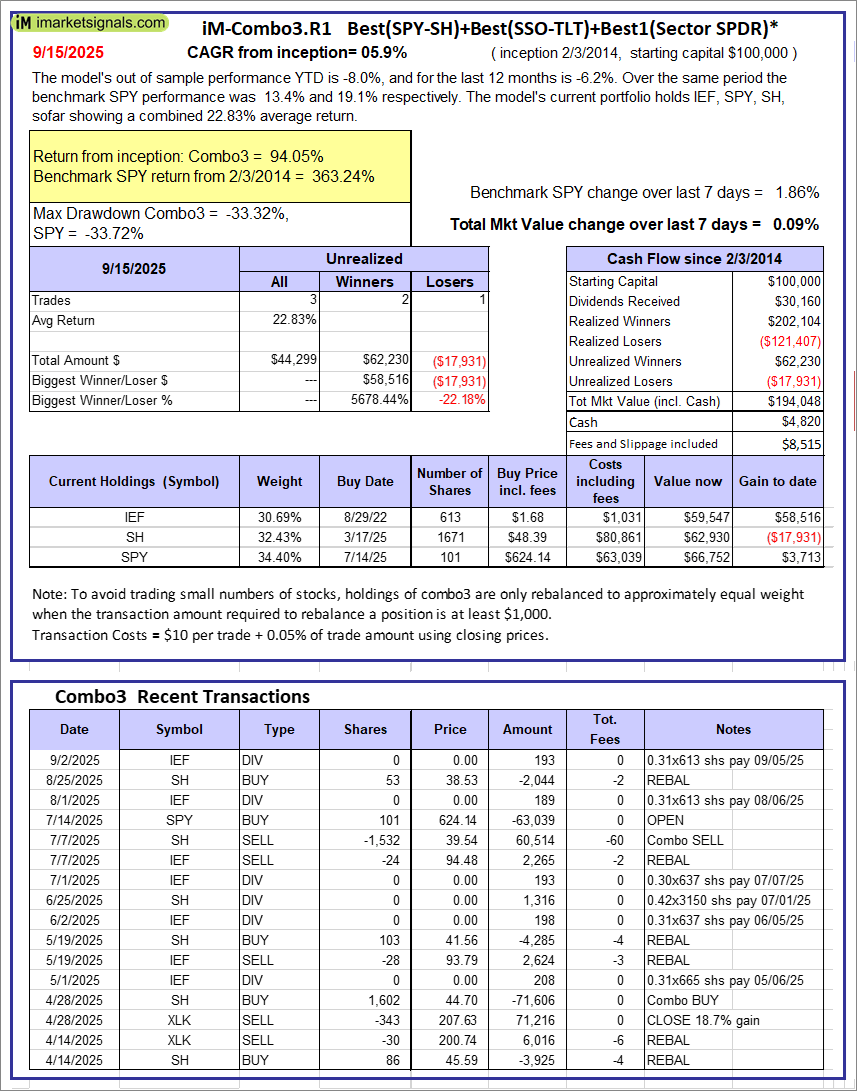 |
iM-Combo3.R1: The model’s out of sample performance YTD is -8.0%, and for the last 12 months is -6.2%. Over the same period the benchmark SPY performance was 13.4% and 19.1% respectively. Over the previous week the market value of iM-Combo3.R1 gained 0.09% at a time when SPY gained 1.86%. A starting capital of $100,000 at inception on 2/3/2014 would have grown to $194,048 which includes $4,820 cash and excludes $8,515 spent on fees and slippage. |
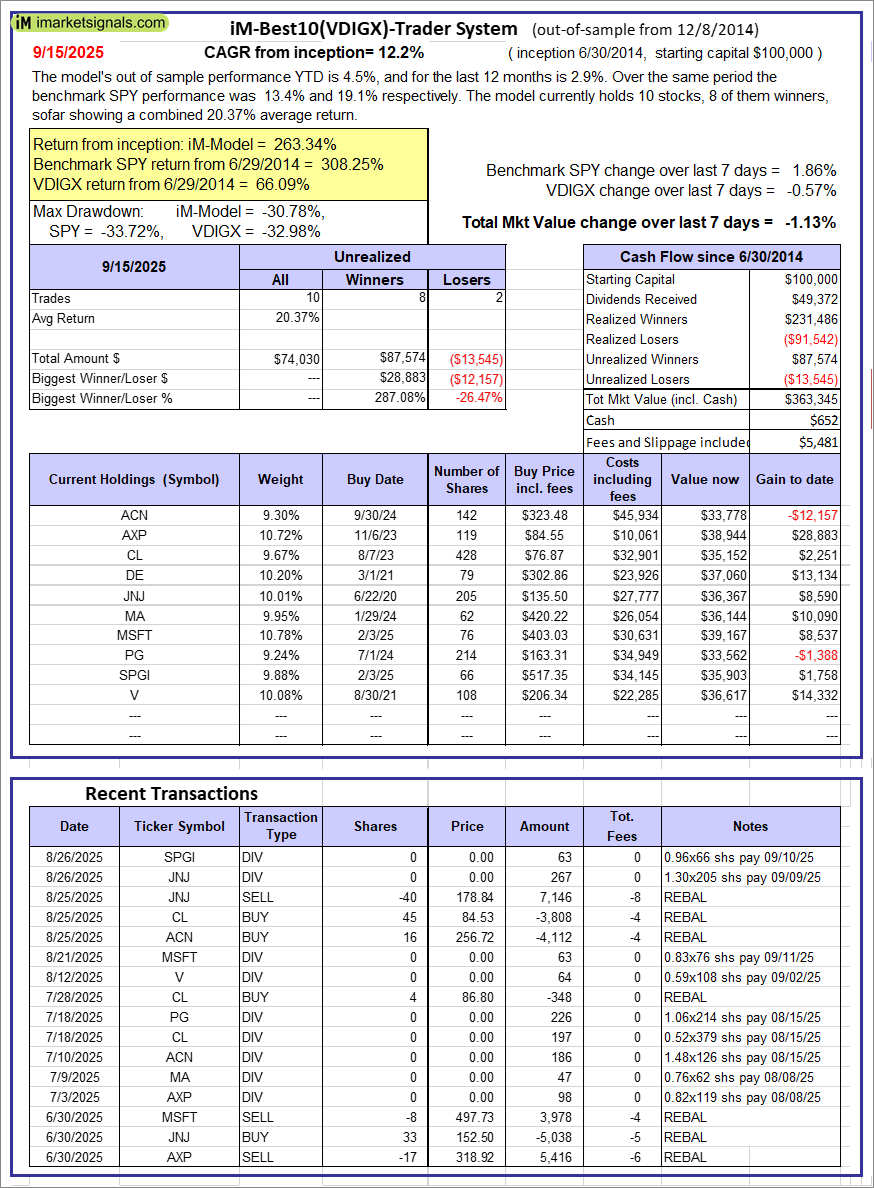 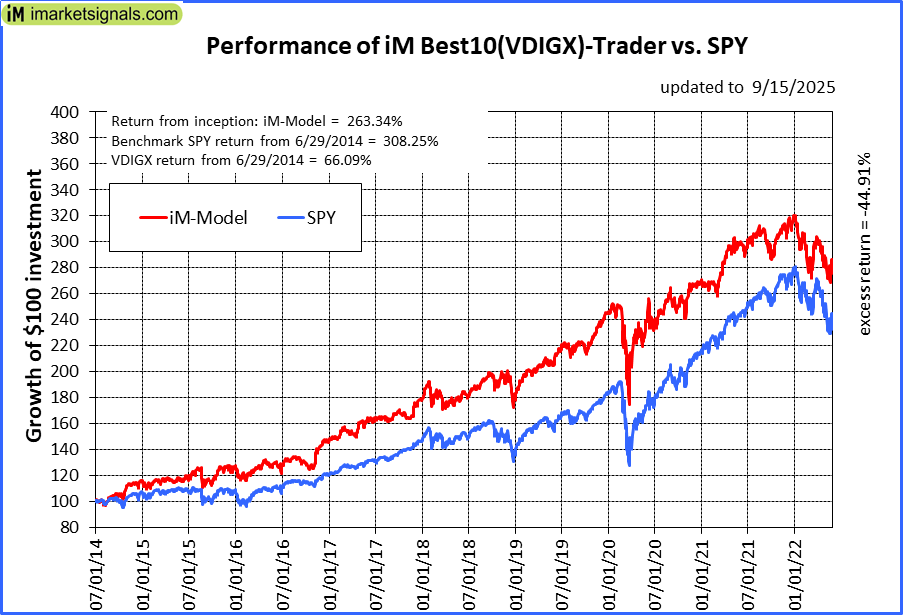 |
iM-Best10(VDIGX)-Trader: The model’s out of sample performance YTD is 4.5%, and for the last 12 months is 2.9%. Over the same period the benchmark SPY performance was 13.4% and 19.1% respectively. Since inception, on 7/1/2014, the model gained 263.34% while the benchmark SPY gained 308.25% and VDIGX gained 66.09% over the same period. Over the previous week the market value of iM-Best10(VDIGX) gained -1.13% at a time when SPY gained 1.86%. A starting capital of $100,000 at inception on 7/1/2014 would have grown to $363,345 which includes $652 cash and excludes $5,481 spent on fees and slippage. |
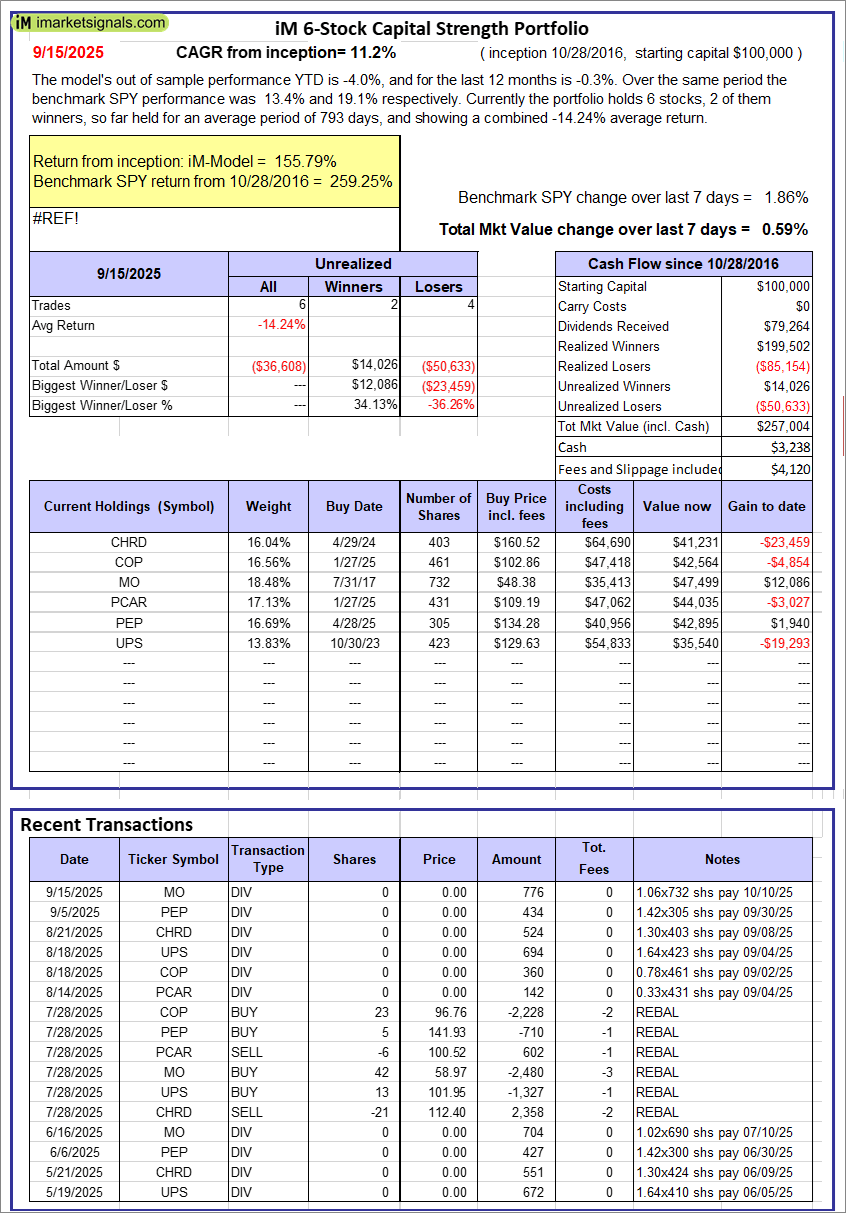 |
iM 6-Stock Capital Strength Portfolio: The model’s out of sample performance YTD is -4.0%, and for the last 12 months is -0.3%. Over the same period the benchmark SPY performance was 13.4% and 19.1% respectively. Over the previous week the market value of the iM 6-Stock Capital Strength Portfolio gained 0.59% at a time when SPY gained 1.86%. A starting capital of $100,000 at inception on 10/28/2016 would have grown to $257,004 which includes $3,238 cash and excludes $4,120 spent on fees and slippage. |
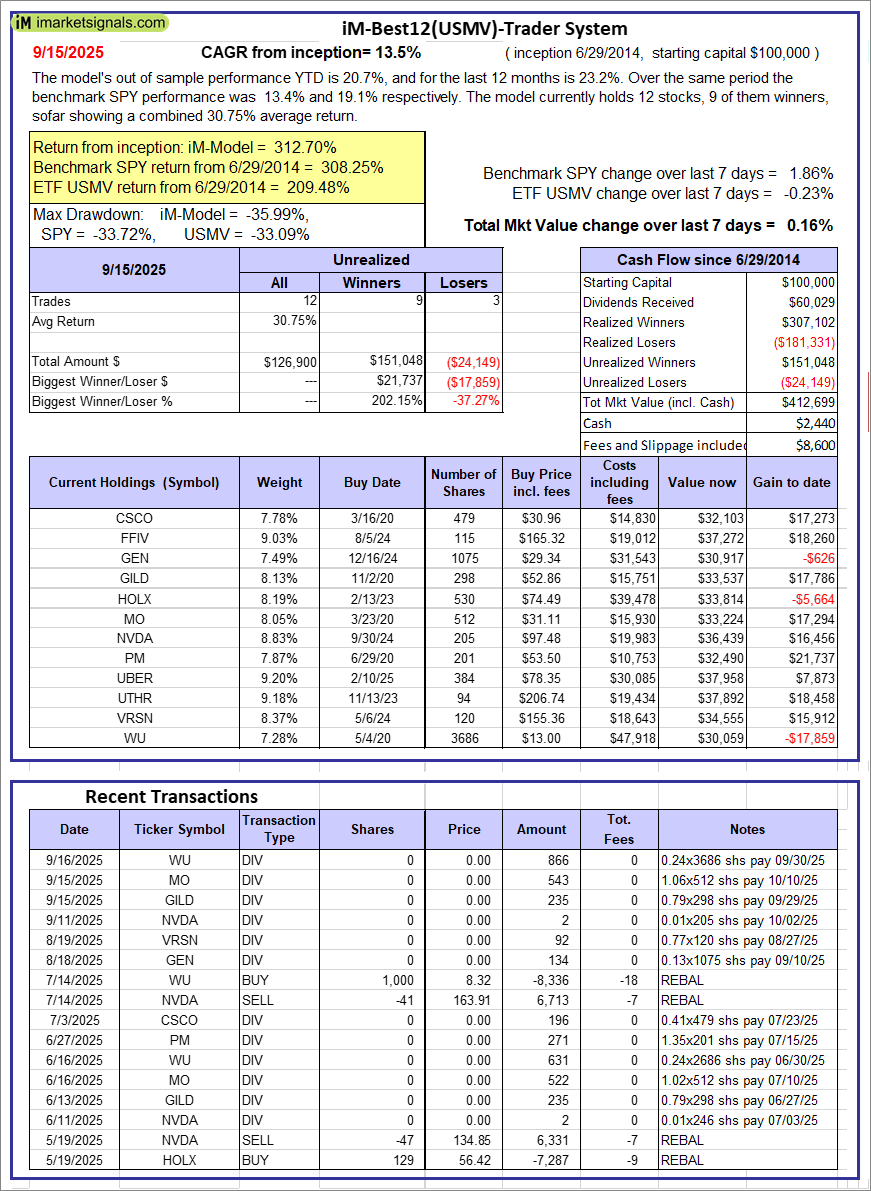 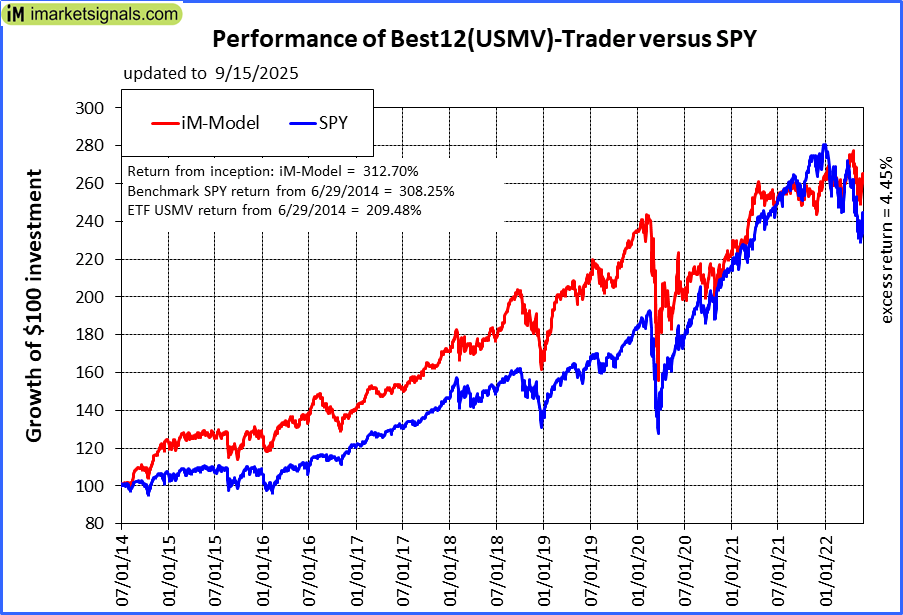 |
iM-Best12(USMV)-Trader: The model’s out of sample performance YTD is 20.7%, and for the last 12 months is 23.2%. Over the same period the benchmark SPY performance was 13.4% and 19.1% respectively. Since inception, on 6/30/2014, the model gained 312.70% while the benchmark SPY gained 308.25% and the ETF USMV gained 209.48% over the same period. Over the previous week the market value of iM-Best12(USMV)-Trader gained 0.16% at a time when SPY gained 1.86%. A starting capital of $100,000 at inception on 6/30/2014 would have grown to $412,699 which includes $2,440 cash and excludes $8,600 spent on fees and slippage. |
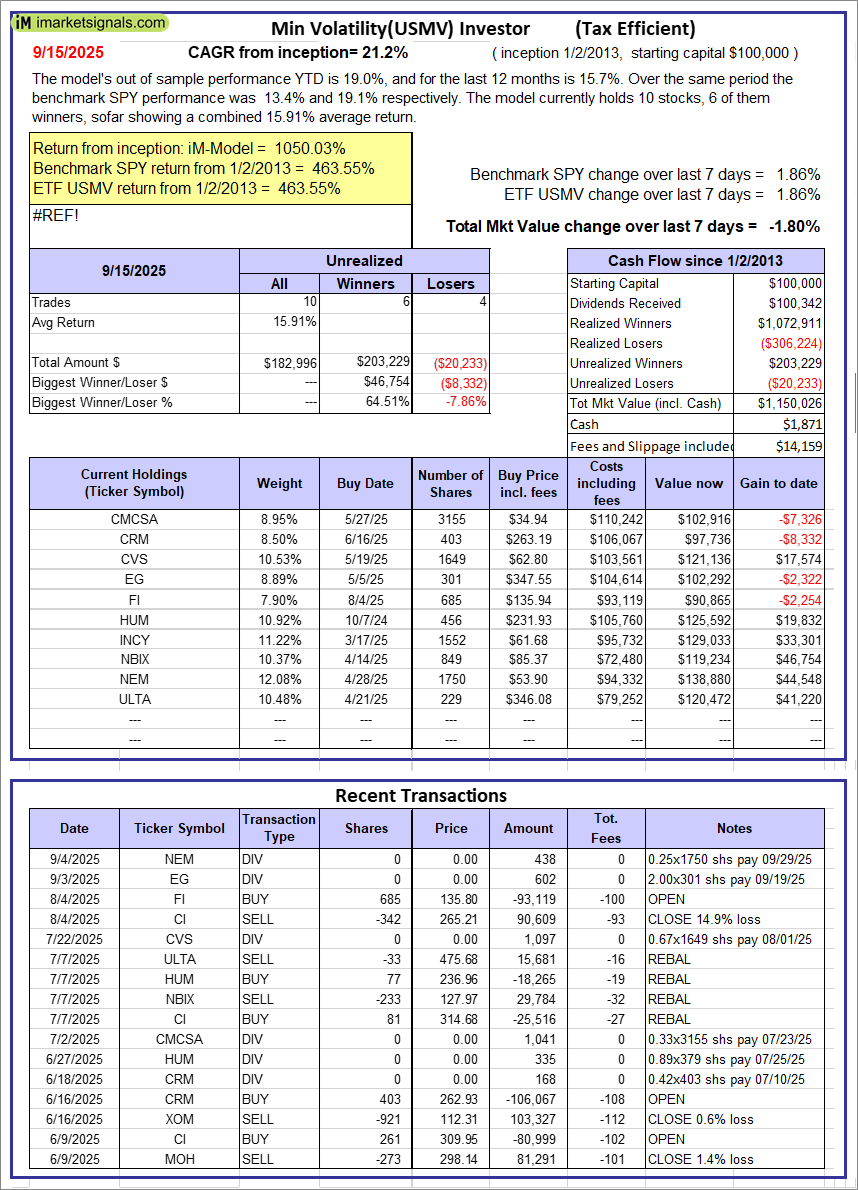 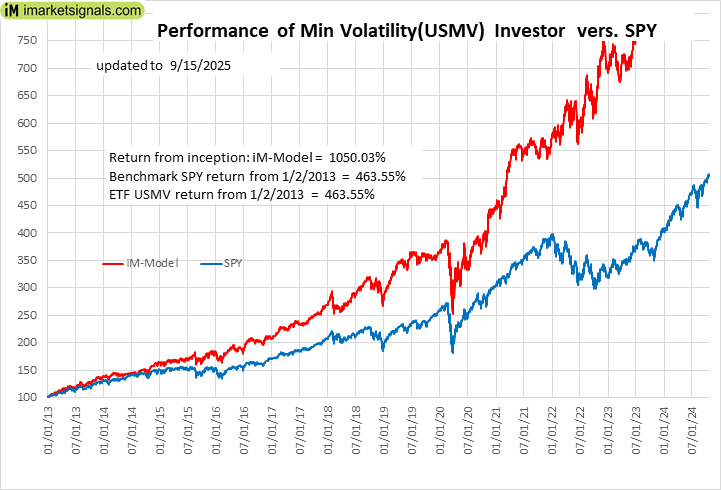 |
iM-Min Volatility(USMV) Investor (Tax Efficient): The model’s out of sample performance YTD is 19.0%, and for the last 12 months is 15.7%. Over the same period the benchmark SPY performance was 13.4% and 19.1% respectively. Since inception, on 1/3/2013, the model gained 1050.03% while the benchmark SPY gained 463.55% and the ETF USMV gained 463.55% over the same period. Over the previous week the market value of iM-Best12(USMV)Q1 gained -1.80% at a time when SPY gained 1.86%. A starting capital of $100,000 at inception on 1/3/2013 would have grown to $1,150,026 which includes $1,871 cash and excludes $14,159 spent on fees and slippage. |
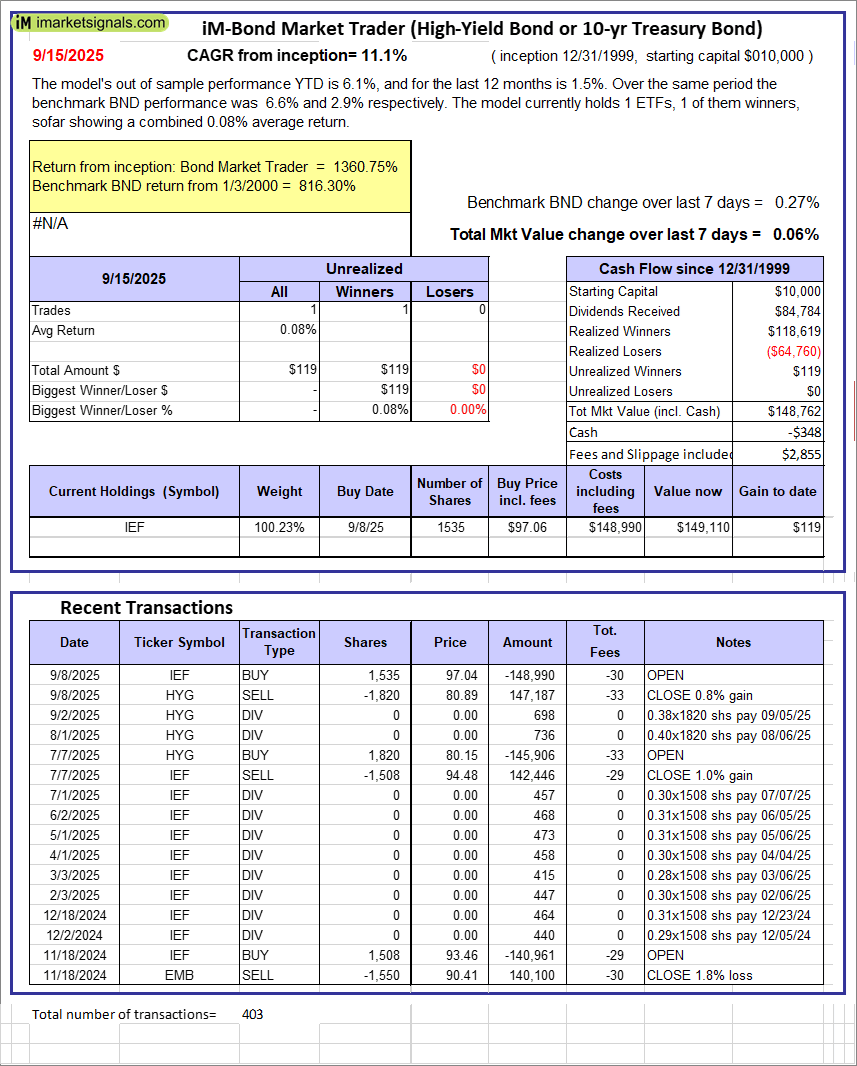 |
iM-Bond Market Trader (High-Yield Bond or 10-yr Treasury Bond): The model’s out of sample performance YTD is 6.1%, and for the last 12 months is 1.5%. Over the same period the benchmark BND performance was 6.6% and 2.9% respectively. Over the previous week the market value of the iM-Bond Market Trader (High-Yield Bond or 10-yr Treasury Bond) gained 0.06% at a time when BND gained 0.27%. A starting capital of $10,000 at inception on 1/3/2000 would have grown to $148,762 which includes -$348 cash and excludes $2,855 spent on fees and slippage. |
|
|
iM-ModSum/YieldCurve Timer: The model’s out of sample performance YTD is 19.1%, and for the last 12 months is 21.7%. Over the same period the benchmark SPY performance was 13.4% and 19.1% respectively. Over the previous week the market value of iM-PortSum/YieldCurve Timer gained 0.06% at a time when SPY gained 1.86%. A starting capital of $100,000 at inception on 1/1/2016 would have grown to $382,106 which includes -$139 cash and excludes $2,213 spent on fees and slippage. |
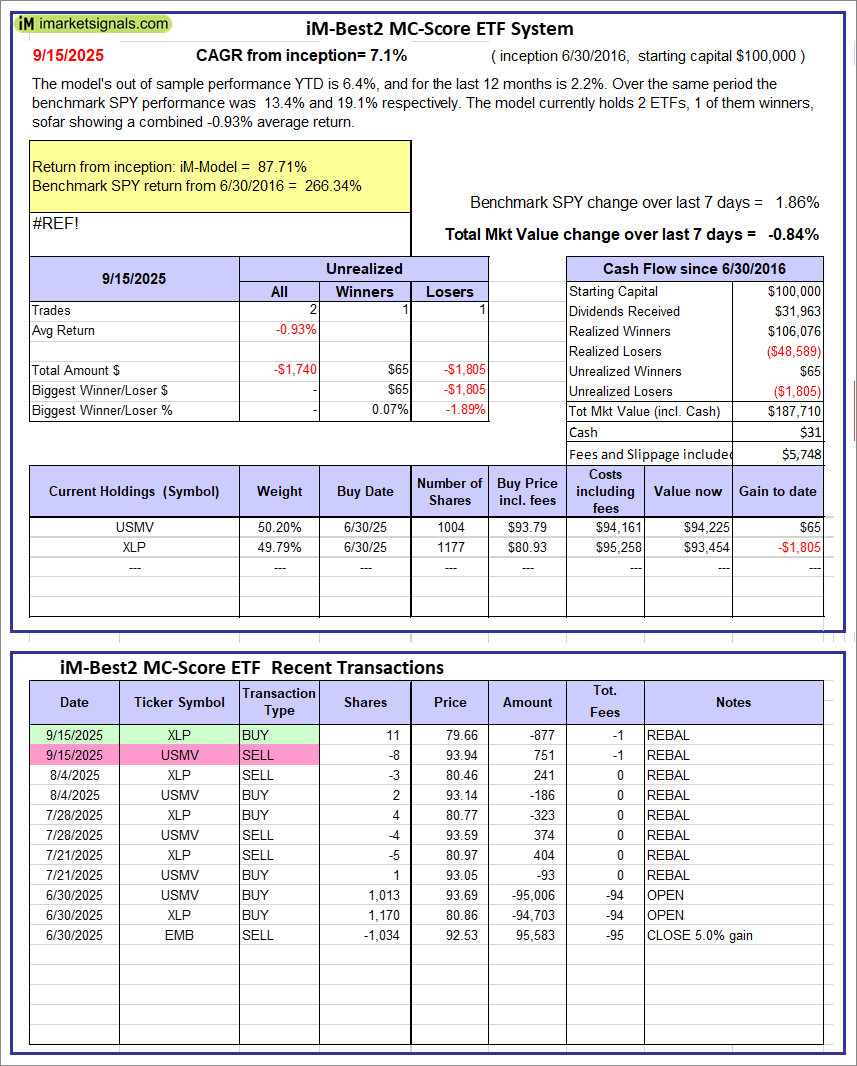 |
iM-Best2 MC-Score ETF System: The model’s out of sample performance YTD is 6.4%, and for the last 12 months is 2.2%. Over the same period the benchmark SPY performance was 13.4% and 19.1% respectively. Over the previous week the market value of the iM-Best2 MC-Score ETF System gained -0.84% at a time when SPY gained 1.86%. A starting capital of $100,000 at inception on 6/30/2016 would have grown to $187,710 which includes $31 cash and excludes $5,748 spent on fees and slippage. |
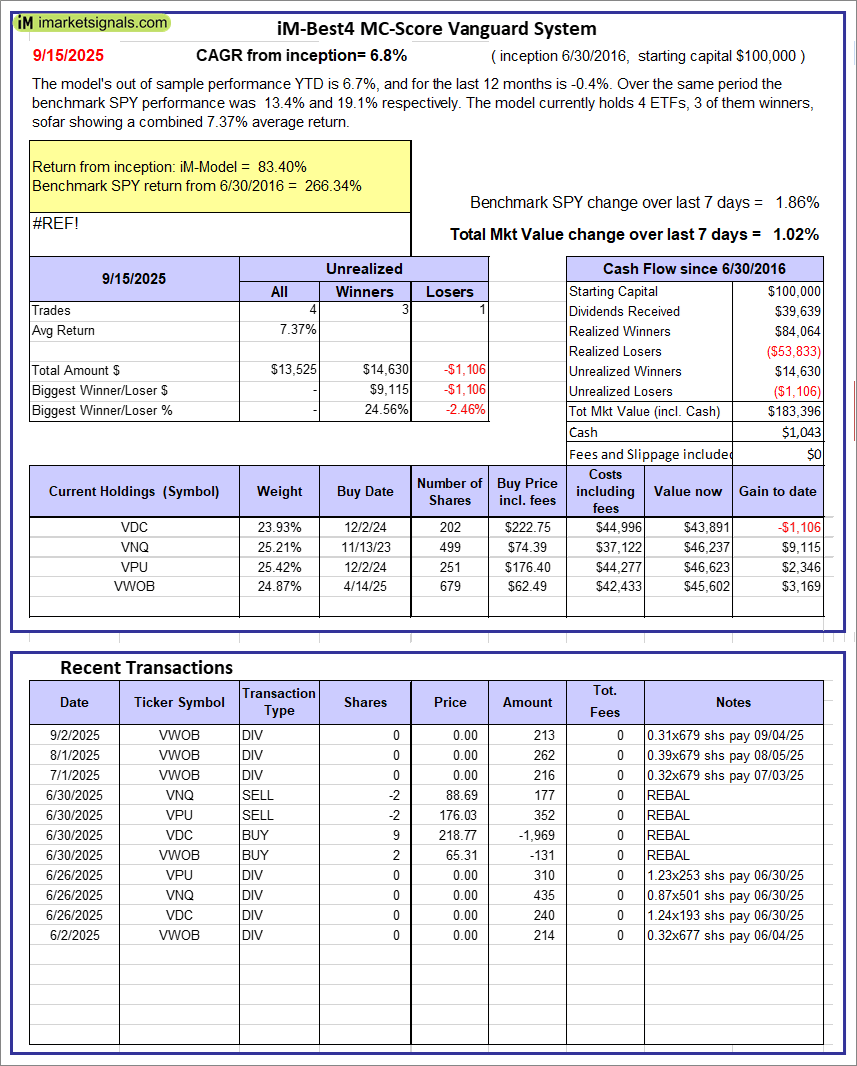 |
iM-Best4 MC-Score Vanguard System: The model’s out of sample performance YTD is 6.7%, and for the last 12 months is -0.4%. Over the same period the benchmark SPY performance was 13.4% and 19.1% respectively. Over the previous week the market value of the iM-Best4 MC-Score Vanguard System gained 1.02% at a time when SPY gained 1.86%. A starting capital of $100,000 at inception on 6/30/2016 would have grown to $183,396 which includes $1,043 cash and excludes $00 spent on fees and slippage. |
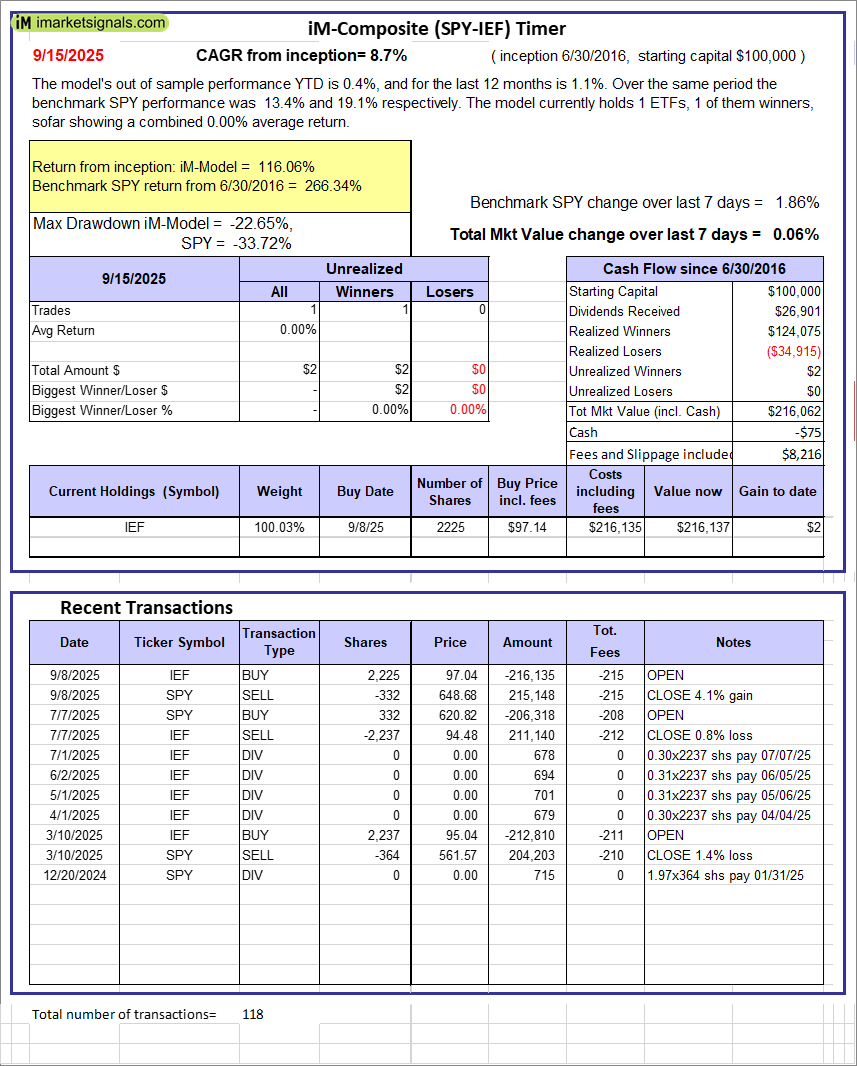 |
iM-Composite (SPY-IEF) Timer: The model’s out of sample performance YTD is 0.4%, and for the last 12 months is 1.1%. Over the same period the benchmark SPY performance was 13.4% and 19.1% respectively. Over the previous week the market value of the iM-Composite (SPY-IEF) Timer gained 0.06% at a time when SPY gained 1.86%. A starting capital of $100,000 at inception on 6/30/2016 would have grown to $216,062 which includes -$75 cash and excludes $8,216 spent on fees and slippage. |
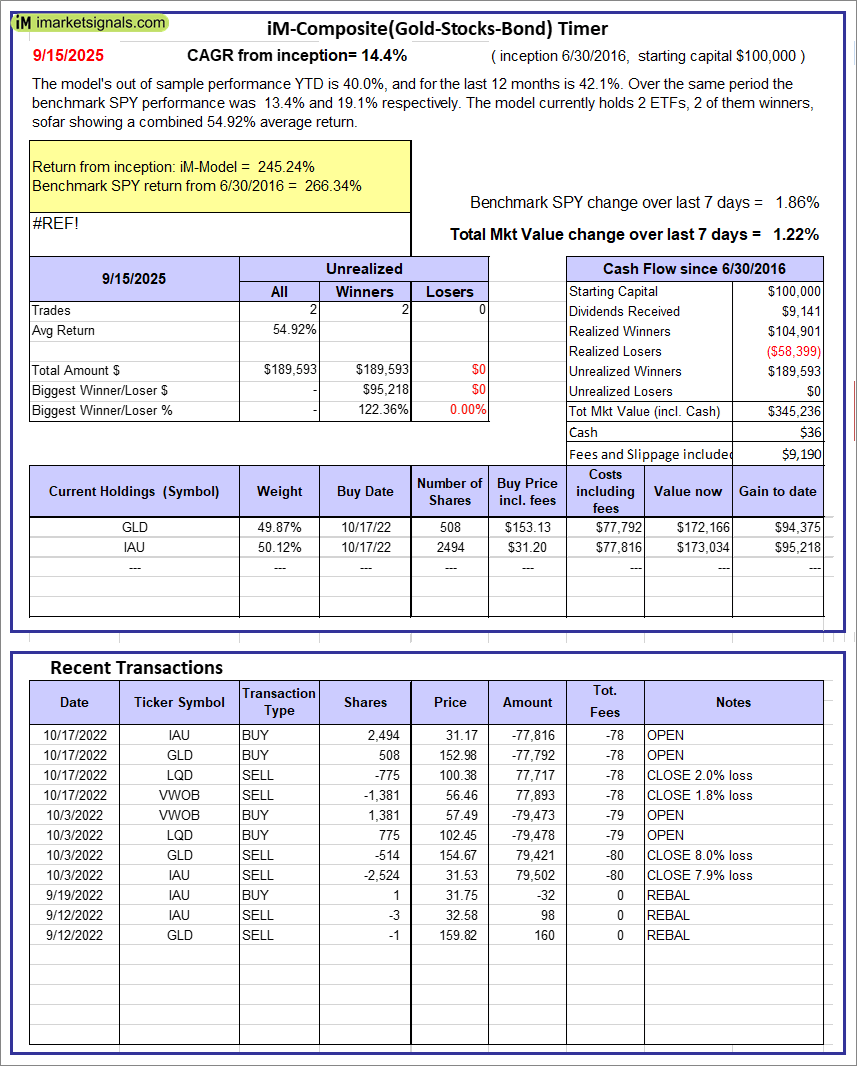 |
iM-Composite(Gold-Stocks-Bond) Timer: The model’s out of sample performance YTD is 40.0%, and for the last 12 months is 42.1%. Over the same period the benchmark SPY performance was 13.4% and 19.1% respectively. Over the previous week the market value of the iM-Composite(Gold-Stocks-Bond) Timer gained 1.22% at a time when SPY gained 1.86%. A starting capital of $100,000 at inception on 6/30/2016 would have grown to $345,236 which includes $36 cash and excludes $9,190 spent on fees and slippage. |
iM-Best Reports – 9/15/2025
Posted in pmp SPY-SH
Leave a Reply
You must be logged in to post a comment.