
  |
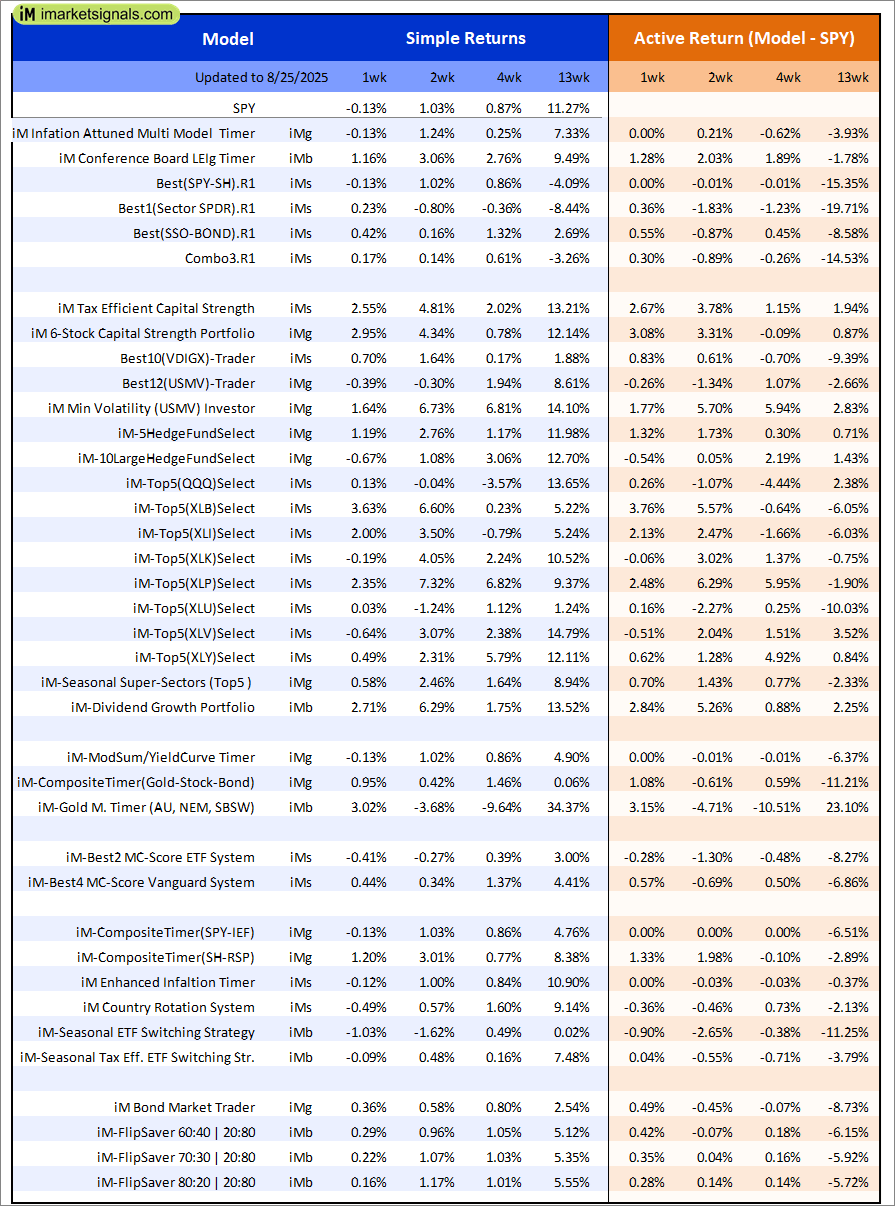
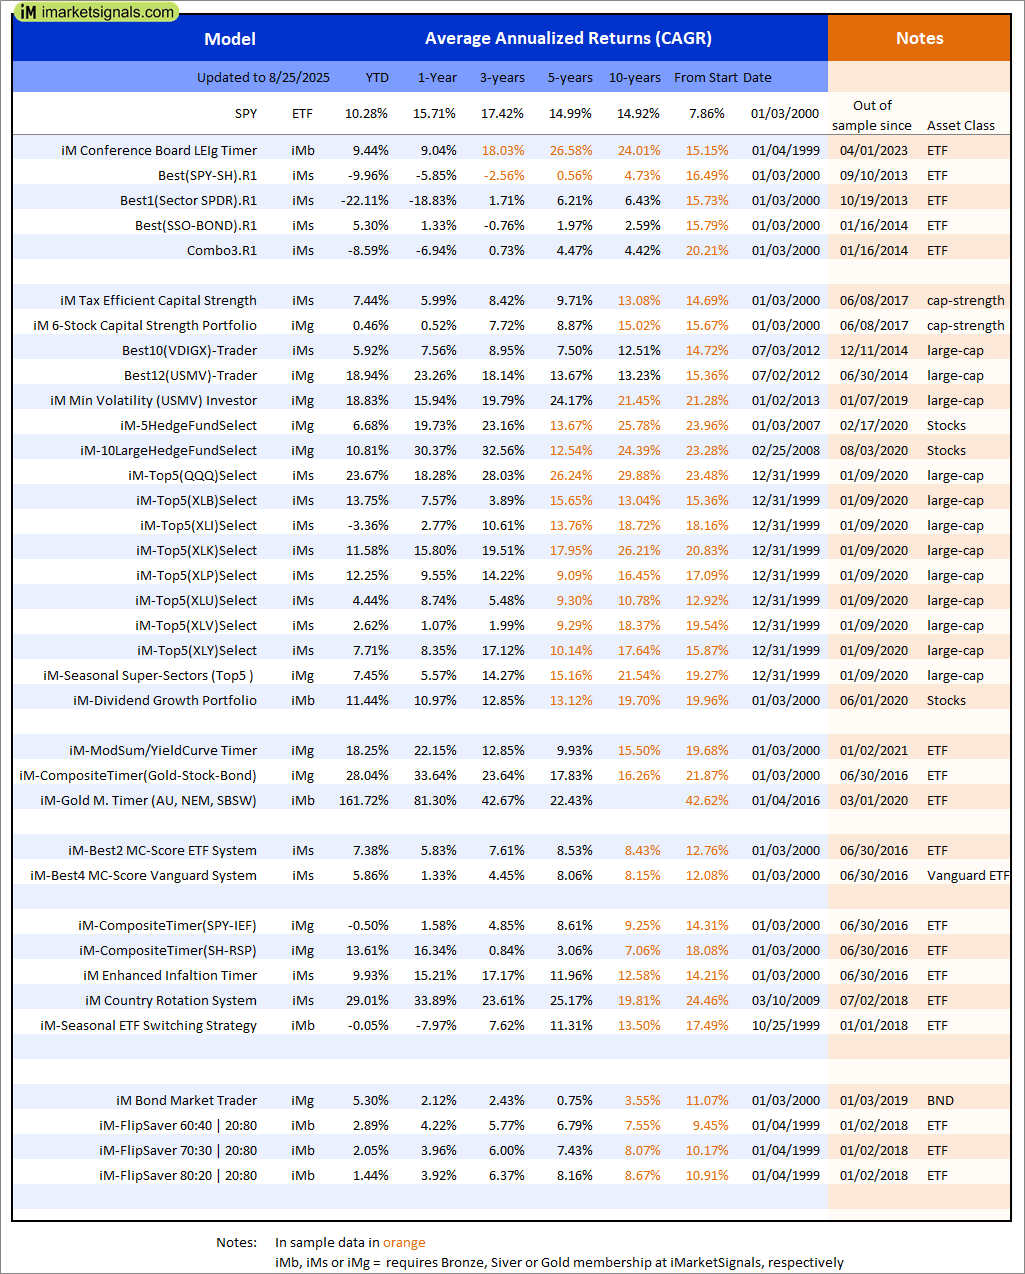
Out of sample performance summary of our models for the past 1, 2, 4 and 13 week periods. The active active return indicates how the models over- or underperformed the benchmark ETF SPY. Also the YTD, and the 1-, 3-, 5- and 10-year annualized returns are shown in the second table |
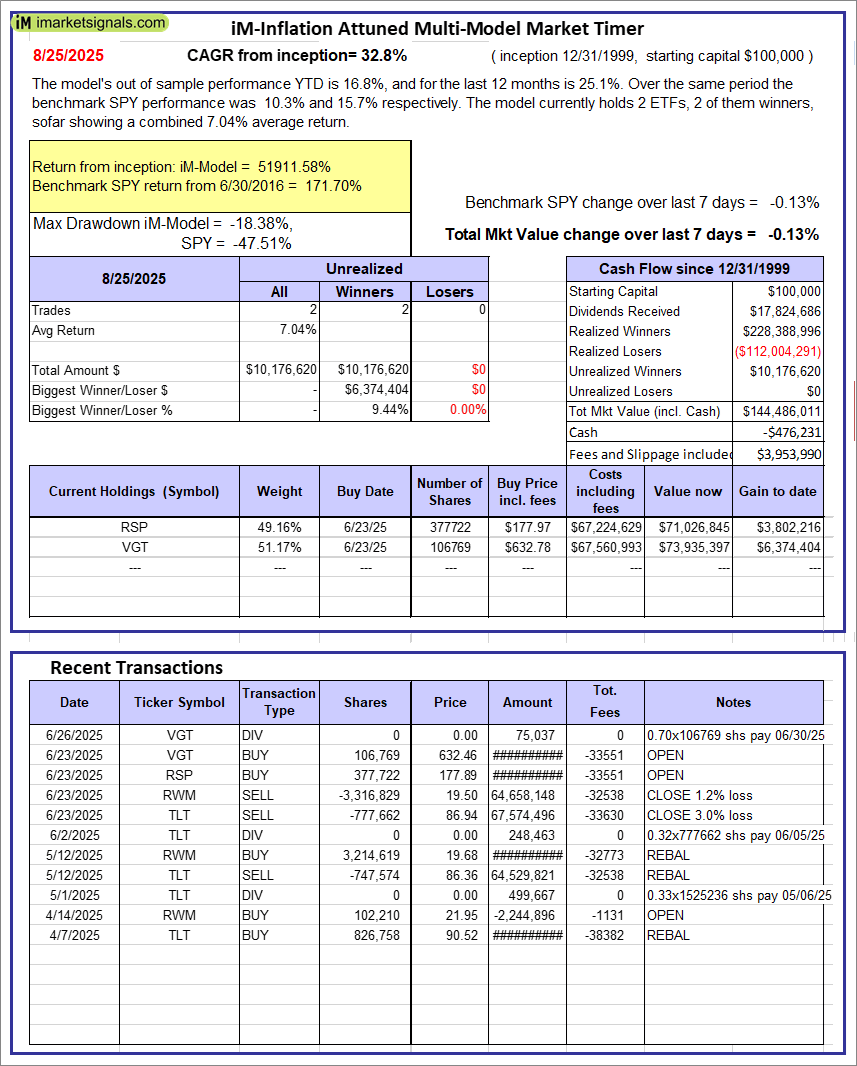 |
iM-Inflation Attuned Multi-Model Market Timer: The model’s out of sample performance YTD is 16.8%, and for the last 12 months is 25.1%. Over the same period the benchmark SPY performance was 10.3% and 15.7% respectively. Over the previous week the market value of the iM-Inflation Attuned Multi-Model Market Timer gained -0.13% at a time when SPY gained -0.13%. A starting capital of $100,000 at inception on 3/24/2017 would have grown to $144,486,011 which includes -$476,231 cash and excludes $3,953,990 spent on fees and slippage. |
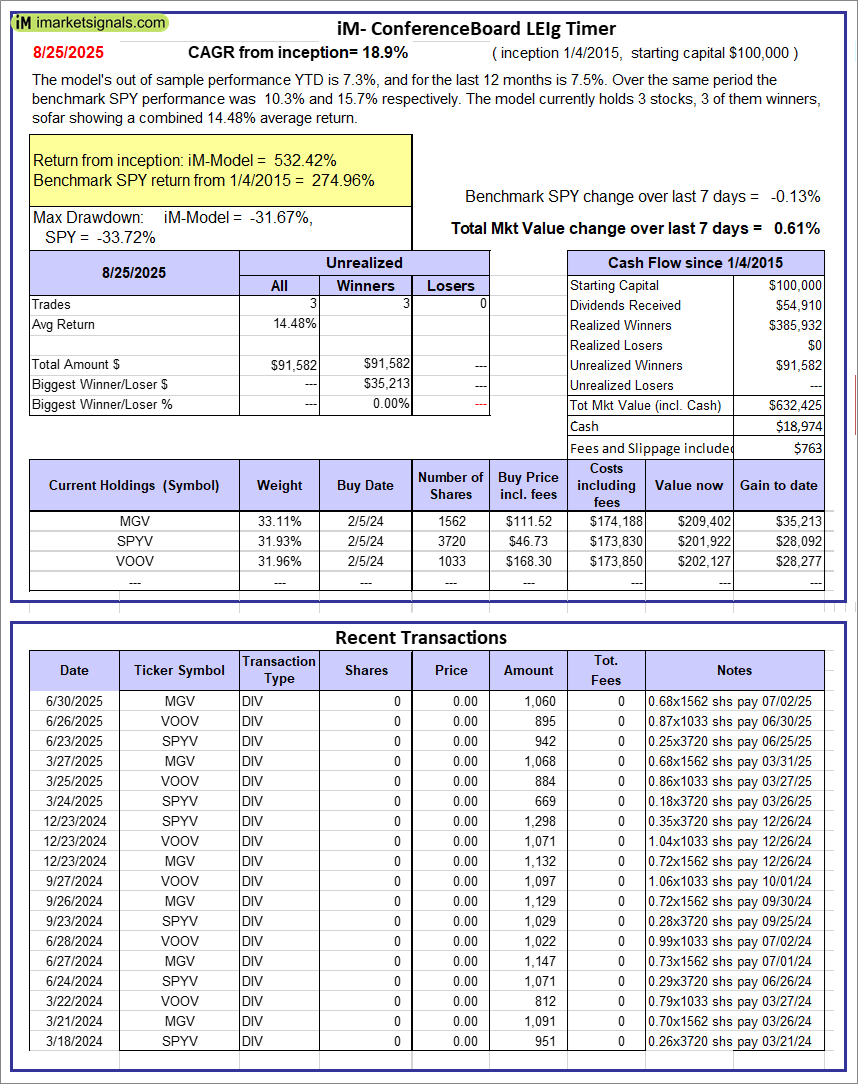 |
iM-Conference Board LEIg Timer: The model’s performance YTD is 14.3%, and for the last 12 months is 7.3%. Over the same period the benchmark SPY performance was 20.1% and 9.4% respectively. Over the previous week the market value of the iM-Conference Board LEIg Timer gained 0.61% at a time when SPY gained -0.13%. A starting capital of $100,000 at inception on 4/5/2017 would have grown to $632,425 which includes $18,974 cash and excludes $763 spent on fees and slippage. |
 |
iM-FlipSaver 60:40 | 20:80 – 2017: The model’s out of sample performance YTD is 2.7%, and for the last 12 months is 4.0%. Over the same period the benchmark E60B40 performance was 8.5% and 10.7% respectively. Over the previous week the market value of iM-FlipSaver 80:20 | 20:80 gained 0.29% at a time when SPY gained 0.08%. A starting capital of $100,000 at inception on 7/16/2015 would have grown to $175,887 which includes $822 cash and excludes $4,895 spent on fees and slippage. |
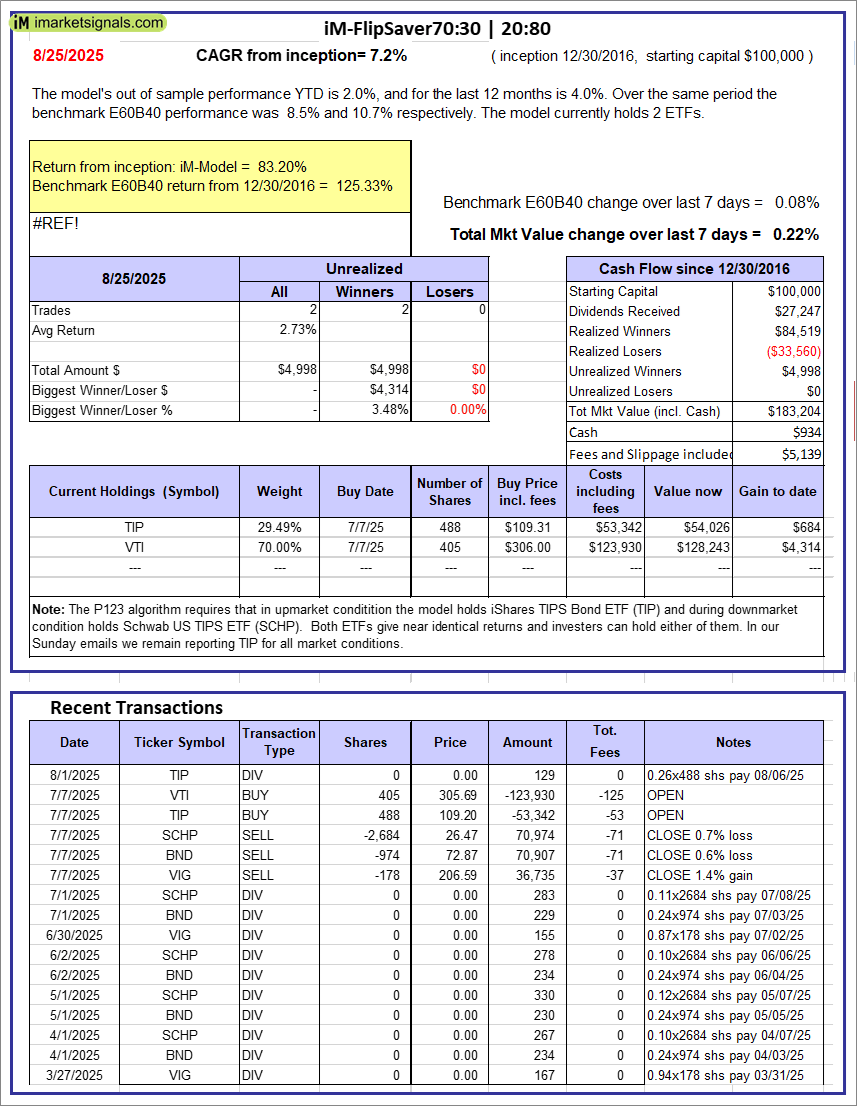 |
iM-FlipSaver 70:30 | 20:80 – 2017: The model’s out of sample performance YTD is 2.0%, and for the last 12 months is 4.0%. Over the same period the benchmark E60B40 performance was 8.5% and 10.7% respectively. Over the previous week the market value of iM-FlipSaver 70:30 | 20:80 gained 0.22% at a time when SPY gained 0.08%. A starting capital of $100,000 at inception on 7/15/2015 would have grown to $183,204 which includes $934 cash and excludes $5,139 spent on fees and slippage. |
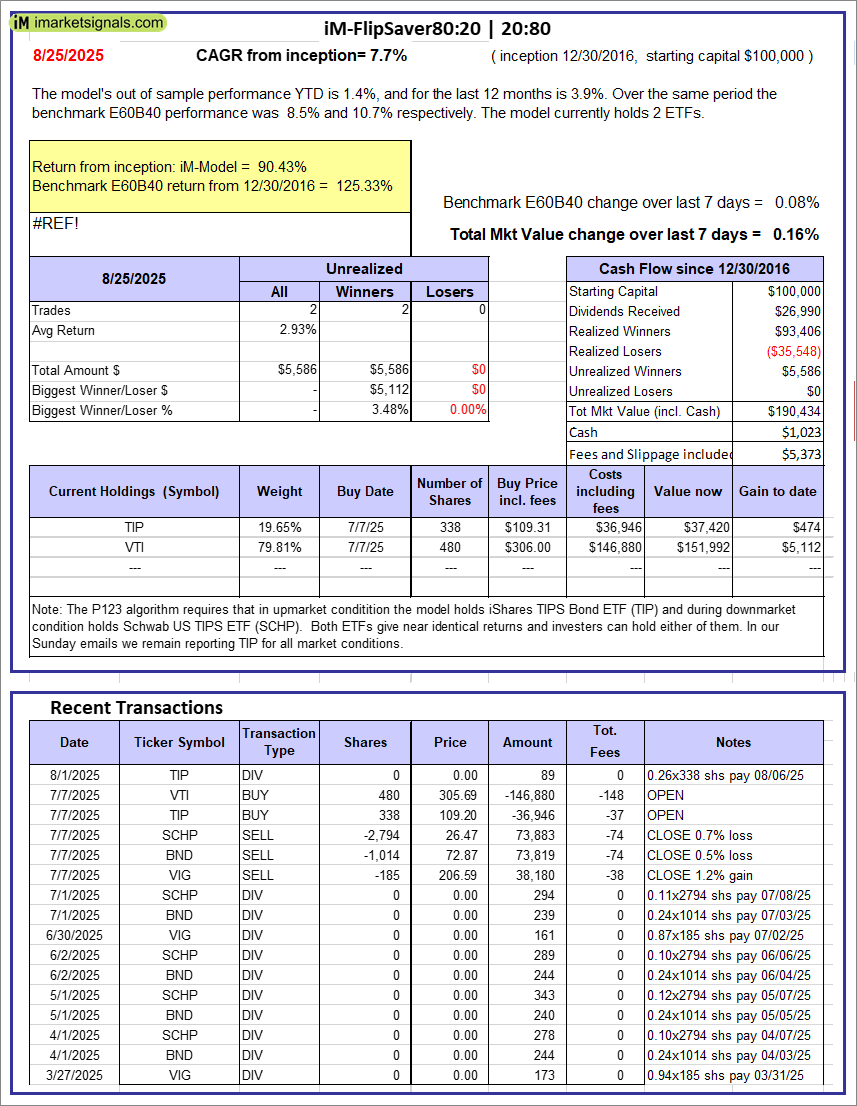 |
iM-FlipSaver 80:20 | 20:80 – 2017: The model’s out of sample performance YTD is 1.4%, and for the last 12 months is 3.9%. Over the same period the benchmark E60B40 performance was 8.5% and 10.7% respectively. Over the previous week the market value of iM-FlipSaver 80:20 | 20:80 gained 0.16% at a time when SPY gained 0.08%. A starting capital of $100,000 at inception on 1/2/2017 would have grown to $190,434 which includes $1,023 cash and excludes $5,373 spent on fees and slippage. |
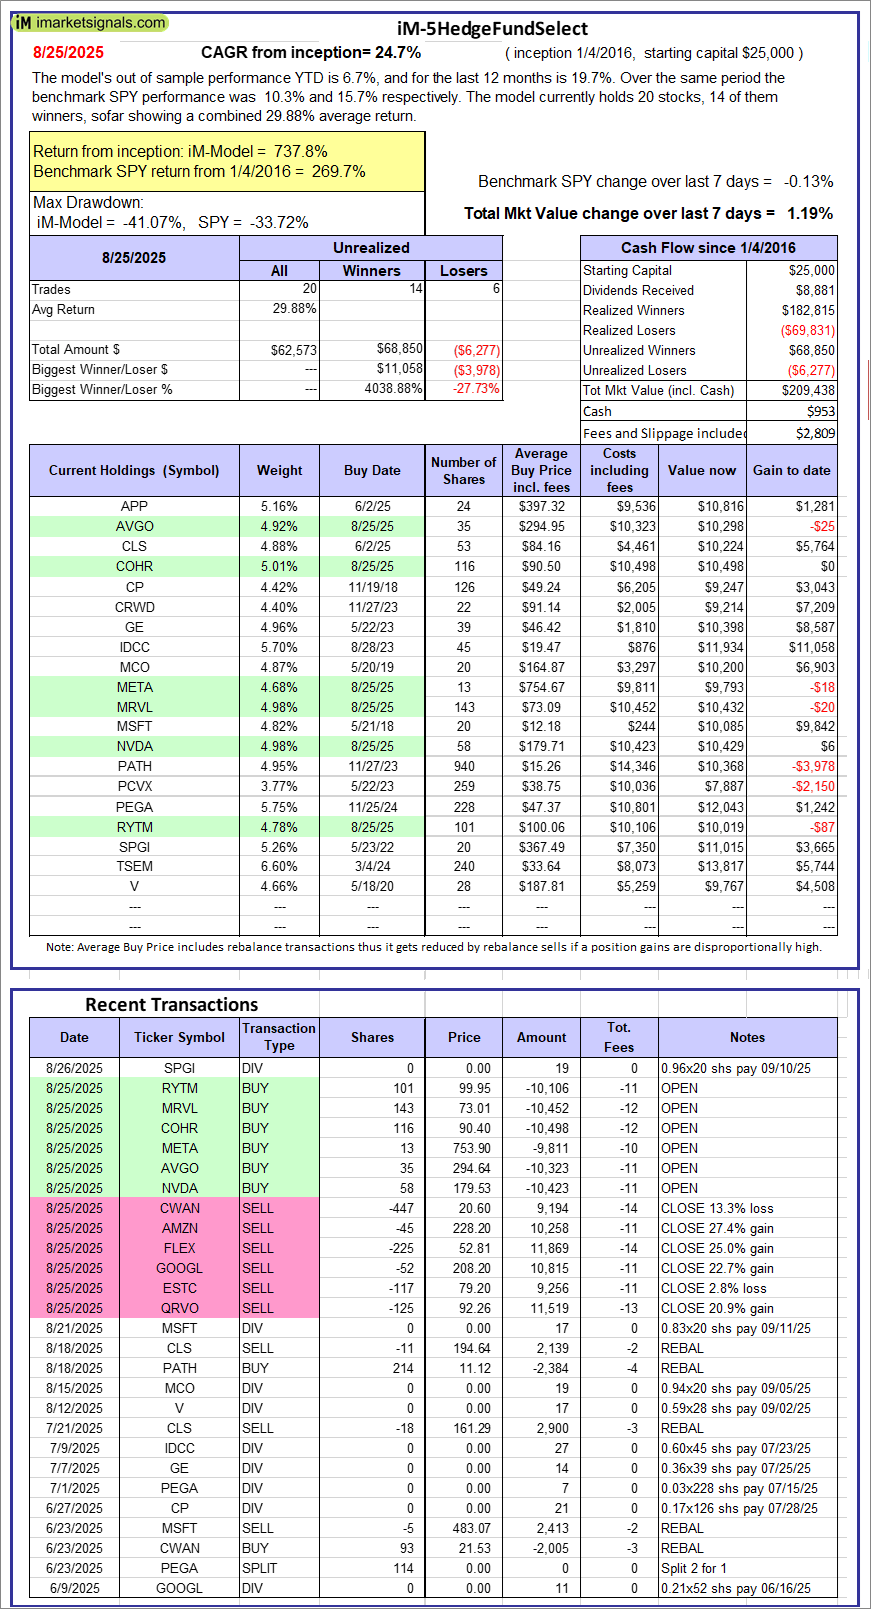 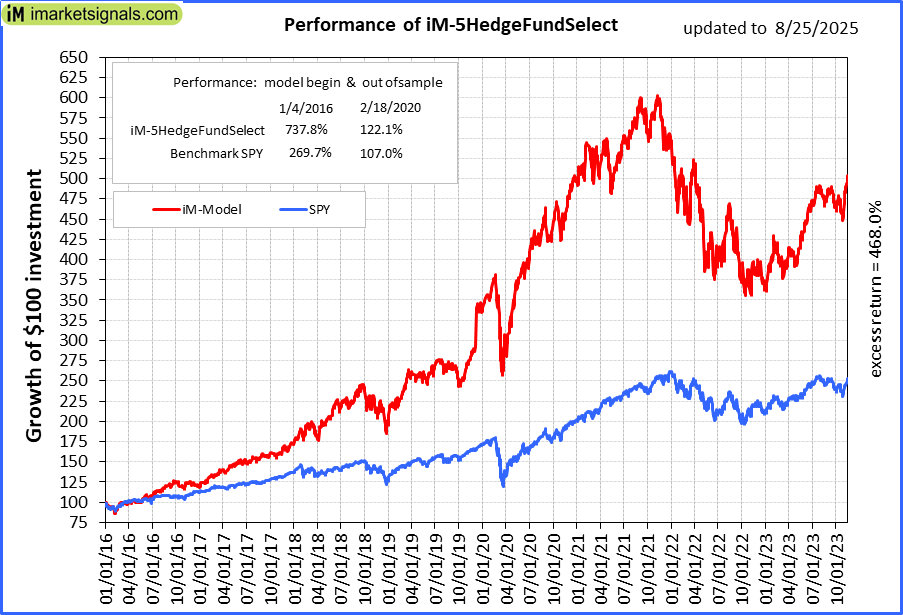 |
iM-5HedgeFundSelect: Since inception, on 1/5/2016, the model gained 737.75% while the benchmark SPY gained 269.71% over the same period. Over the previous week the market value of iM-5HedgeFundSelect gained 1.19% at a time when SPY gained -0.13%. A starting capital of $25,000 at inception on 1/5/2016 would have grown to $209,438 which includes $953 cash and excludes $2,809 spent on fees and slippage. |
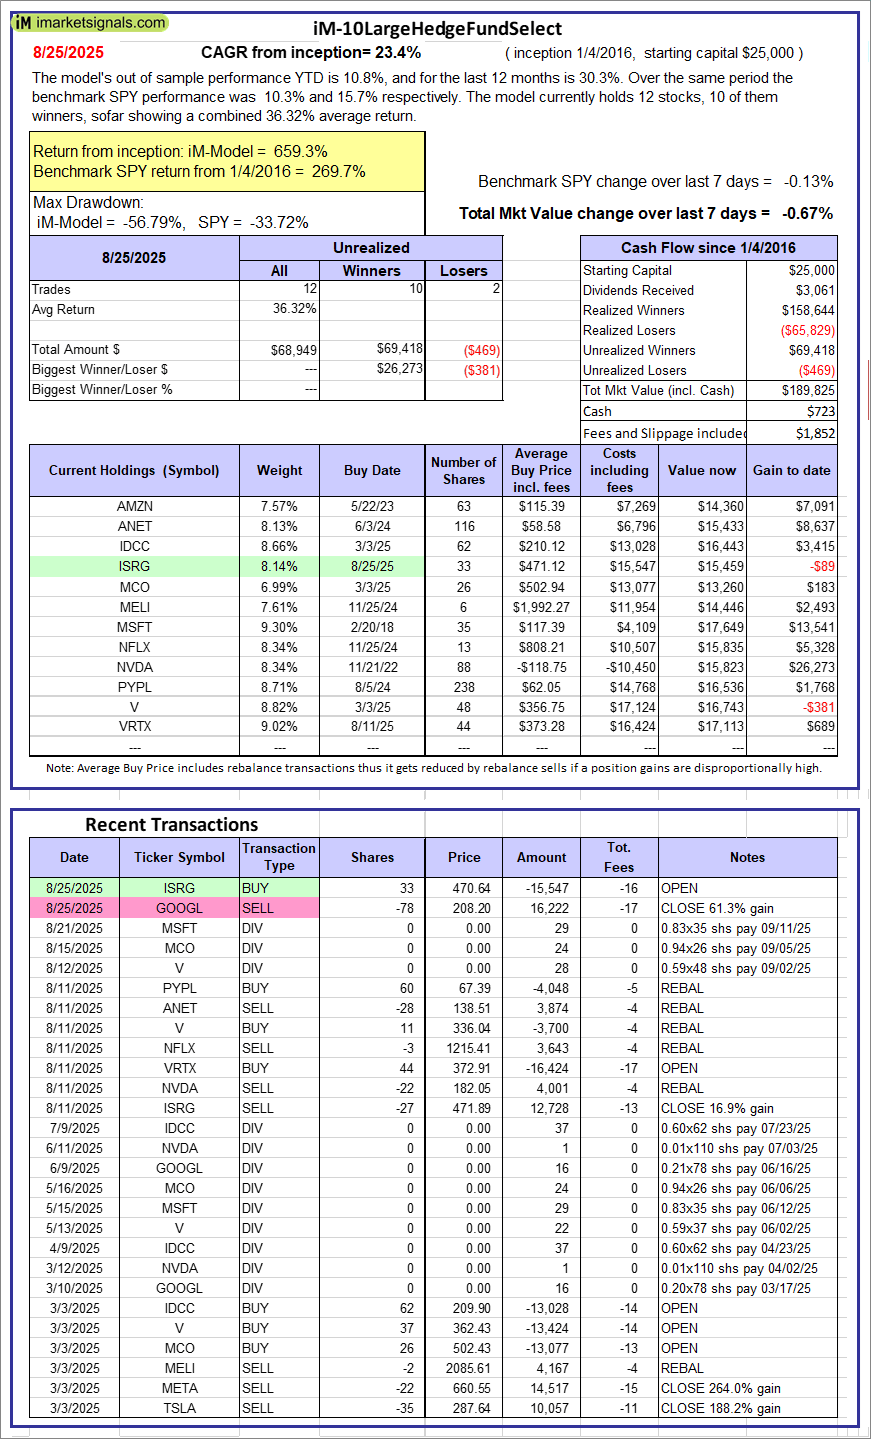 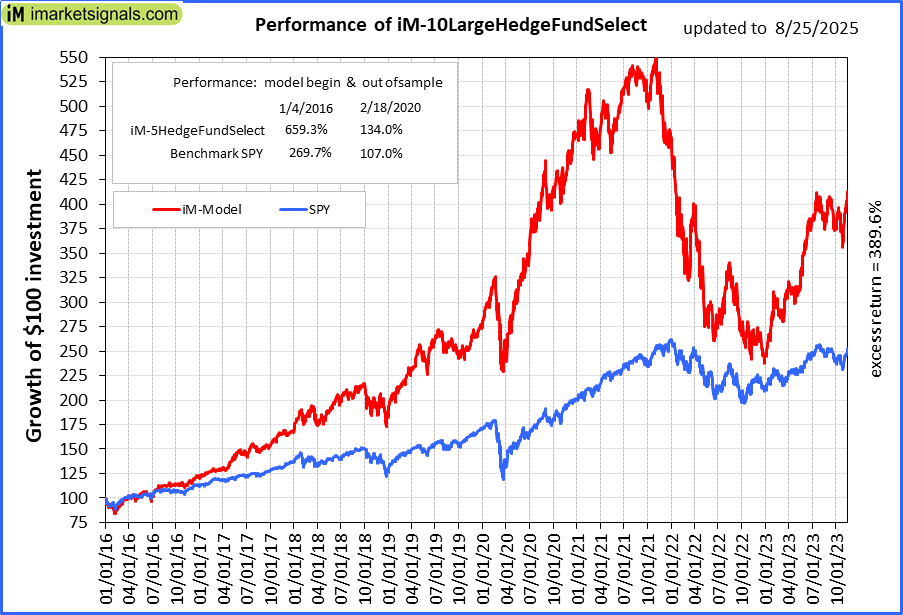 |
iM-10LargeHedgeFundSelect: Since inception, on 1/5/2016, the model gained 659.30% while the benchmark SPY gained 269.71% over the same period. Over the previous week the market value of iM-10LargeHedgeFundSelect gained -0.67% at a time when SPY gained -0.13%. A starting capital of $25,000 at inception on 1/5/2016 would have grown to $189,825 which includes $723 cash and excludes $1,852 spent on fees and slippage. |
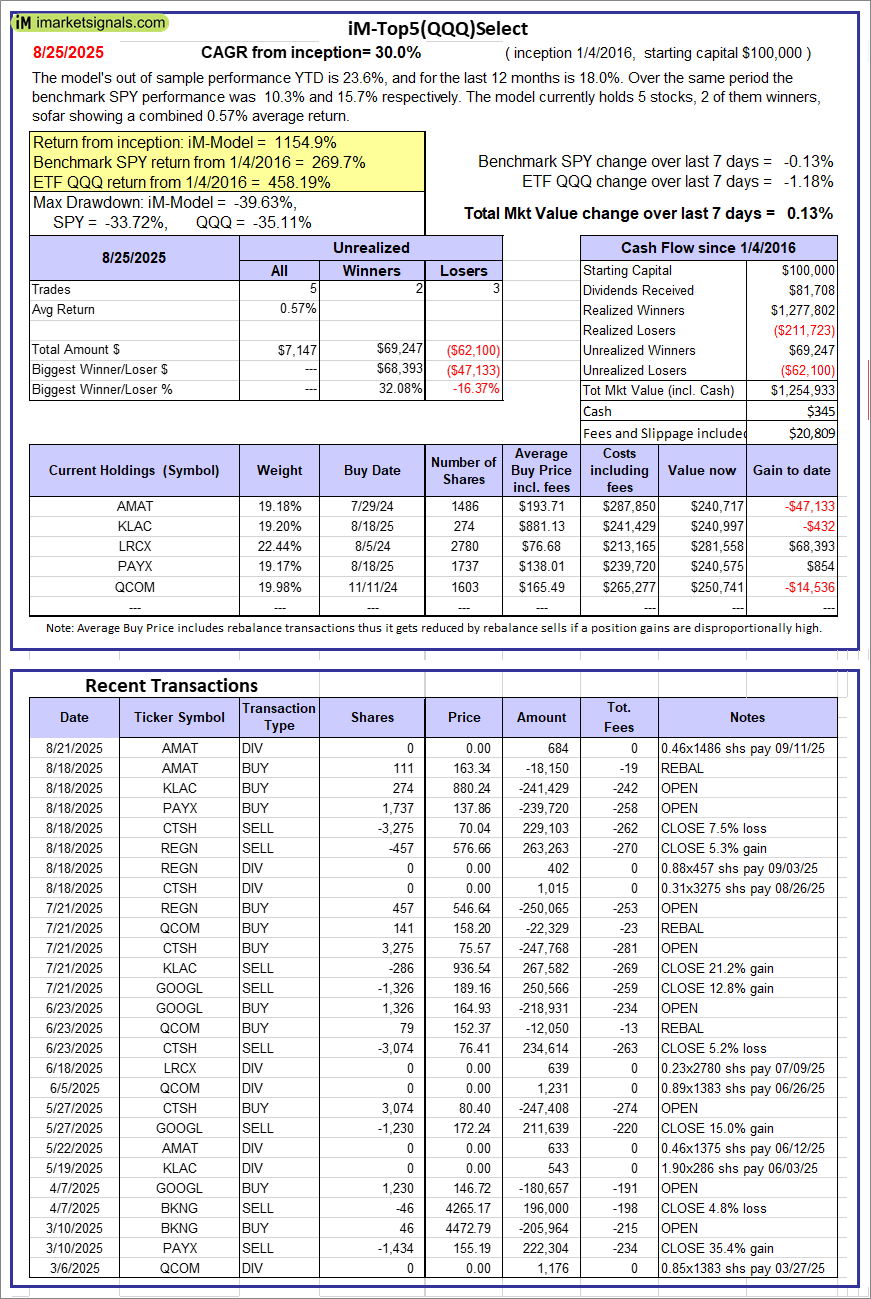 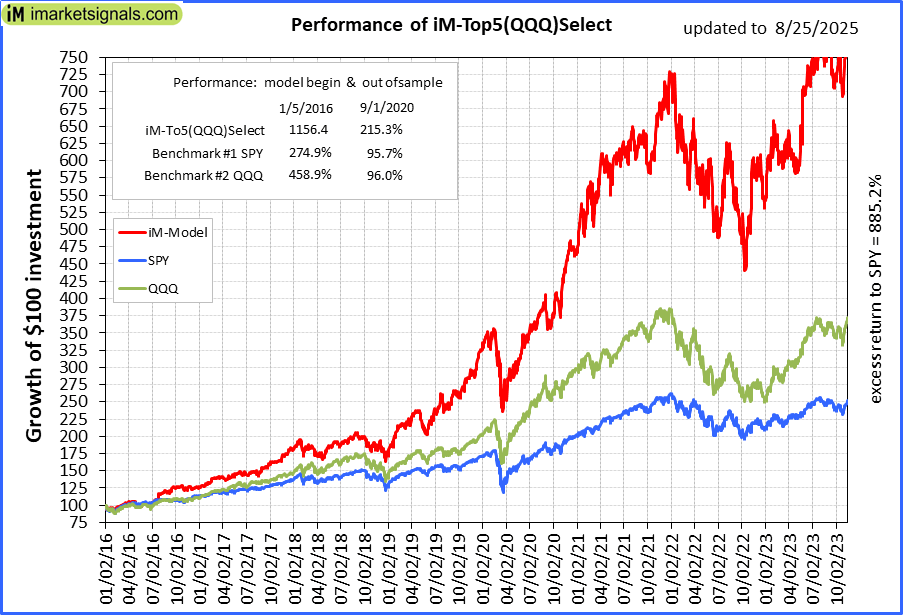 |
iM-Top5(QQQ)Select: Since inception, on 1/5/2016, the model gained 1154.93% while the benchmark SPY gained 269.71% over the same period. Over the previous week the market value of iM-Top5(QQQ)Select gained 0.13% at a time when SPY gained -0.13%. A starting capital of $100,000 at inception on 1/5/2016 would have grown to $1,254,933 which includes $345 cash and excludes $20,809 spent on fees and slippage. |
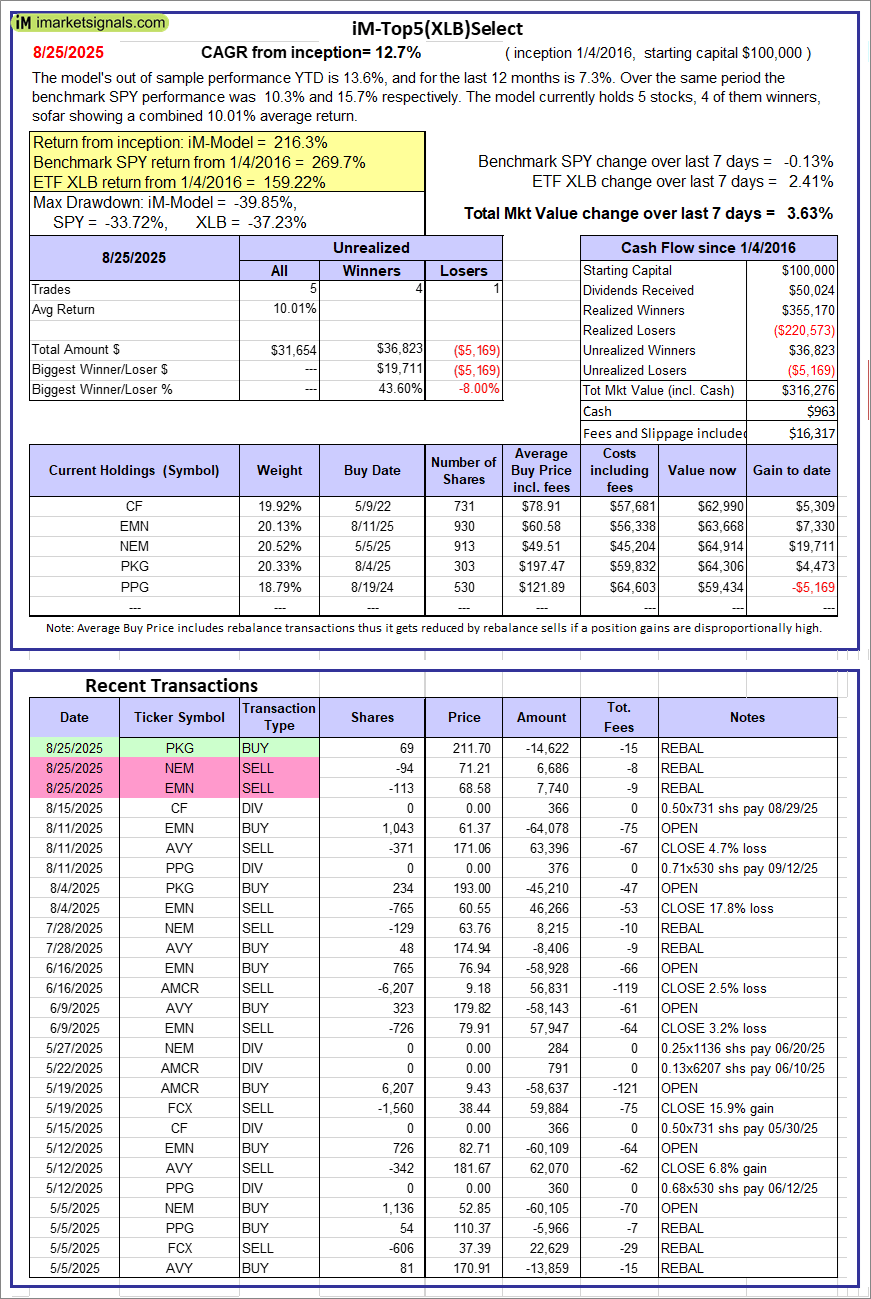 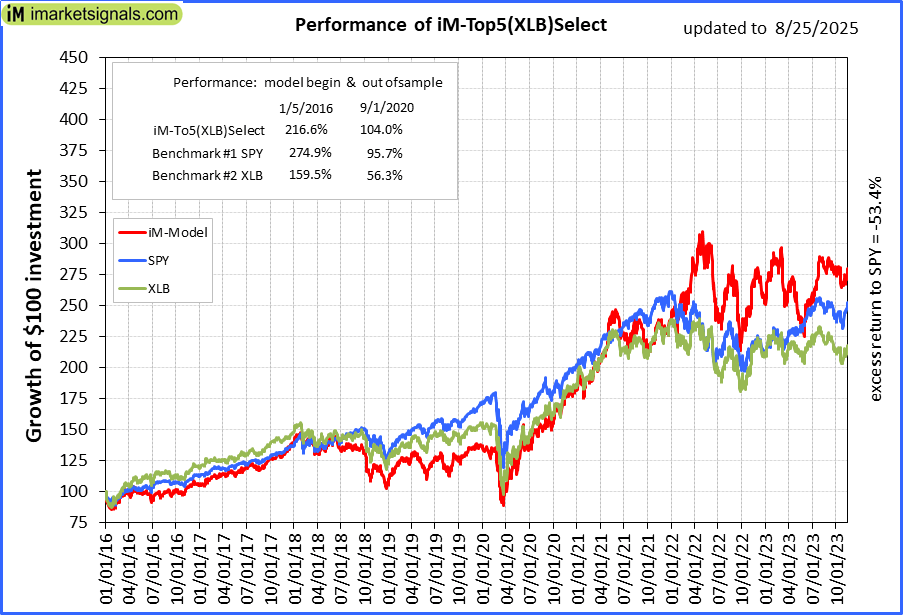 |
iM-Top5(XLB)Select: Since inception, on 1/5/2016, the model gained 216.28% while the benchmark SPY gained 269.71% over the same period. Over the previous week the market value of iM-Top5(XLB)Select gained 3.63% at a time when SPY gained -0.13%. A starting capital of $100,000 at inception on 1/5/2016 would have grown to $316,276 which includes $963 cash and excludes $16,317 spent on fees and slippage. |
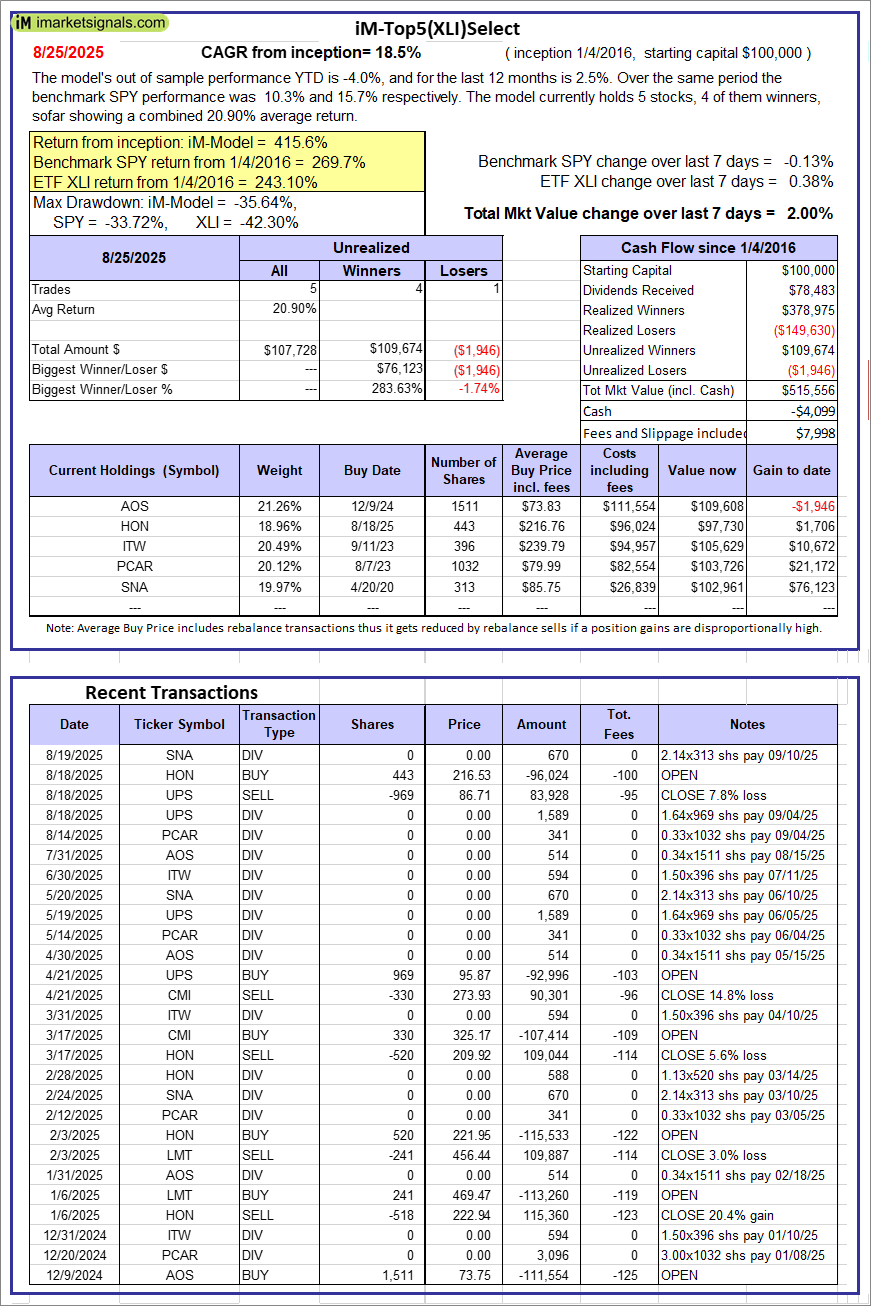 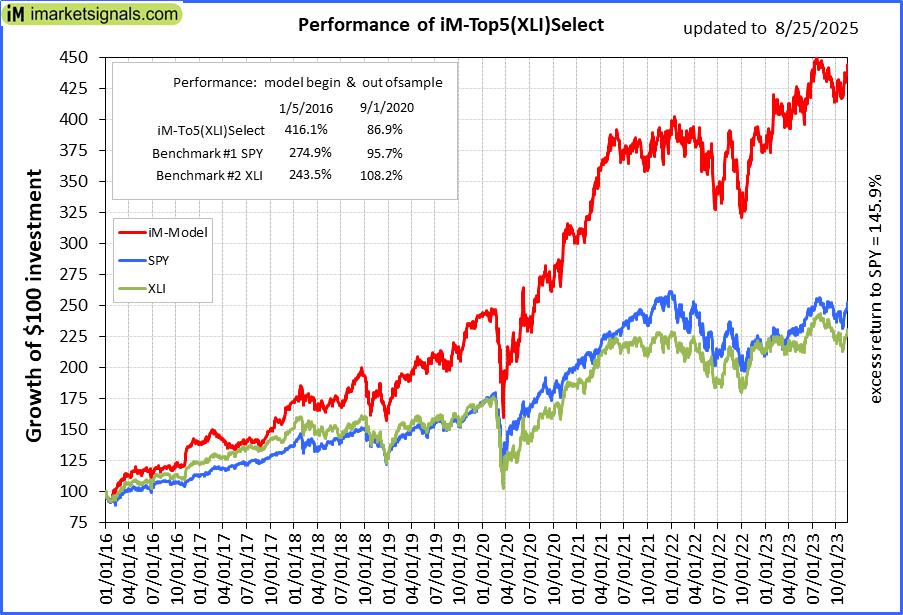 |
iM-Top5(XLI)Select: Since inception, on 1/5/2016, the model gained 415.56% while the benchmark SPY gained 269.71% over the same period. Over the previous week the market value of iM-Top5(XLI)Select gained 2.00% at a time when SPY gained -0.13%. A starting capital of $100,000 at inception on 1/5/2016 would have grown to $515,556 which includes -$4,099 cash and excludes $7,998 spent on fees and slippage. |
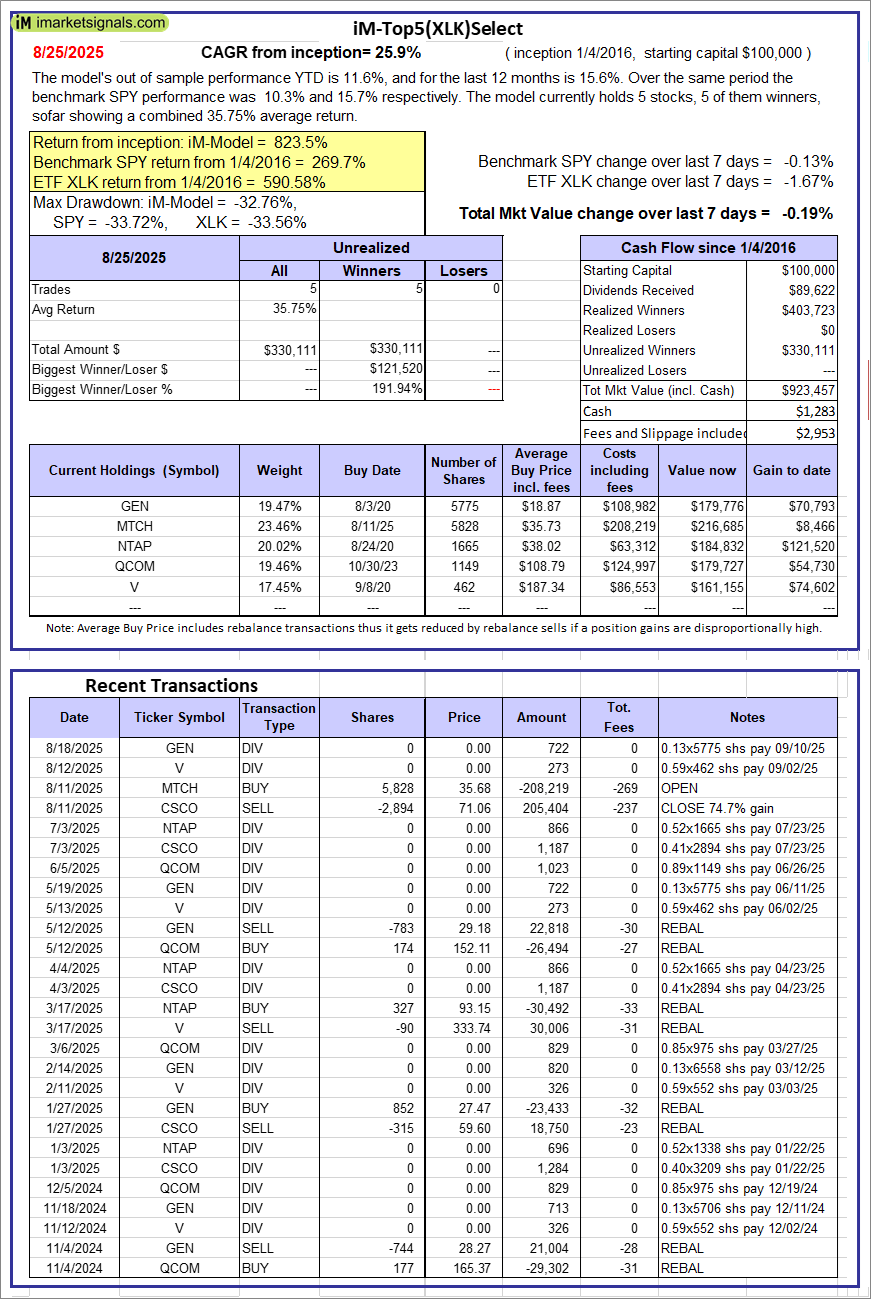 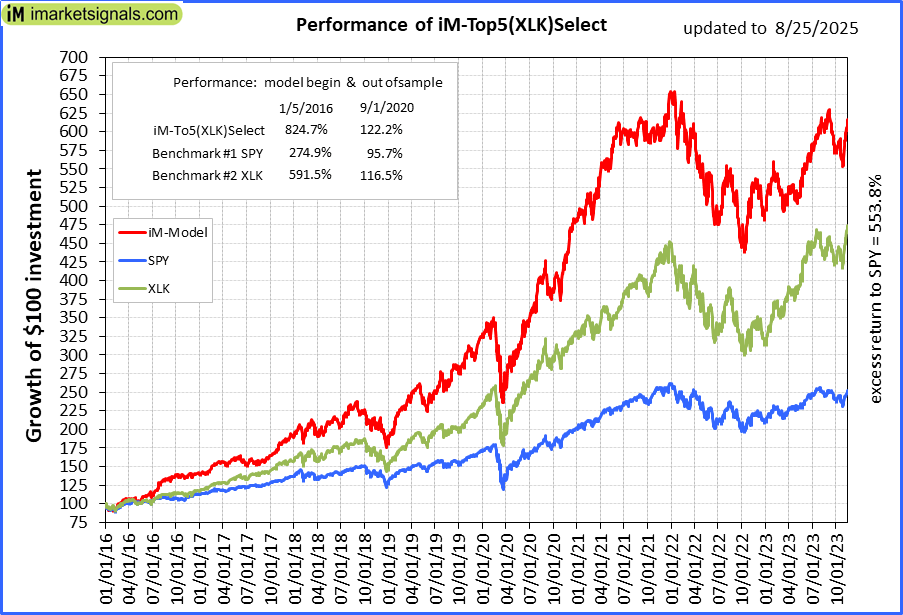 |
iM-Top5(XLK)Select: Since inception, on 1/5/2016, the model gained 823.46% while the benchmark SPY gained 269.71% over the same period. Over the previous week the market value of iM-Top5(XLK)Select gained -0.19% at a time when SPY gained -0.13%. A starting capital of $100,000 at inception on 1/5/2016 would have grown to $923,457 which includes $1,283 cash and excludes $2,953 spent on fees and slippage. |
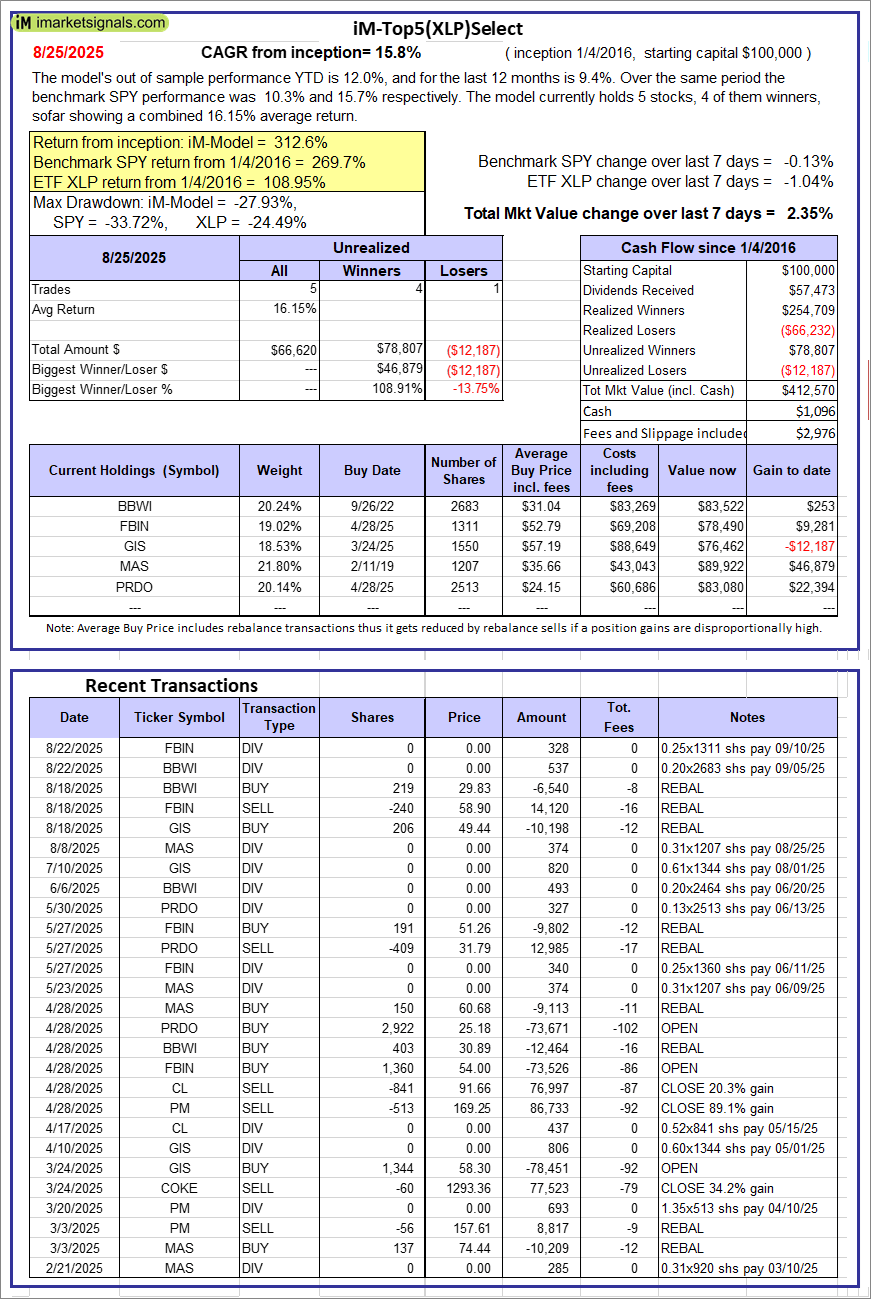 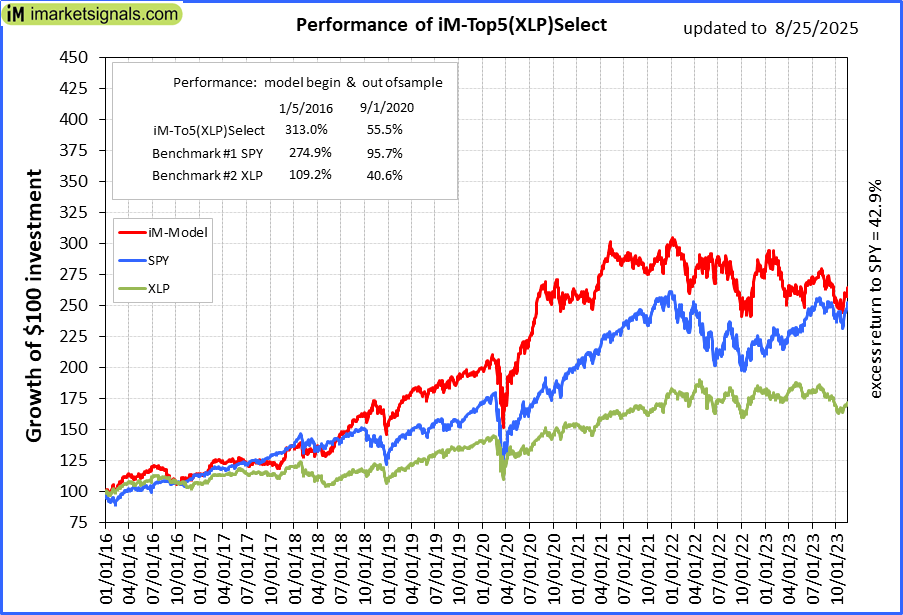 |
iM-Top5(XLP)Select: Since inception, on 1/5/2016, the model gained 312.57% while the benchmark SPY gained 269.71% over the same period. Over the previous week the market value of iM-Top5(XLP)Select gained 2.35% at a time when SPY gained -0.13%. A starting capital of $100,000 at inception on 1/5/2016 would have grown to $412,570 which includes $1,096 cash and excludes $2,976 spent on fees and slippage. |
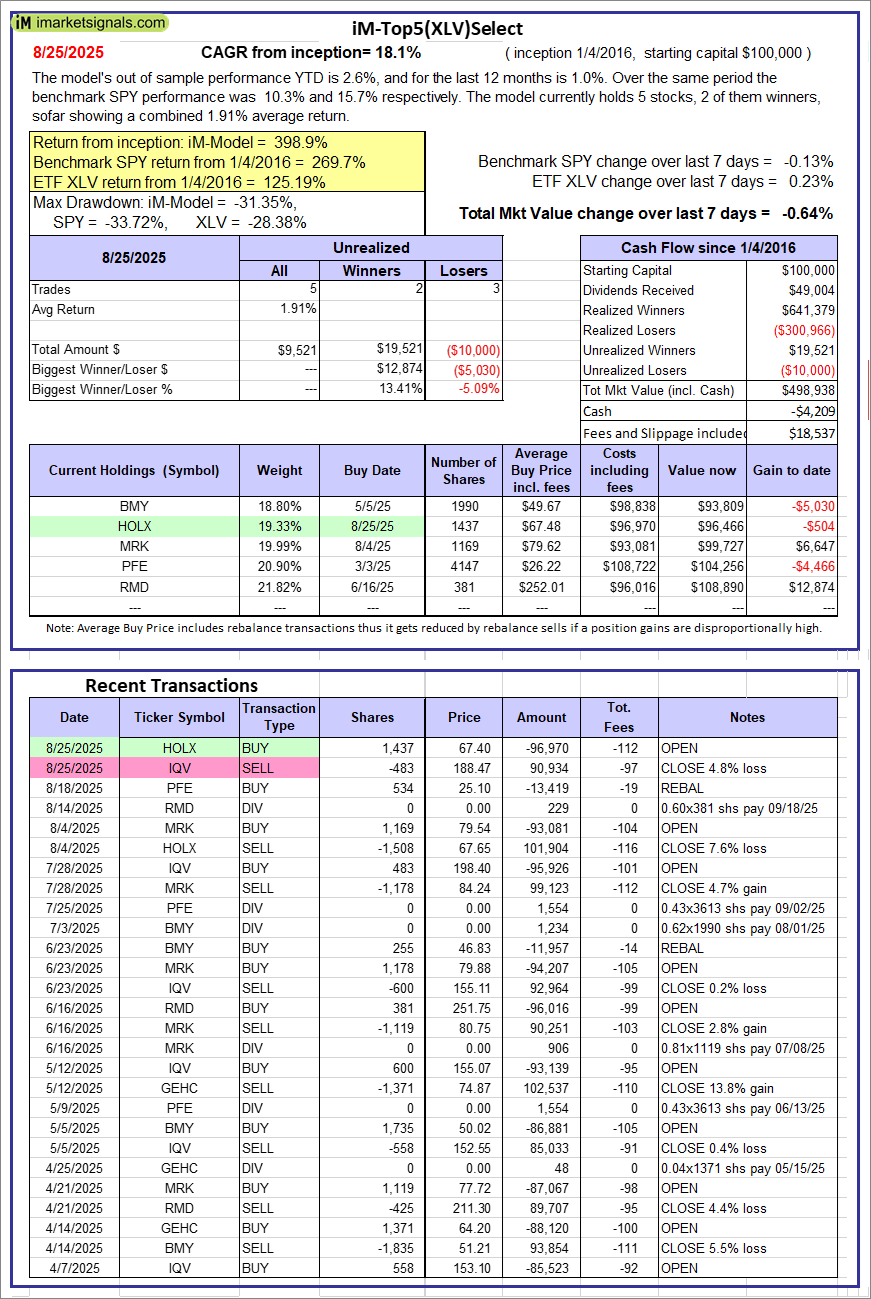 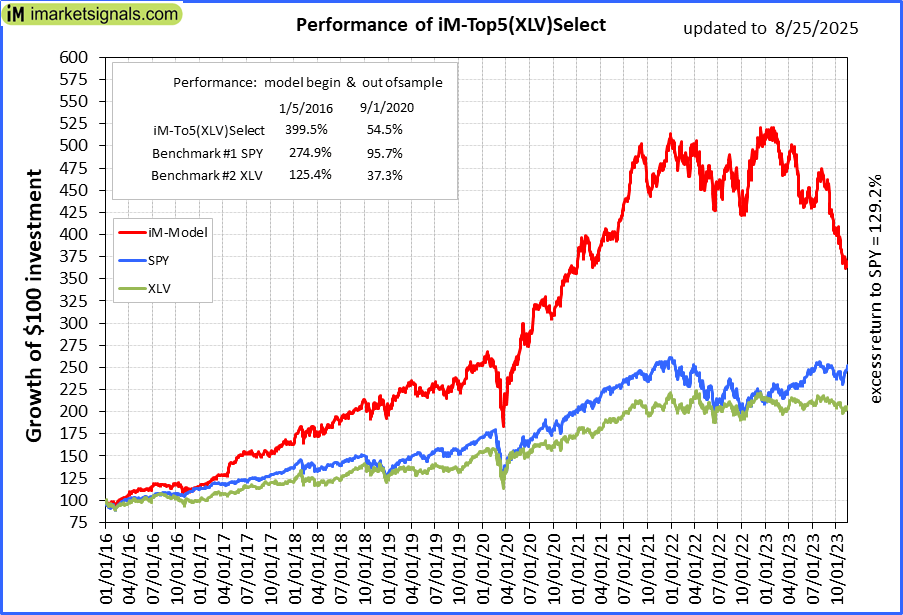 |
iM-Top5(XLV)Select: Since inception, on 1/5/2016, the model gained 398.94% while the benchmark SPY gained 269.71% over the same period. Over the previous week the market value of iM-Top5(XLV)Select gained -0.64% at a time when SPY gained -0.13%. A starting capital of $100,000 at inception on 1/5/2016 would have grown to $498,938 which includes -$4,209 cash and excludes $18,537 spent on fees and slippage. |
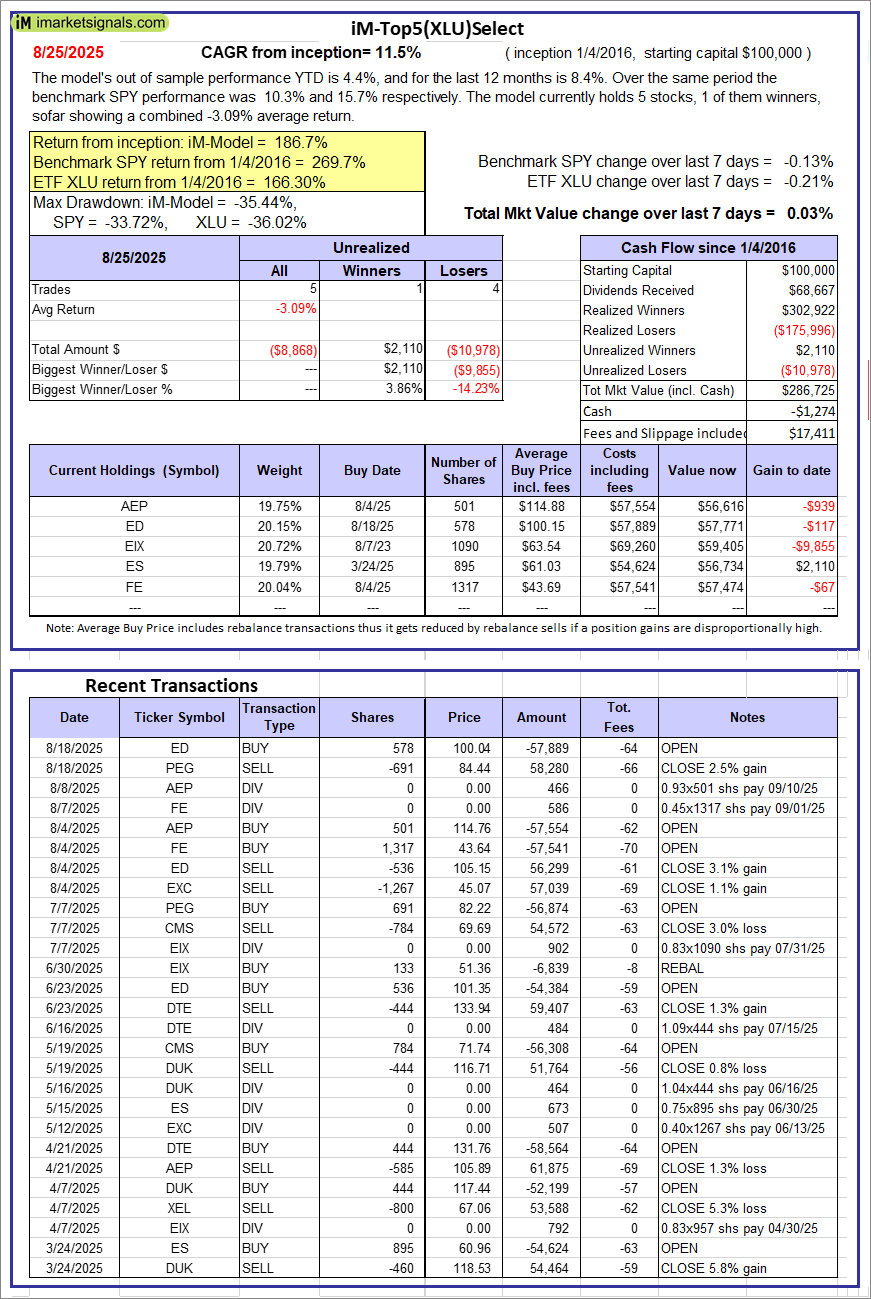 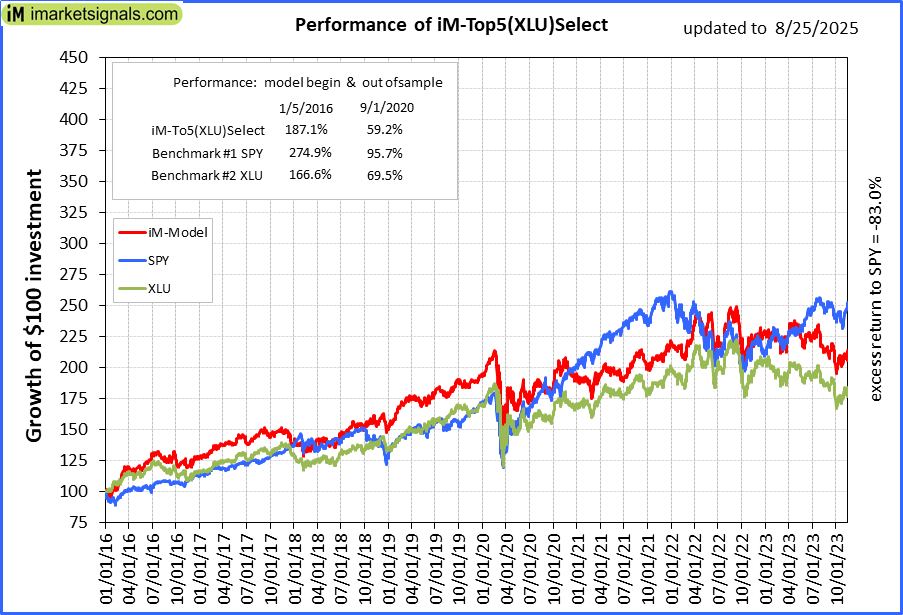 |
iM-Top5(XLU)Select: Since inception, on 1/5/2016, the model gained 186.73% while the benchmark SPY gained 269.71% over the same period. Over the previous week the market value of iM-Top5(XLU)Select gained 0.03% at a time when SPY gained -0.13%. A starting capital of $100,000 at inception on 1/5/2016 would have grown to $286,725 which includes -$1,274 cash and excludes $17,411 spent on fees and slippage. |
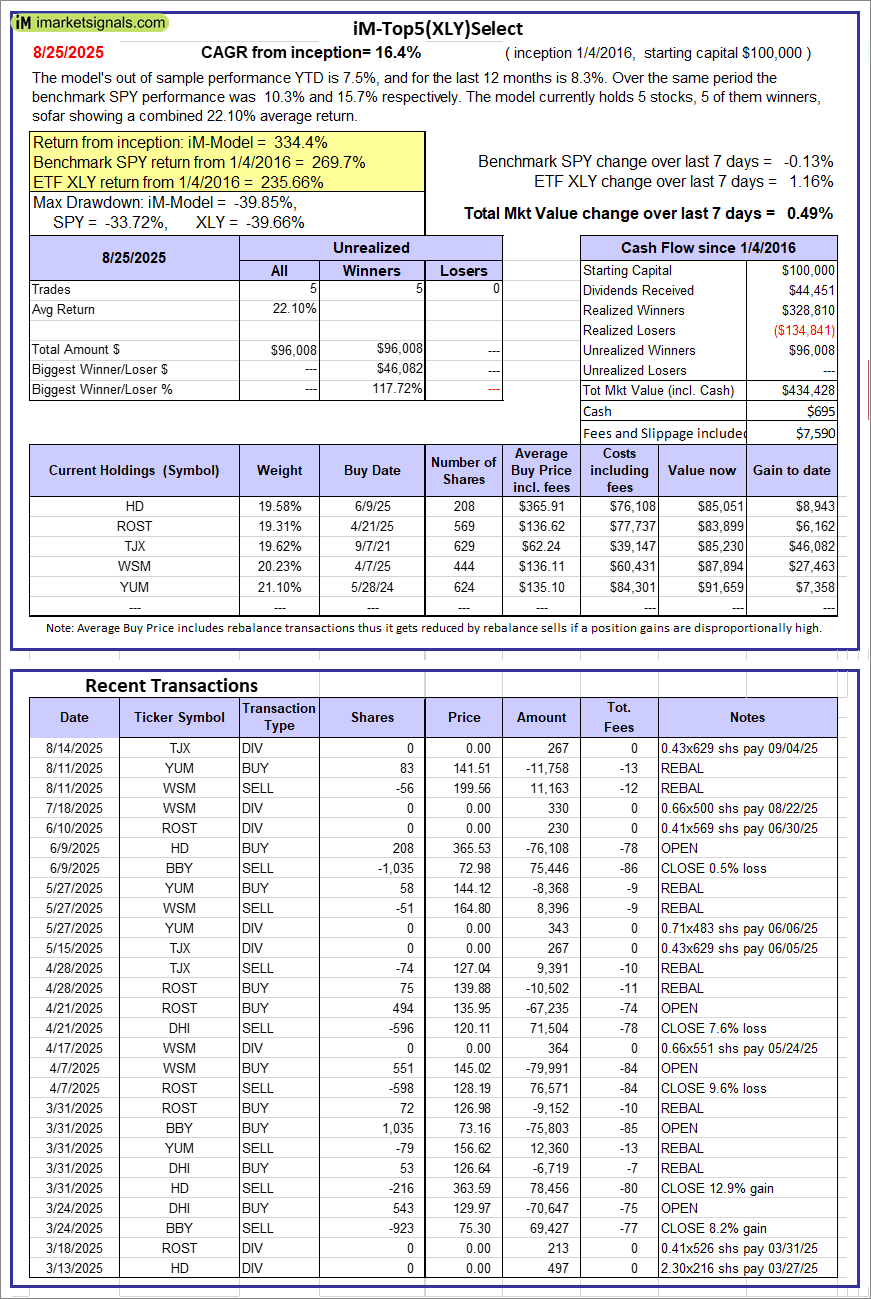 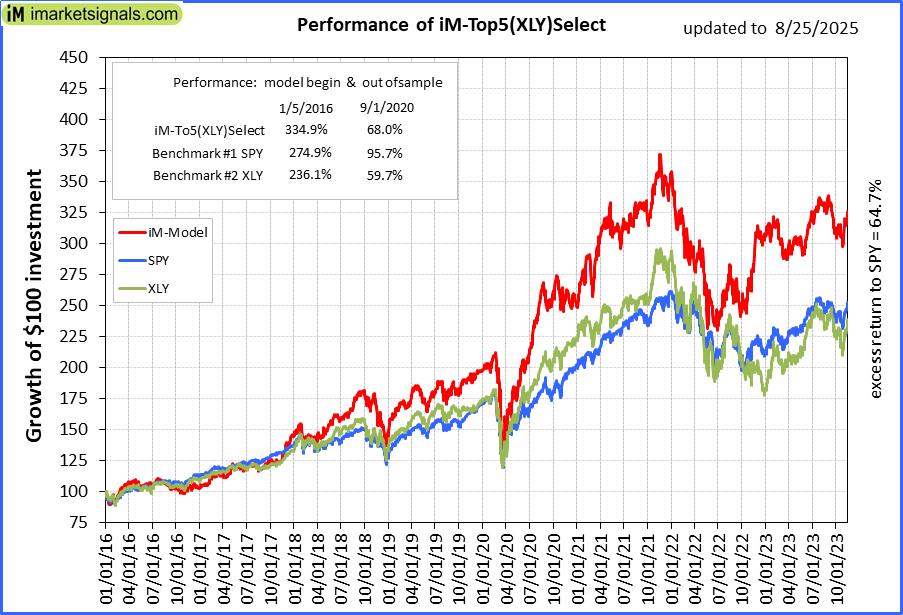 |
iM-Top5(XLY)Select: Since inception, on 1/5/2016, the model gained 334.43% while the benchmark SPY gained 269.71% over the same period. Over the previous week the market value of iM-Top5(XLY)Select gained 0.49% at a time when SPY gained -0.13%. A starting capital of $100,000 at inception on 1/5/2016 would have grown to $434,428 which includes $695 cash and excludes $7,590 spent on fees and slippage. |
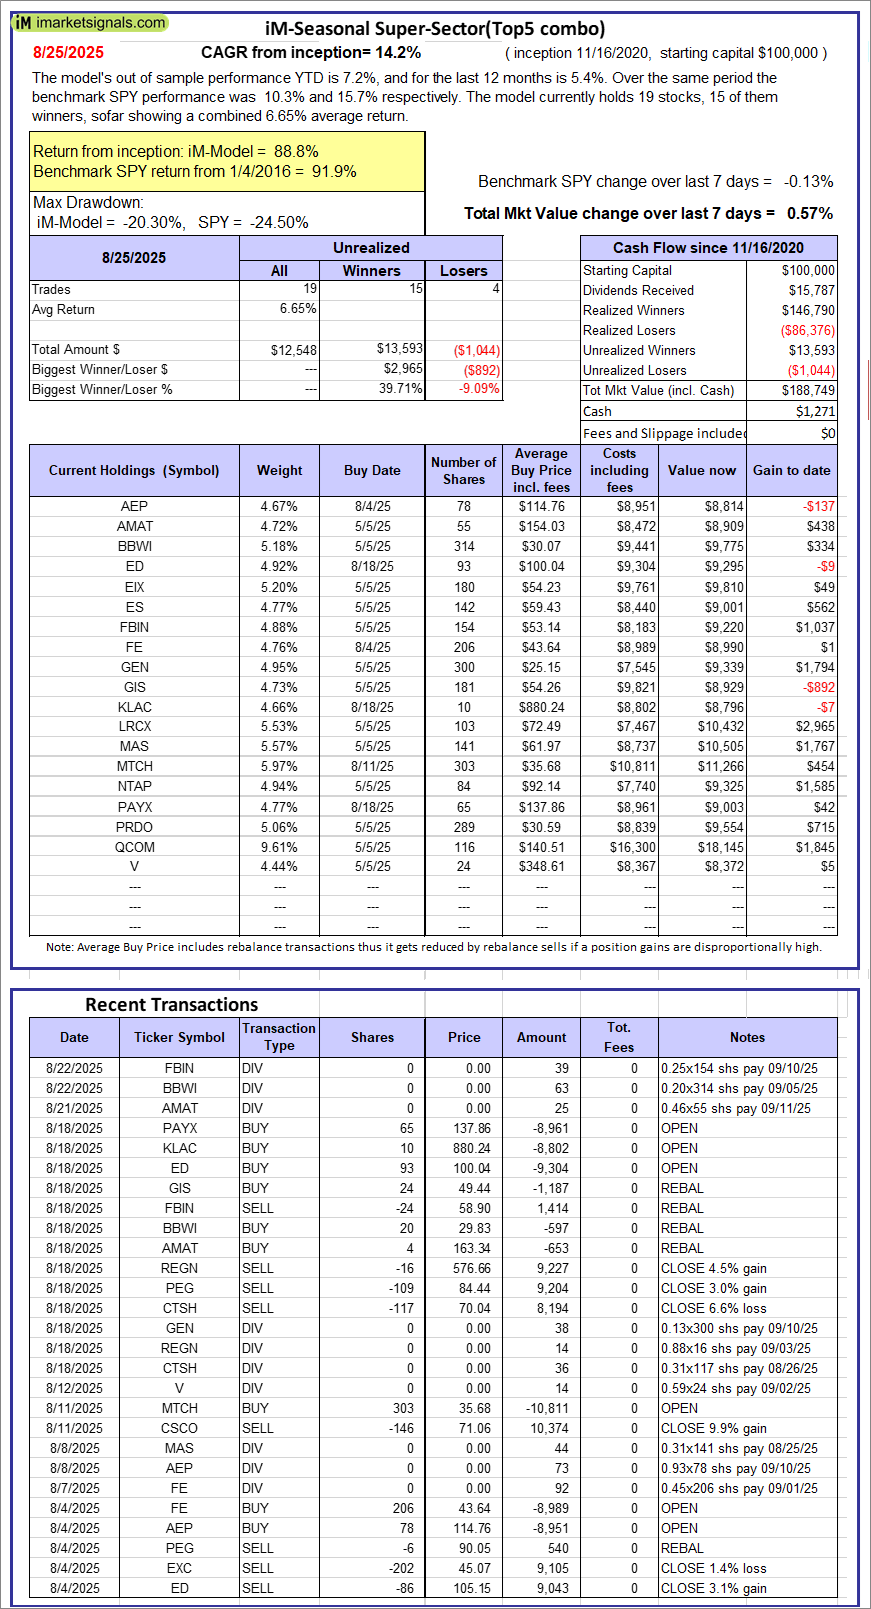 |
iM-Seasonal Super-Sectors (Top5 combo) : Since inception, on 11/17/2020, the model gained 88.75% while the benchmark SPY gained 91.92% over the same period. Over the previous week the market value of iM-Seasonal Super-Sectors (Top5 combo) gained 0.57% at a time when SPY gained -0.13%. A starting capital of $100,000 at inception on 11/17/2020 would have grown to $188,749 which includes $1,271 cash and excludes $00 spent on fees and slippage. |
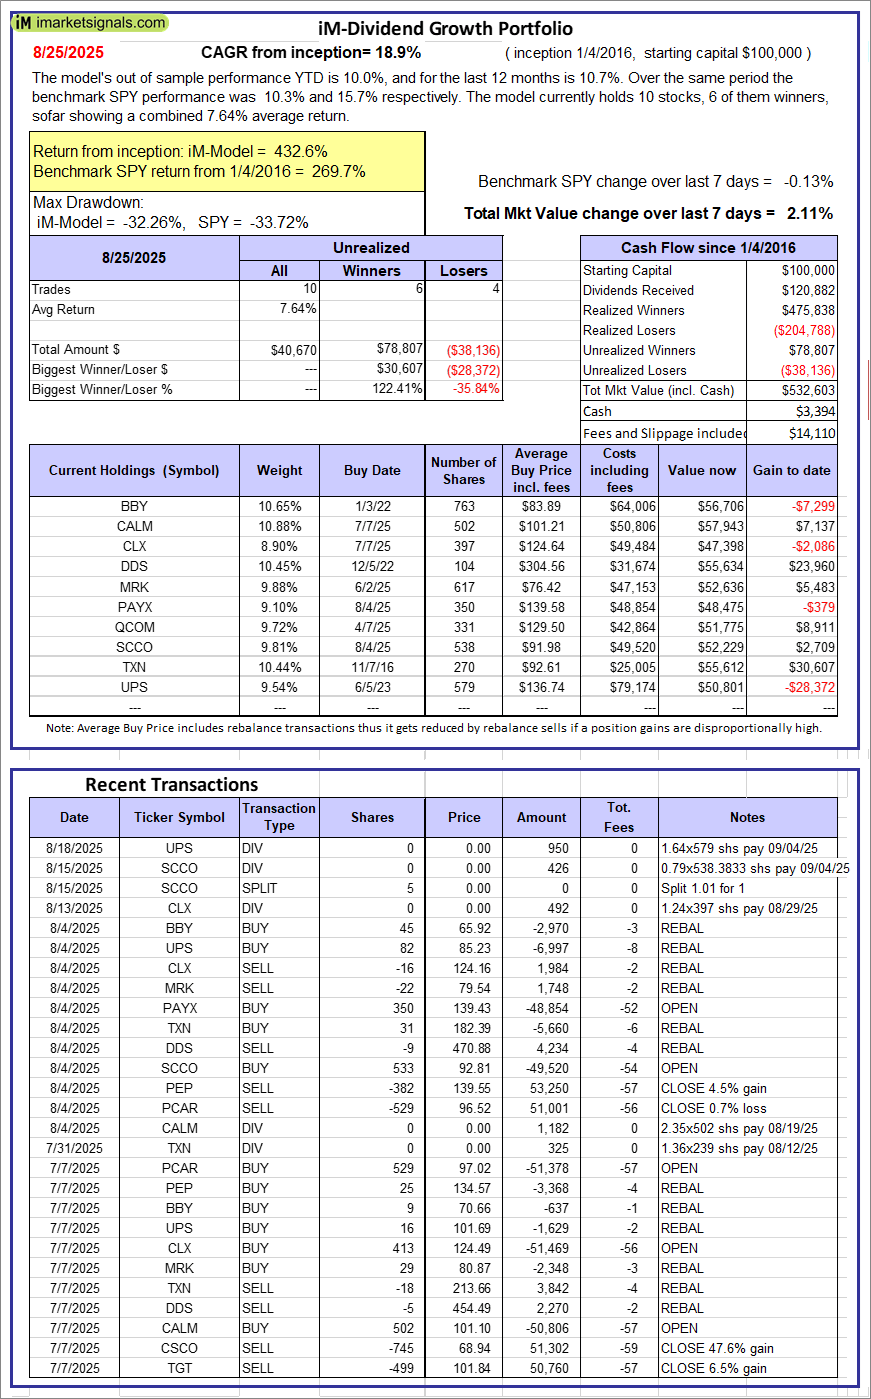 |
iM-Dividend Growth Portfolio: The model’s out of sample performance YTD is 10.0%, and for the last 12 months is 10.7%. Over the same period the benchmark SPY performance was 10.3% and 15.7% respectively. Over the previous week the market value of the iM-Dividend Growth Portfolio gained 2.11% at a time when SPY gained -0.13%. A starting capital of $100,000 at inception on 6/30/2016 would have grown to $532,603 which includes $3,394 cash and excludes $14,110 spent on fees and slippage. |
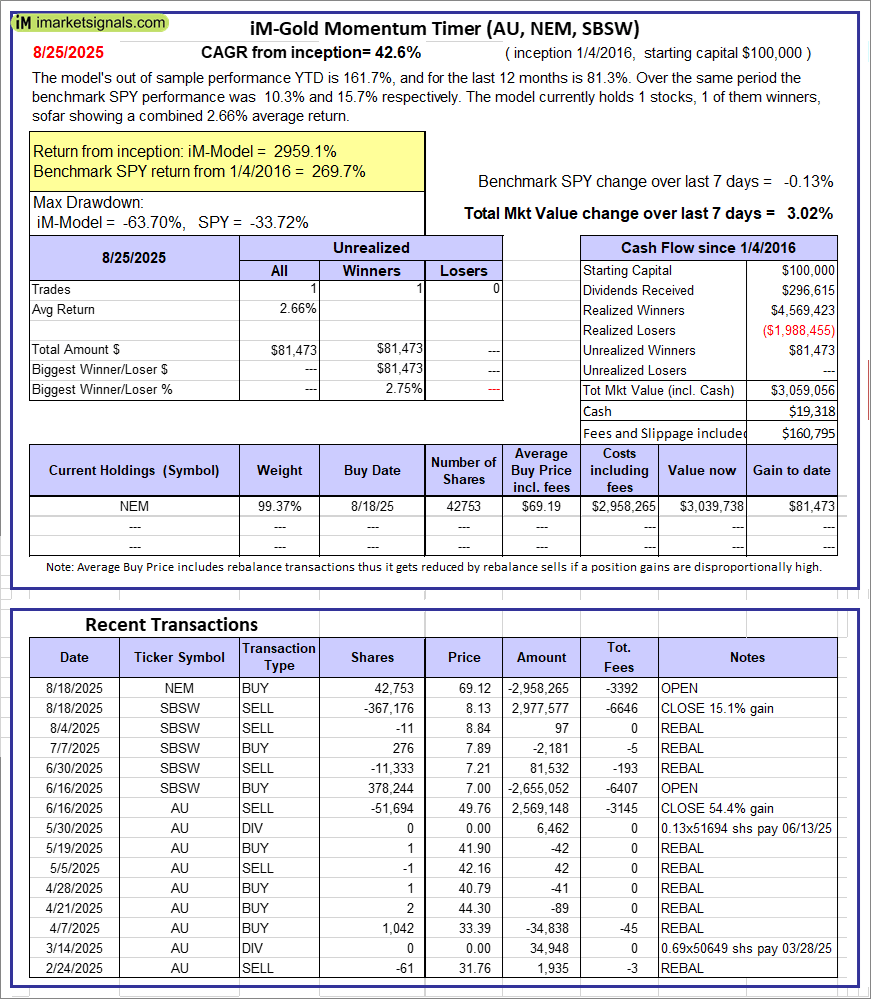 |
iM-Gold Momentum Timer (AU, NEM, SBSW): The model’s out of sample performance YTD is 161.7%, and for the last 12 months is 81.3%. Over the same period the benchmark SPY performance was 10.3% and 15.7% respectively. Over the previous week the market value of iM-Gold Momentum Timer (AU, NEM, SBSW) gained 3.02% at a time when SPY gained -0.13%. A starting capital of $100,000 at inception on 6/30/2016 would have grown to $19,318 which includes $160,795 cash and excludes Gain to date spent on fees and slippage. |
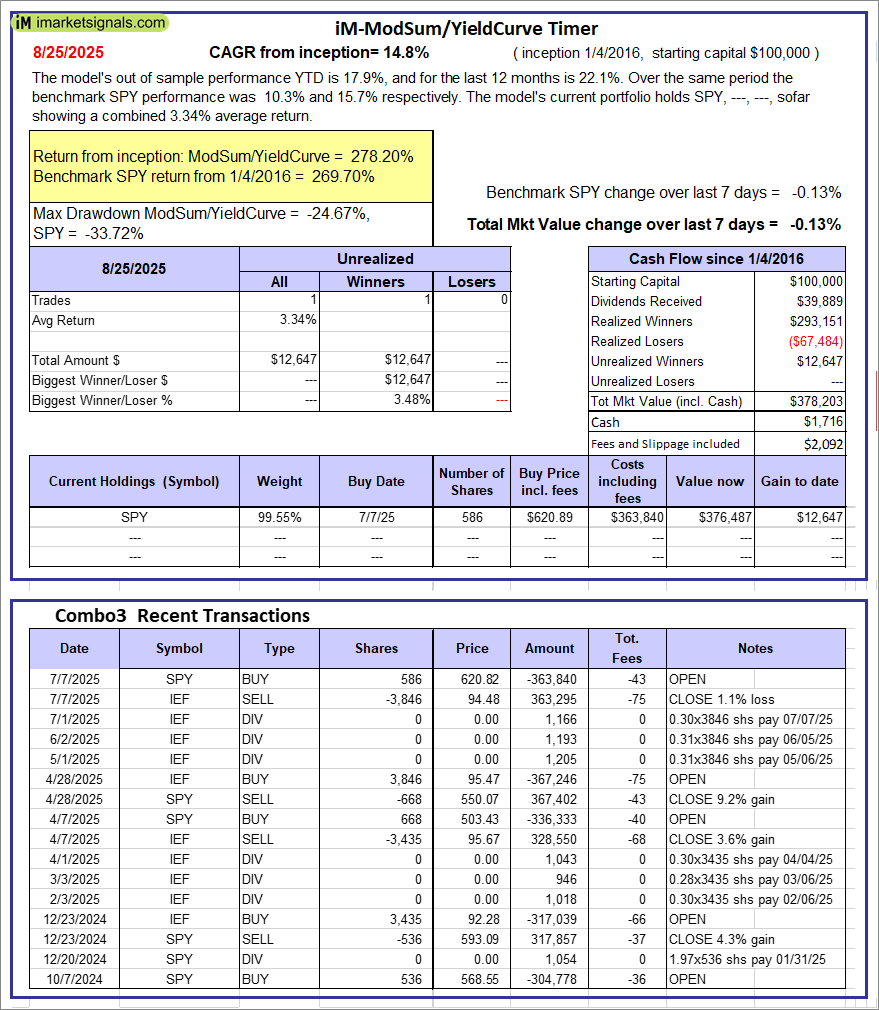 |
iM-ModSum/YieldCurve Timer: The model’s out of sample performance YTD is 17.9%, and for the last 12 months is 22.1%. Over the same period the benchmark SPY performance was 10.3% and 15.7% respectively. Over the previous week the market value of iM-PortSum/YieldCurve Timer gained -0.13% at a time when SPY gained -0.13%. A starting capital of $100,000 at inception on 1/1/2016 would have grown to $378,203 which includes $1,716 cash and excludes $2,092 spent on fees and slippage. |
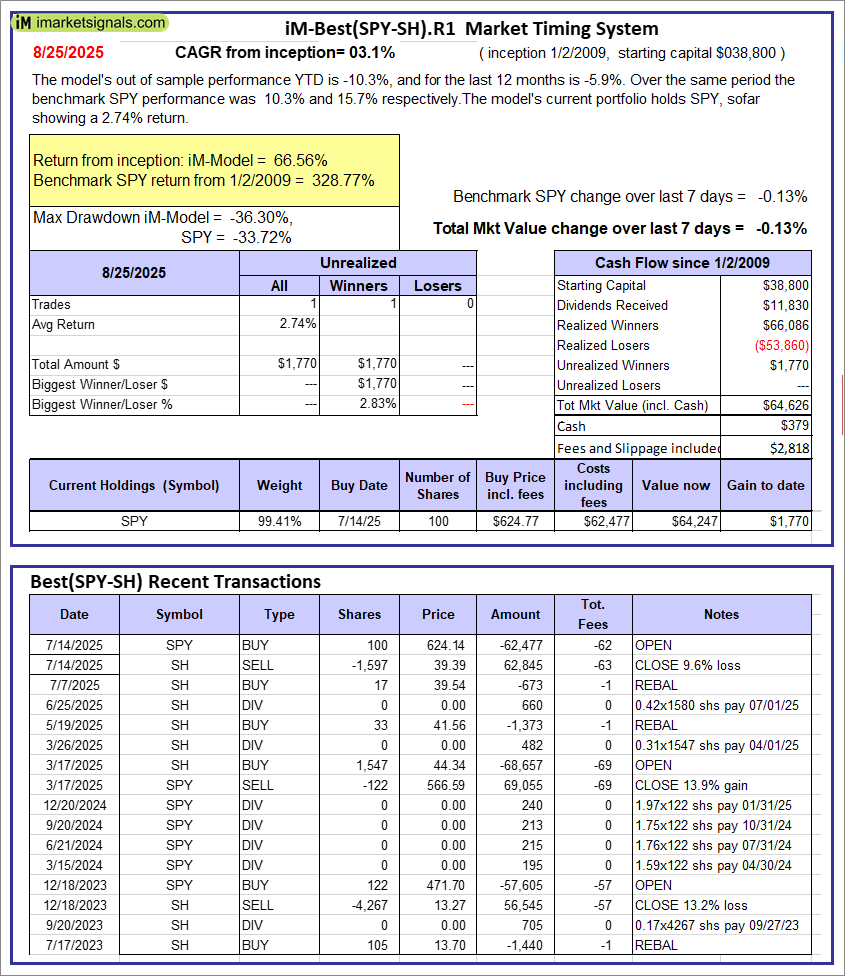 |
iM-Best(SPY-SH).R1: The model’s out of sample performance YTD is -10.3%, and for the last 12 months is -5.9%. Over the same period the benchmark SPY performance was 10.3% and 15.7% respectively. Over the previous week the market value of Best(SPY-SH) gained -0.13% at a time when SPY gained -0.13%. A starting capital of $100,000 at inception on 1/2/2009 would have grown to $64,626 which includes $379 cash and excludes $2,818 spent on fees and slippage. |
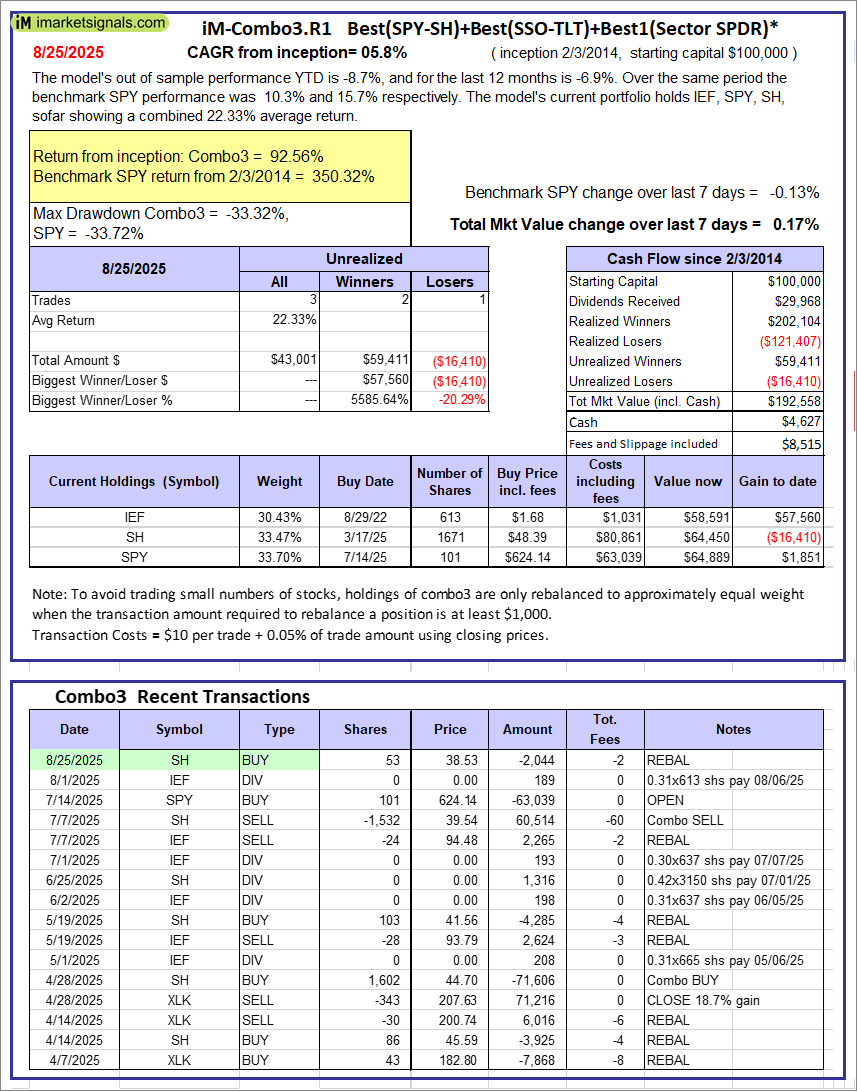 |
iM-Combo3.R1: The model’s out of sample performance YTD is -8.7%, and for the last 12 months is -6.9%. Over the same period the benchmark SPY performance was 10.3% and 15.7% respectively. Over the previous week the market value of iM-Combo3.R1 gained 0.17% at a time when SPY gained -0.13%. A starting capital of $100,000 at inception on 2/3/2014 would have grown to $192,558 which includes $4,627 cash and excludes $8,515 spent on fees and slippage. |
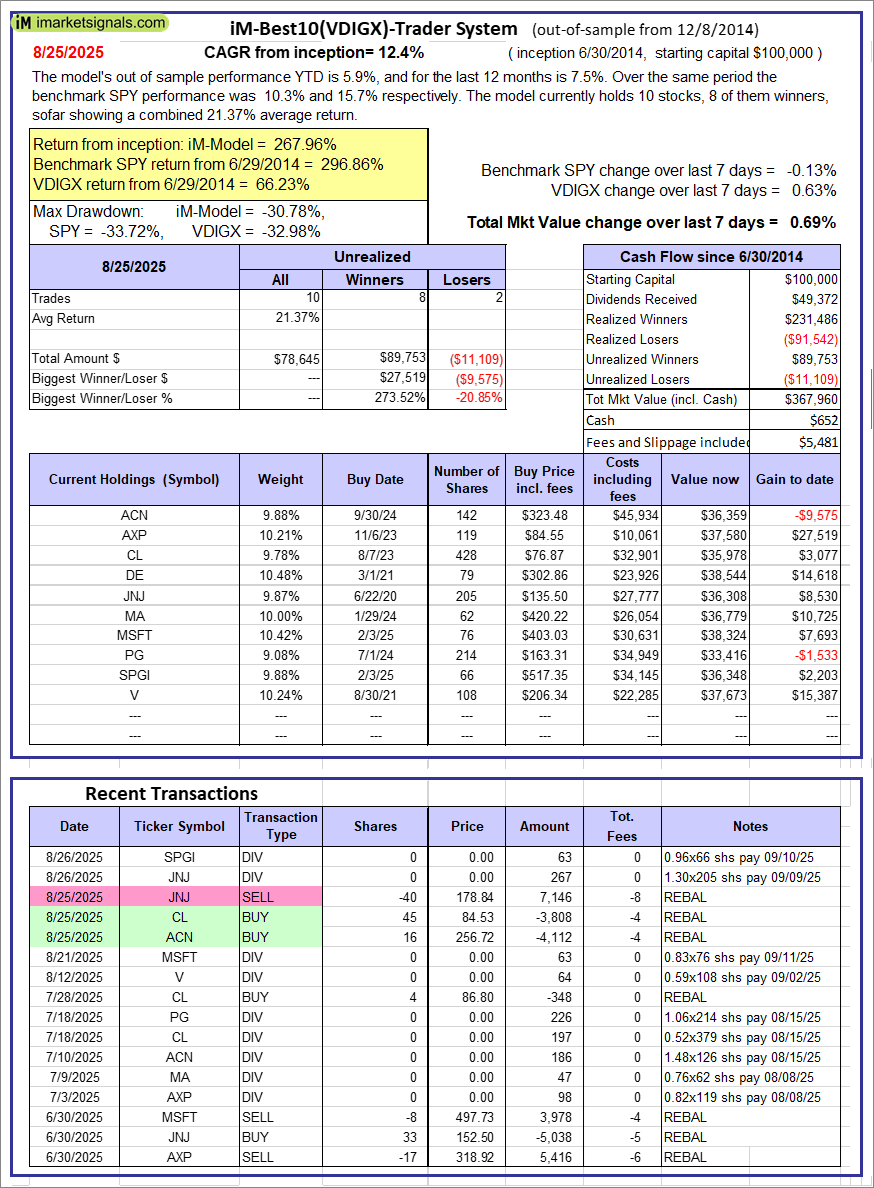 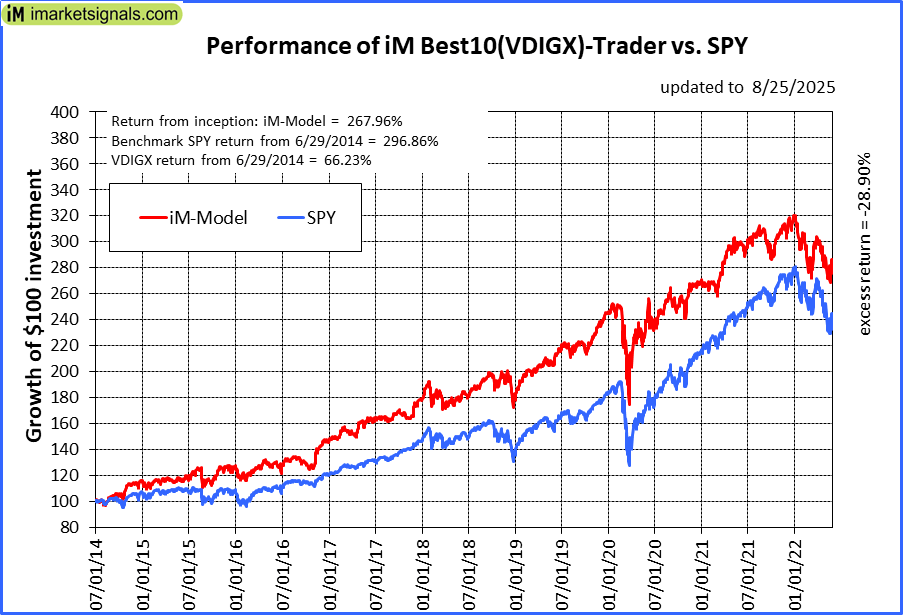 |
iM-Best10(VDIGX)-Trader: The model’s out of sample performance YTD is 5.9%, and for the last 12 months is 7.5%. Over the same period the benchmark SPY performance was 10.3% and 15.7% respectively. Since inception, on 7/1/2014, the model gained 267.96% while the benchmark SPY gained 296.86% and VDIGX gained 66.23% over the same period. Over the previous week the market value of iM-Best10(VDIGX) gained 0.69% at a time when SPY gained -0.13%. A starting capital of $100,000 at inception on 7/1/2014 would have grown to $367,960 which includes $652 cash and excludes $5,481 spent on fees and slippage. |
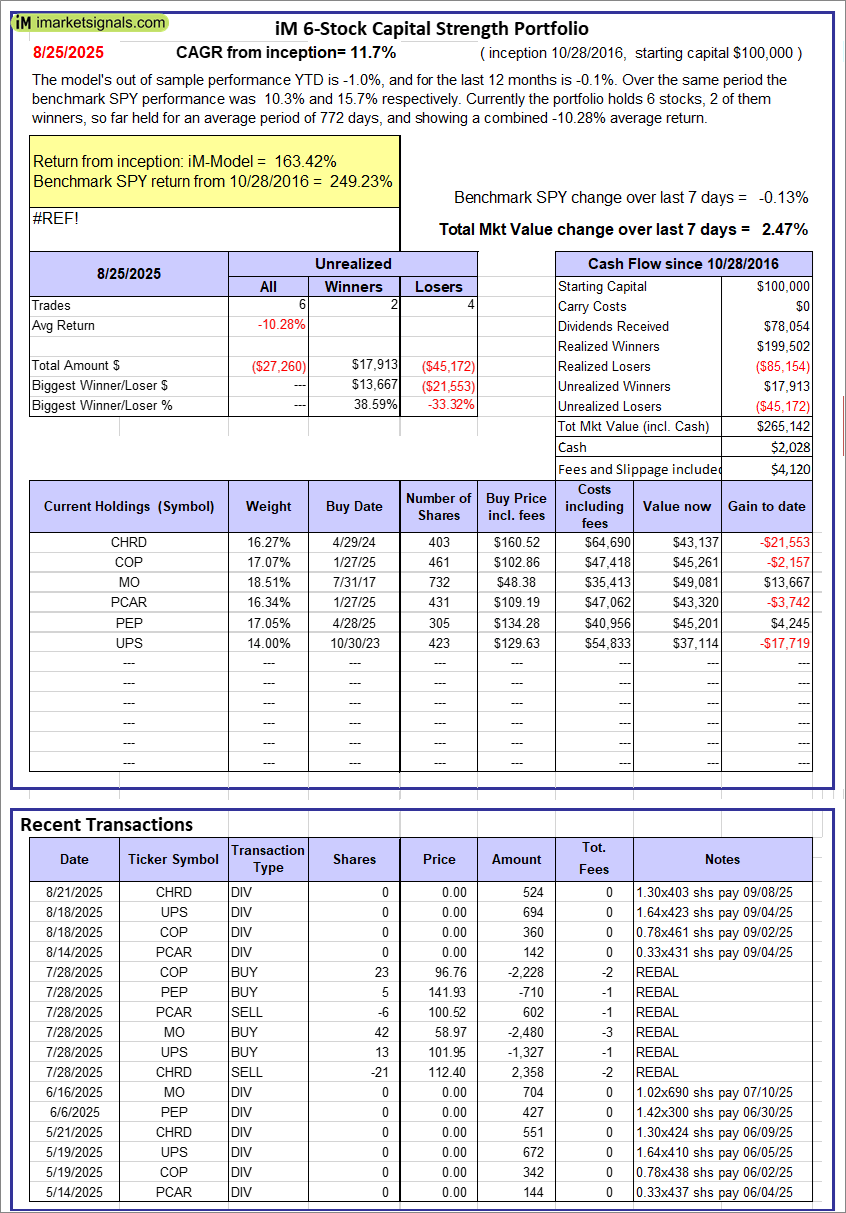 |
iM 6-Stock Capital Strength Portfolio: The model’s out of sample performance YTD is -1.0%, and for the last 12 months is -0.1%. Over the same period the benchmark SPY performance was 10.3% and 15.7% respectively. Over the previous week the market value of the iM 6-Stock Capital Strength Portfolio gained 2.47% at a time when SPY gained -0.13%. A starting capital of $100,000 at inception on 10/28/2016 would have grown to $265,142 which includes $2,028 cash and excludes $4,120 spent on fees and slippage. |
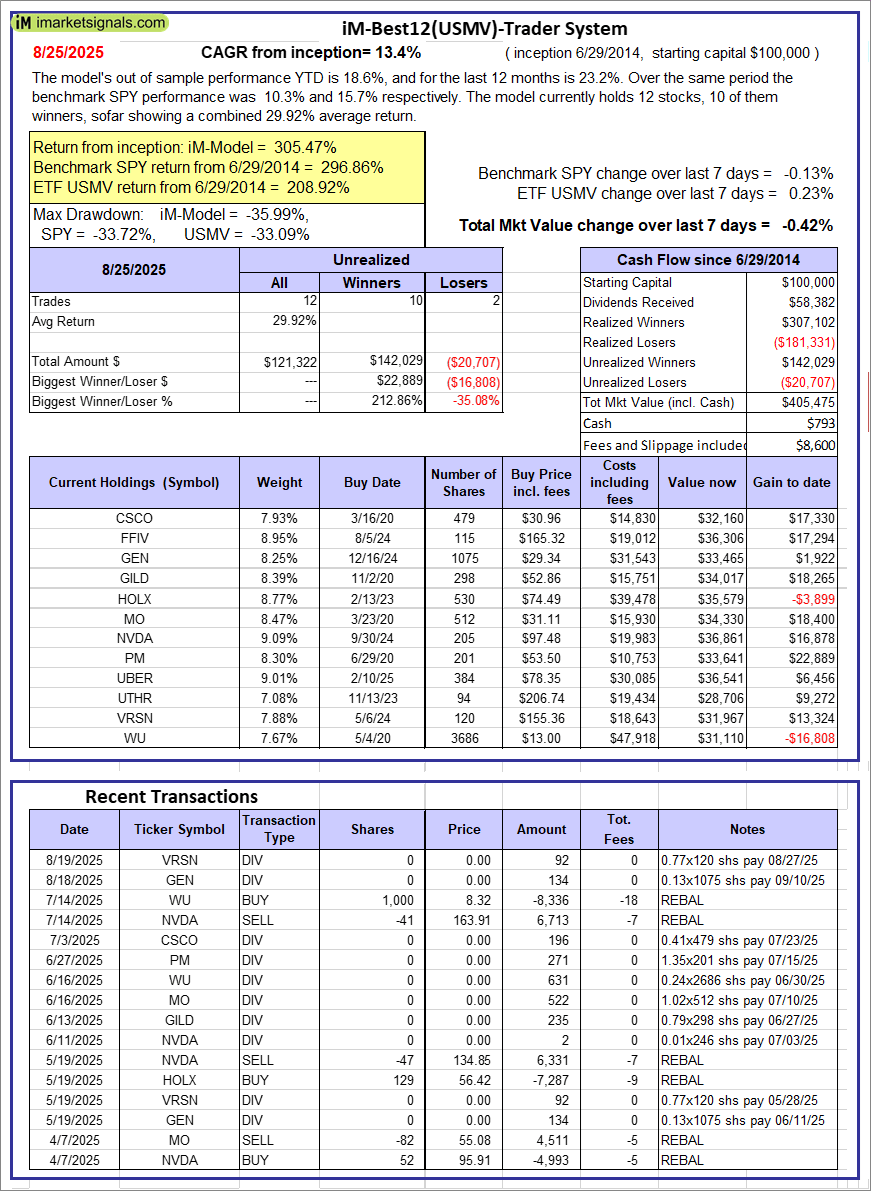 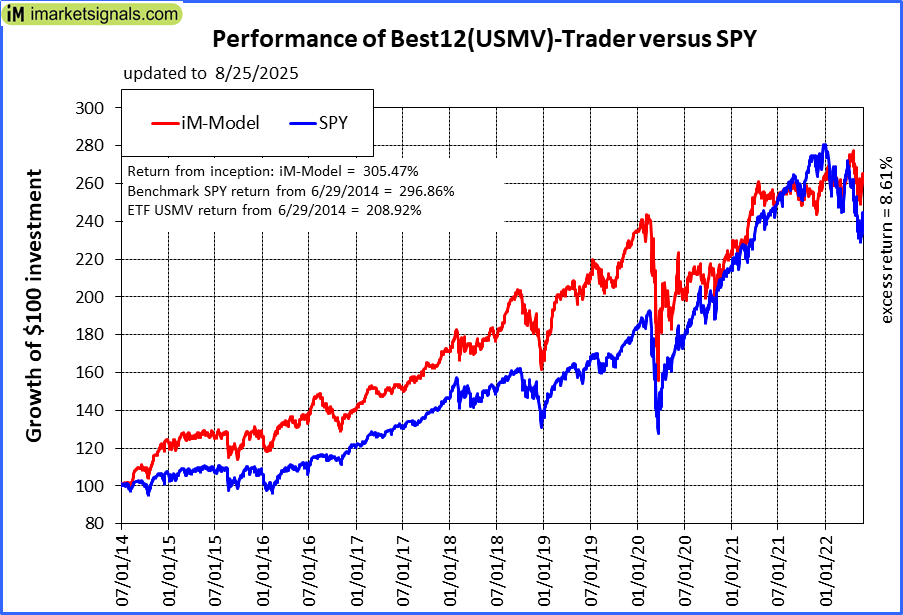 |
iM-Best12(USMV)-Trader: The model’s out of sample performance YTD is 18.6%, and for the last 12 months is 23.2%. Over the same period the benchmark SPY performance was 10.3% and 15.7% respectively. Since inception, on 6/30/2014, the model gained 305.47% while the benchmark SPY gained 296.86% and the ETF USMV gained 208.92% over the same period. Over the previous week the market value of iM-Best12(USMV)-Trader gained -0.42% at a time when SPY gained -0.13%. A starting capital of $100,000 at inception on 6/30/2014 would have grown to $405,475 which includes $793 cash and excludes $8,600 spent on fees and slippage. |
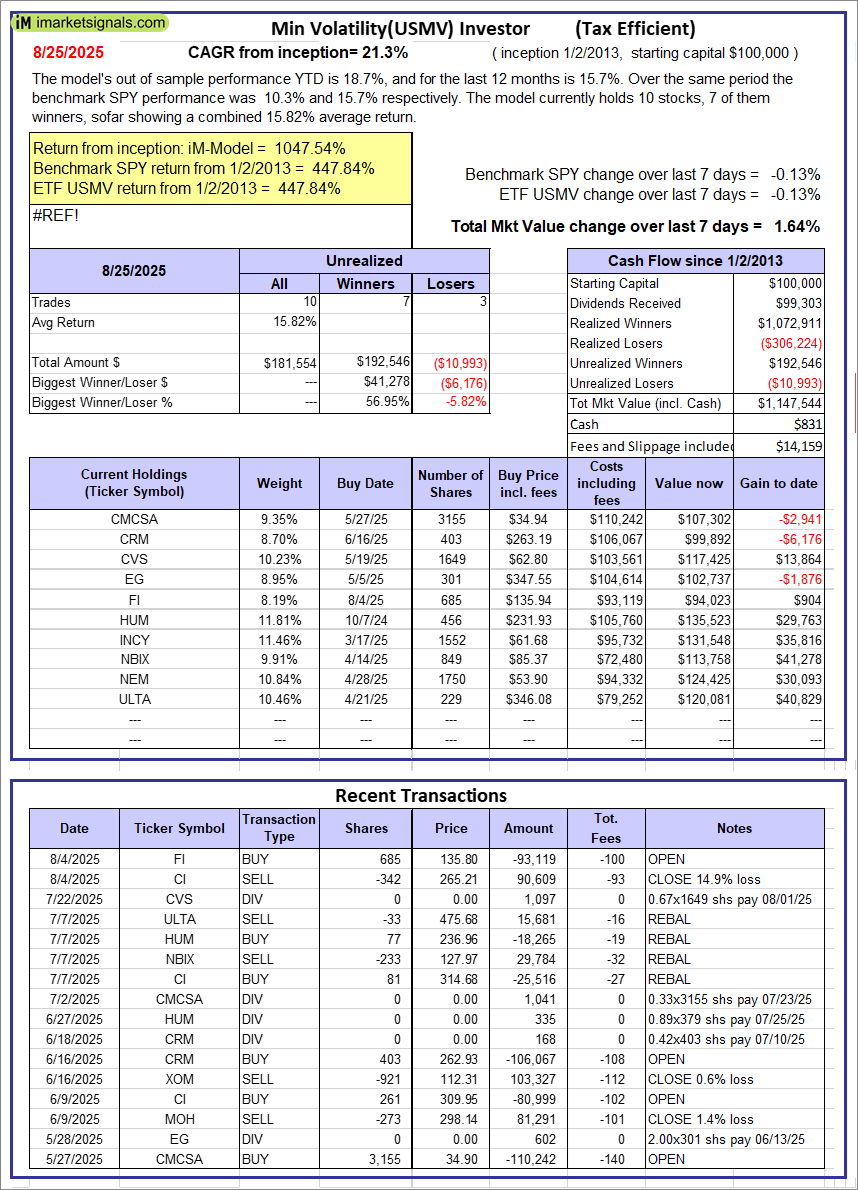 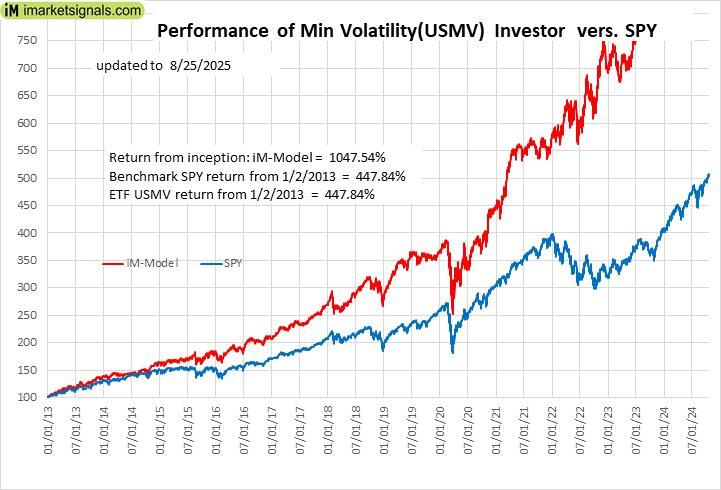 |
iM-Min Volatility(USMV) Investor (Tax Efficient): The model’s out of sample performance YTD is 18.7%, and for the last 12 months is 15.7%. Over the same period the benchmark SPY performance was 10.3% and 15.7% respectively. Since inception, on 1/3/2013, the model gained 1047.54% while the benchmark SPY gained 447.84% and the ETF USMV gained 447.84% over the same period. Over the previous week the market value of iM-Best12(USMV)Q1 gained 1.64% at a time when SPY gained -0.13%. A starting capital of $100,000 at inception on 1/3/2013 would have grown to $1,147,544 which includes $831 cash and excludes $14,159 spent on fees and slippage. |
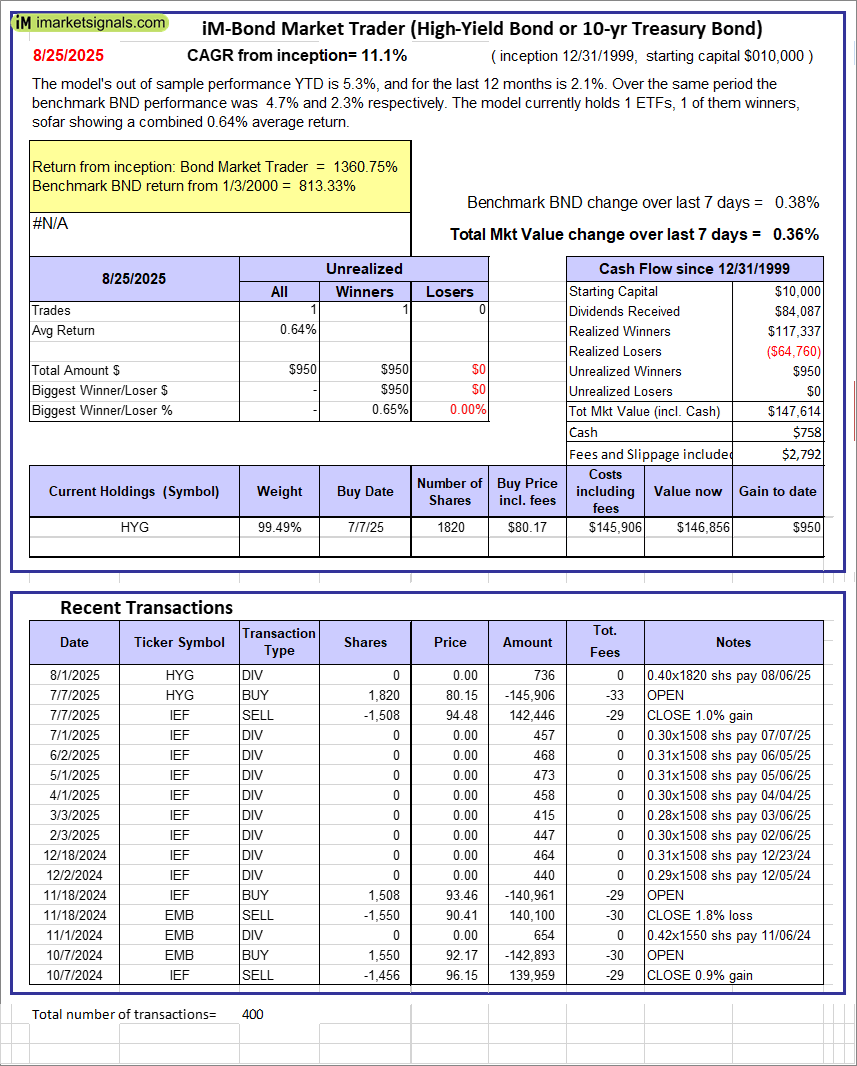 |
iM-Bond Market Trader (High-Yield Bond or 10-yr Treasury Bond): The model’s out of sample performance YTD is 5.3%, and for the last 12 months is 2.1%. Over the same period the benchmark BND performance was 4.7% and 2.3% respectively. Over the previous week the market value of the iM-Bond Market Trader (High-Yield Bond or 10-yr Treasury Bond) gained 0.36% at a time when BND gained 0.38%. A starting capital of $10,000 at inception on 1/3/2000 would have grown to $147,614 which includes $758 cash and excludes $2,792 spent on fees and slippage. |
|
|
iM-ModSum/YieldCurve Timer: The model’s out of sample performance YTD is 17.9%, and for the last 12 months is 22.1%. Over the same period the benchmark SPY performance was 10.3% and 15.7% respectively. Over the previous week the market value of iM-PortSum/YieldCurve Timer gained -0.13% at a time when SPY gained -0.13%. A starting capital of $100,000 at inception on 1/1/2016 would have grown to $378,203 which includes $1,716 cash and excludes $2,092 spent on fees and slippage. |
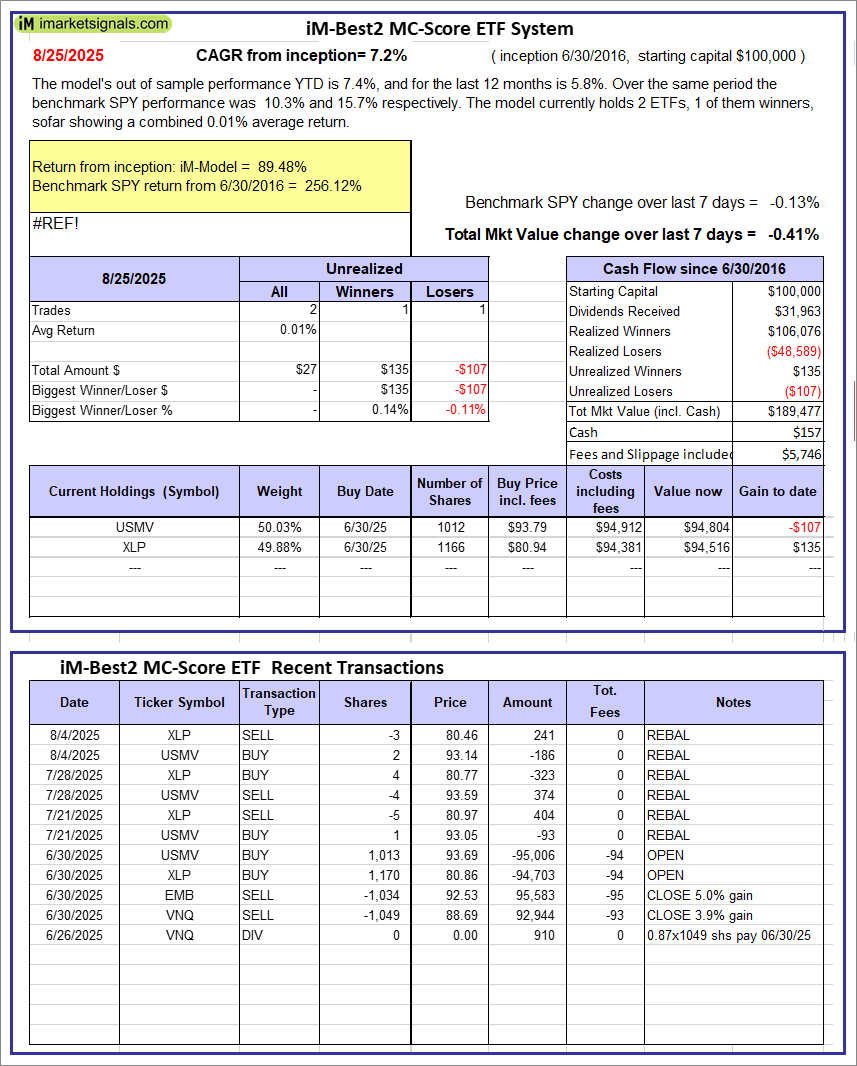 |
iM-Best2 MC-Score ETF System: The model’s out of sample performance YTD is 7.4%, and for the last 12 months is 5.8%. Over the same period the benchmark SPY performance was 10.3% and 15.7% respectively. Over the previous week the market value of the iM-Best2 MC-Score ETF System gained -0.41% at a time when SPY gained -0.13%. A starting capital of $100,000 at inception on 6/30/2016 would have grown to $189,477 which includes $157 cash and excludes $5,746 spent on fees and slippage. |
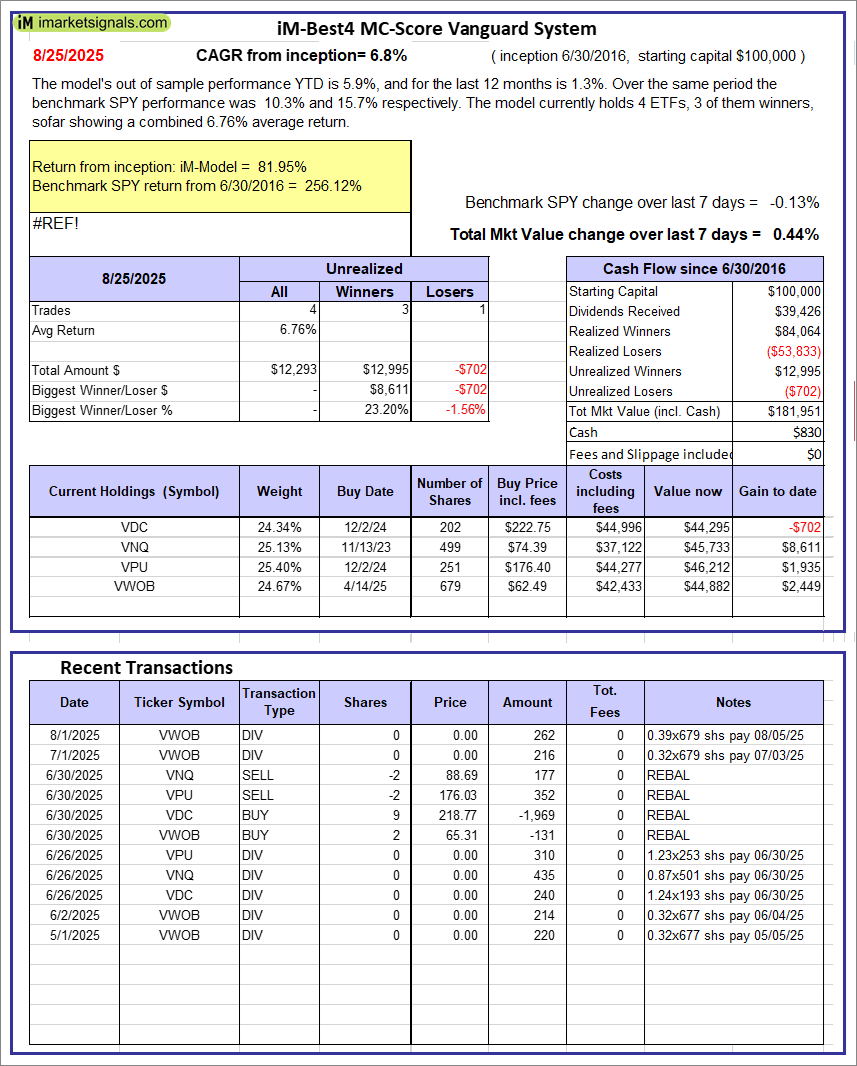 |
iM-Best4 MC-Score Vanguard System: The model’s out of sample performance YTD is 5.9%, and for the last 12 months is 1.3%. Over the same period the benchmark SPY performance was 10.3% and 15.7% respectively. Over the previous week the market value of the iM-Best4 MC-Score Vanguard System gained 0.44% at a time when SPY gained -0.13%. A starting capital of $100,000 at inception on 6/30/2016 would have grown to $181,951 which includes $830 cash and excludes $00 spent on fees and slippage. |
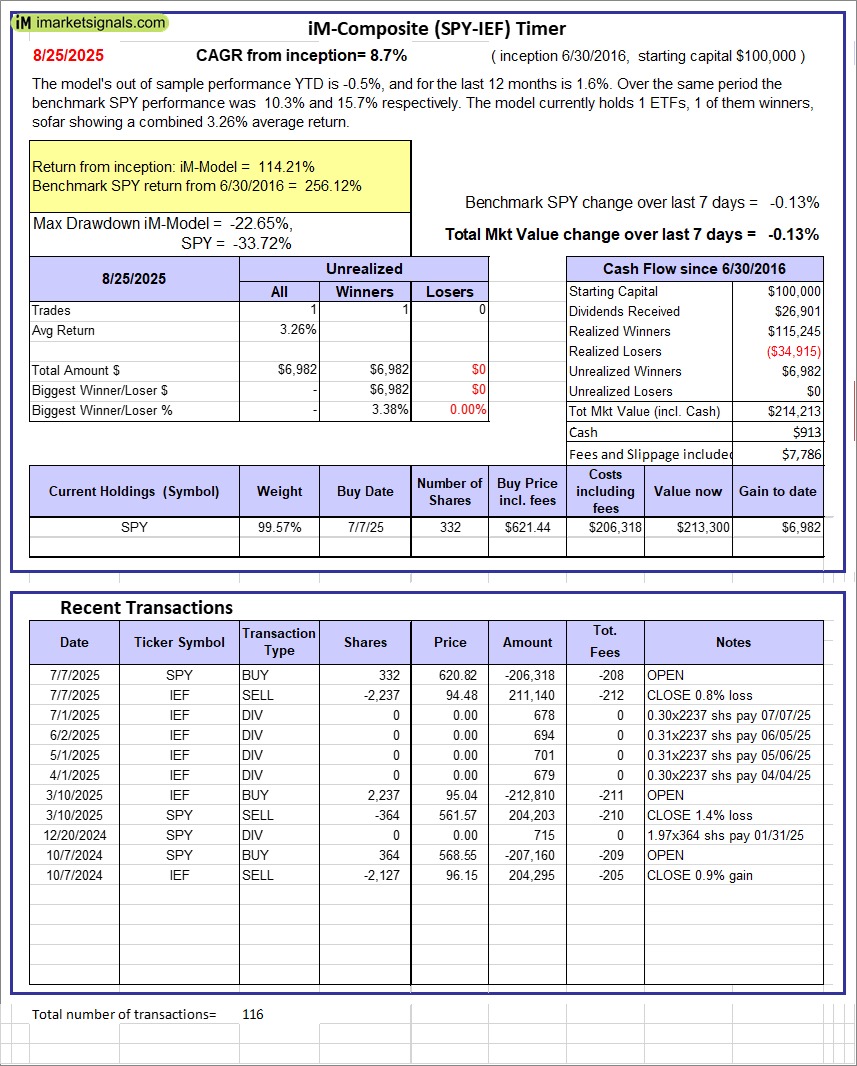 |
iM-Composite (SPY-IEF) Timer: The model’s out of sample performance YTD is -0.5%, and for the last 12 months is 1.6%. Over the same period the benchmark SPY performance was 10.3% and 15.7% respectively. Over the previous week the market value of the iM-Composite (SPY-IEF) Timer gained -0.13% at a time when SPY gained -0.13%. A starting capital of $100,000 at inception on 6/30/2016 would have grown to $214,213 which includes $913 cash and excludes $7,786 spent on fees and slippage. |
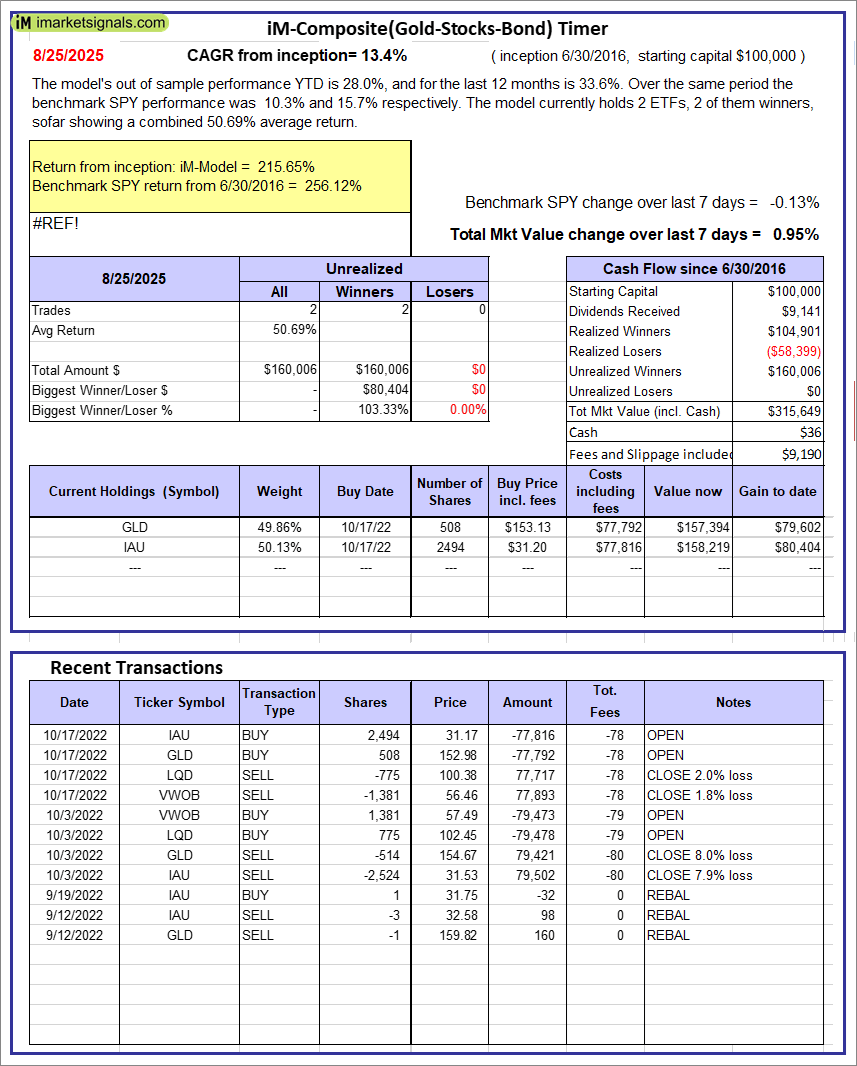 |
iM-Composite(Gold-Stocks-Bond) Timer: The model’s out of sample performance YTD is 28.0%, and for the last 12 months is 33.6%. Over the same period the benchmark SPY performance was 10.3% and 15.7% respectively. Over the previous week the market value of the iM-Composite(Gold-Stocks-Bond) Timer gained 0.95% at a time when SPY gained -0.13%. A starting capital of $100,000 at inception on 6/30/2016 would have grown to $315,649 which includes $36 cash and excludes $9,190 spent on fees and slippage. |
iM-Best Reports – 8/25/2025
Posted in pmp SPY-SH
Leave a Reply
You must be logged in to post a comment.