
  |
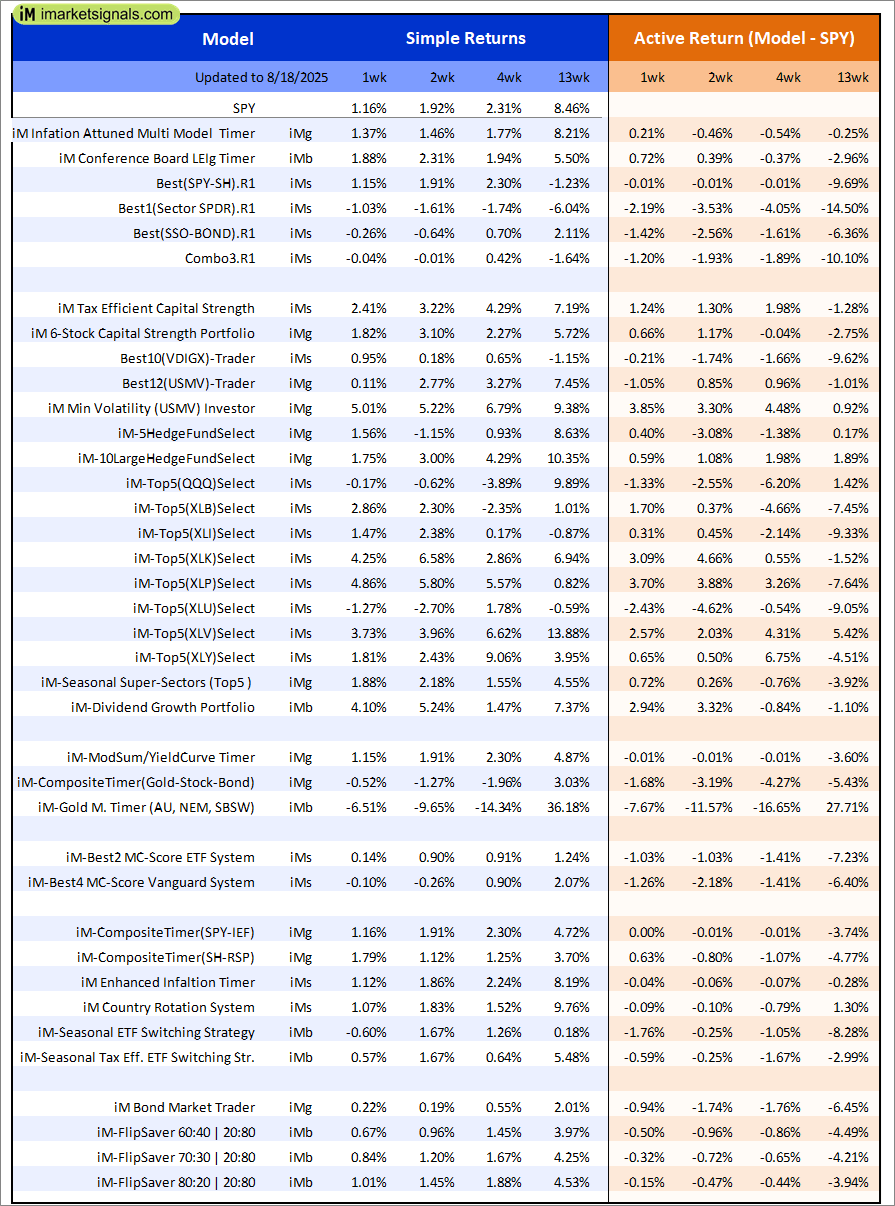
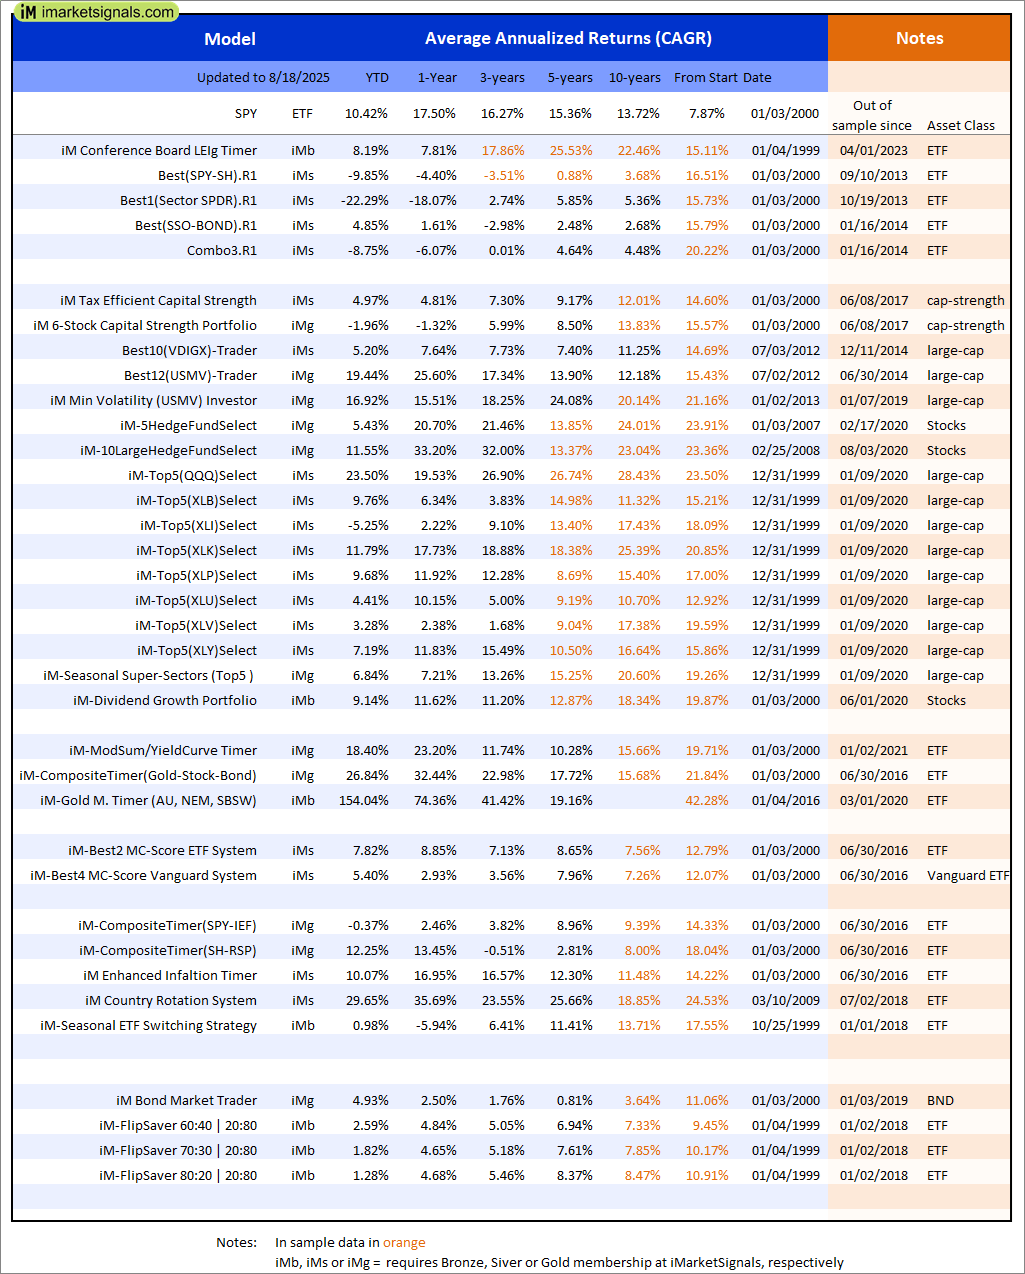
Out of sample performance summary of our models for the past 1, 2, 4 and 13 week periods. The active active return indicates how the models over- or underperformed the benchmark ETF SPY. Also the YTD, and the 1-, 3-, 5- and 10-year annualized returns are shown in the second table |
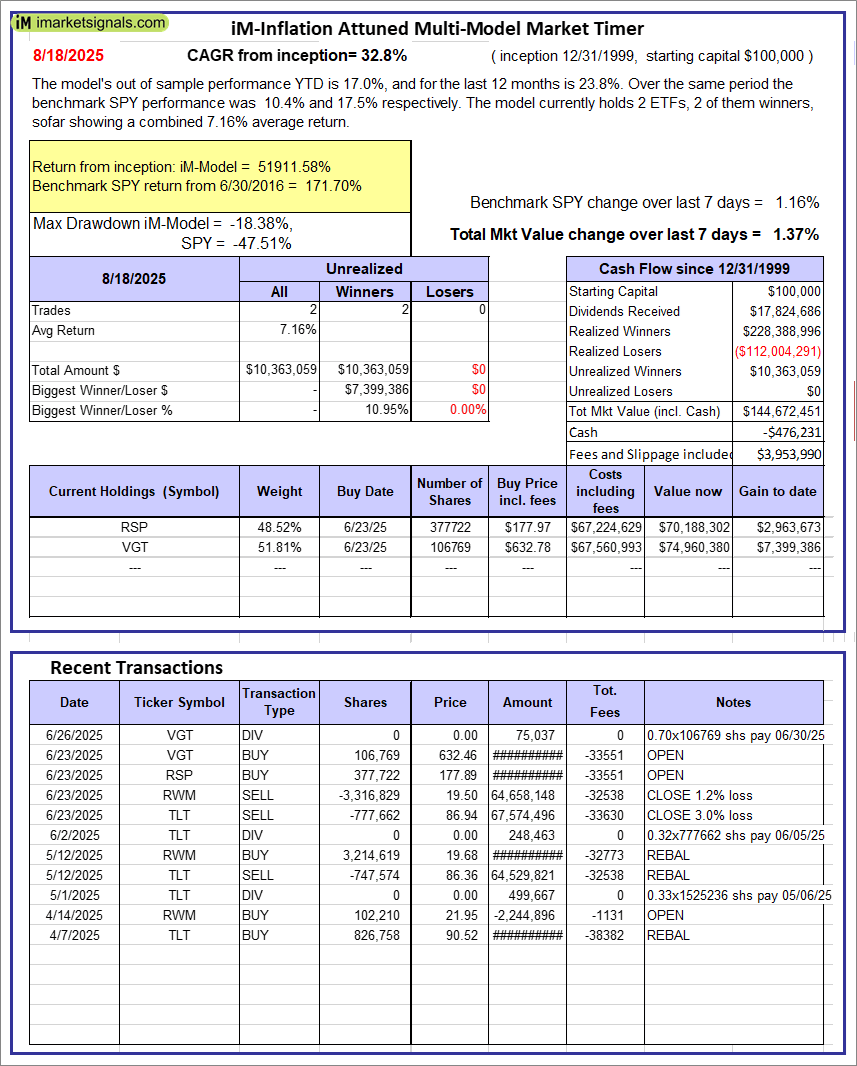 |
iM-Inflation Attuned Multi-Model Market Timer: The model’s out of sample performance YTD is 17.0%, and for the last 12 months is 23.8%. Over the same period the benchmark SPY performance was 10.4% and 17.5% respectively. Over the previous week the market value of the iM-Inflation Attuned Multi-Model Market Timer gained 1.37% at a time when SPY gained 1.16%. A starting capital of $100,000 at inception on 3/24/2017 would have grown to $144,672,451 which includes -$476,231 cash and excludes $3,953,990 spent on fees and slippage. |
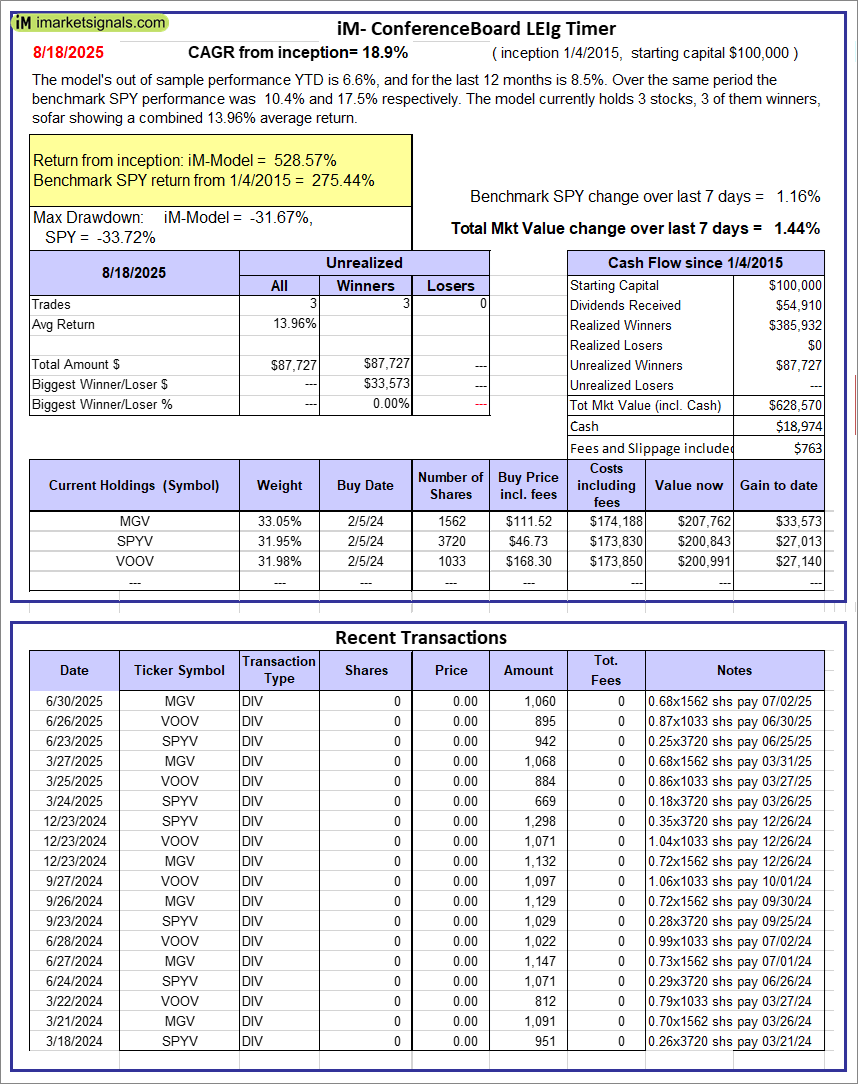 |
iM-Conference Board LEIg Timer: The model’s performance YTD is 14.3%, and for the last 12 months is 7.3%. Over the same period the benchmark SPY performance was 20.1% and 9.4% respectively. Over the previous week the market value of the iM-Conference Board LEIg Timer gained 1.44% at a time when SPY gained 1.16%. A starting capital of $100,000 at inception on 4/5/2017 would have grown to $628,570 which includes $18,974 cash and excludes $763 spent on fees and slippage. |
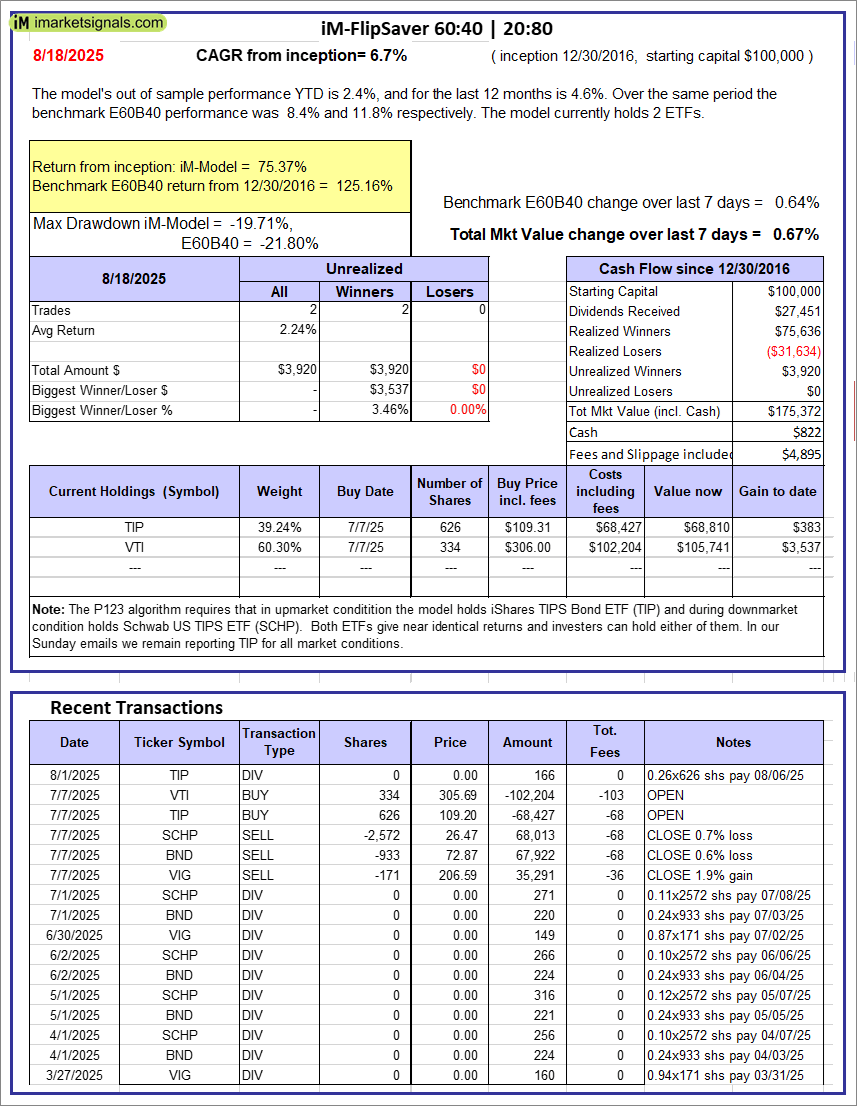 |
iM-FlipSaver 60:40 | 20:80 – 2017: The model’s out of sample performance YTD is 2.4%, and for the last 12 months is 4.6%. Over the same period the benchmark E60B40 performance was 8.4% and 11.8% respectively. Over the previous week the market value of iM-FlipSaver 80:20 | 20:80 gained 0.67% at a time when SPY gained 0.64%. A starting capital of $100,000 at inception on 7/16/2015 would have grown to $175,372 which includes $822 cash and excludes $4,895 spent on fees and slippage. |
 |
iM-FlipSaver 70:30 | 20:80 – 2017: The model’s out of sample performance YTD is 1.8%, and for the last 12 months is 4.6%. Over the same period the benchmark E60B40 performance was 8.4% and 11.8% respectively. Over the previous week the market value of iM-FlipSaver 70:30 | 20:80 gained 0.84% at a time when SPY gained 0.64%. A starting capital of $100,000 at inception on 7/15/2015 would have grown to $182,794 which includes $934 cash and excludes $5,139 spent on fees and slippage. |
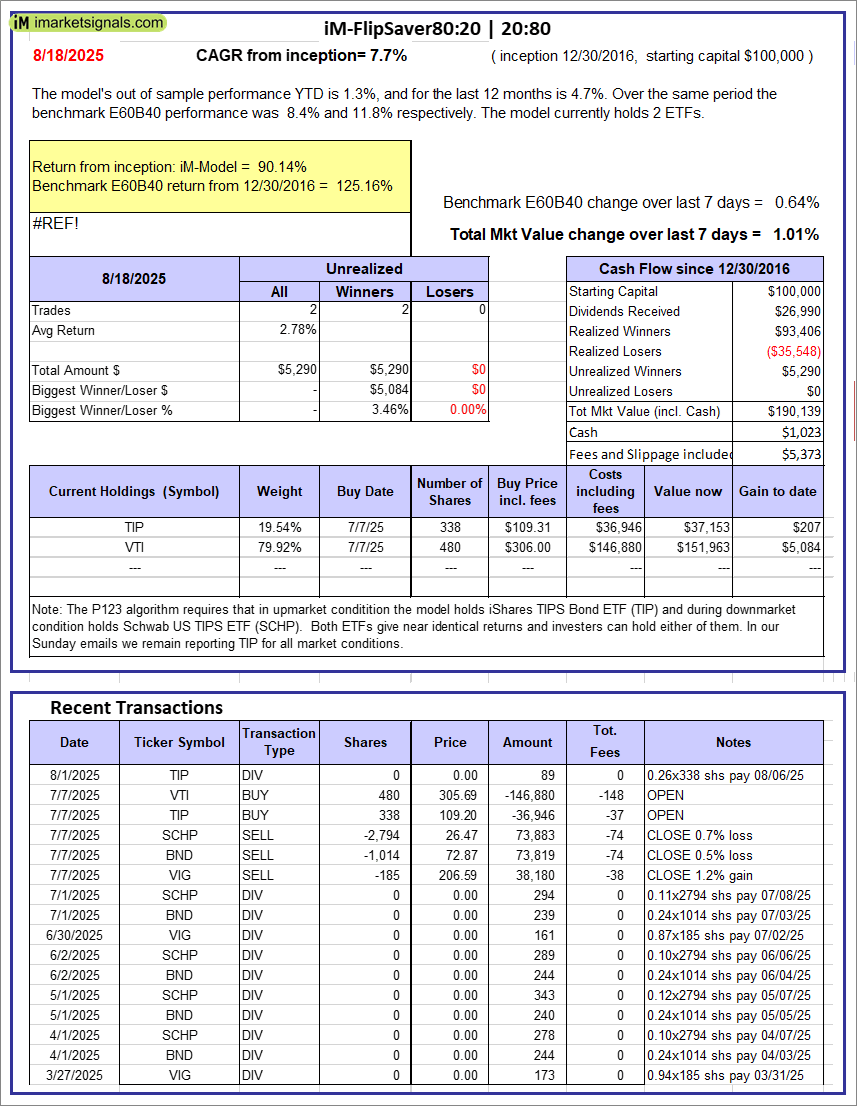 |
iM-FlipSaver 80:20 | 20:80 – 2017: The model’s out of sample performance YTD is 1.3%, and for the last 12 months is 4.7%. Over the same period the benchmark E60B40 performance was 8.4% and 11.8% respectively. Over the previous week the market value of iM-FlipSaver 80:20 | 20:80 gained 1.01% at a time when SPY gained 0.64%. A starting capital of $100,000 at inception on 1/2/2017 would have grown to $190,139 which includes $1,023 cash and excludes $5,373 spent on fees and slippage. |
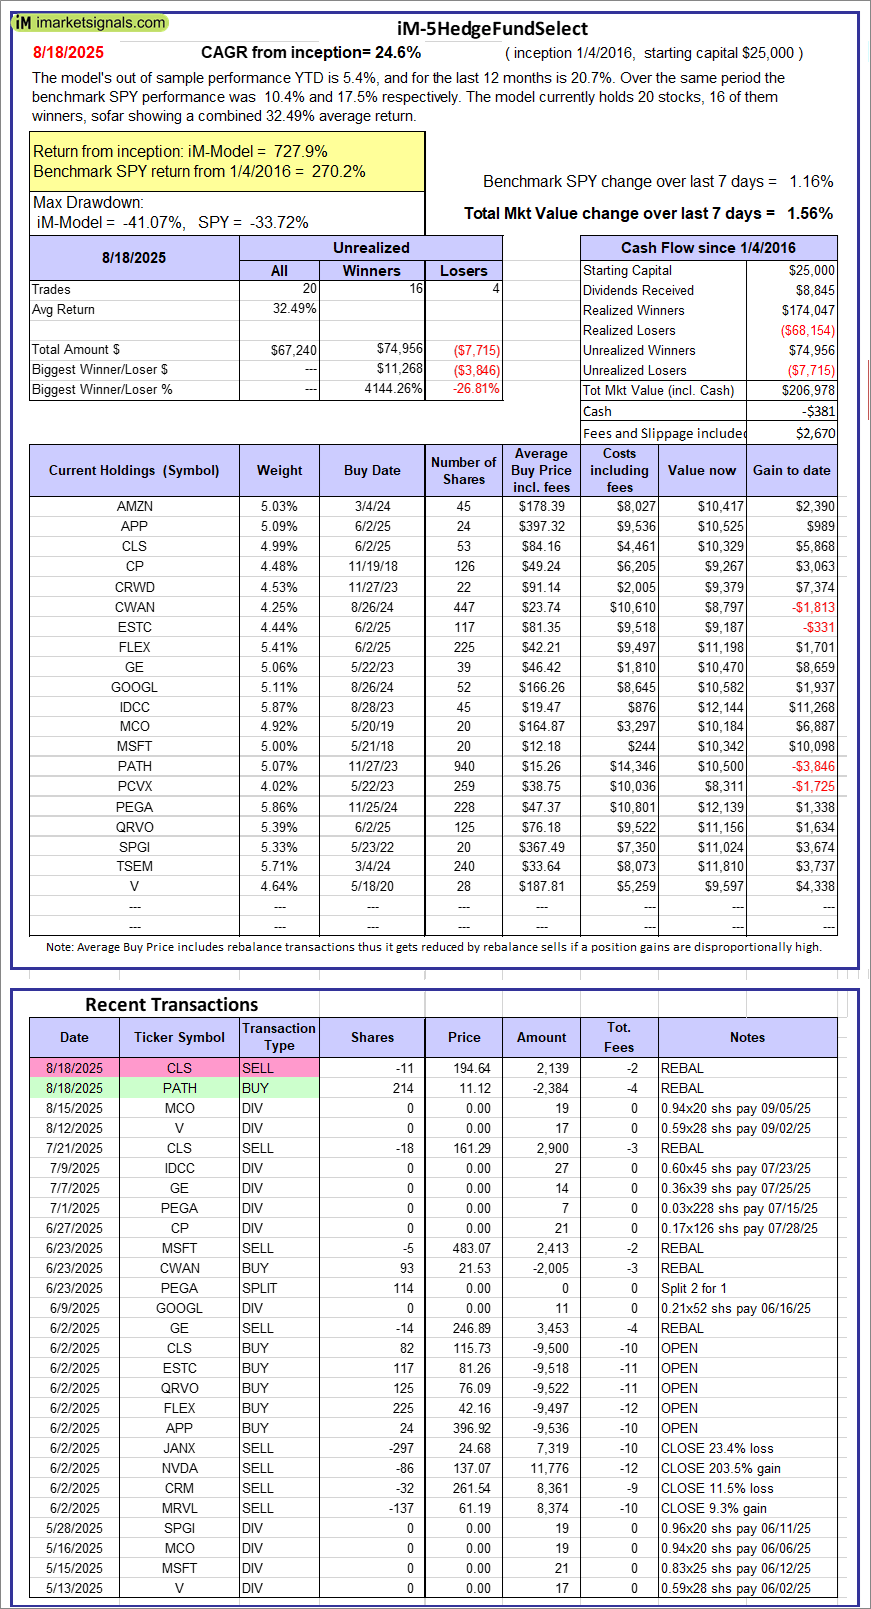 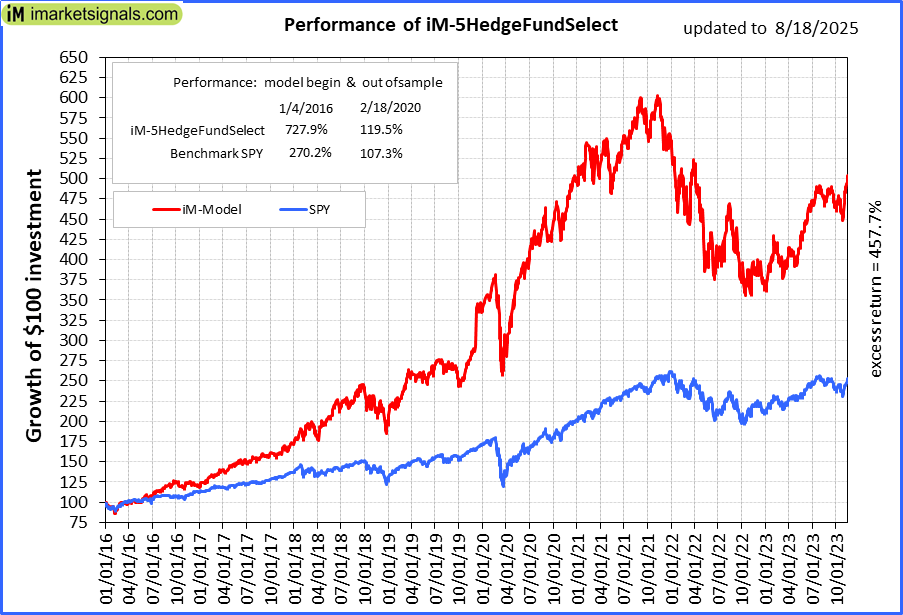 |
iM-5HedgeFundSelect: Since inception, on 1/5/2016, the model gained 727.91% while the benchmark SPY gained 270.18% over the same period. Over the previous week the market value of iM-5HedgeFundSelect gained 1.56% at a time when SPY gained 1.16%. A starting capital of $25,000 at inception on 1/5/2016 would have grown to $206,978 which includes -$381 cash and excludes $2,670 spent on fees and slippage. |
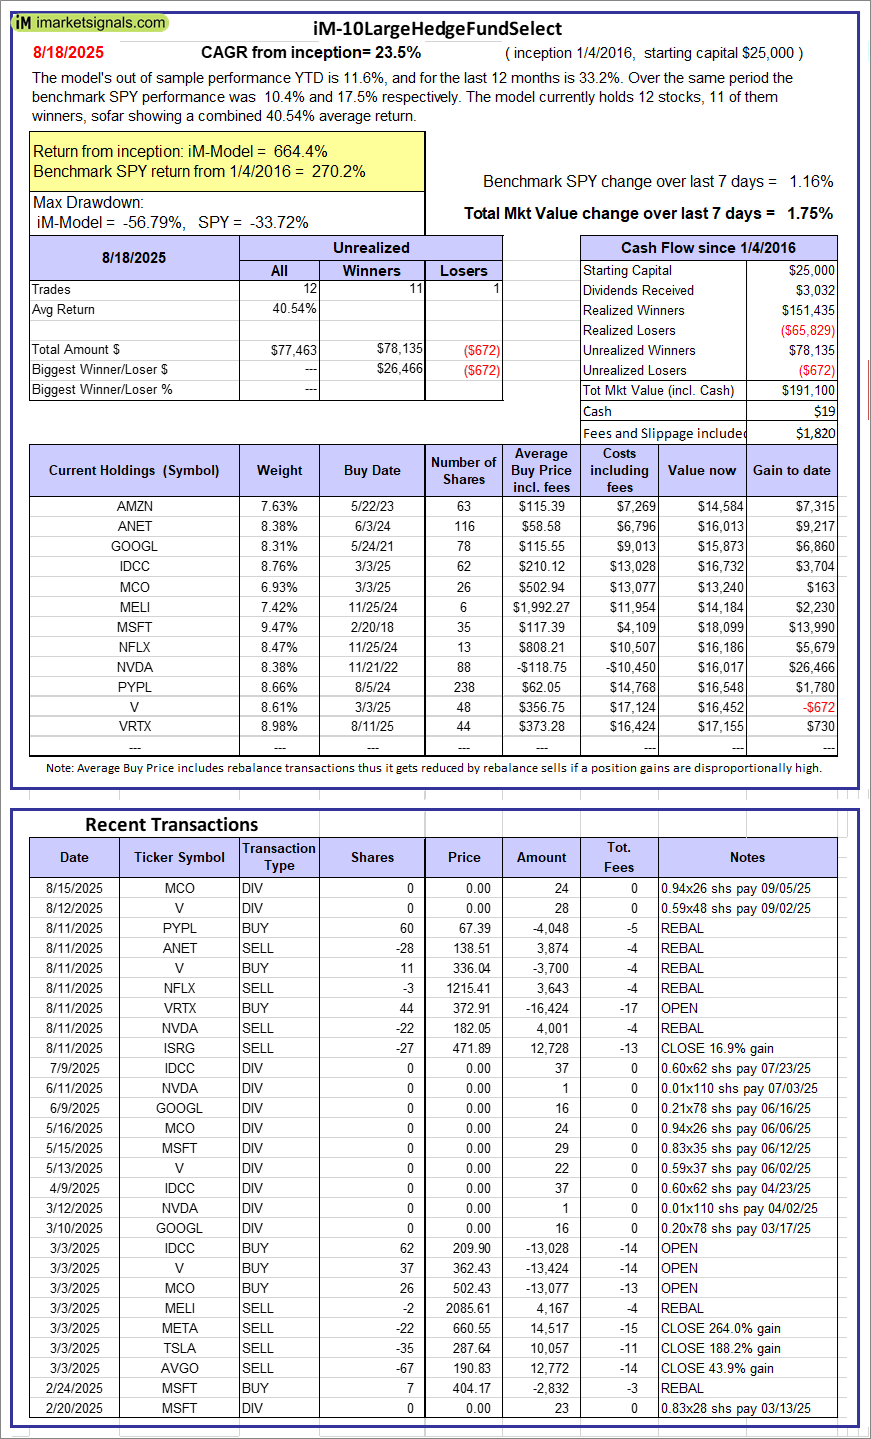 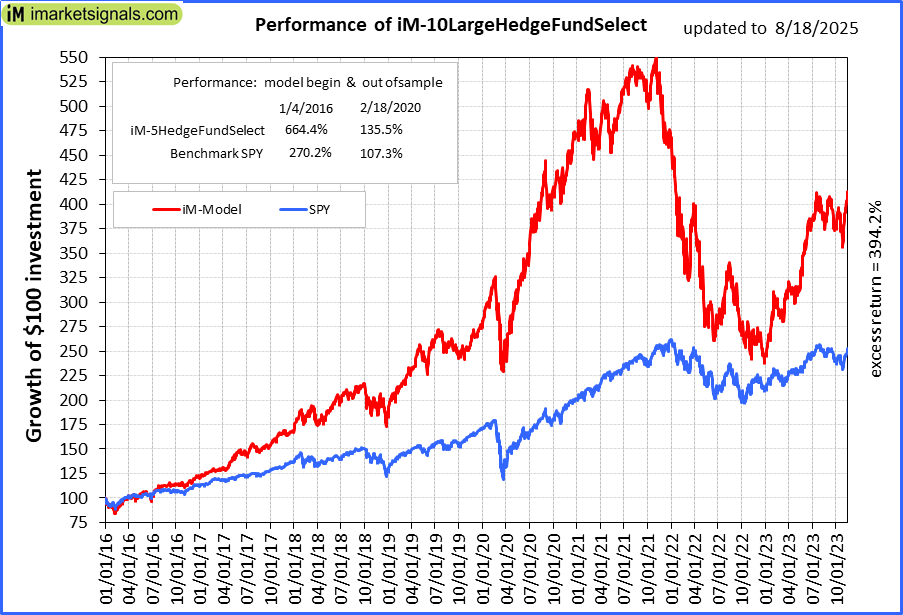 |
iM-10LargeHedgeFundSelect: Since inception, on 1/5/2016, the model gained 664.40% while the benchmark SPY gained 270.18% over the same period. Over the previous week the market value of iM-10LargeHedgeFundSelect gained 1.75% at a time when SPY gained 1.16%. A starting capital of $25,000 at inception on 1/5/2016 would have grown to $191,100 which includes $19 cash and excludes $1,820 spent on fees and slippage. |
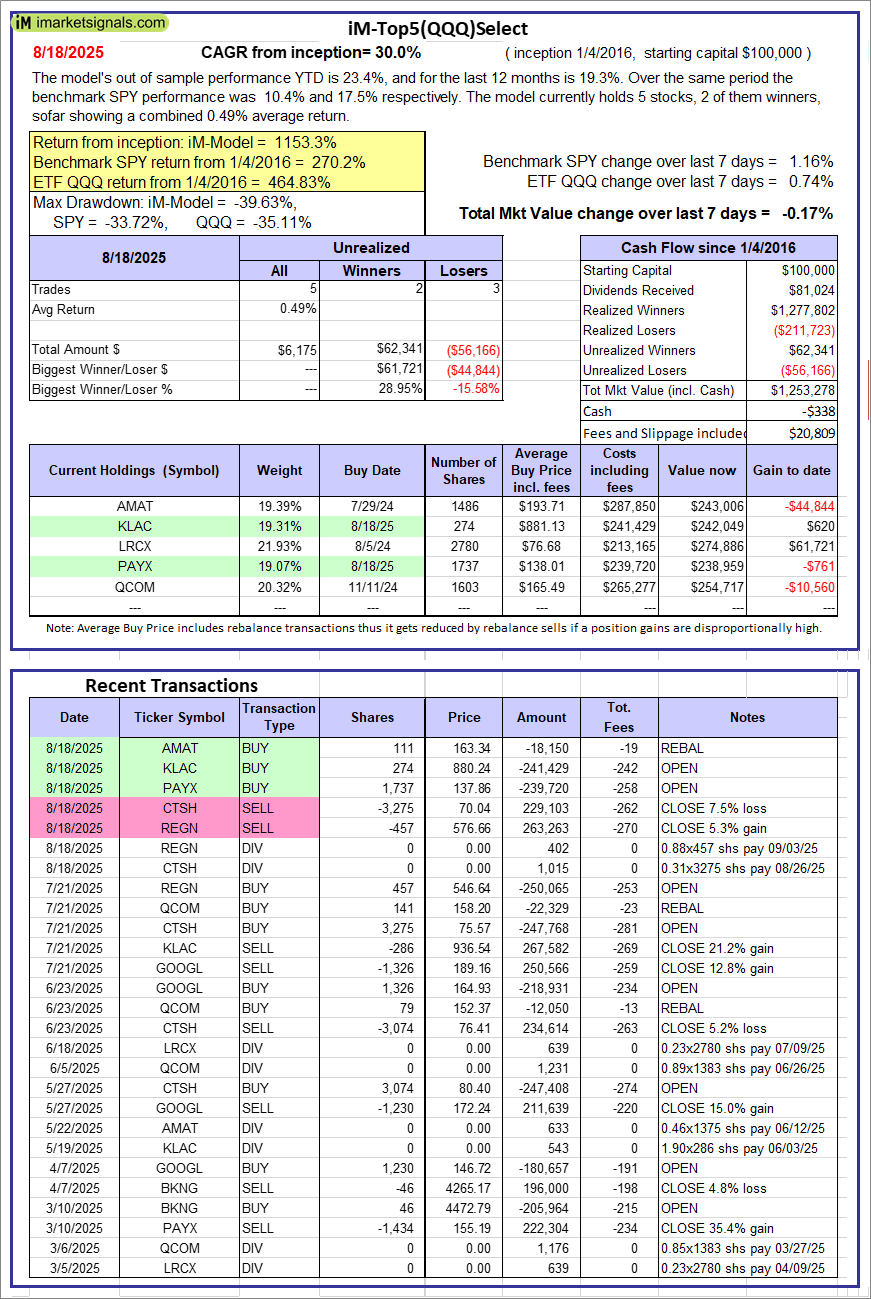 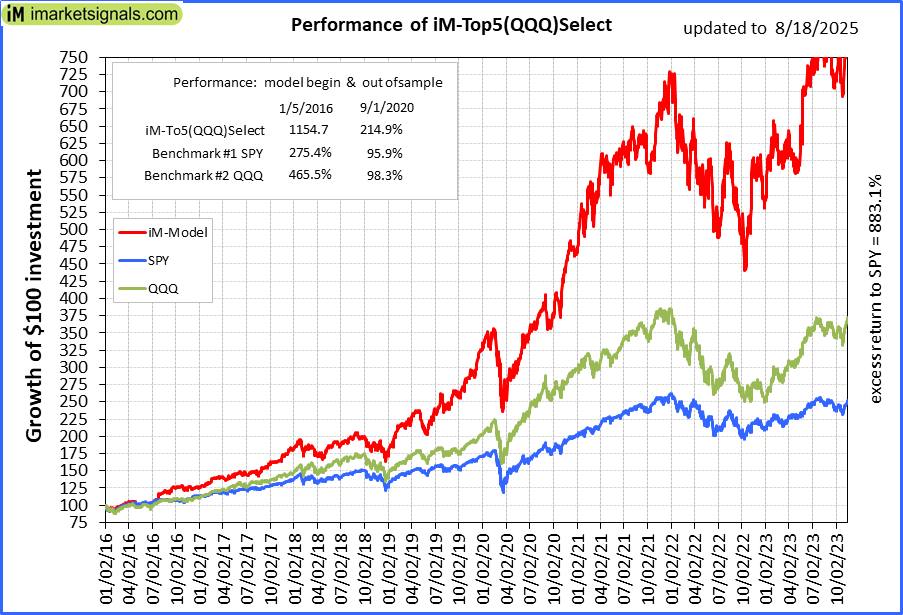 |
iM-Top5(QQQ)Select: Since inception, on 1/5/2016, the model gained 1153.28% while the benchmark SPY gained 270.18% over the same period. Over the previous week the market value of iM-Top5(QQQ)Select gained -0.17% at a time when SPY gained 1.16%. A starting capital of $100,000 at inception on 1/5/2016 would have grown to $1,253,278 which includes -$338 cash and excludes $20,809 spent on fees and slippage. |
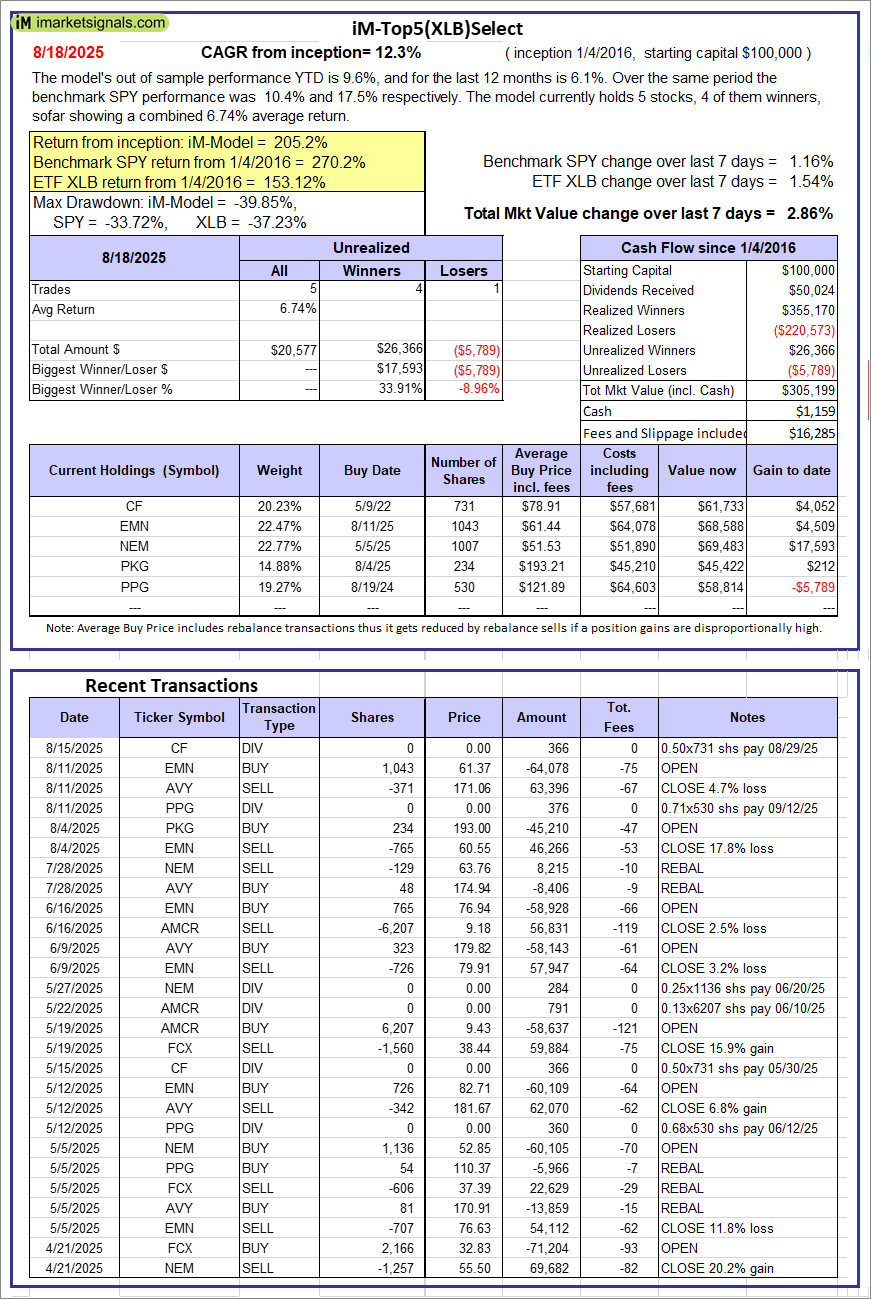 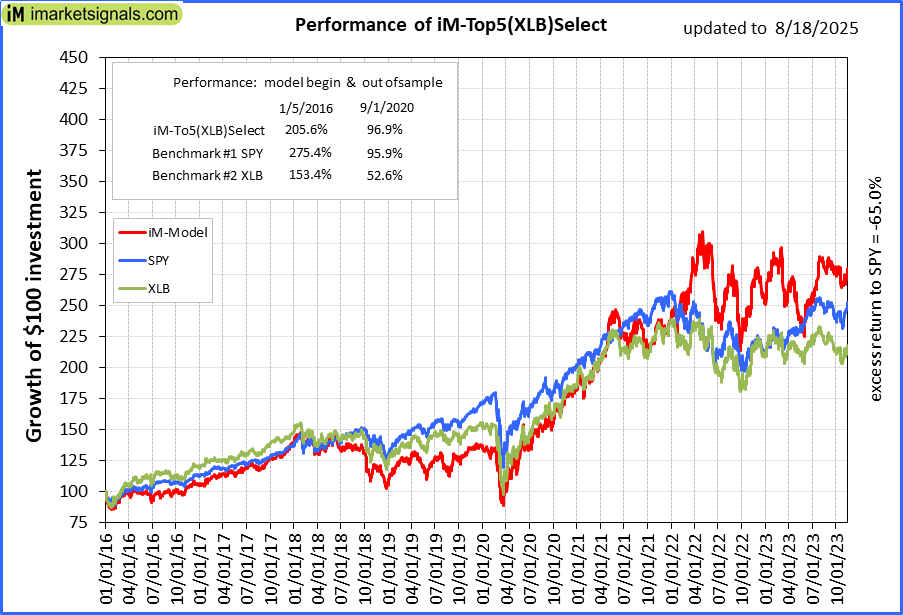 |
iM-Top5(XLB)Select: Since inception, on 1/5/2016, the model gained 205.20% while the benchmark SPY gained 270.18% over the same period. Over the previous week the market value of iM-Top5(XLB)Select gained 2.86% at a time when SPY gained 1.16%. A starting capital of $100,000 at inception on 1/5/2016 would have grown to $305,199 which includes $1,159 cash and excludes $16,285 spent on fees and slippage. |
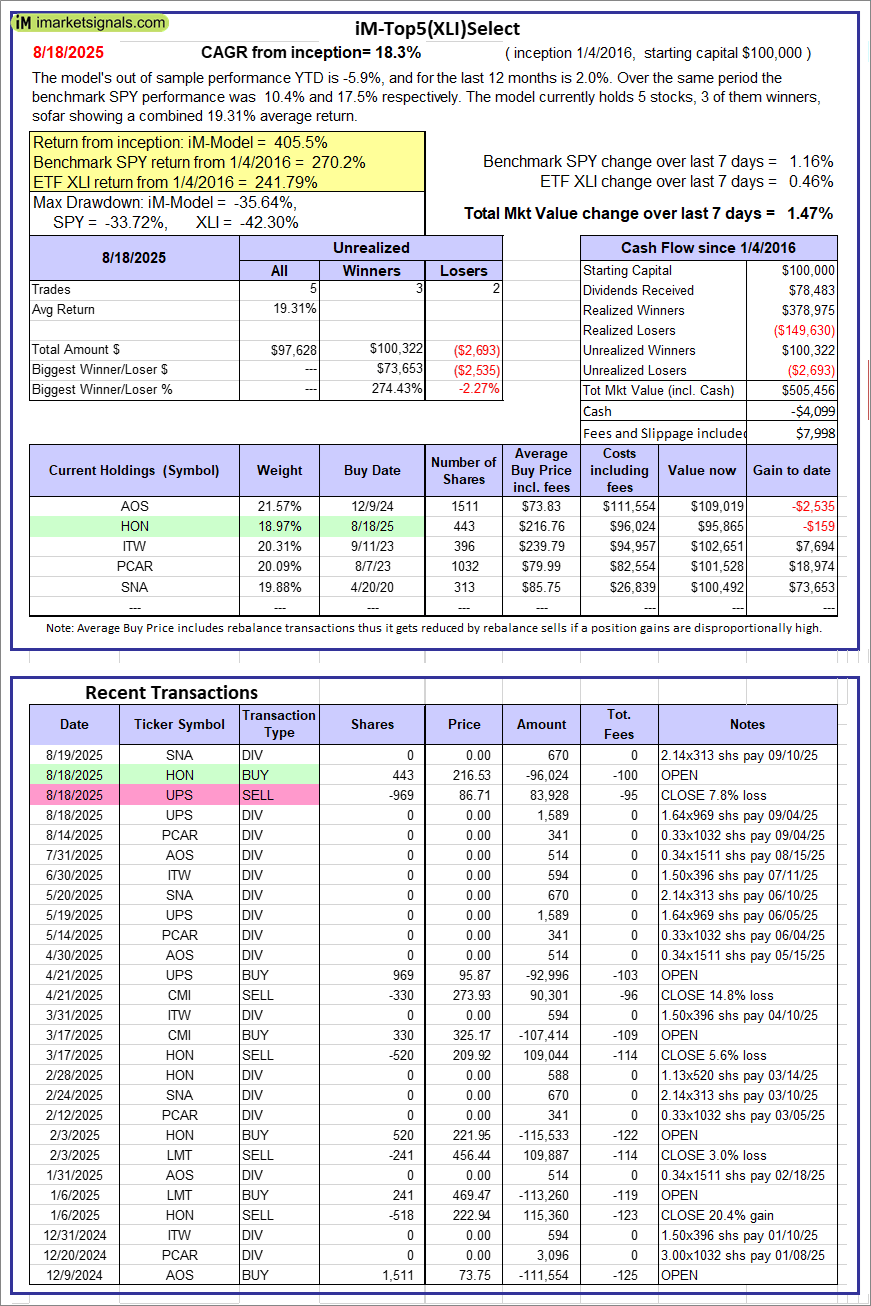 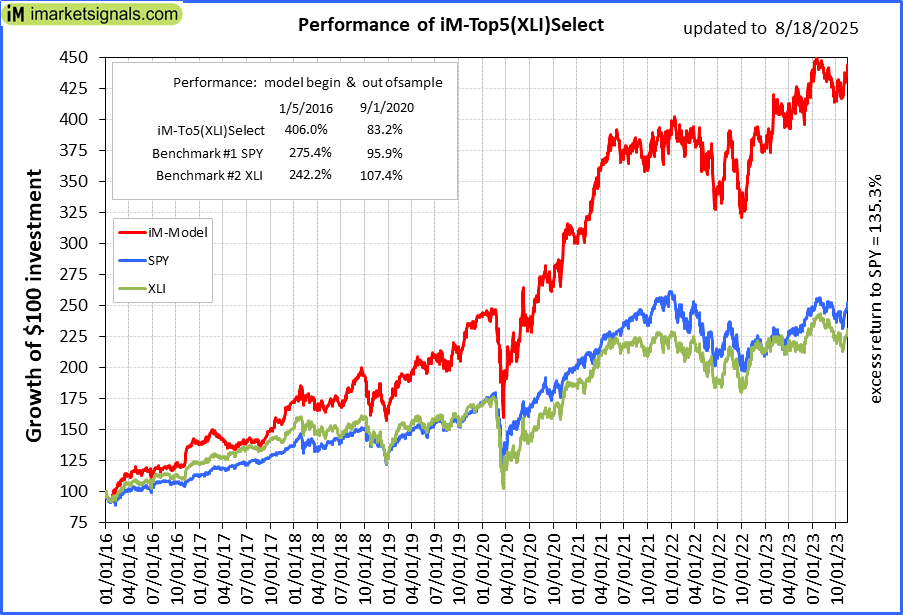 |
iM-Top5(XLI)Select: Since inception, on 1/5/2016, the model gained 405.46% while the benchmark SPY gained 270.18% over the same period. Over the previous week the market value of iM-Top5(XLI)Select gained 1.47% at a time when SPY gained 1.16%. A starting capital of $100,000 at inception on 1/5/2016 would have grown to $505,456 which includes -$4,099 cash and excludes $7,998 spent on fees and slippage. |
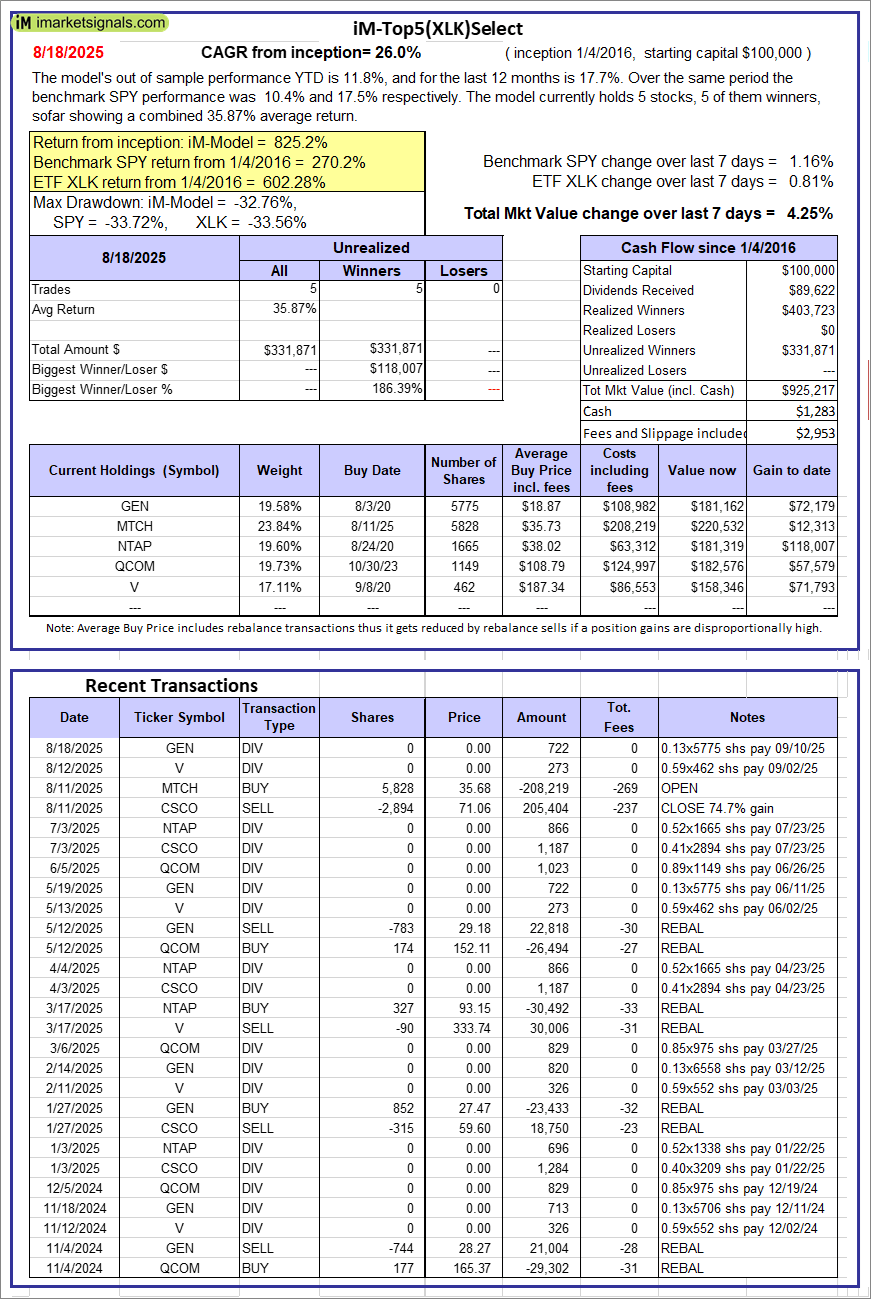 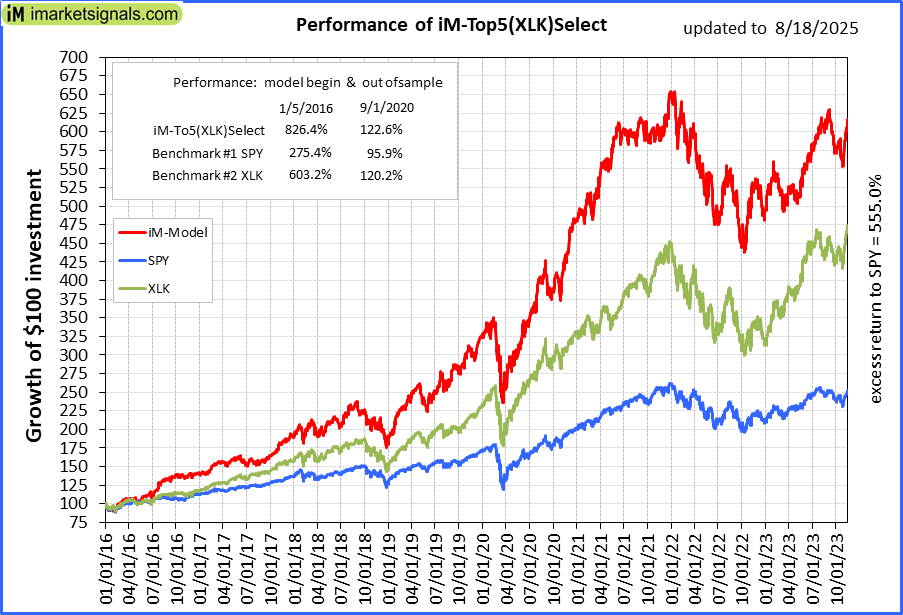 |
iM-Top5(XLK)Select: Since inception, on 1/5/2016, the model gained 825.22% while the benchmark SPY gained 270.18% over the same period. Over the previous week the market value of iM-Top5(XLK)Select gained 4.25% at a time when SPY gained 1.16%. A starting capital of $100,000 at inception on 1/5/2016 would have grown to $925,217 which includes $1,283 cash and excludes $2,953 spent on fees and slippage. |
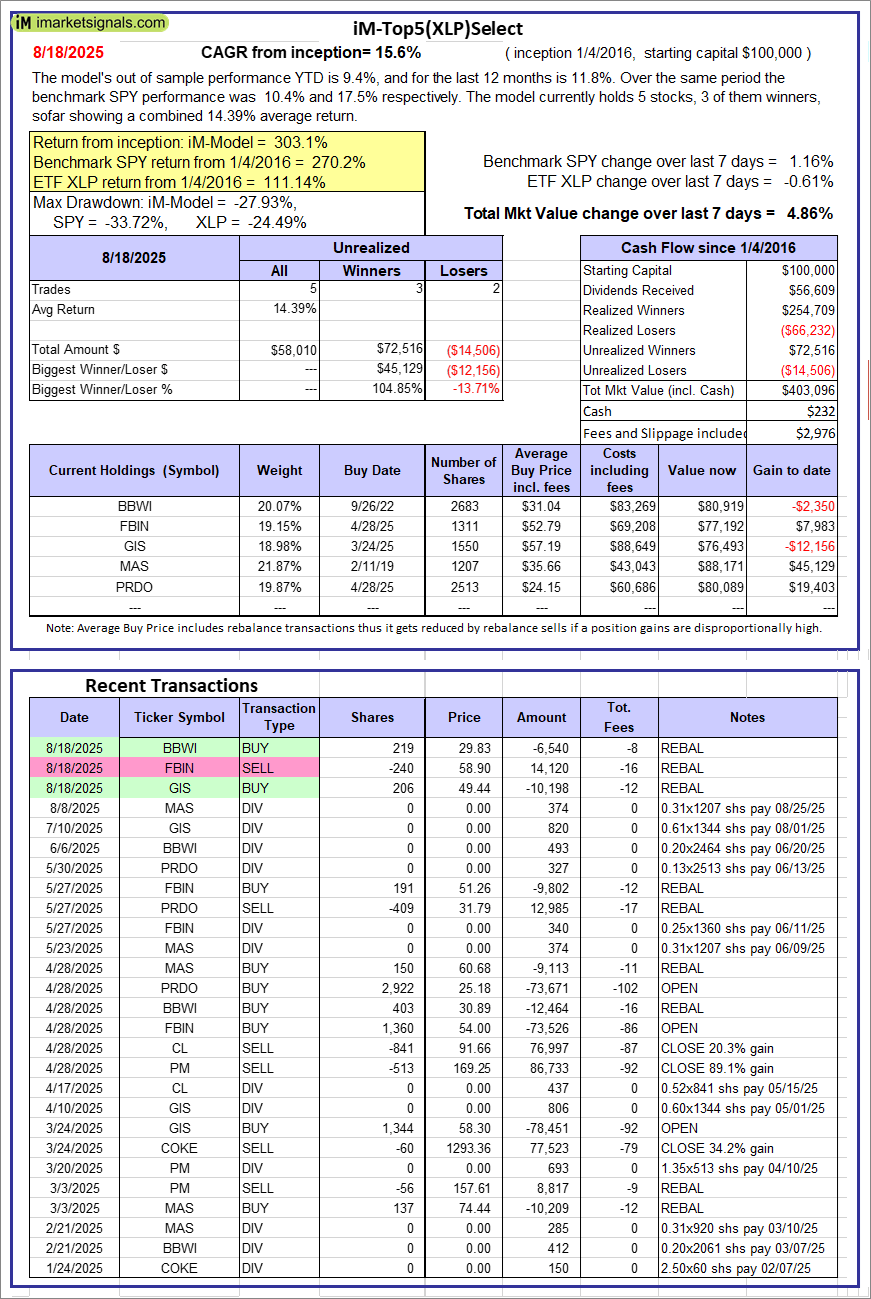 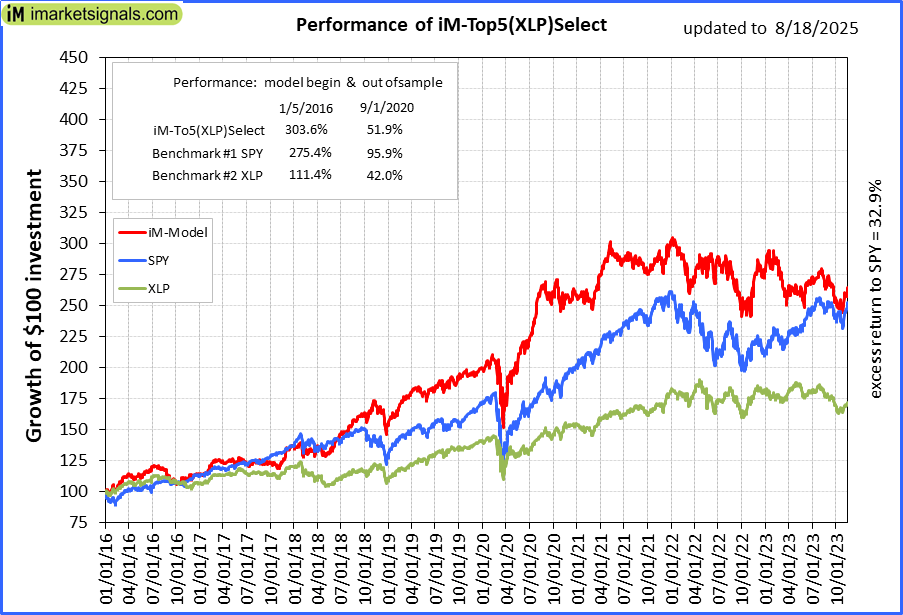 |
iM-Top5(XLP)Select: Since inception, on 1/5/2016, the model gained 303.10% while the benchmark SPY gained 270.18% over the same period. Over the previous week the market value of iM-Top5(XLP)Select gained 4.86% at a time when SPY gained 1.16%. A starting capital of $100,000 at inception on 1/5/2016 would have grown to $403,096 which includes $232 cash and excludes $2,976 spent on fees and slippage. |
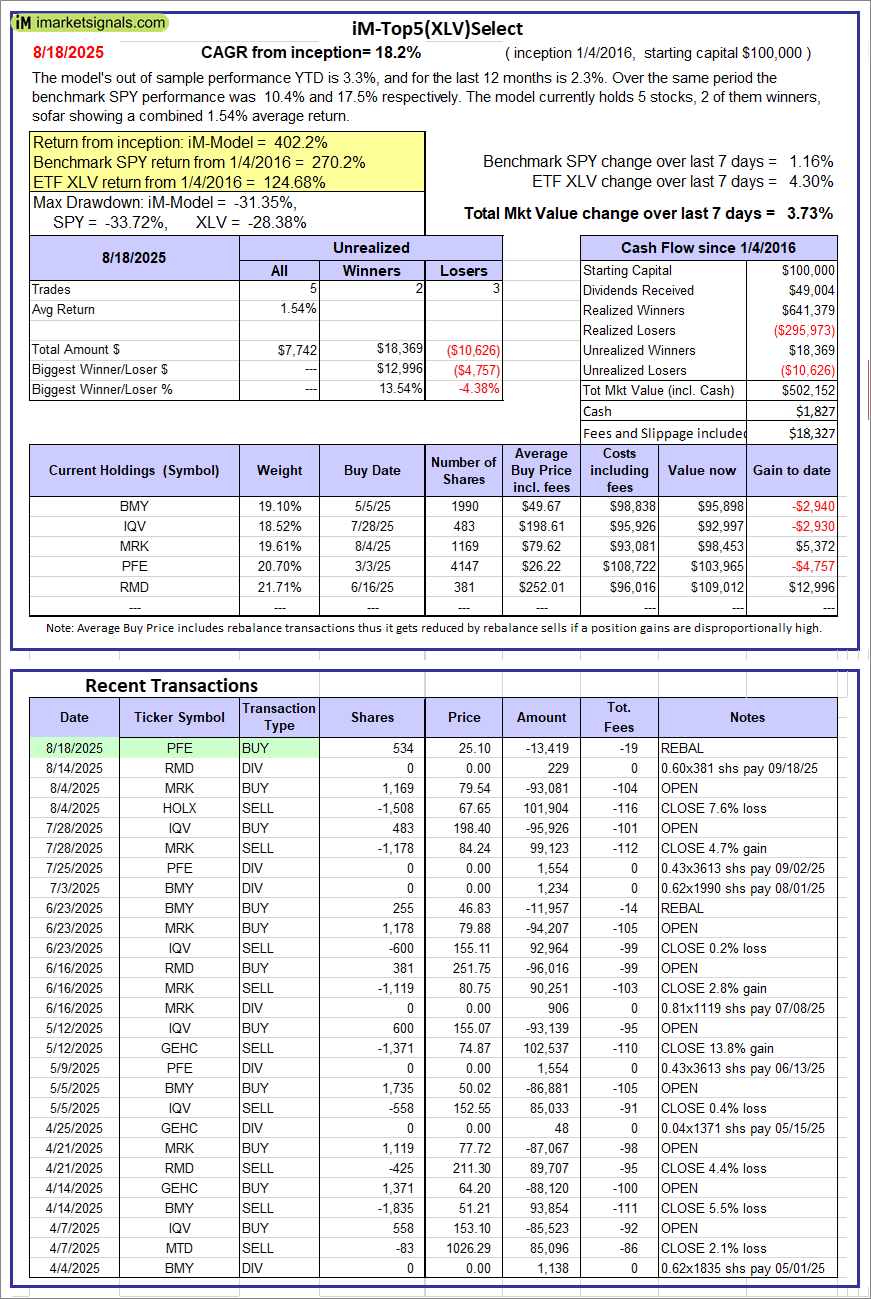 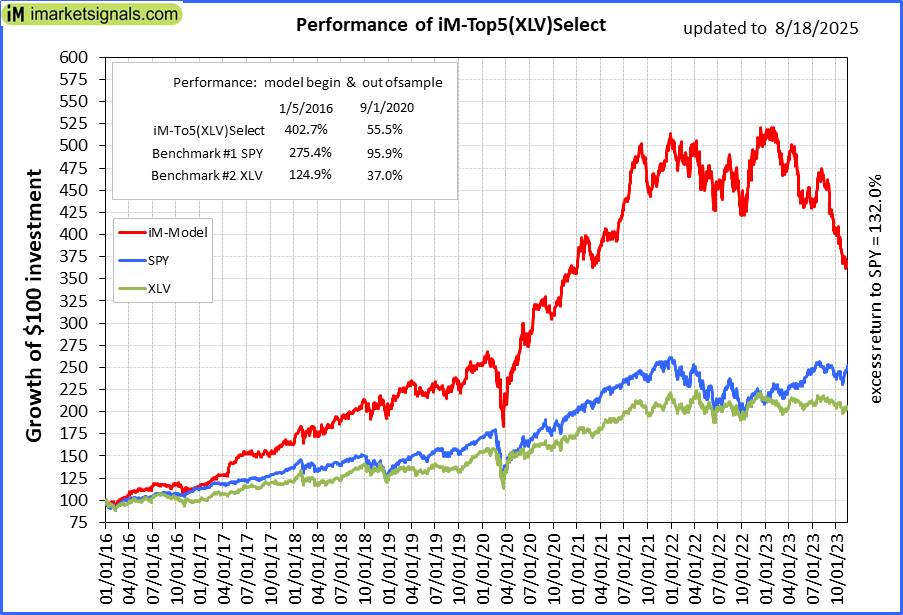 |
iM-Top5(XLV)Select: Since inception, on 1/5/2016, the model gained 402.15% while the benchmark SPY gained 270.18% over the same period. Over the previous week the market value of iM-Top5(XLV)Select gained 3.73% at a time when SPY gained 1.16%. A starting capital of $100,000 at inception on 1/5/2016 would have grown to $502,152 which includes $1,827 cash and excludes $18,327 spent on fees and slippage. |
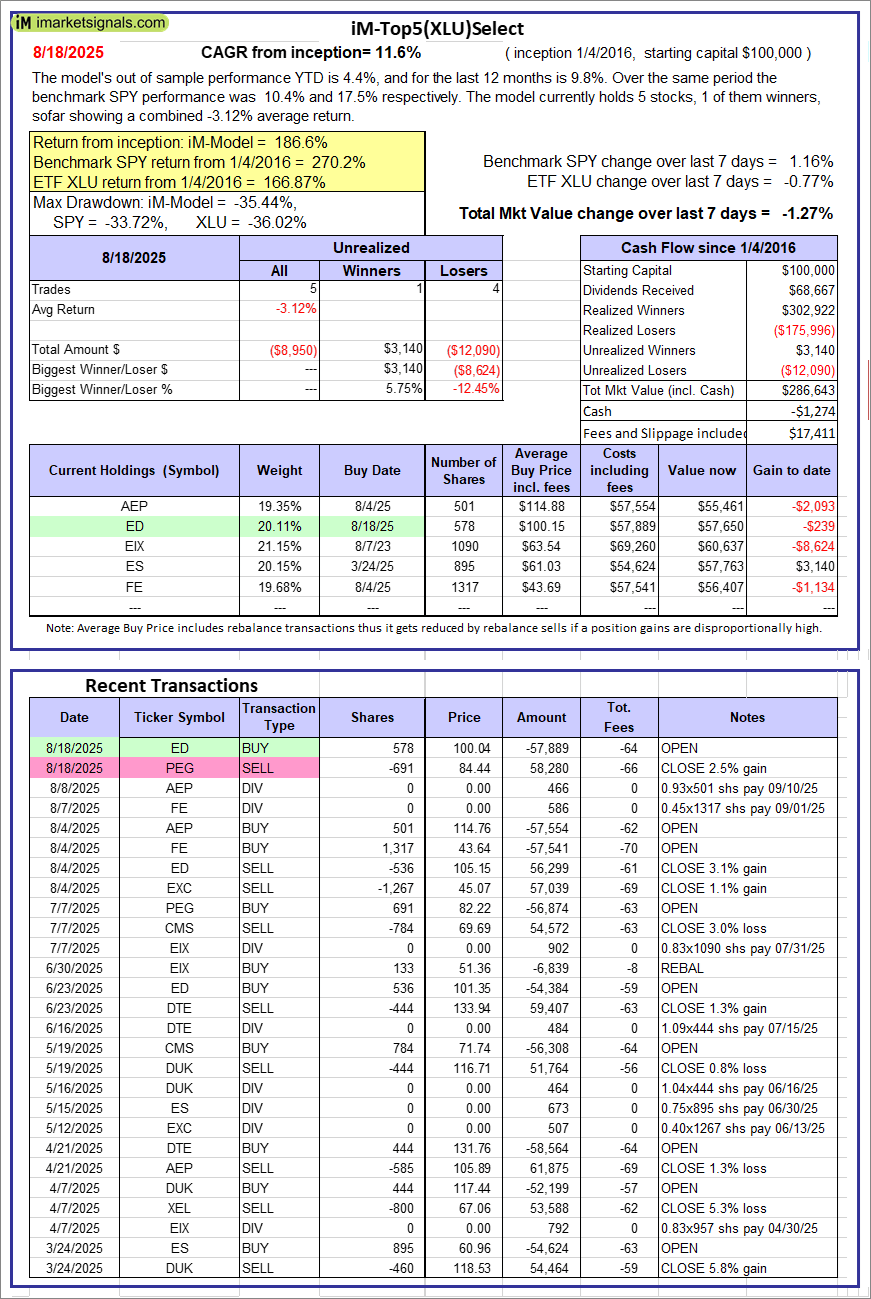 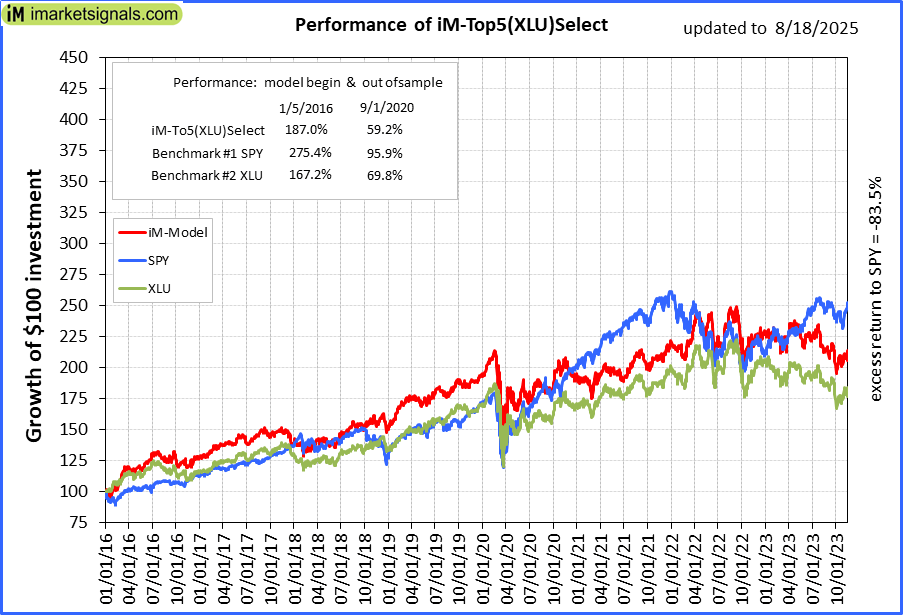 |
iM-Top5(XLU)Select: Since inception, on 1/5/2016, the model gained 186.64% while the benchmark SPY gained 270.18% over the same period. Over the previous week the market value of iM-Top5(XLU)Select gained -1.27% at a time when SPY gained 1.16%. A starting capital of $100,000 at inception on 1/5/2016 would have grown to $286,643 which includes -$1,274 cash and excludes $17,411 spent on fees and slippage. |
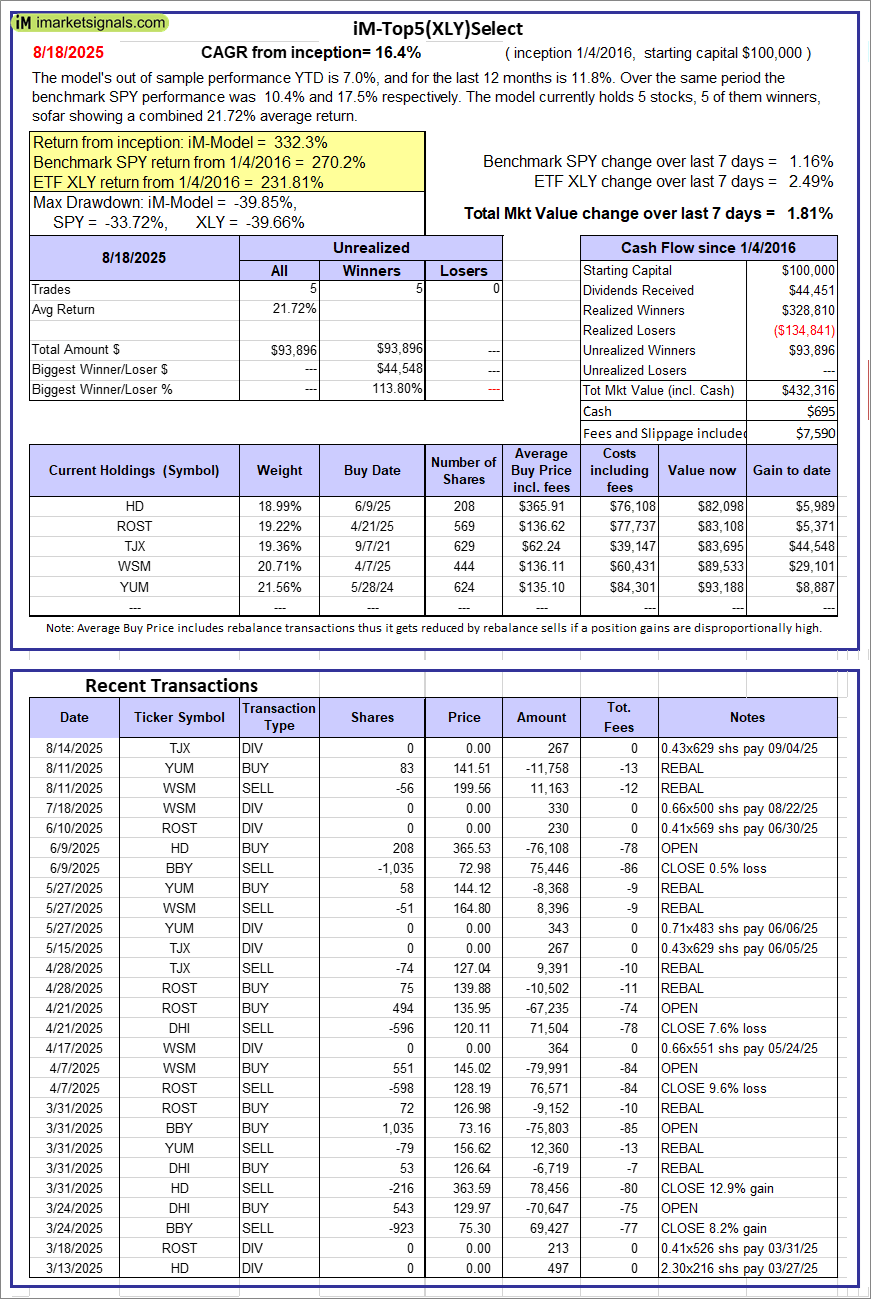 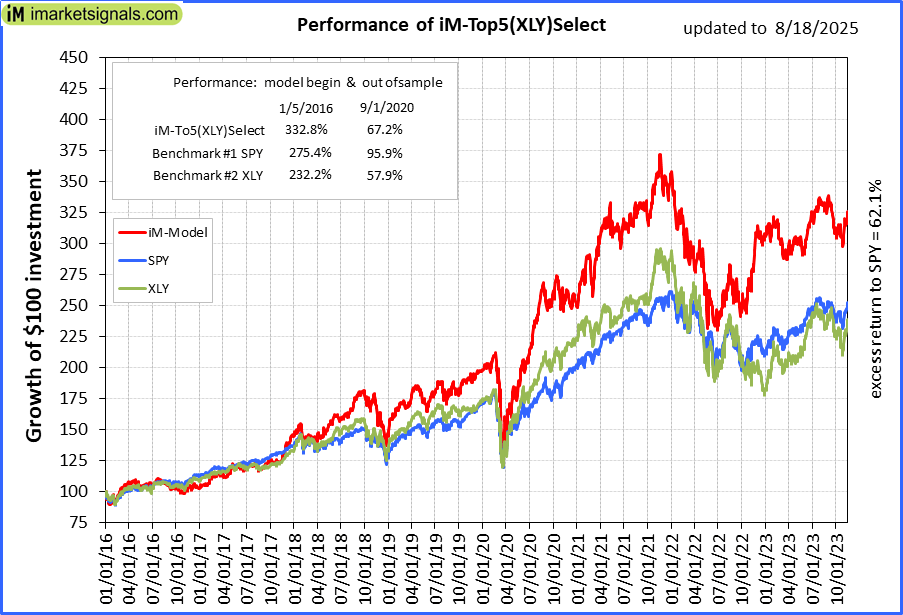 |
iM-Top5(XLY)Select: Since inception, on 1/5/2016, the model gained 332.32% while the benchmark SPY gained 270.18% over the same period. Over the previous week the market value of iM-Top5(XLY)Select gained 1.81% at a time when SPY gained 1.16%. A starting capital of $100,000 at inception on 1/5/2016 would have grown to $432,316 which includes $695 cash and excludes $7,590 spent on fees and slippage. |
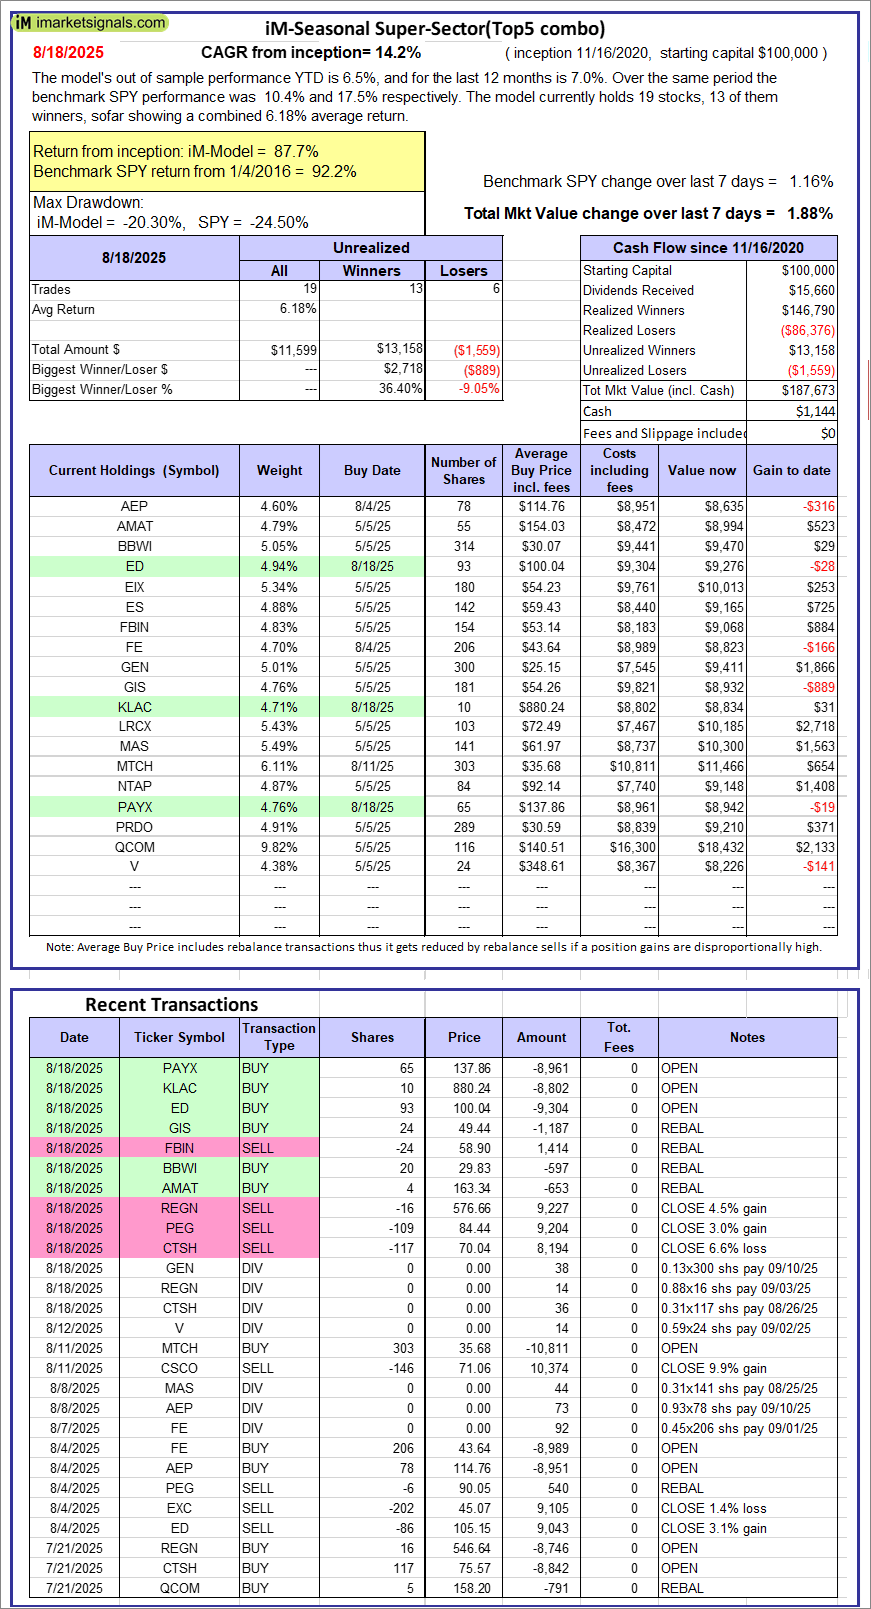 |
iM-Seasonal Super-Sectors (Top5 combo) : Since inception, on 11/17/2020, the model gained 87.67% while the benchmark SPY gained 92.16% over the same period. Over the previous week the market value of iM-Seasonal Super-Sectors (Top5 combo) gained 1.88% at a time when SPY gained 1.16%. A starting capital of $100,000 at inception on 11/17/2020 would have grown to $187,673 which includes $1,144 cash and excludes $00 spent on fees and slippage. |
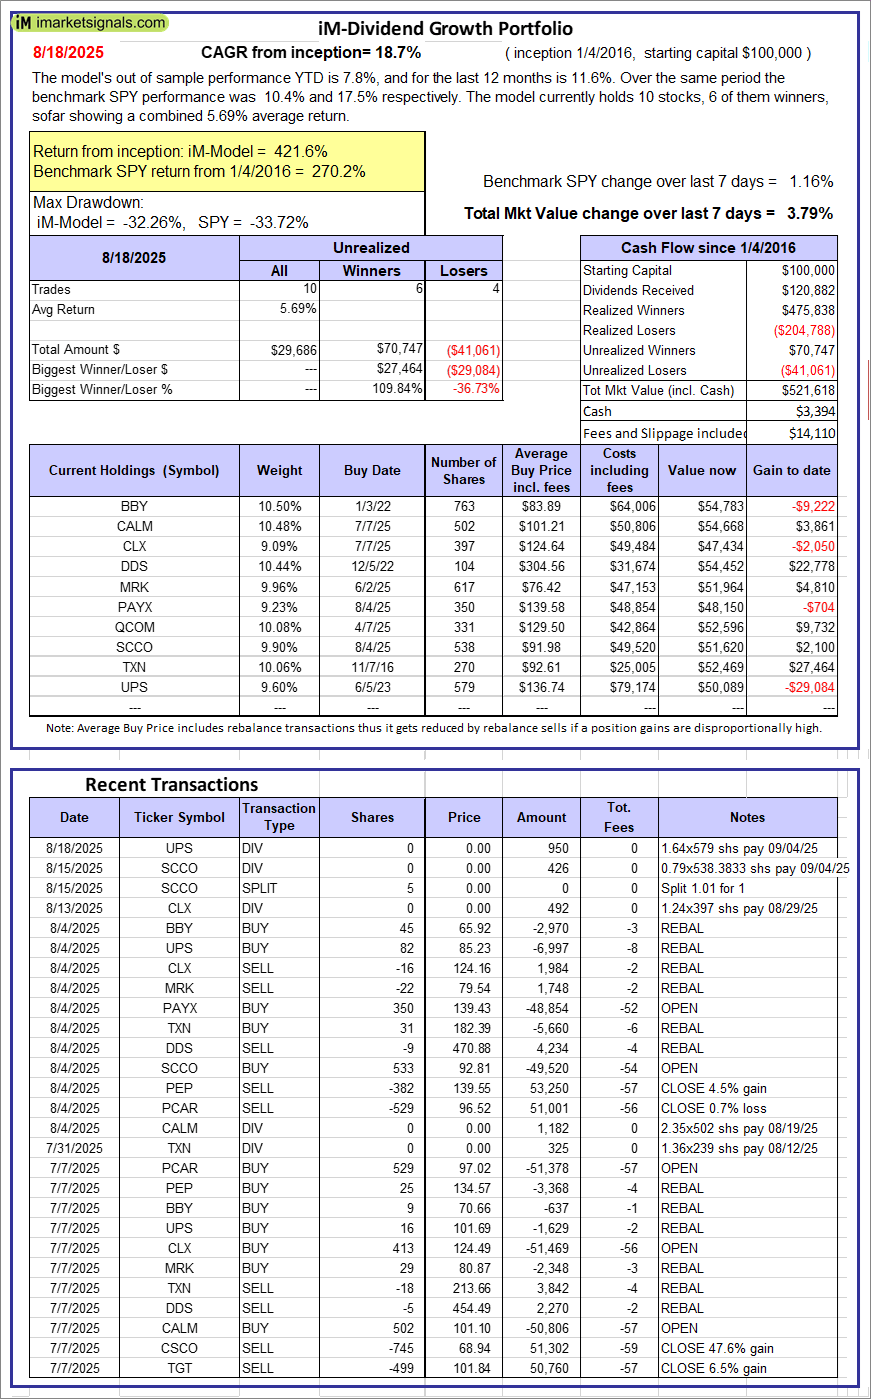 |
iM-Dividend Growth Portfolio: The model’s out of sample performance YTD is 7.8%, and for the last 12 months is 11.6%. Over the same period the benchmark SPY performance was 10.4% and 17.5% respectively. Over the previous week the market value of the iM-Dividend Growth Portfolio gained 3.79% at a time when SPY gained 1.16%. A starting capital of $100,000 at inception on 6/30/2016 would have grown to $521,618 which includes $3,394 cash and excludes $14,110 spent on fees and slippage. |
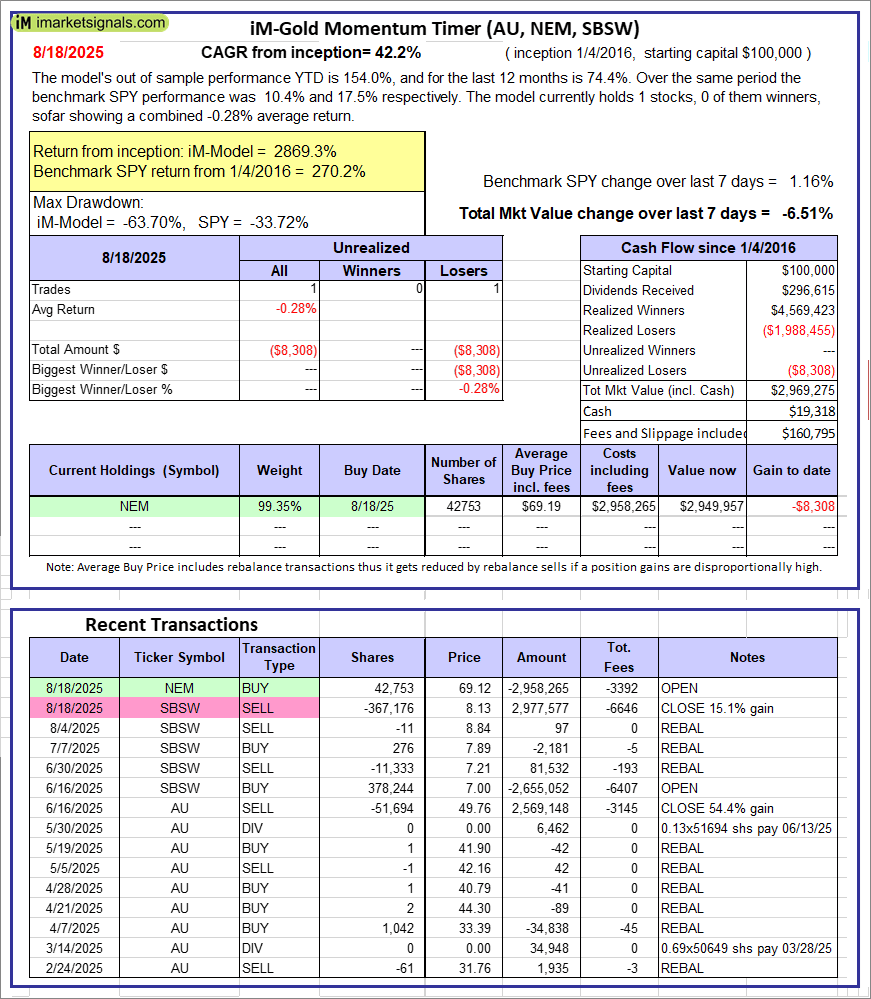 |
iM-Gold Momentum Timer (AU, NEM, SBSW): The model’s out of sample performance YTD is 154.0%, and for the last 12 months is 74.4%. Over the same period the benchmark SPY performance was 10.4% and 17.5% respectively. Over the previous week the market value of iM-Gold Momentum Timer (AU, NEM, SBSW) gained -6.51% at a time when SPY gained 1.16%. A starting capital of $100,000 at inception on 6/30/2016 would have grown to $19,318 which includes $160,795 cash and excludes Gain to date spent on fees and slippage. |
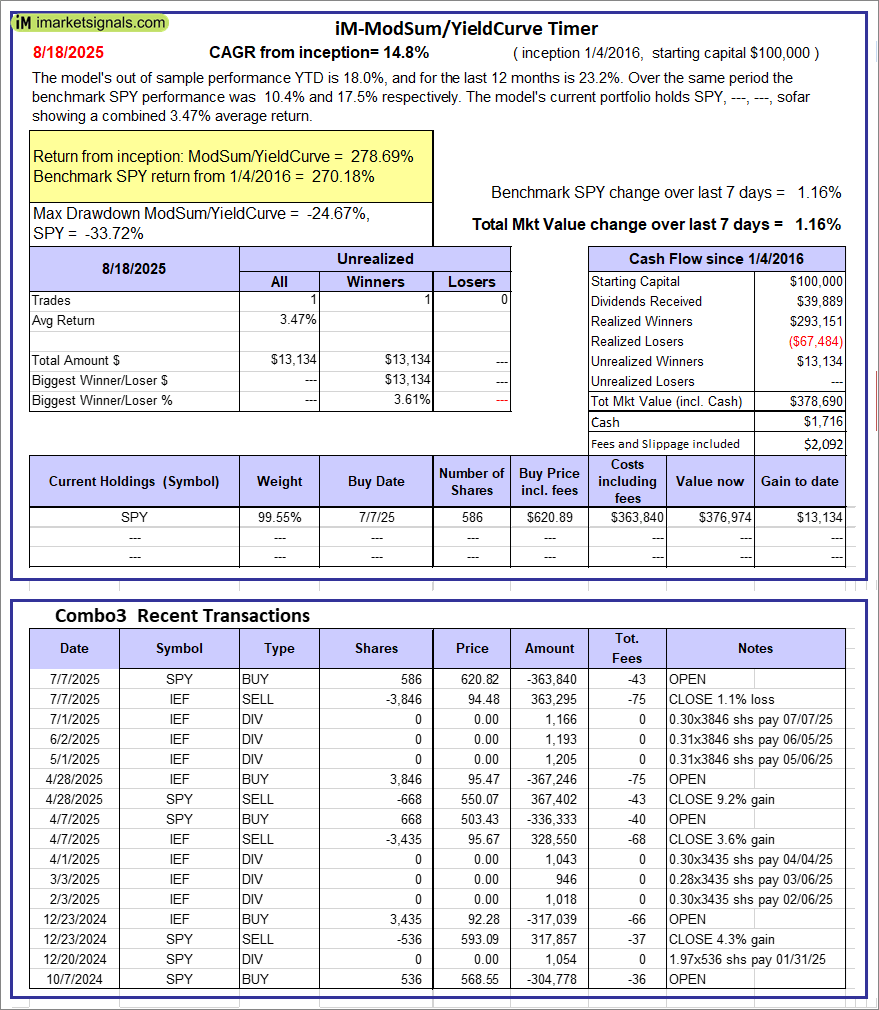 |
iM-ModSum/YieldCurve Timer: The model’s out of sample performance YTD is 18.0%, and for the last 12 months is 23.2%. Over the same period the benchmark SPY performance was 10.4% and 17.5% respectively. Over the previous week the market value of iM-PortSum/YieldCurve Timer gained 1.16% at a time when SPY gained 1.16%. A starting capital of $100,000 at inception on 1/1/2016 would have grown to $378,690 which includes $1,716 cash and excludes $2,092 spent on fees and slippage. |
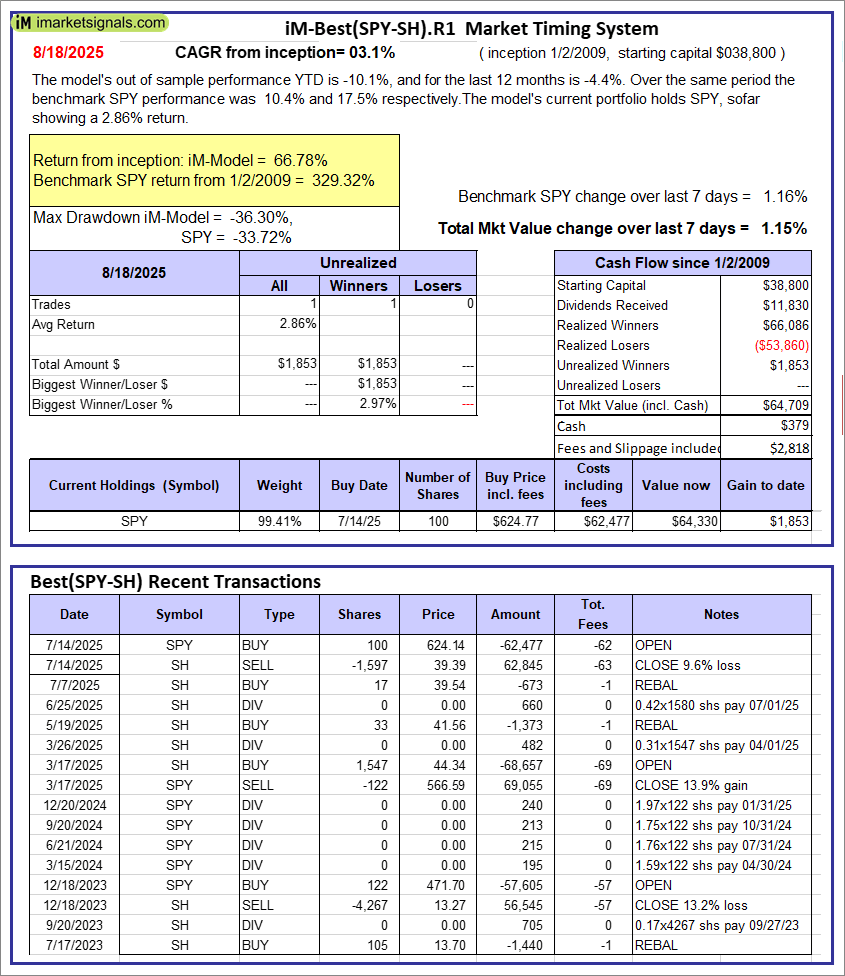 |
iM-Best(SPY-SH).R1: The model’s out of sample performance YTD is -10.1%, and for the last 12 months is -4.4%. Over the same period the benchmark SPY performance was 10.4% and 17.5% respectively. Over the previous week the market value of Best(SPY-SH) gained 1.15% at a time when SPY gained 1.16%. A starting capital of $100,000 at inception on 1/2/2009 would have grown to $64,709 which includes $379 cash and excludes $2,818 spent on fees and slippage. |
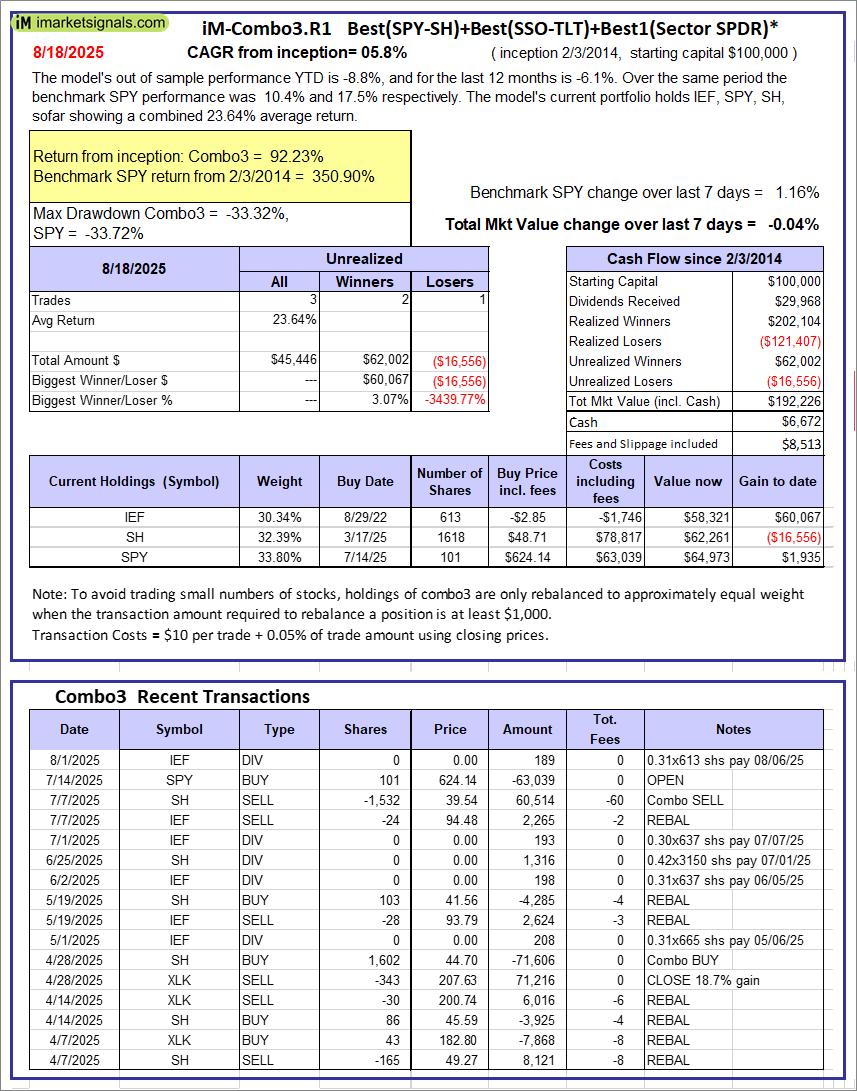 |
iM-Combo3.R1: The model’s out of sample performance YTD is -8.8%, and for the last 12 months is -6.1%. Over the same period the benchmark SPY performance was 10.4% and 17.5% respectively. Over the previous week the market value of iM-Combo3.R1 gained -0.04% at a time when SPY gained 1.16%. A starting capital of $100,000 at inception on 2/3/2014 would have grown to $192,226 which includes $6,672 cash and excludes $8,513 spent on fees and slippage. |
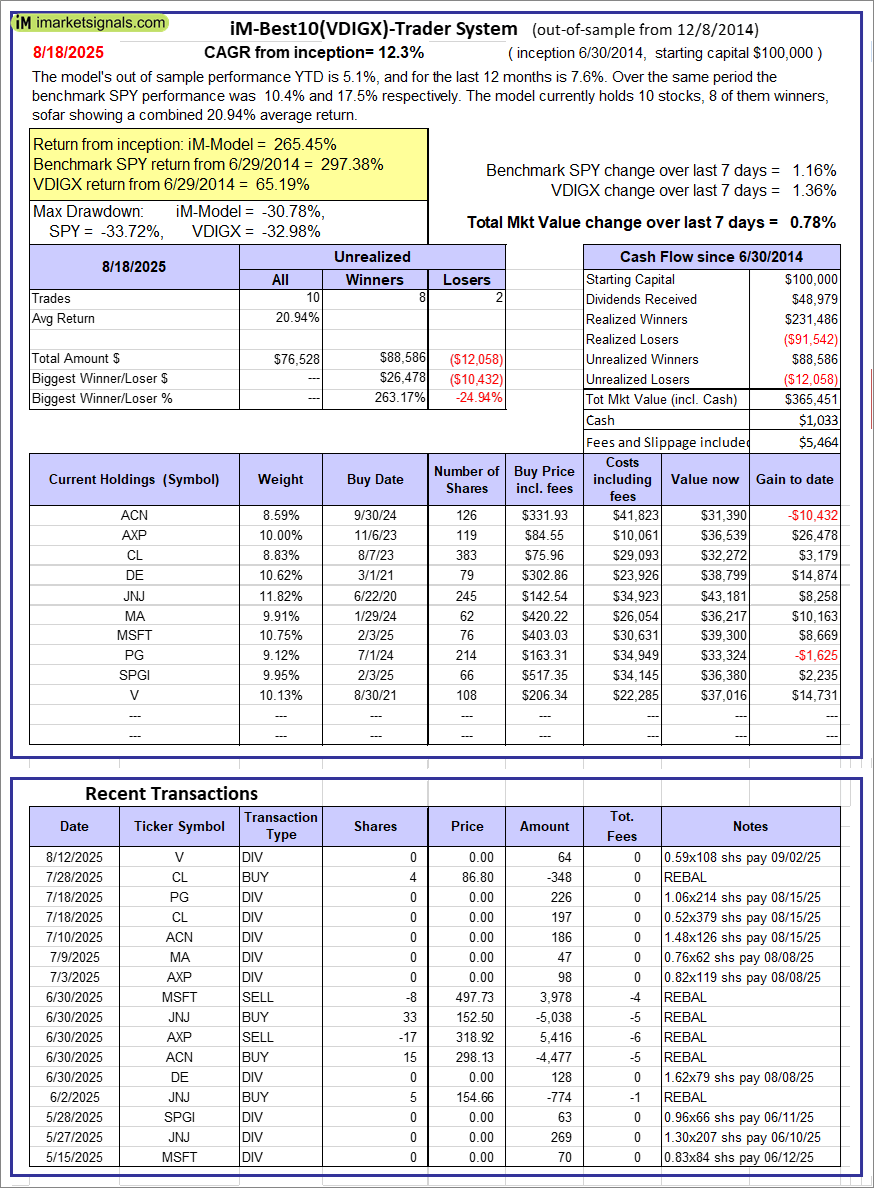 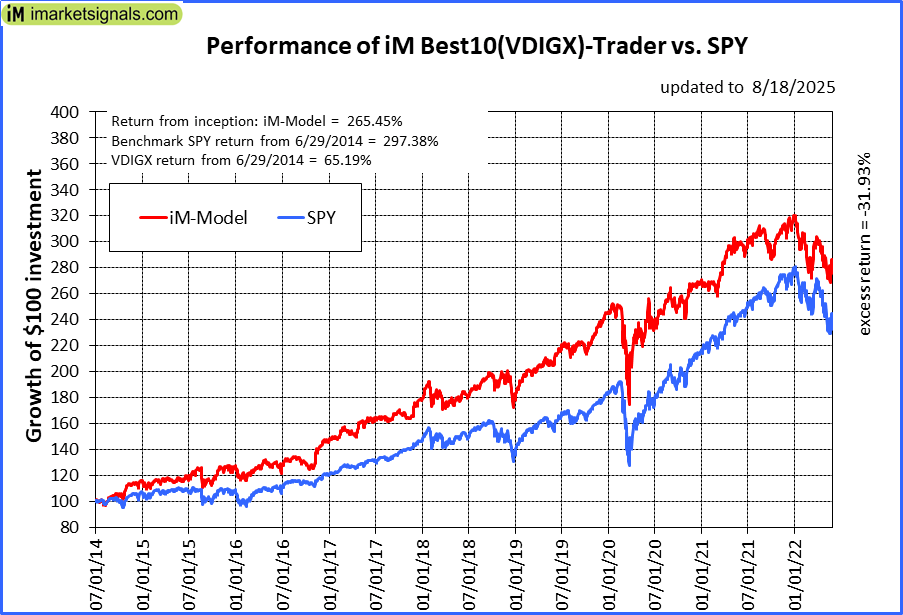 |
iM-Best10(VDIGX)-Trader: The model’s out of sample performance YTD is 5.1%, and for the last 12 months is 7.6%. Over the same period the benchmark SPY performance was 10.4% and 17.5% respectively. Since inception, on 7/1/2014, the model gained 265.45% while the benchmark SPY gained 297.38% and VDIGX gained 65.19% over the same period. Over the previous week the market value of iM-Best10(VDIGX) gained 0.78% at a time when SPY gained 1.16%. A starting capital of $100,000 at inception on 7/1/2014 would have grown to $365,451 which includes $1,033 cash and excludes $5,464 spent on fees and slippage. |
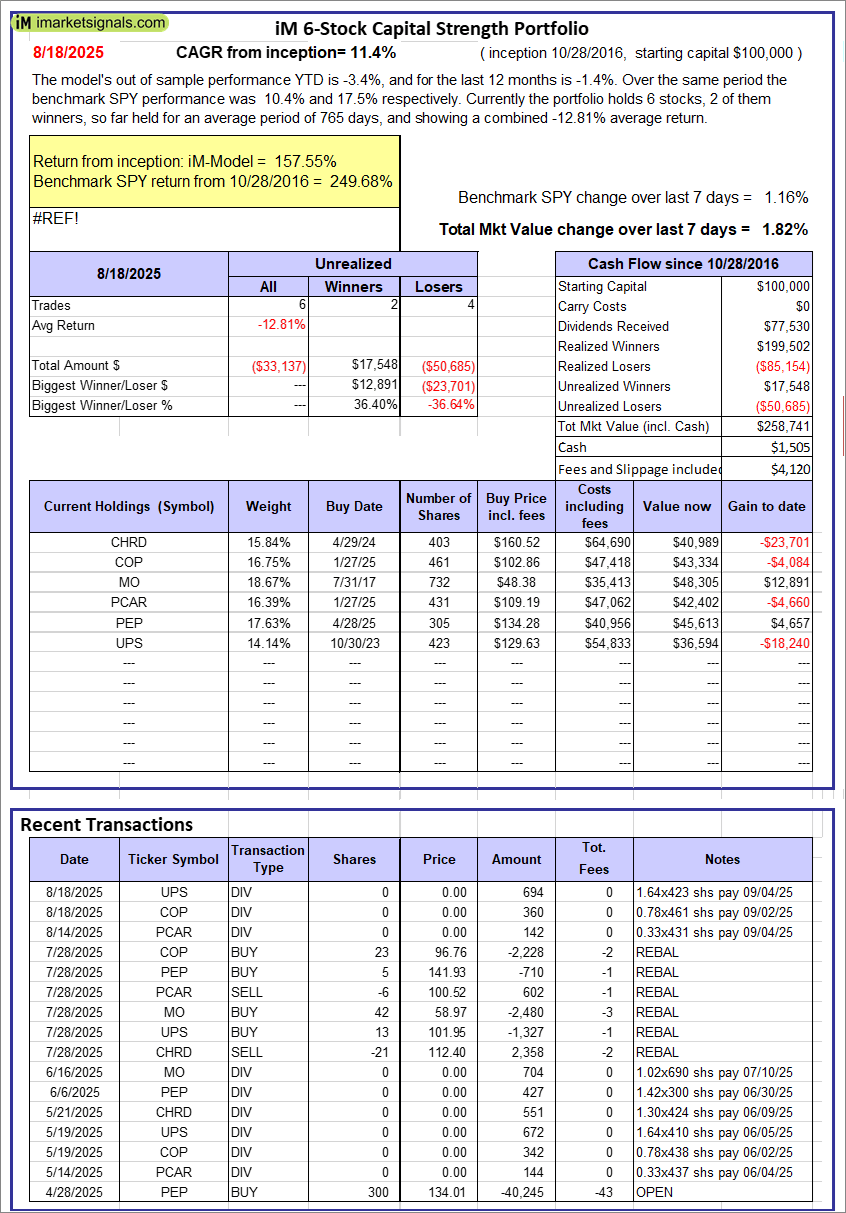 |
iM 6-Stock Capital Strength Portfolio: The model’s out of sample performance YTD is -3.4%, and for the last 12 months is -1.4%. Over the same period the benchmark SPY performance was 10.4% and 17.5% respectively. Over the previous week the market value of the iM 6-Stock Capital Strength Portfolio gained 1.82% at a time when SPY gained 1.16%. A starting capital of $100,000 at inception on 10/28/2016 would have grown to $258,741 which includes $1,505 cash and excludes $4,120 spent on fees and slippage. |
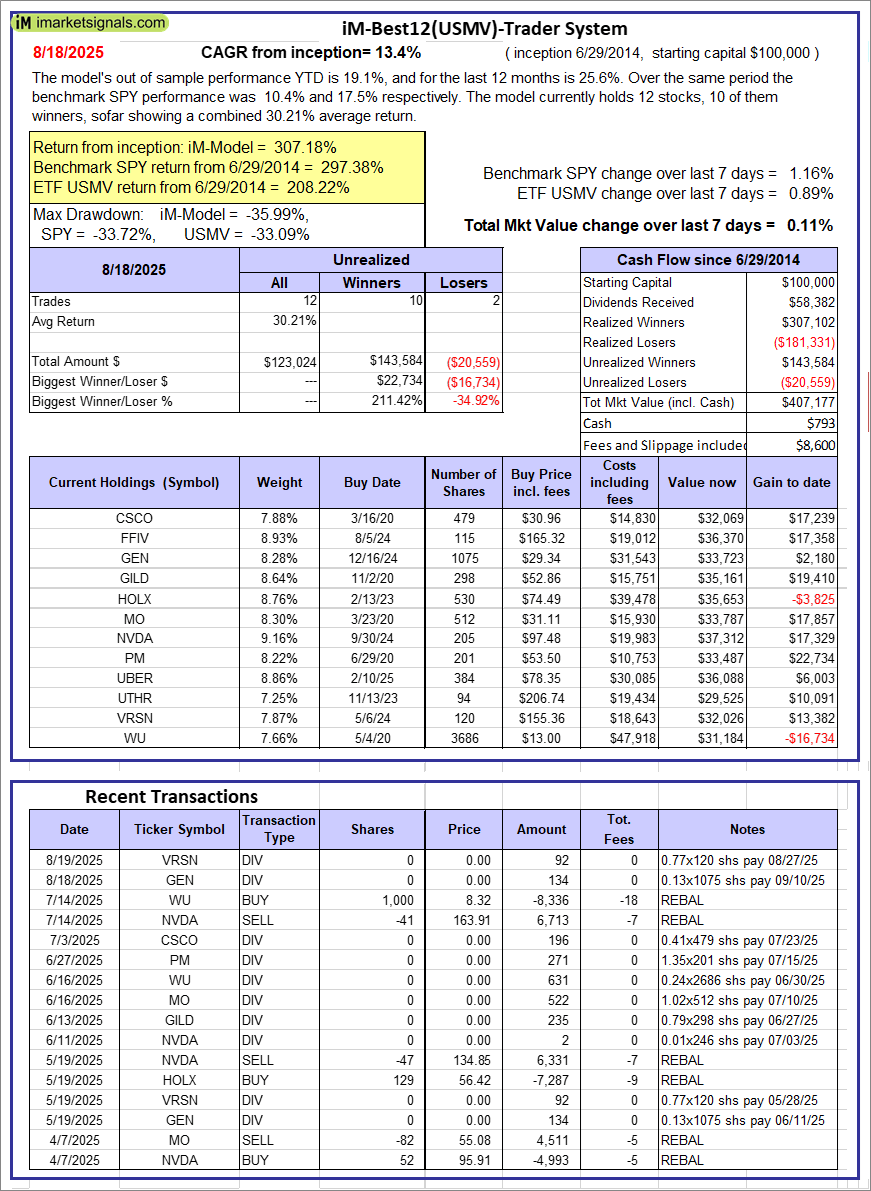 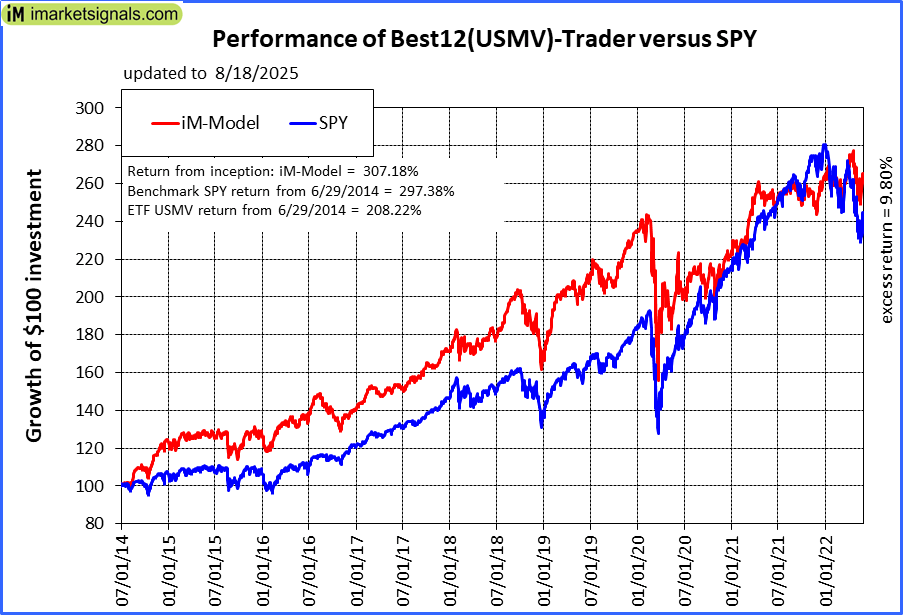 |
iM-Best12(USMV)-Trader: The model’s out of sample performance YTD is 19.1%, and for the last 12 months is 25.6%. Over the same period the benchmark SPY performance was 10.4% and 17.5% respectively. Since inception, on 6/30/2014, the model gained 307.18% while the benchmark SPY gained 297.38% and the ETF USMV gained 208.22% over the same period. Over the previous week the market value of iM-Best12(USMV)-Trader gained 0.11% at a time when SPY gained 1.16%. A starting capital of $100,000 at inception on 6/30/2014 would have grown to $407,177 which includes $793 cash and excludes $8,600 spent on fees and slippage. |
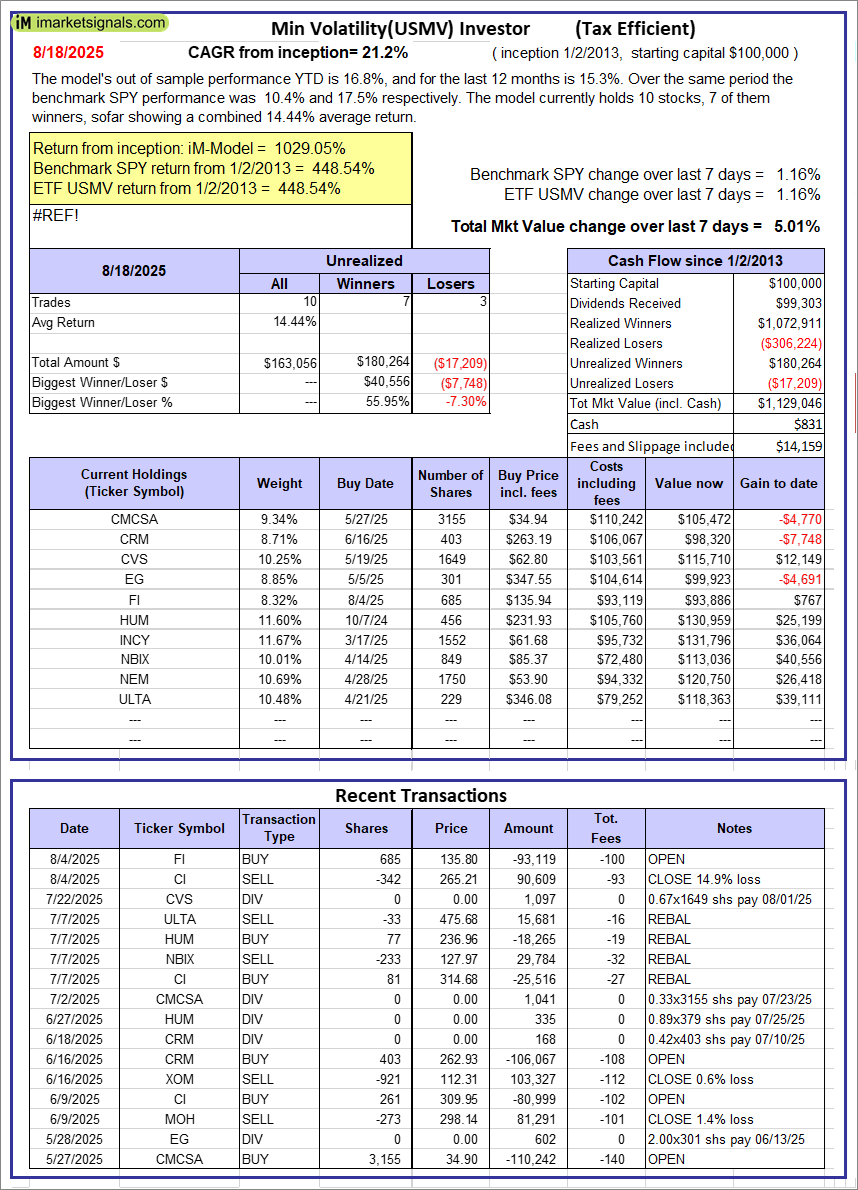 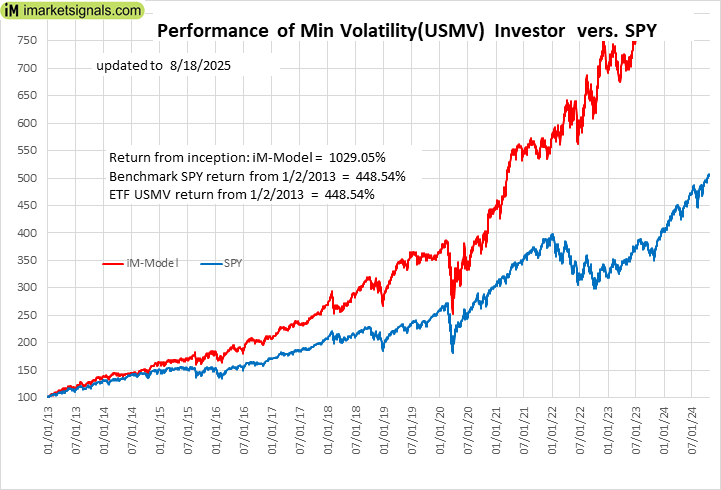 |
iM-Min Volatility(USMV) Investor (Tax Efficient): The model’s out of sample performance YTD is 16.8%, and for the last 12 months is 15.3%. Over the same period the benchmark SPY performance was 10.4% and 17.5% respectively. Since inception, on 1/3/2013, the model gained 1029.05% while the benchmark SPY gained 448.54% and the ETF USMV gained 448.54% over the same period. Over the previous week the market value of iM-Best12(USMV)Q1 gained 5.01% at a time when SPY gained 1.16%. A starting capital of $100,000 at inception on 1/3/2013 would have grown to $1,129,046 which includes $831 cash and excludes $14,159 spent on fees and slippage. |
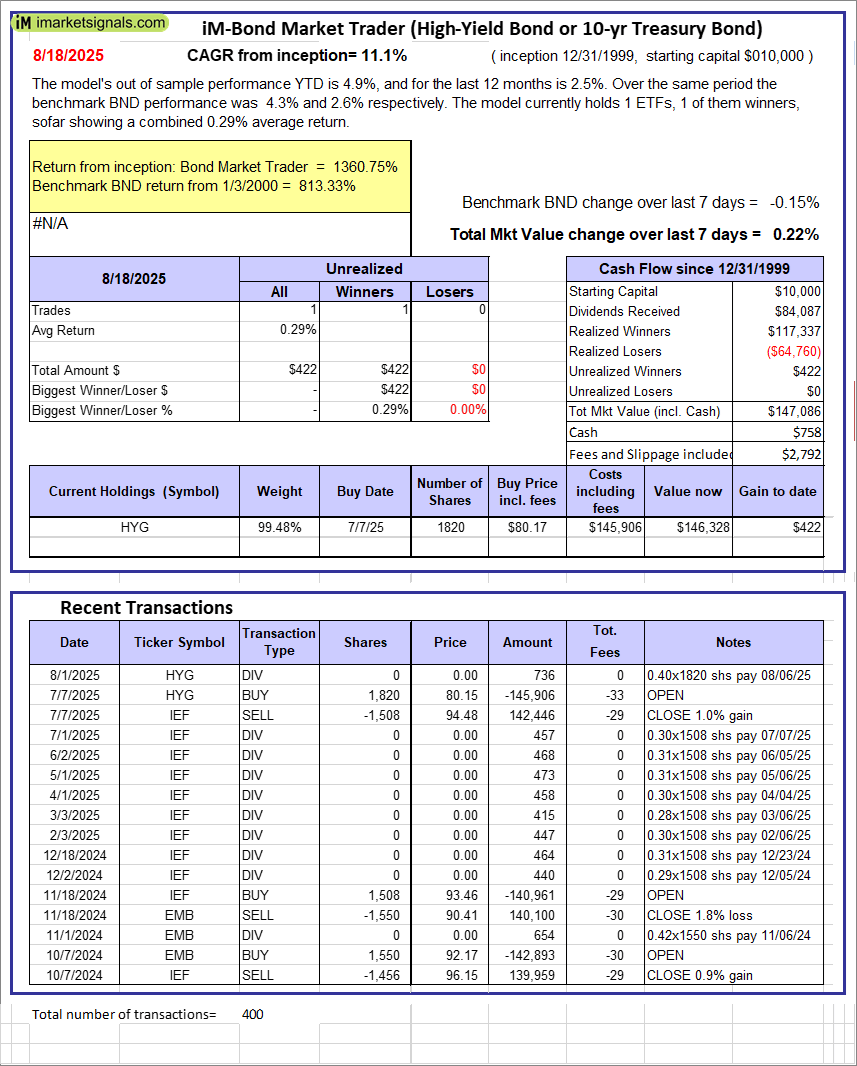 |
iM-Bond Market Trader (High-Yield Bond or 10-yr Treasury Bond): The model’s out of sample performance YTD is 4.9%, and for the last 12 months is 2.5%. Over the same period the benchmark BND performance was 4.3% and 2.6% respectively. Over the previous week the market value of the iM-Bond Market Trader (High-Yield Bond or 10-yr Treasury Bond) gained 0.22% at a time when BND gained -0.15%. A starting capital of $10,000 at inception on 1/3/2000 would have grown to $147,086 which includes $758 cash and excludes $2,792 spent on fees and slippage. |
|
|
iM-ModSum/YieldCurve Timer: The model’s out of sample performance YTD is 18.0%, and for the last 12 months is 23.2%. Over the same period the benchmark SPY performance was 10.4% and 17.5% respectively. Over the previous week the market value of iM-PortSum/YieldCurve Timer gained 1.16% at a time when SPY gained 1.16%. A starting capital of $100,000 at inception on 1/1/2016 would have grown to $378,690 which includes $1,716 cash and excludes $2,092 spent on fees and slippage. |
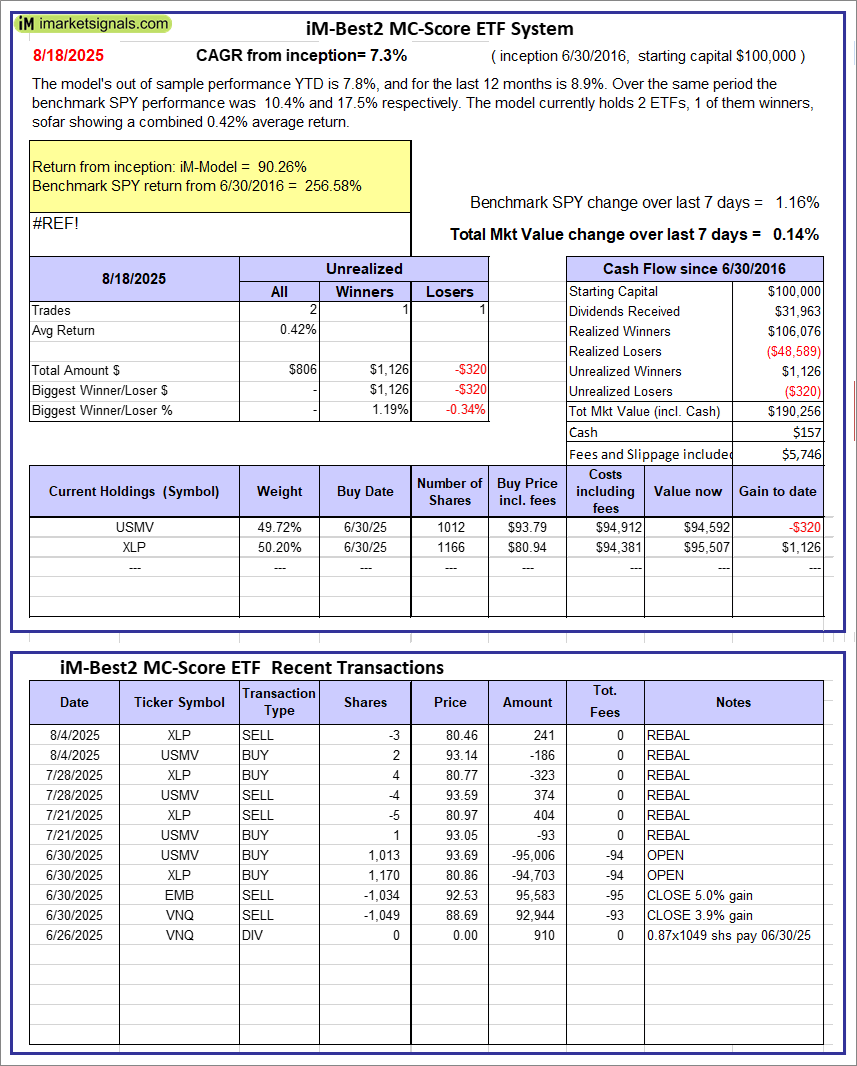 |
iM-Best2 MC-Score ETF System: The model’s out of sample performance YTD is 7.8%, and for the last 12 months is 8.9%. Over the same period the benchmark SPY performance was 10.4% and 17.5% respectively. Over the previous week the market value of the iM-Best2 MC-Score ETF System gained 0.14% at a time when SPY gained 1.16%. A starting capital of $100,000 at inception on 6/30/2016 would have grown to $190,256 which includes $157 cash and excludes $5,746 spent on fees and slippage. |
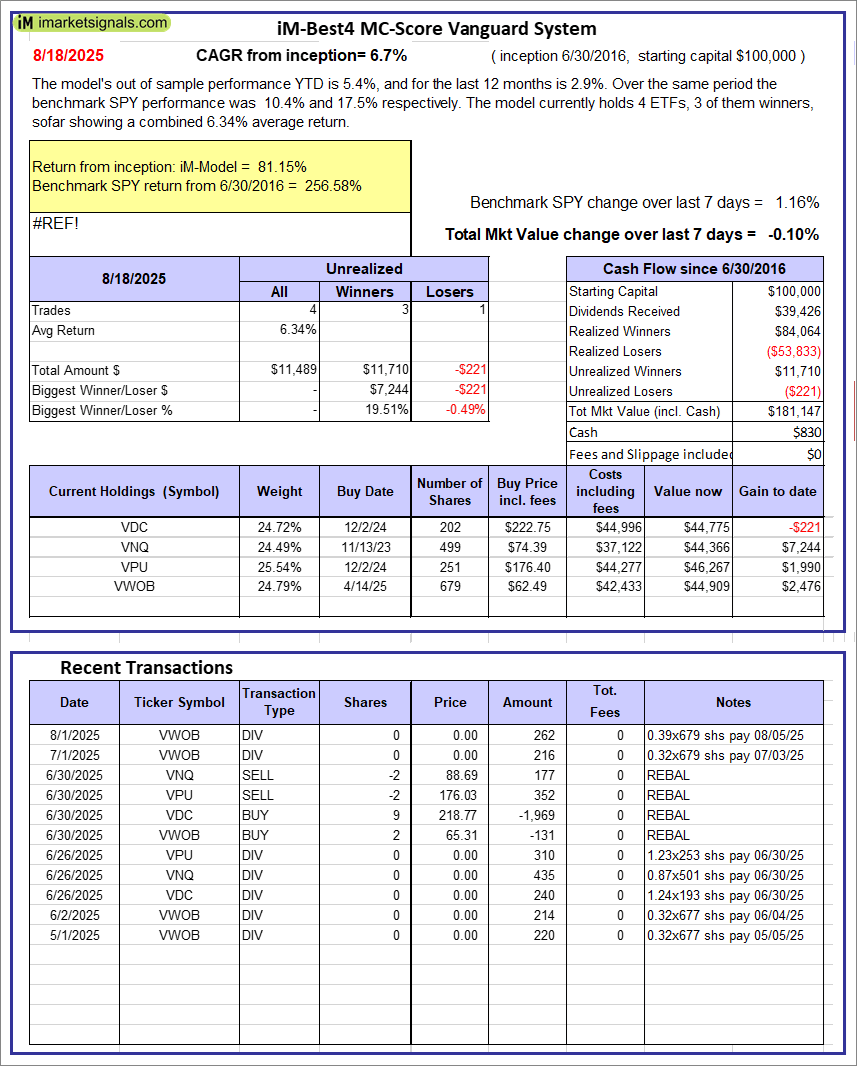 |
iM-Best4 MC-Score Vanguard System: The model’s out of sample performance YTD is 5.4%, and for the last 12 months is 2.9%. Over the same period the benchmark SPY performance was 10.4% and 17.5% respectively. Over the previous week the market value of the iM-Best4 MC-Score Vanguard System gained -0.10% at a time when SPY gained 1.16%. A starting capital of $100,000 at inception on 6/30/2016 would have grown to $181,147 which includes $830 cash and excludes $00 spent on fees and slippage. |
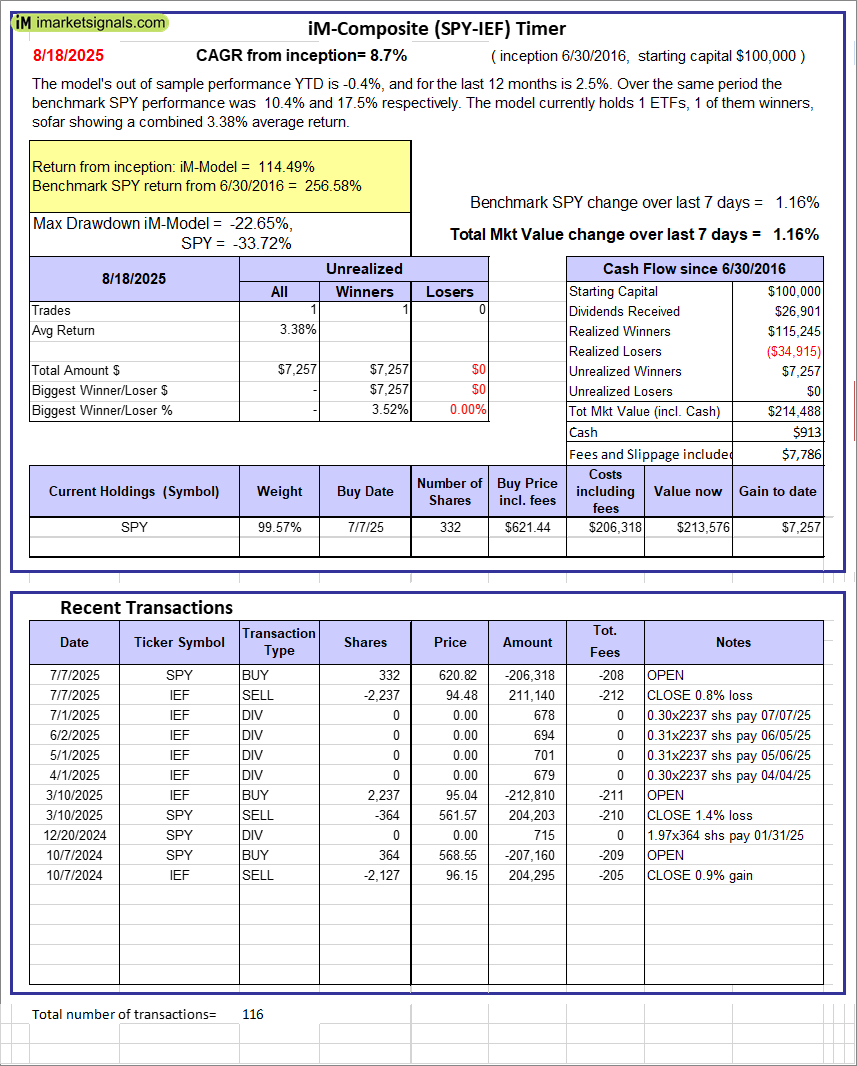 |
iM-Composite (SPY-IEF) Timer: The model’s out of sample performance YTD is -0.4%, and for the last 12 months is 2.5%. Over the same period the benchmark SPY performance was 10.4% and 17.5% respectively. Over the previous week the market value of the iM-Composite (SPY-IEF) Timer gained 1.16% at a time when SPY gained 1.16%. A starting capital of $100,000 at inception on 6/30/2016 would have grown to $214,488 which includes $913 cash and excludes $7,786 spent on fees and slippage. |
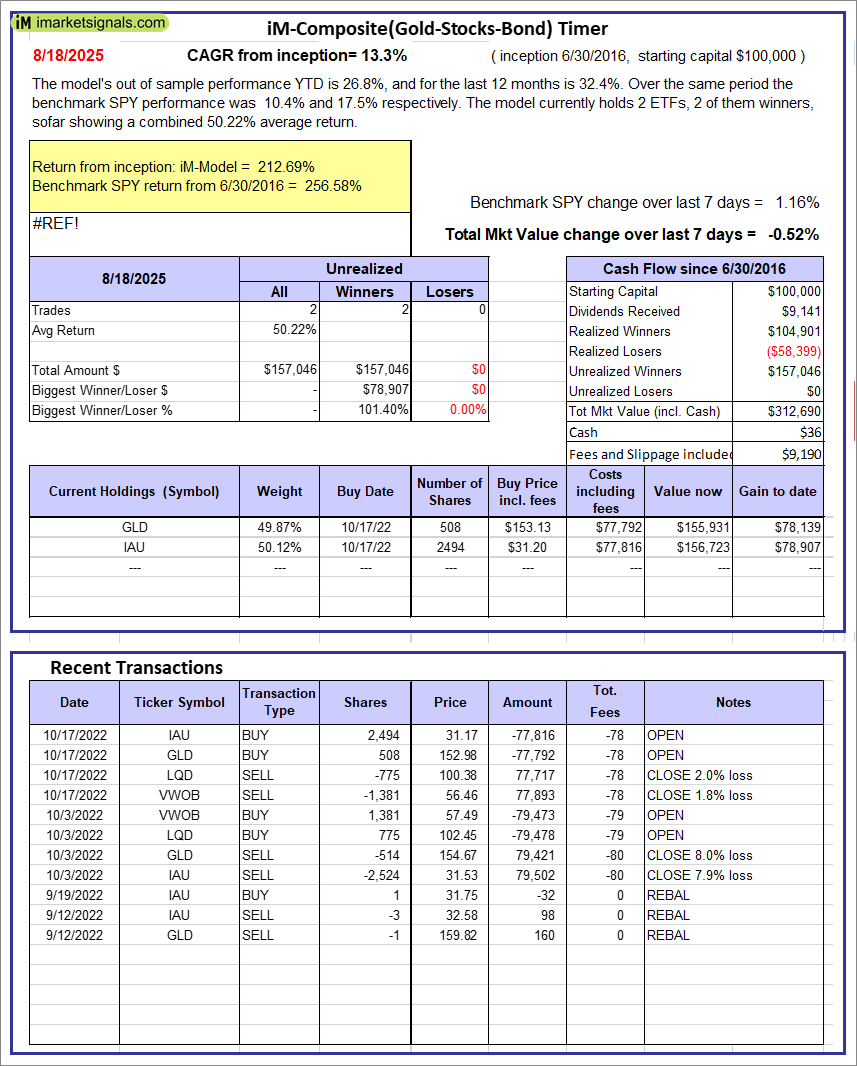 |
iM-Composite(Gold-Stocks-Bond) Timer: The model’s out of sample performance YTD is 26.8%, and for the last 12 months is 32.4%. Over the same period the benchmark SPY performance was 10.4% and 17.5% respectively. Over the previous week the market value of the iM-Composite(Gold-Stocks-Bond) Timer gained -0.52% at a time when SPY gained 1.16%. A starting capital of $100,000 at inception on 6/30/2016 would have grown to $312,690 which includes $36 cash and excludes $9,190 spent on fees and slippage. |
iM-Best Reports – 8/18/2025
Posted in pmp SPY-SH
Leave a Reply
You must be logged in to post a comment.