
  |
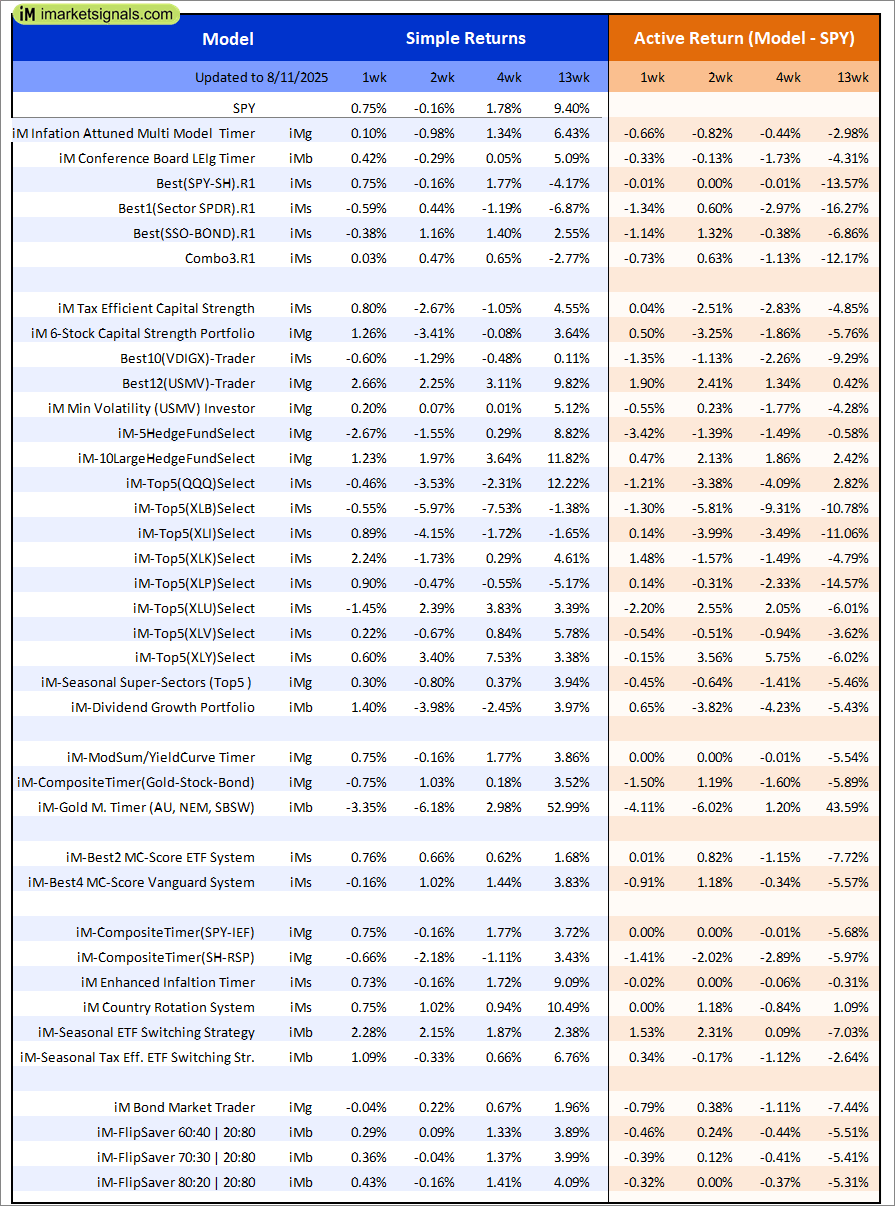
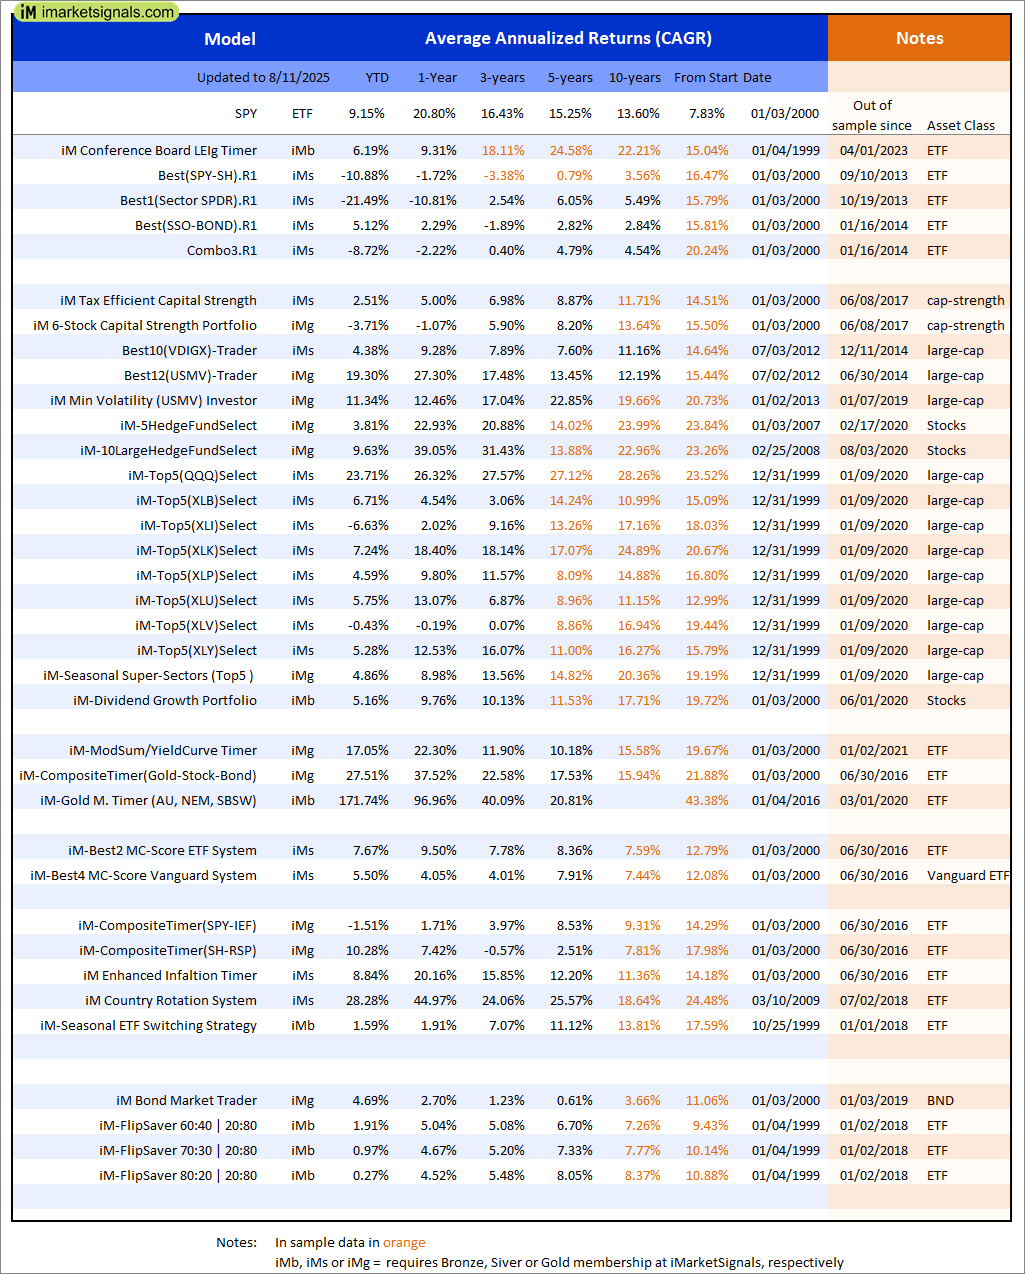
Out of sample performance summary of our models for the past 1, 2, 4 and 13 week periods. The active active return indicates how the models over- or underperformed the benchmark ETF SPY. Also the YTD, and the 1-, 3-, 5- and 10-year annualized returns are shown in the second table |
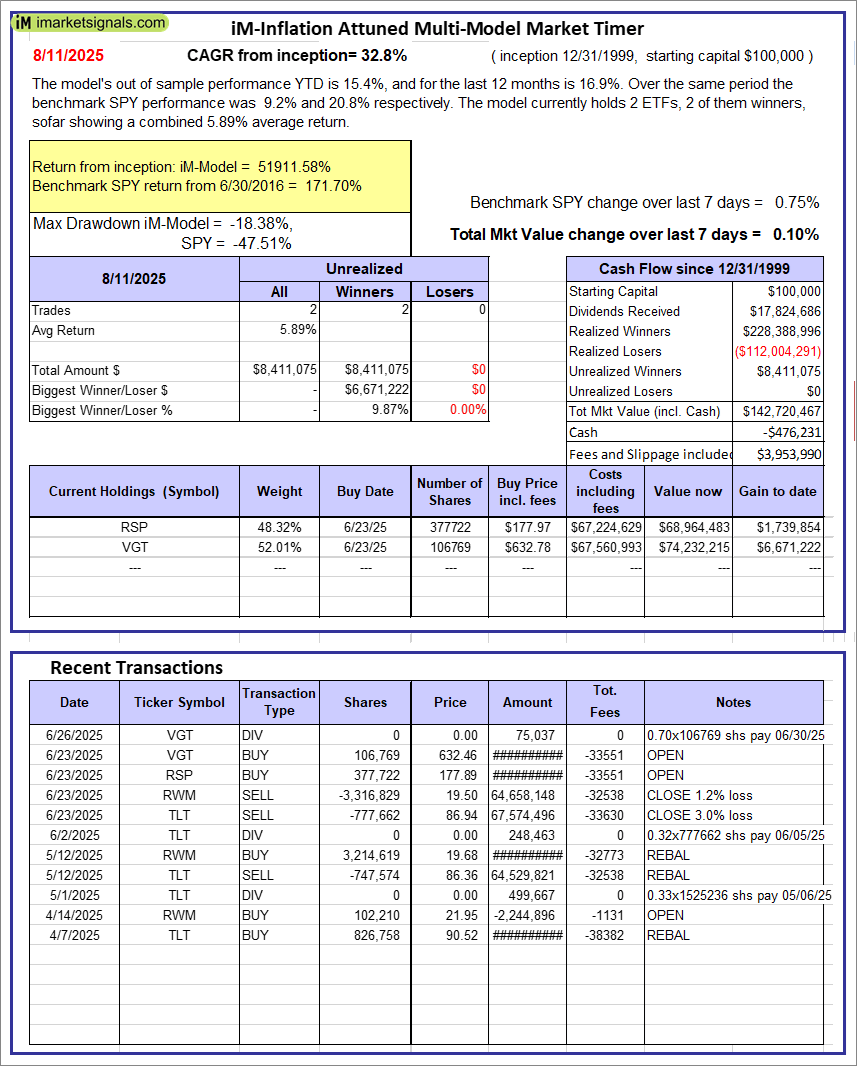 |
iM-Inflation Attuned Multi-Model Market Timer: The model’s out of sample performance YTD is 15.4%, and for the last 12 months is 16.9%. Over the same period the benchmark SPY performance was 9.2% and 20.8% respectively. Over the previous week the market value of the iM-Inflation Attuned Multi-Model Market Timer gained 0.10% at a time when SPY gained 0.75%. A starting capital of $100,000 at inception on 3/24/2017 would have grown to $142,720,467 which includes -$476,231 cash and excludes $3,953,990 spent on fees and slippage. |
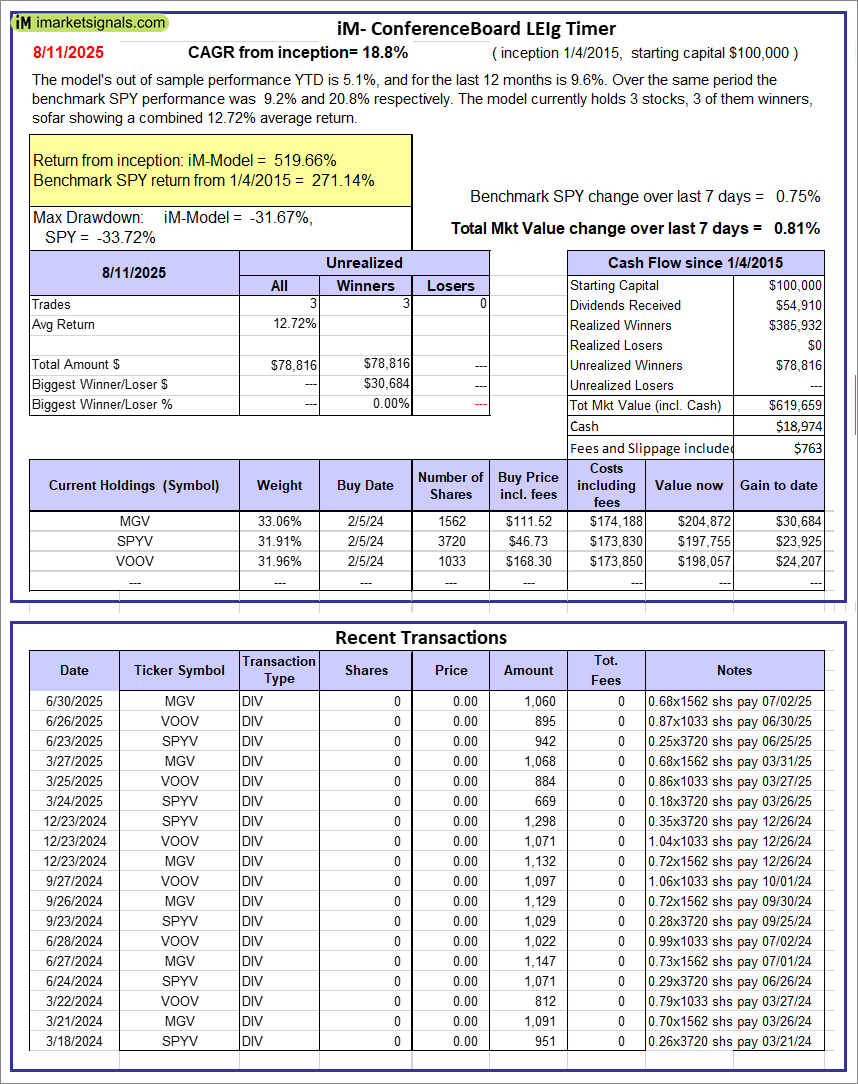 |
iM-Conference Board LEIg Timer: The model’s performance YTD is 14.3%, and for the last 12 months is 7.3%. Over the same period the benchmark SPY performance was 20.1% and 9.4% respectively. Over the previous week the market value of the iM-Conference Board LEIg Timer gained 0.81% at a time when SPY gained 0.75%. A starting capital of $100,000 at inception on 4/5/2017 would have grown to $619,659 which includes $18,974 cash and excludes $763 spent on fees and slippage. |
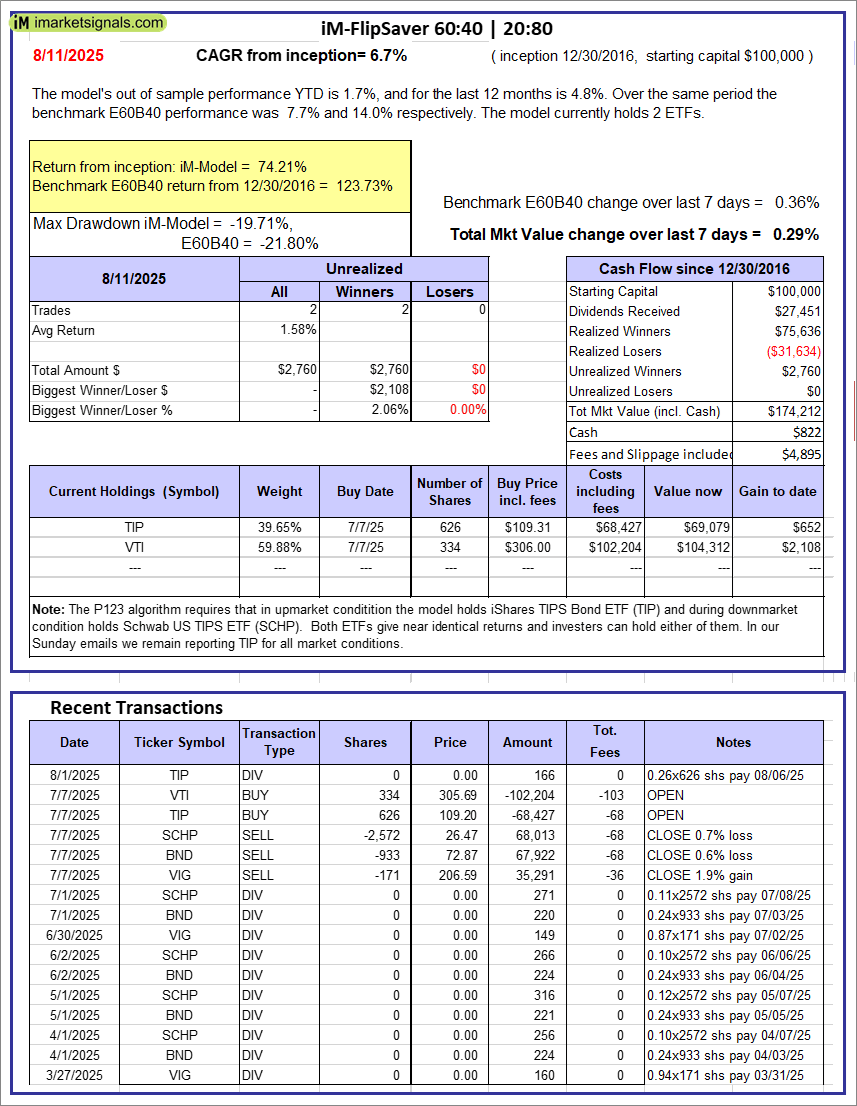 |
iM-FlipSaver 60:40 | 20:80 – 2017: The model’s out of sample performance YTD is 1.7%, and for the last 12 months is 4.8%. Over the same period the benchmark E60B40 performance was 7.7% and 14.0% respectively. Over the previous week the market value of iM-FlipSaver 80:20 | 20:80 gained 0.29% at a time when SPY gained 0.36%. A starting capital of $100,000 at inception on 7/16/2015 would have grown to $174,212 which includes $822 cash and excludes $4,895 spent on fees and slippage. |
 |
iM-FlipSaver 70:30 | 20:80 – 2017: The model’s out of sample performance YTD is 1.0%, and for the last 12 months is 4.7%. Over the same period the benchmark E60B40 performance was 7.7% and 14.0% respectively. Over the previous week the market value of iM-FlipSaver 70:30 | 20:80 gained 0.36% at a time when SPY gained 0.36%. A starting capital of $100,000 at inception on 7/15/2015 would have grown to $181,270 which includes $934 cash and excludes $5,139 spent on fees and slippage. |
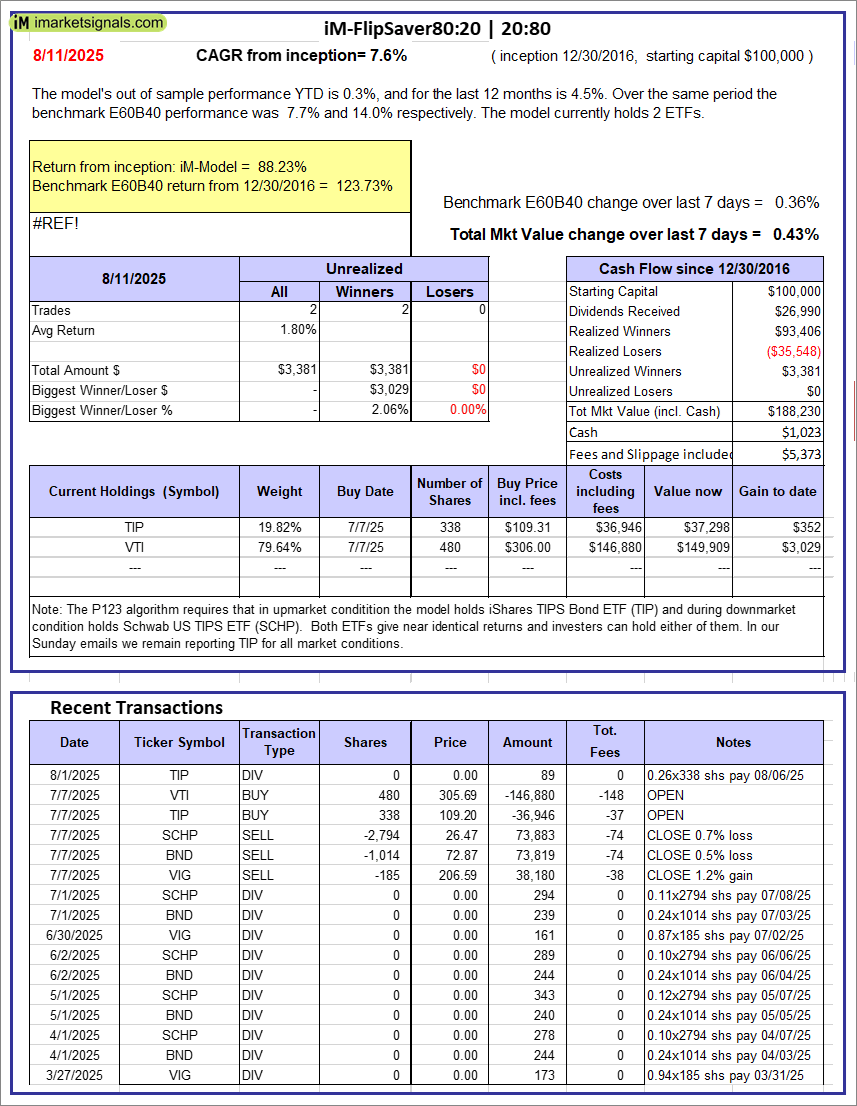 |
iM-FlipSaver 80:20 | 20:80 – 2017: The model’s out of sample performance YTD is 0.3%, and for the last 12 months is 4.5%. Over the same period the benchmark E60B40 performance was 7.7% and 14.0% respectively. Over the previous week the market value of iM-FlipSaver 80:20 | 20:80 gained 0.43% at a time when SPY gained 0.36%. A starting capital of $100,000 at inception on 1/2/2017 would have grown to $188,230 which includes $1,023 cash and excludes $5,373 spent on fees and slippage. |
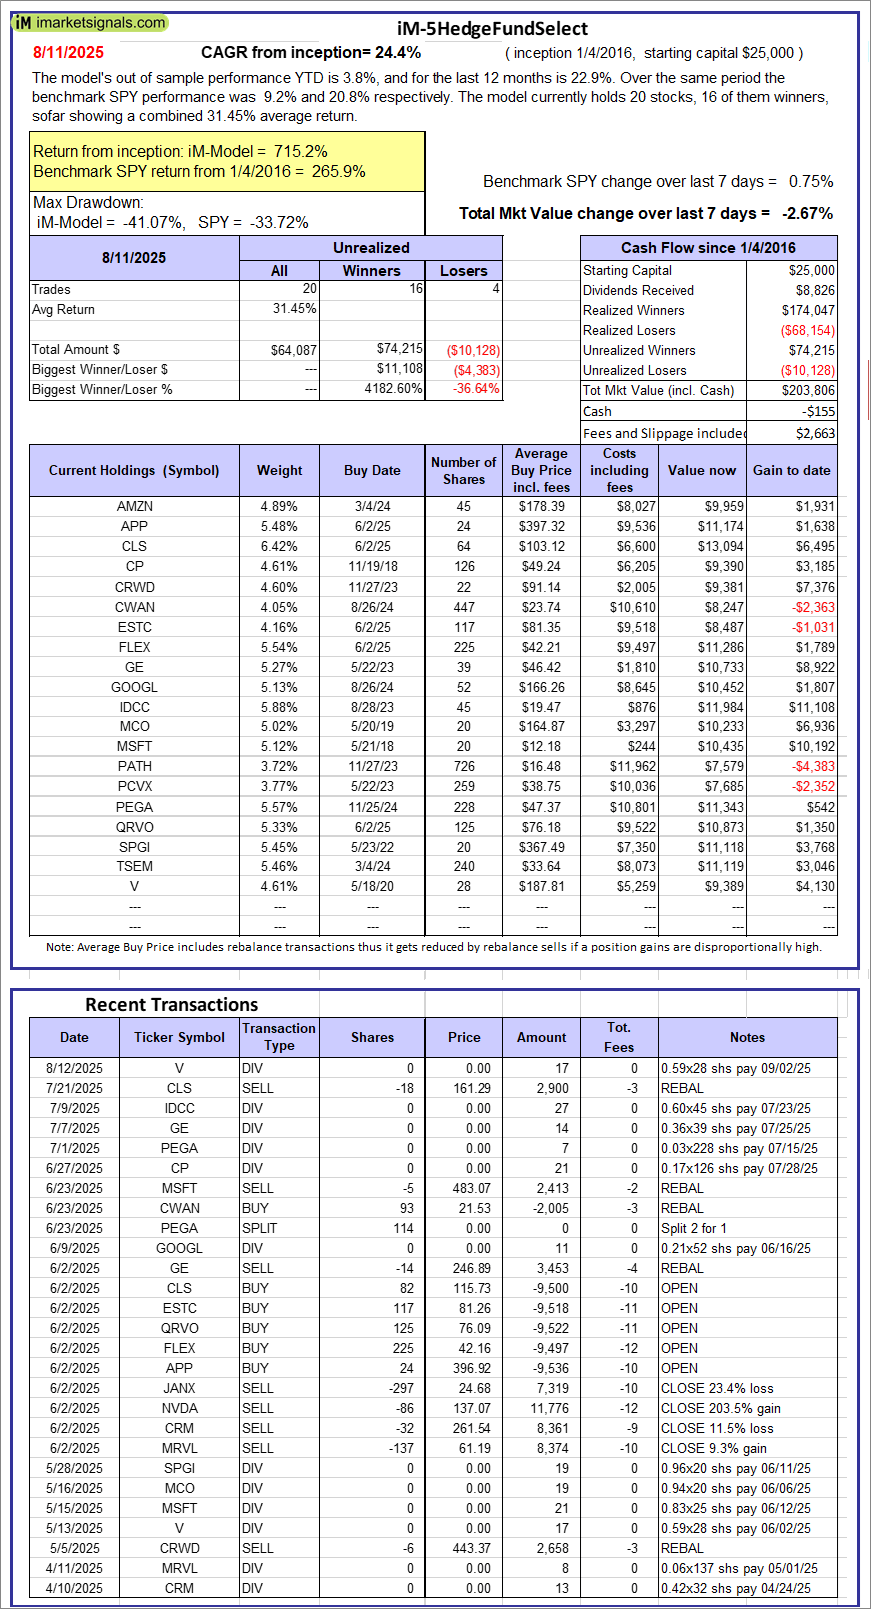 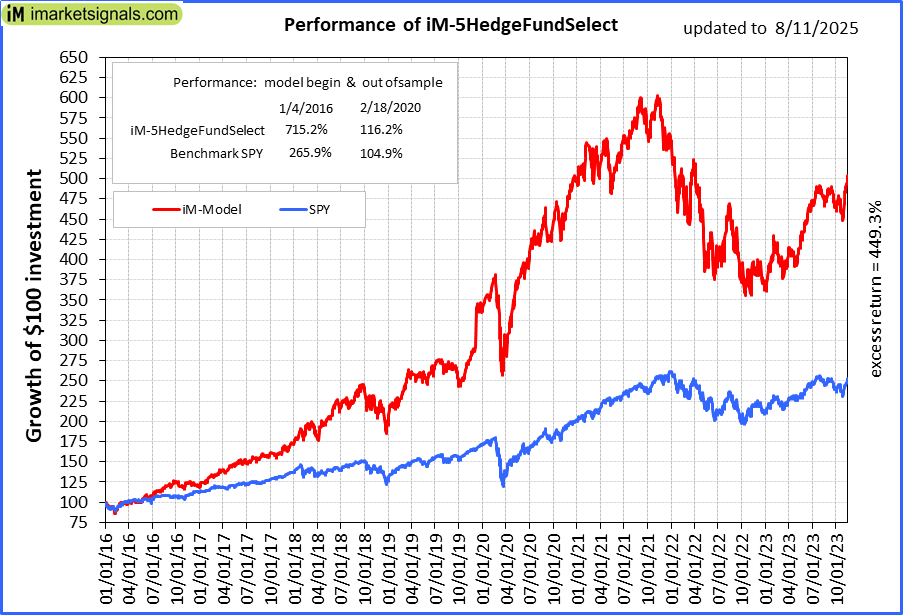 |
iM-5HedgeFundSelect: Since inception, on 1/5/2016, the model gained 715.22% while the benchmark SPY gained 265.94% over the same period. Over the previous week the market value of iM-5HedgeFundSelect gained -2.67% at a time when SPY gained 0.75%. A starting capital of $25,000 at inception on 1/5/2016 would have grown to $203,806 which includes -$155 cash and excludes $2,663 spent on fees and slippage. |
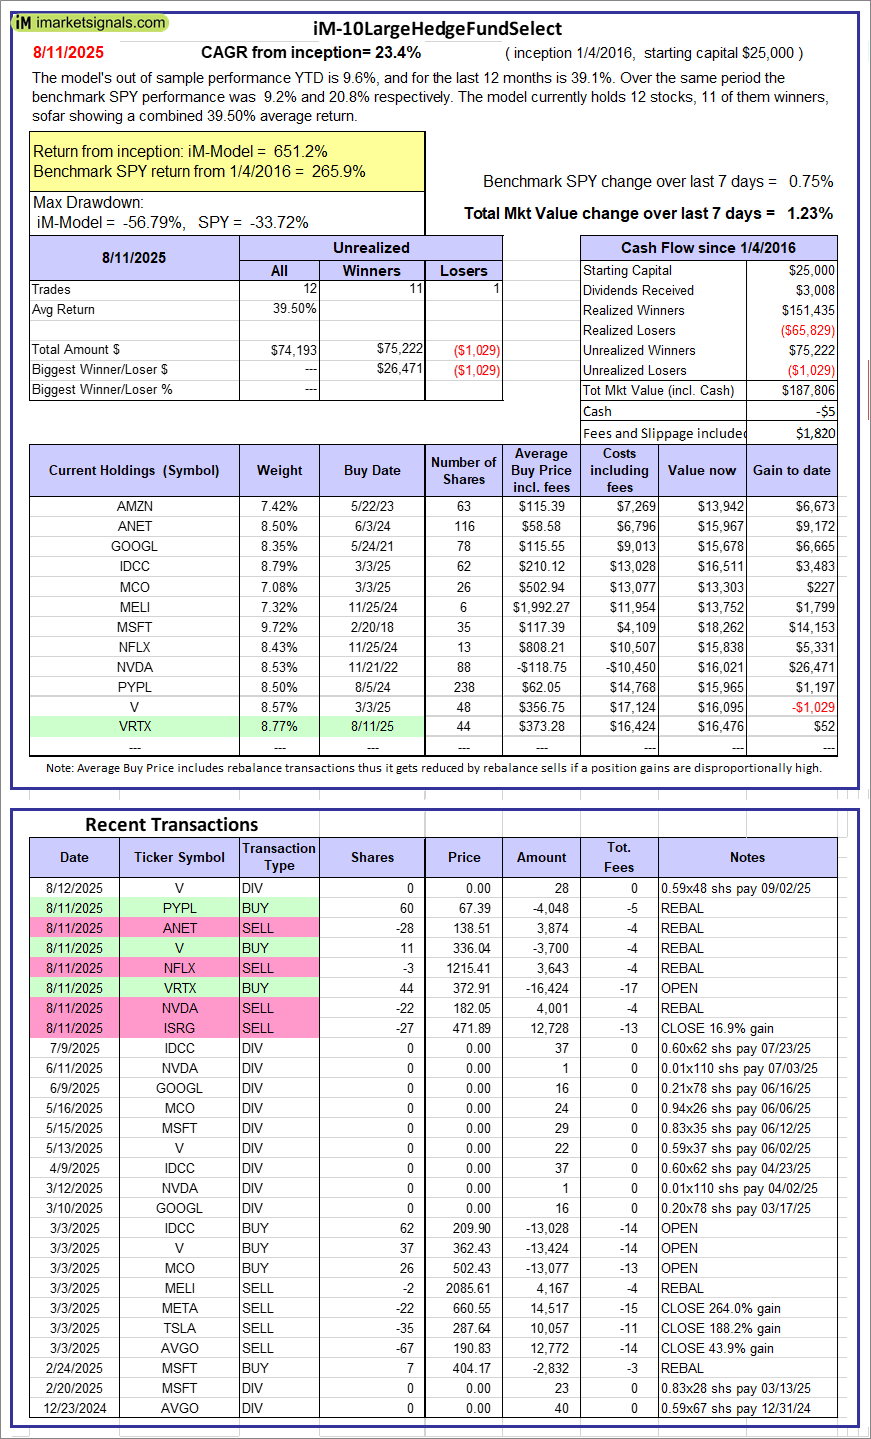 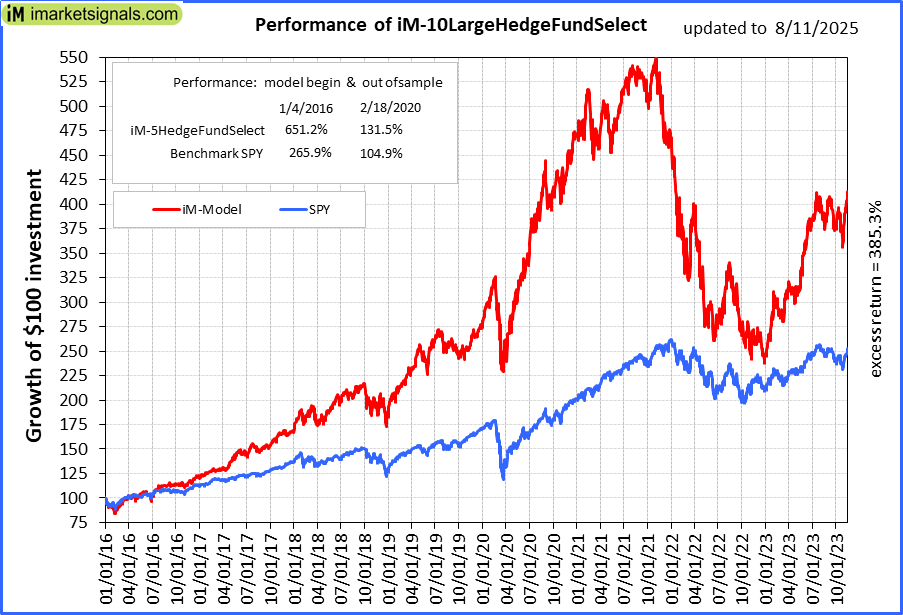 |
iM-10LargeHedgeFundSelect: Since inception, on 1/5/2016, the model gained 651.22% while the benchmark SPY gained 265.94% over the same period. Over the previous week the market value of iM-10LargeHedgeFundSelect gained 1.23% at a time when SPY gained 0.75%. A starting capital of $25,000 at inception on 1/5/2016 would have grown to $187,806 which includes -$5 cash and excludes $1,820 spent on fees and slippage. |
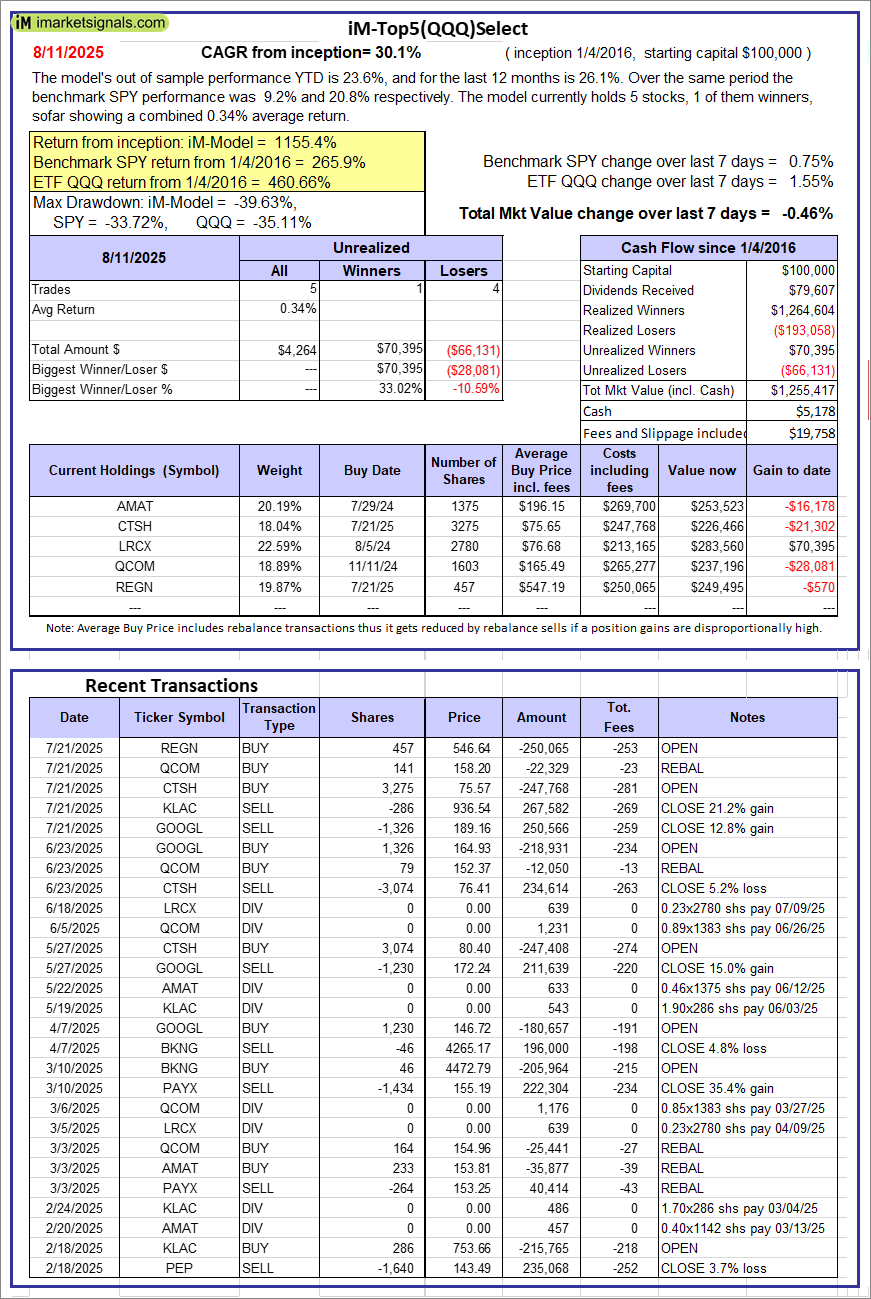 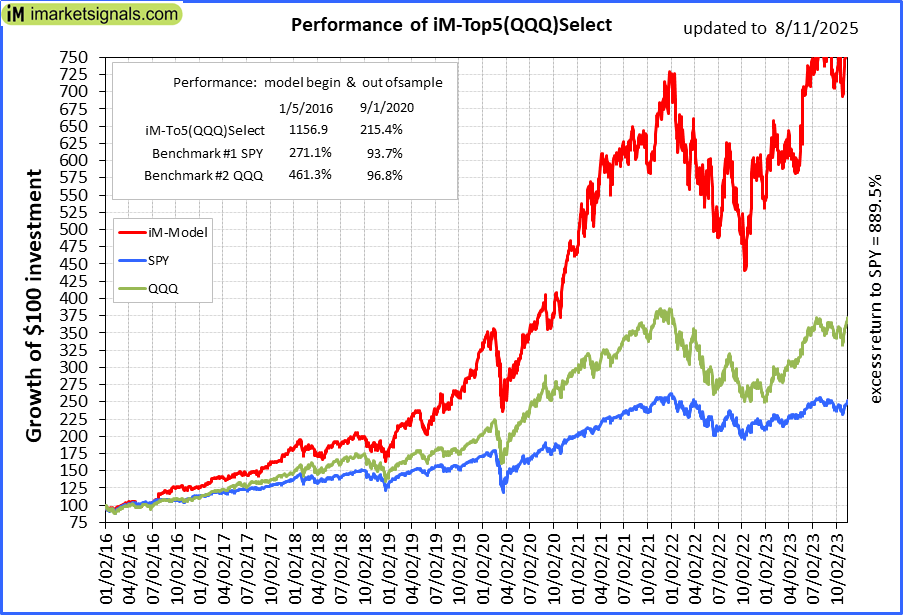 |
iM-Top5(QQQ)Select: Since inception, on 1/5/2016, the model gained 1155.42% while the benchmark SPY gained 265.94% over the same period. Over the previous week the market value of iM-Top5(QQQ)Select gained -0.46% at a time when SPY gained 0.75%. A starting capital of $100,000 at inception on 1/5/2016 would have grown to $1,255,417 which includes $5,178 cash and excludes $19,758 spent on fees and slippage. |
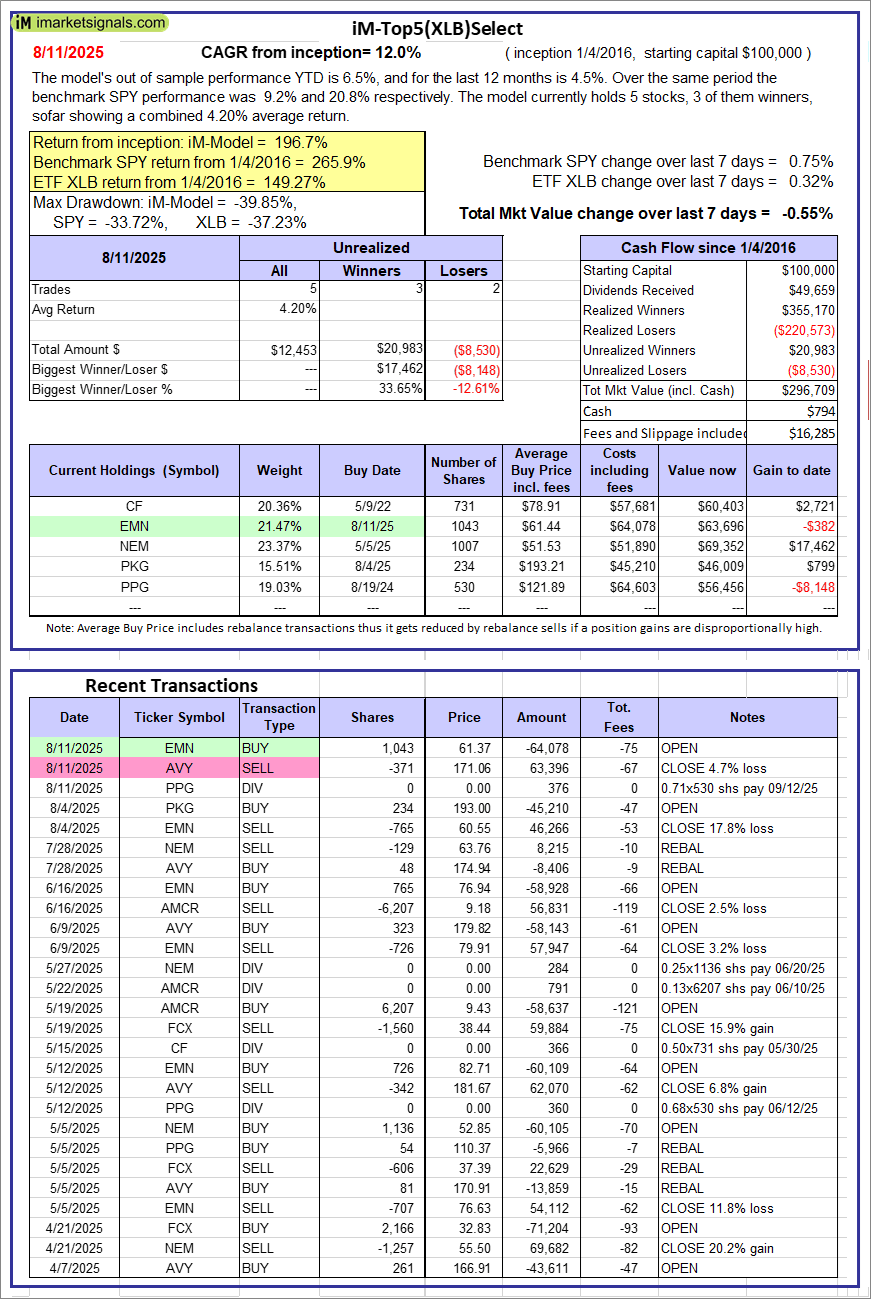 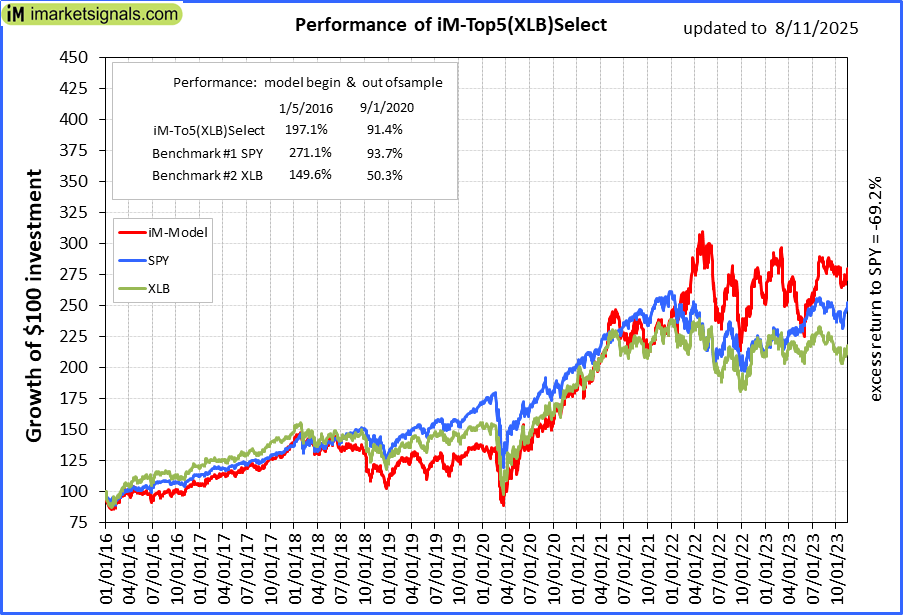 |
iM-Top5(XLB)Select: Since inception, on 1/5/2016, the model gained 196.71% while the benchmark SPY gained 265.94% over the same period. Over the previous week the market value of iM-Top5(XLB)Select gained -0.55% at a time when SPY gained 0.75%. A starting capital of $100,000 at inception on 1/5/2016 would have grown to $296,709 which includes $794 cash and excludes $16,285 spent on fees and slippage. |
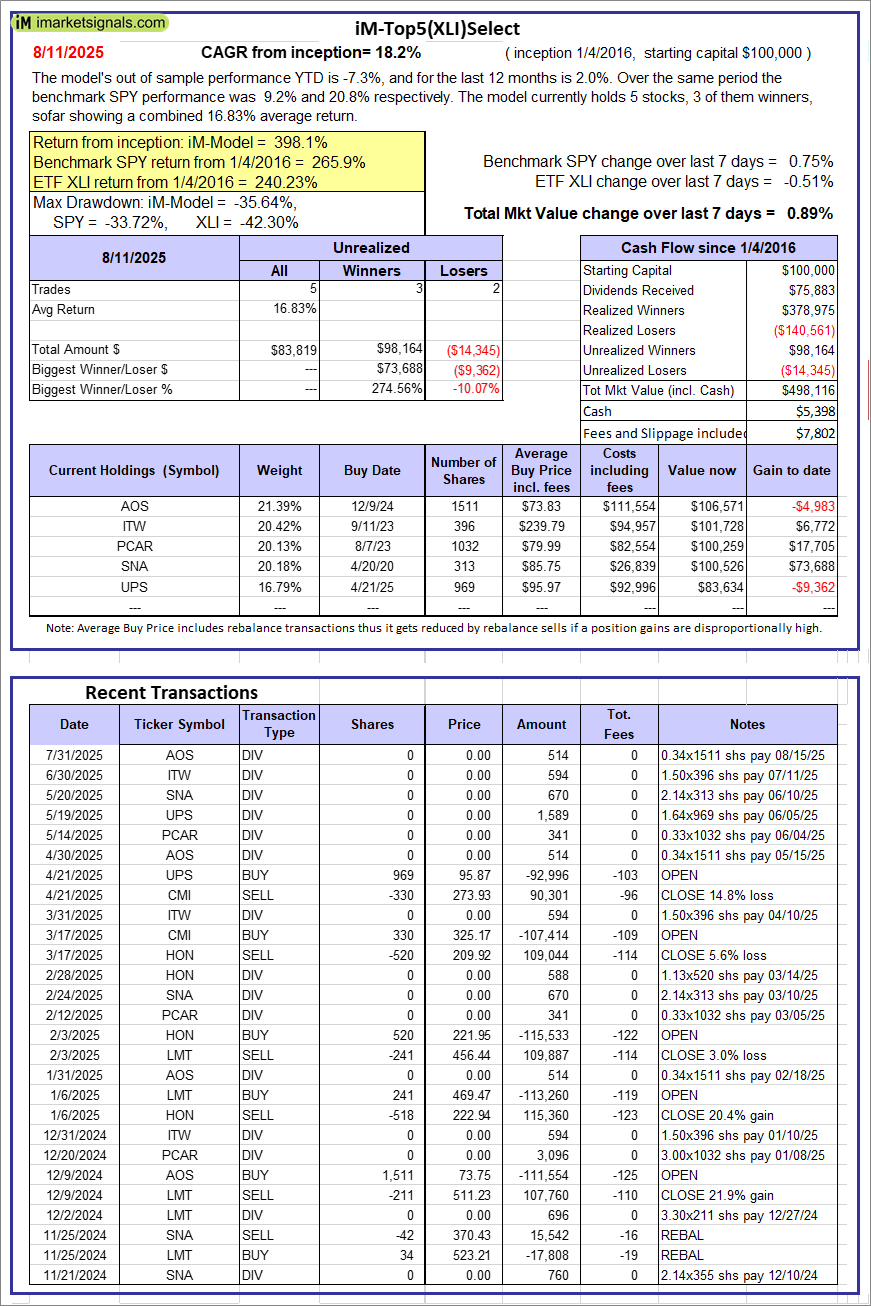 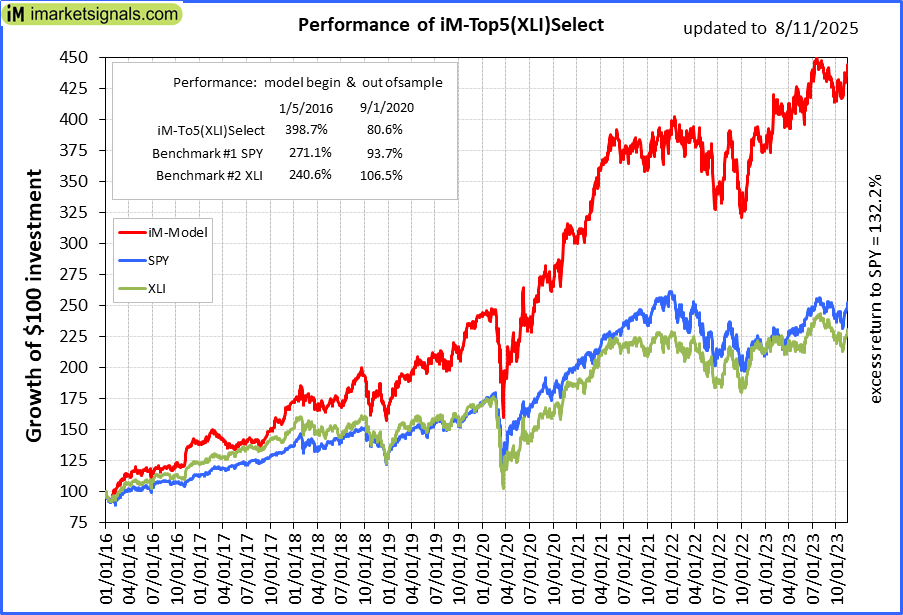 |
iM-Top5(XLI)Select: Since inception, on 1/5/2016, the model gained 398.12% while the benchmark SPY gained 265.94% over the same period. Over the previous week the market value of iM-Top5(XLI)Select gained 0.89% at a time when SPY gained 0.75%. A starting capital of $100,000 at inception on 1/5/2016 would have grown to $498,116 which includes $5,398 cash and excludes $7,802 spent on fees and slippage. |
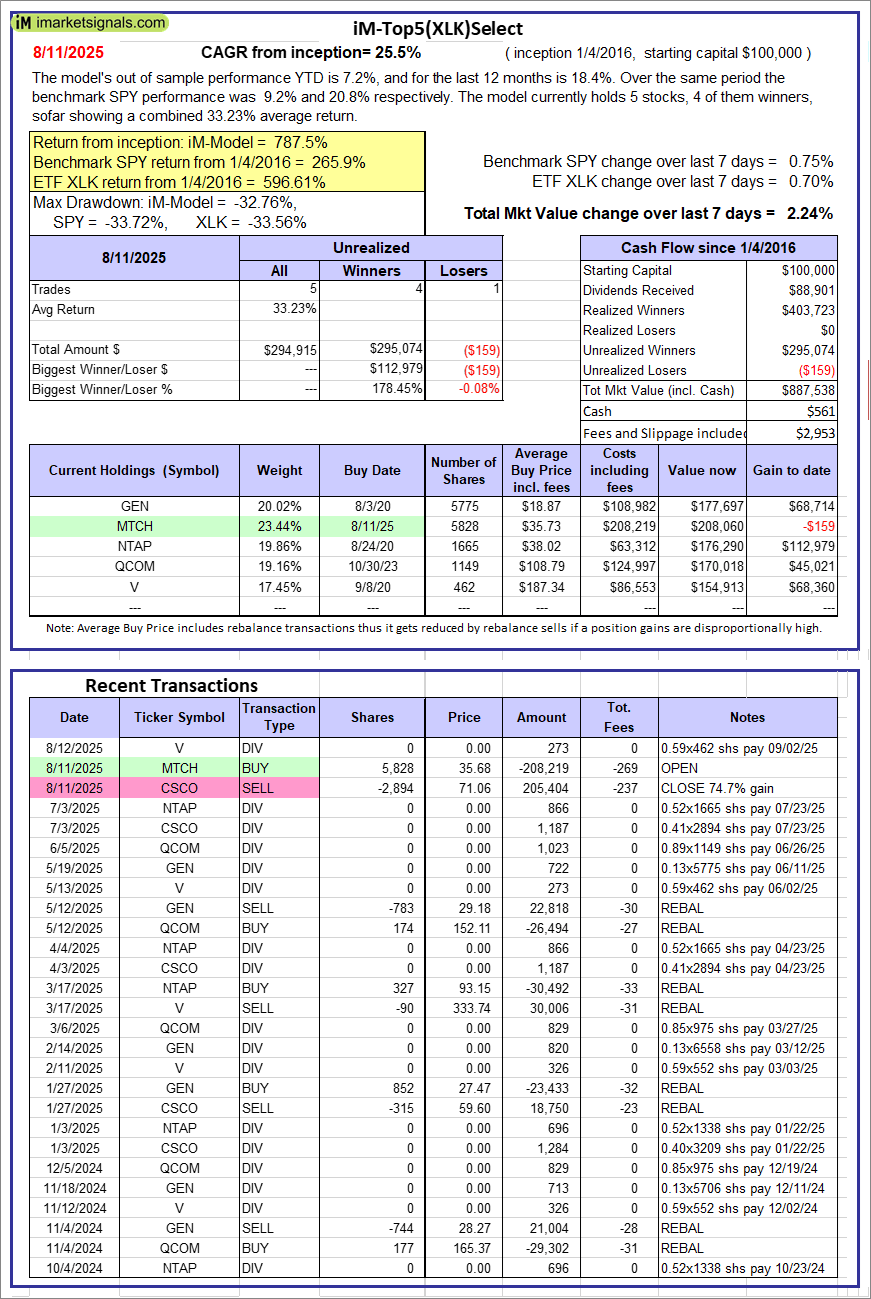 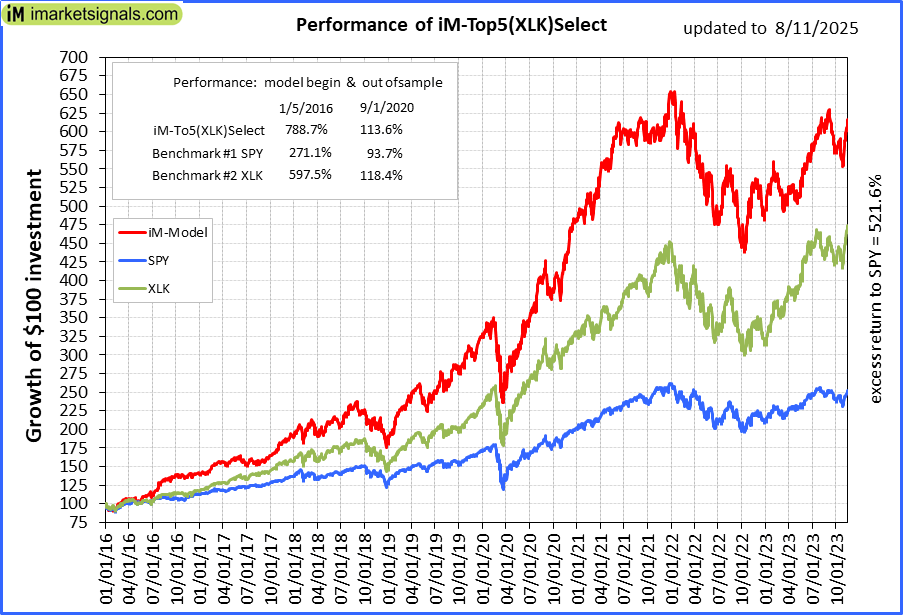 |
iM-Top5(XLK)Select: Since inception, on 1/5/2016, the model gained 787.54% while the benchmark SPY gained 265.94% over the same period. Over the previous week the market value of iM-Top5(XLK)Select gained 2.24% at a time when SPY gained 0.75%. A starting capital of $100,000 at inception on 1/5/2016 would have grown to $887,538 which includes $561 cash and excludes $2,953 spent on fees and slippage. |
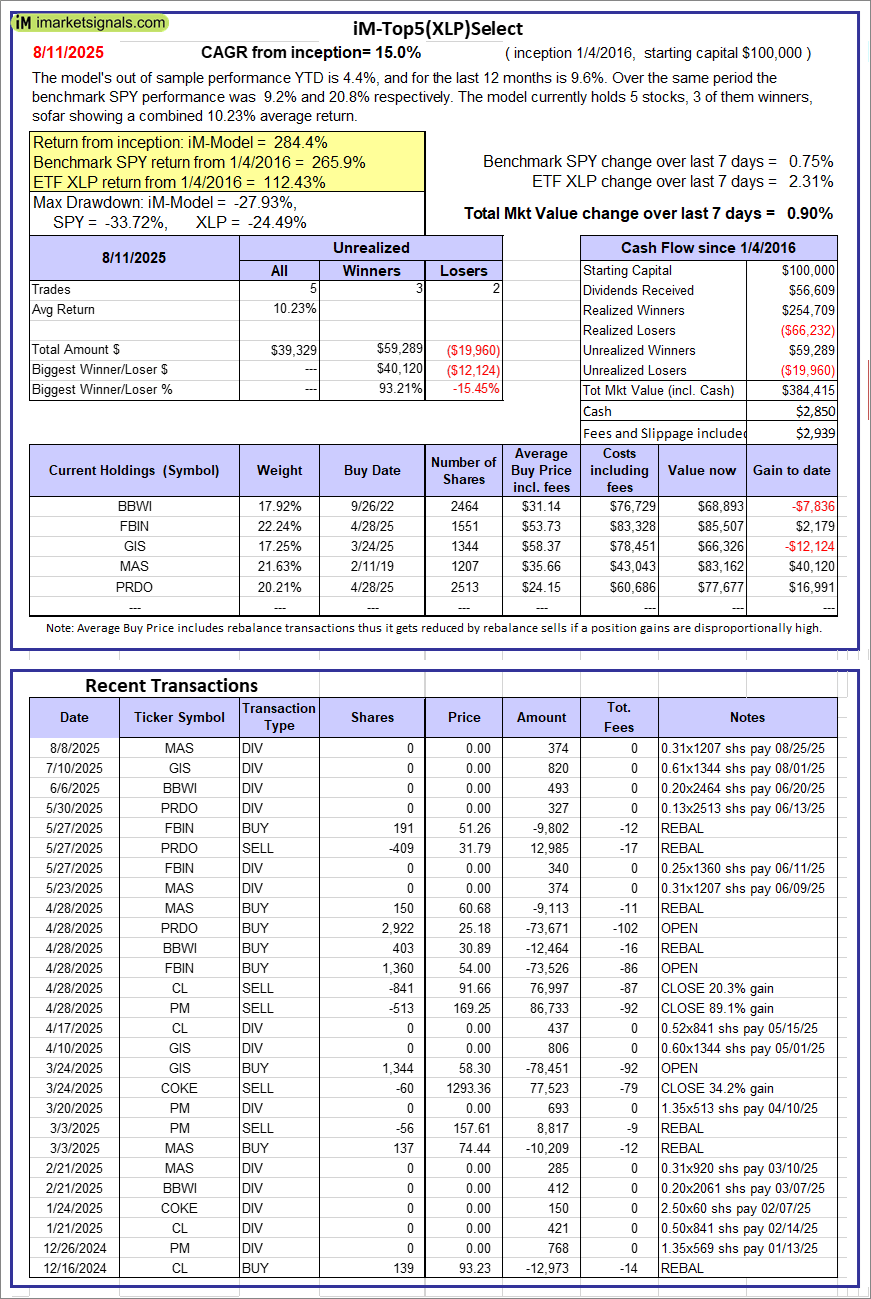 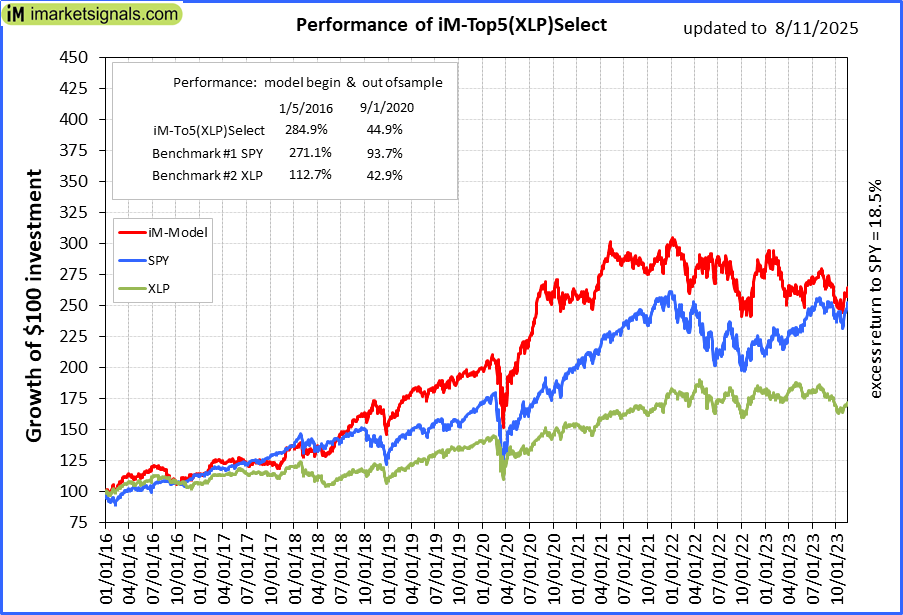 |
iM-Top5(XLP)Select: Since inception, on 1/5/2016, the model gained 284.42% while the benchmark SPY gained 265.94% over the same period. Over the previous week the market value of iM-Top5(XLP)Select gained 0.90% at a time when SPY gained 0.75%. A starting capital of $100,000 at inception on 1/5/2016 would have grown to $384,415 which includes $2,850 cash and excludes $2,939 spent on fees and slippage. |
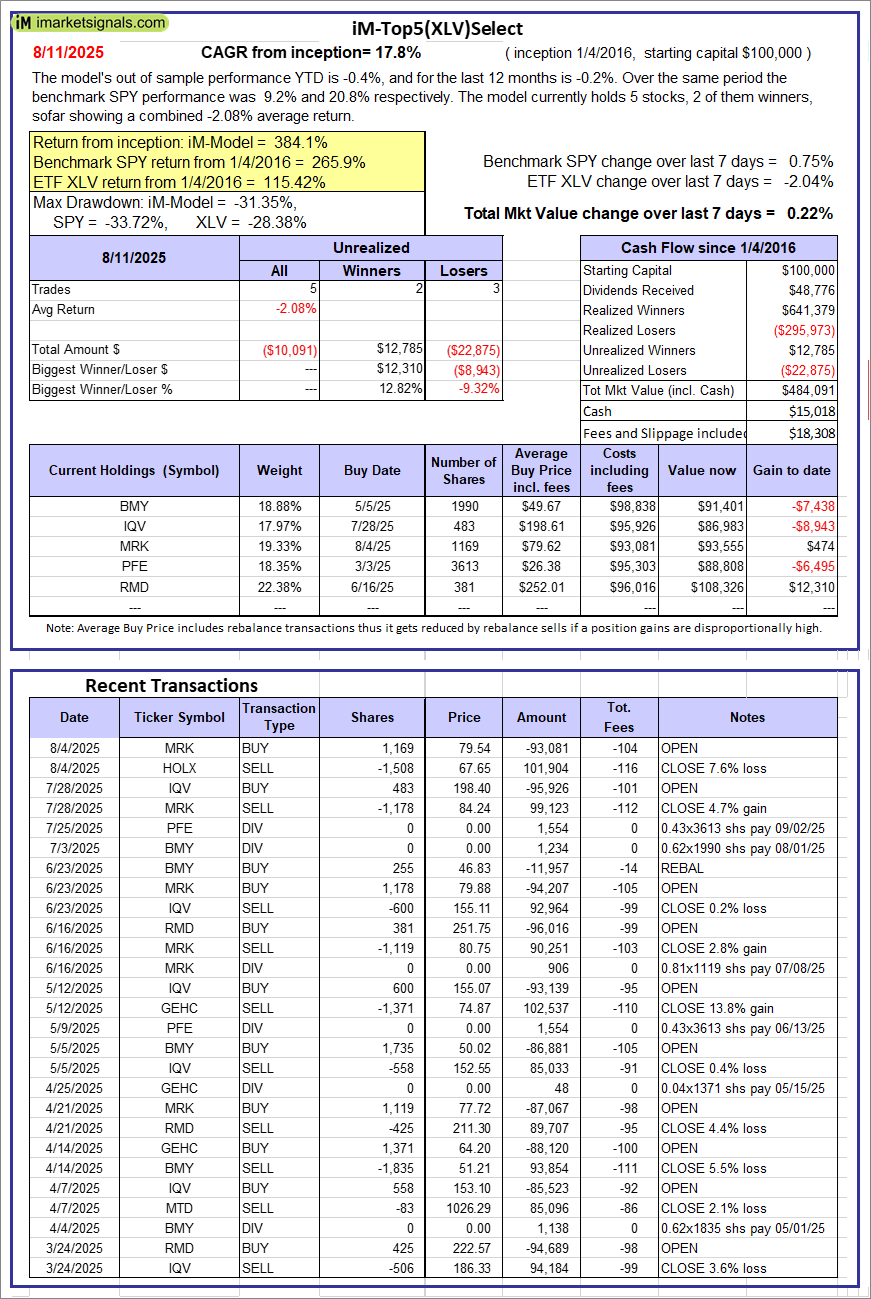 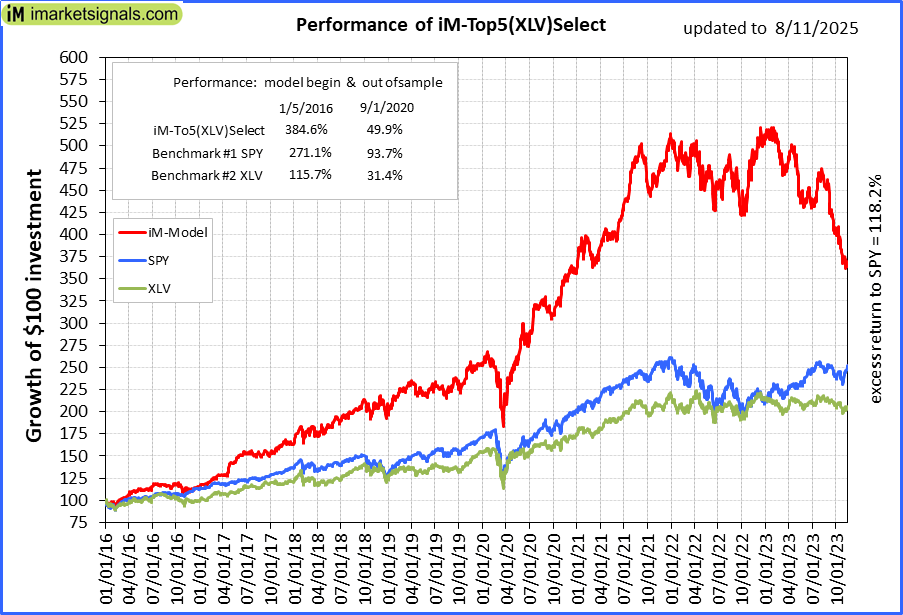 |
iM-Top5(XLV)Select: Since inception, on 1/5/2016, the model gained 384.09% while the benchmark SPY gained 265.94% over the same period. Over the previous week the market value of iM-Top5(XLV)Select gained 0.22% at a time when SPY gained 0.75%. A starting capital of $100,000 at inception on 1/5/2016 would have grown to $484,091 which includes $15,018 cash and excludes $18,308 spent on fees and slippage. |
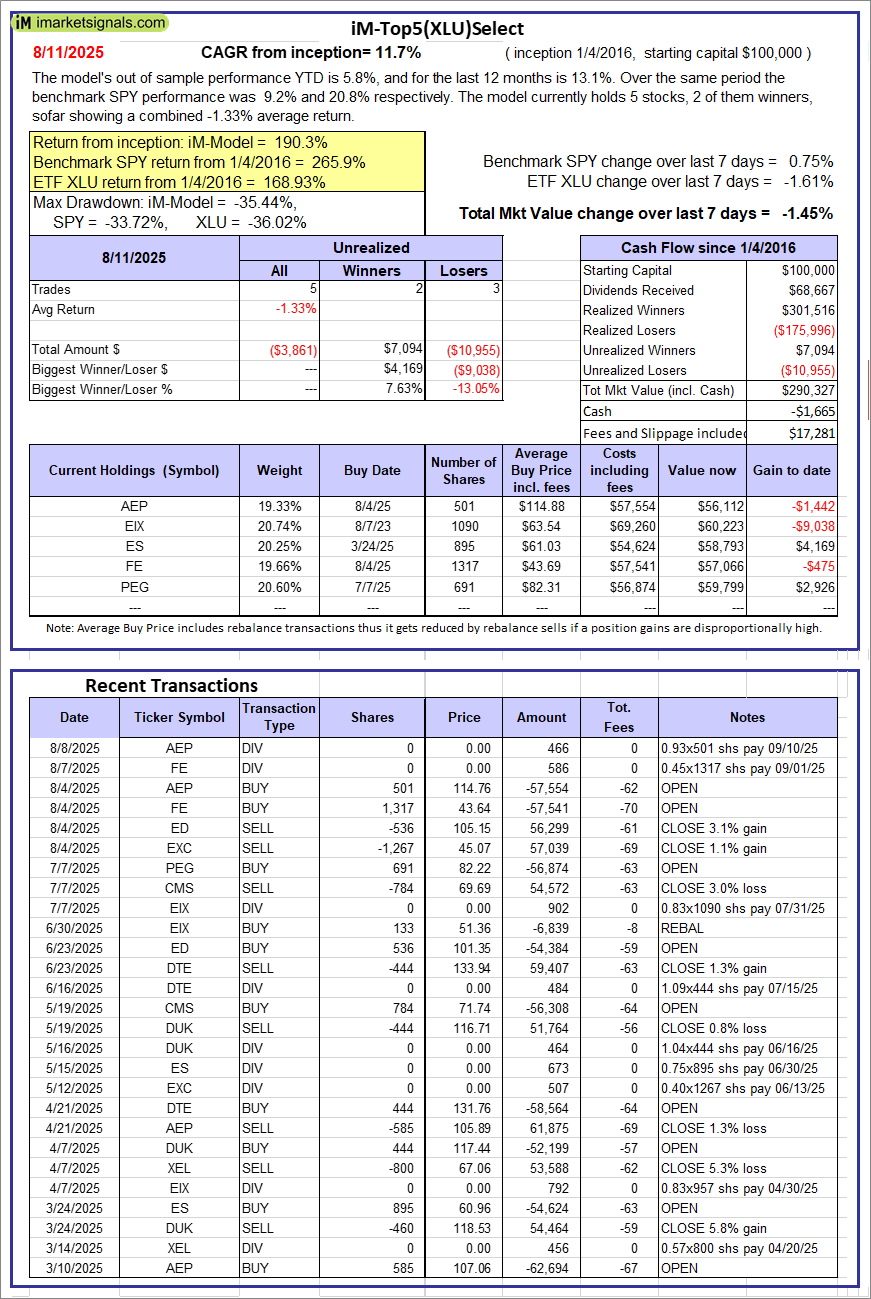 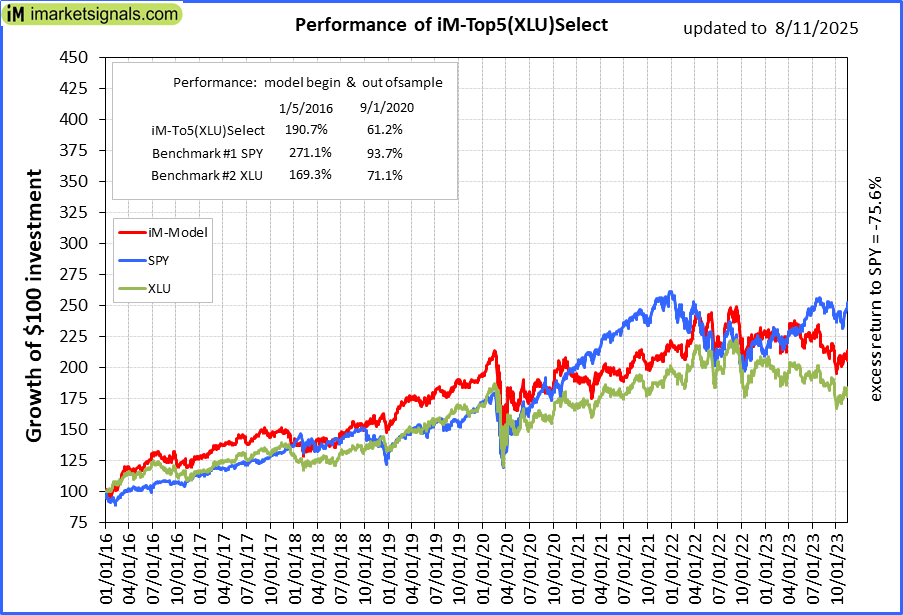 |
iM-Top5(XLU)Select: Since inception, on 1/5/2016, the model gained 190.33% while the benchmark SPY gained 265.94% over the same period. Over the previous week the market value of iM-Top5(XLU)Select gained -1.45% at a time when SPY gained 0.75%. A starting capital of $100,000 at inception on 1/5/2016 would have grown to $290,327 which includes -$1,665 cash and excludes $17,281 spent on fees and slippage. |
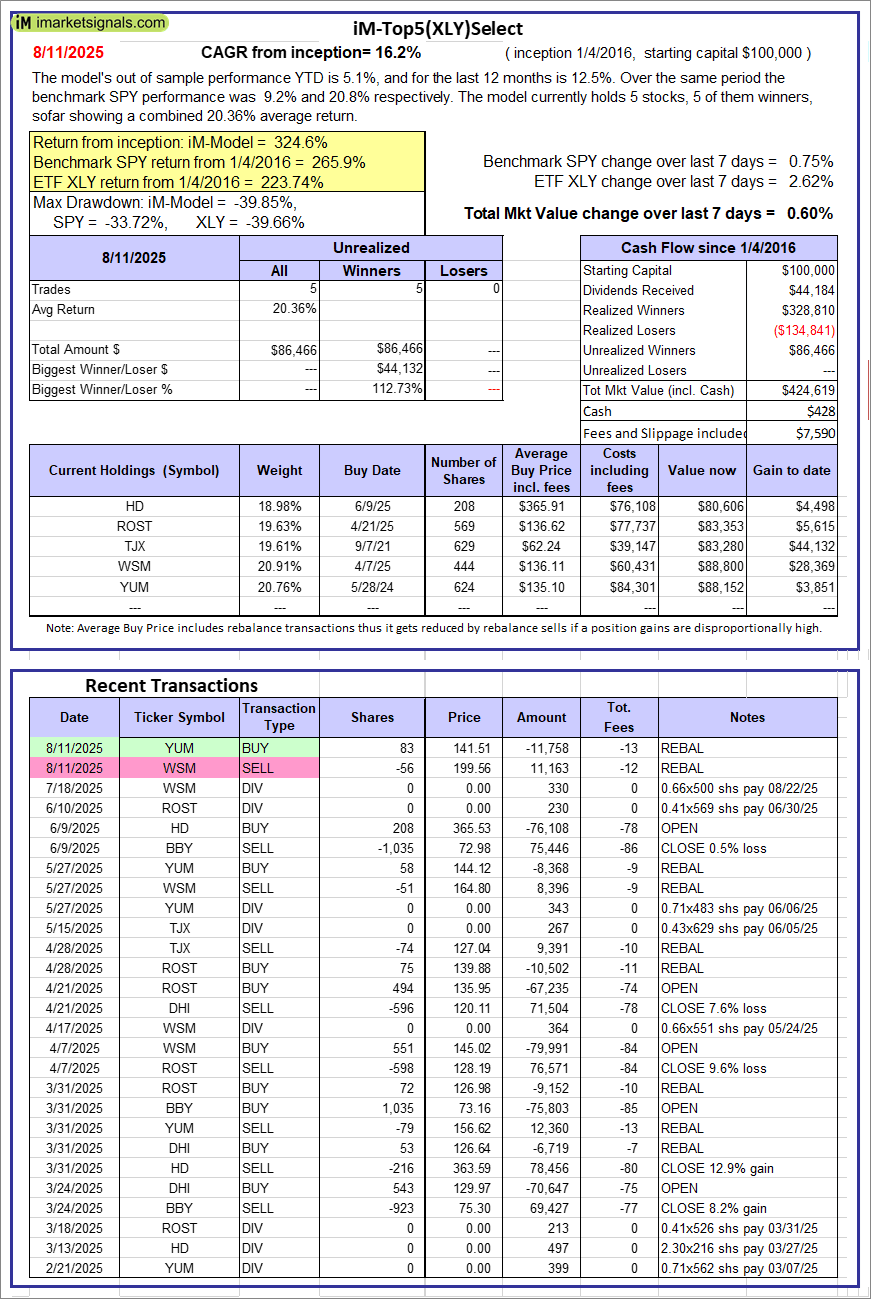 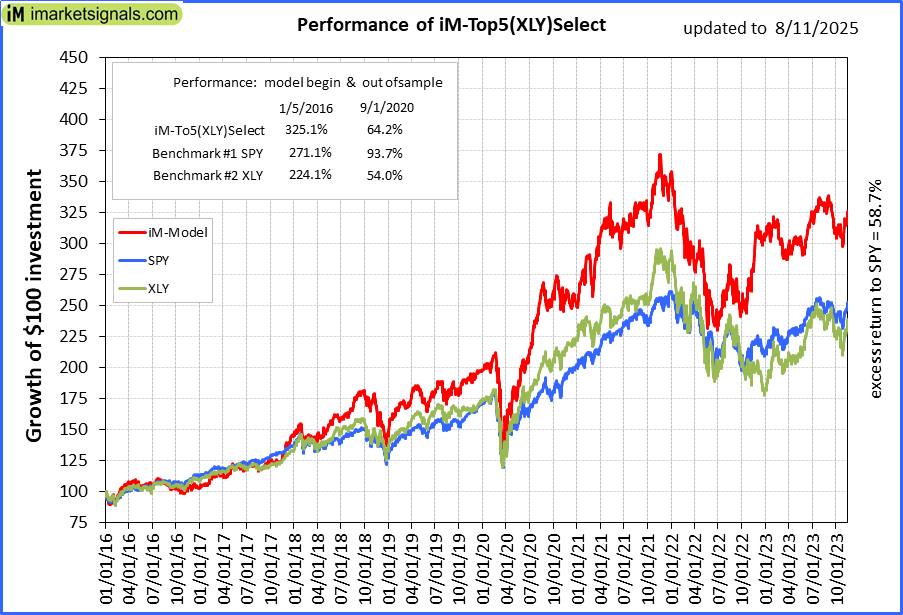 |
iM-Top5(XLY)Select: Since inception, on 1/5/2016, the model gained 324.62% while the benchmark SPY gained 265.94% over the same period. Over the previous week the market value of iM-Top5(XLY)Select gained 0.60% at a time when SPY gained 0.75%. A starting capital of $100,000 at inception on 1/5/2016 would have grown to $424,619 which includes $428 cash and excludes $7,590 spent on fees and slippage. |
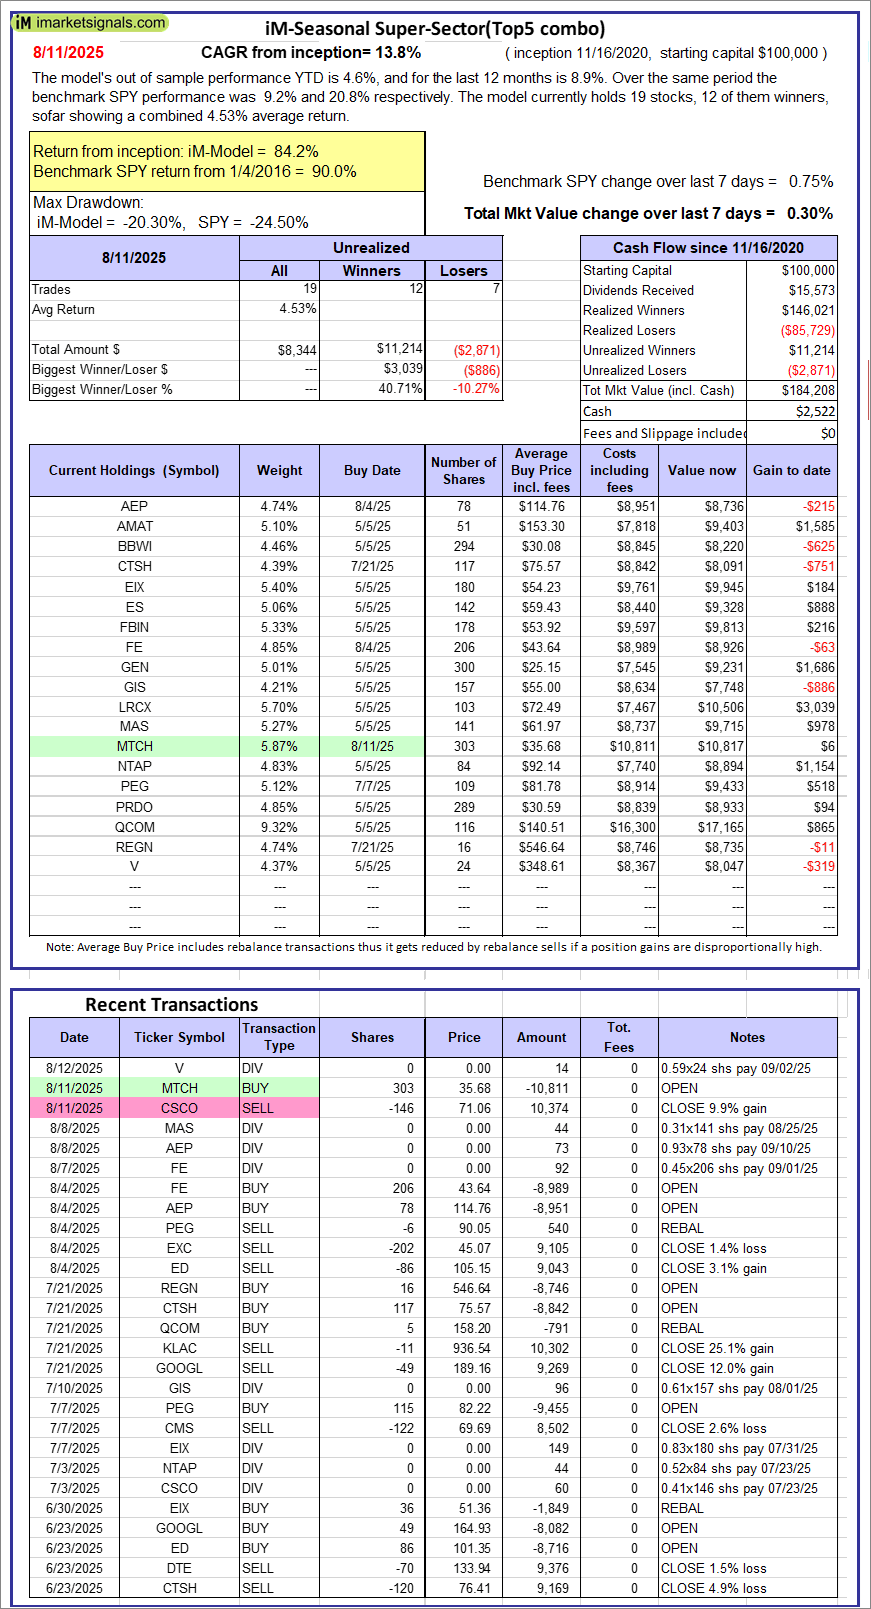 |
iM-Seasonal Super-Sectors (Top5 combo) : Since inception, on 11/17/2020, the model gained 84.21% while the benchmark SPY gained 89.96% over the same period. Over the previous week the market value of iM-Seasonal Super-Sectors (Top5 combo) gained 0.30% at a time when SPY gained 0.75%. A starting capital of $100,000 at inception on 11/17/2020 would have grown to $184,208 which includes $2,522 cash and excludes $00 spent on fees and slippage. |
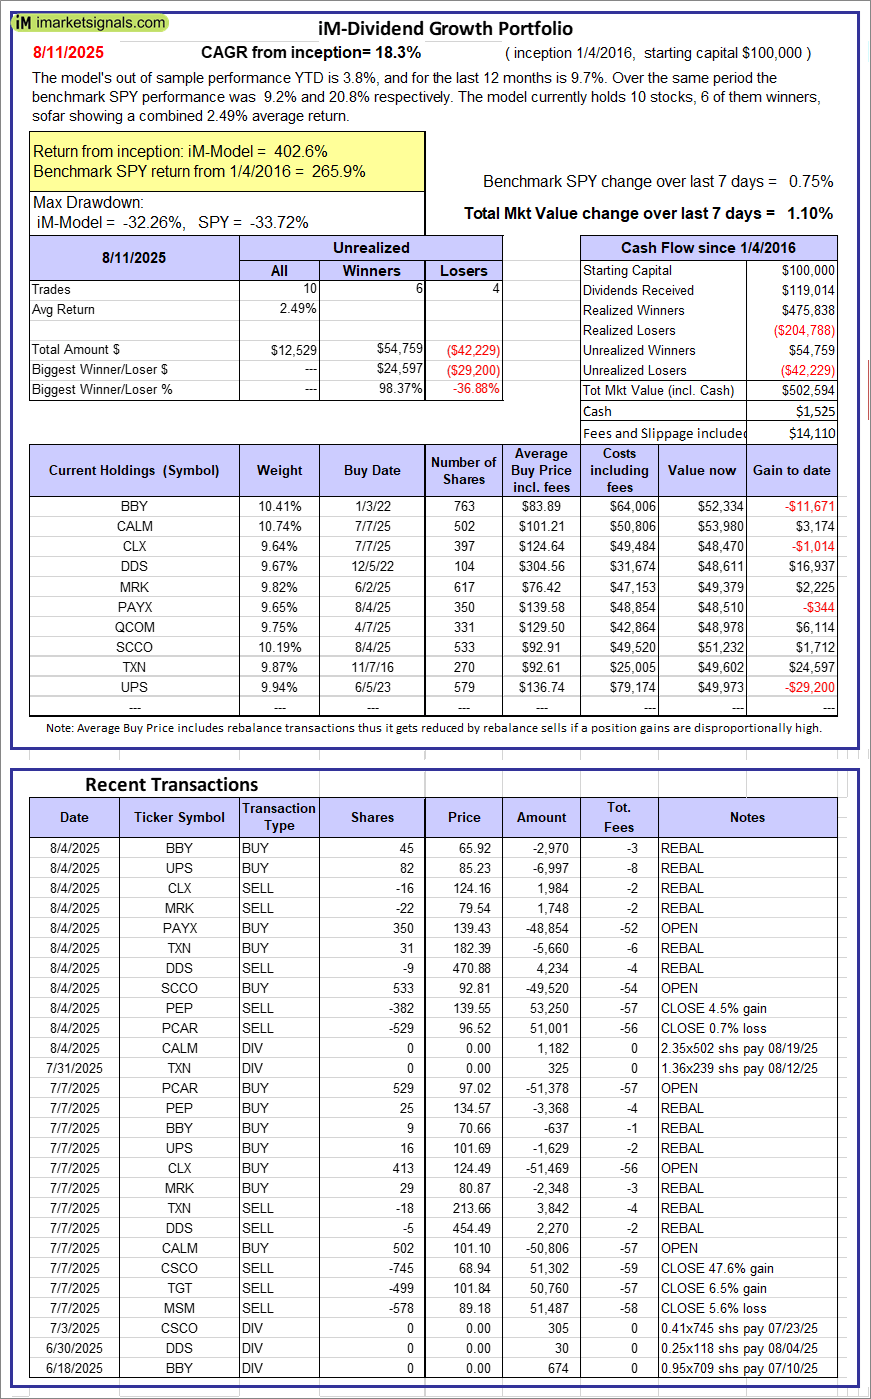 |
iM-Dividend Growth Portfolio: The model’s out of sample performance YTD is 3.8%, and for the last 12 months is 9.7%. Over the same period the benchmark SPY performance was 9.2% and 20.8% respectively. Over the previous week the market value of the iM-Dividend Growth Portfolio gained 1.10% at a time when SPY gained 0.75%. A starting capital of $100,000 at inception on 6/30/2016 would have grown to $502,594 which includes $1,525 cash and excludes $14,110 spent on fees and slippage. |
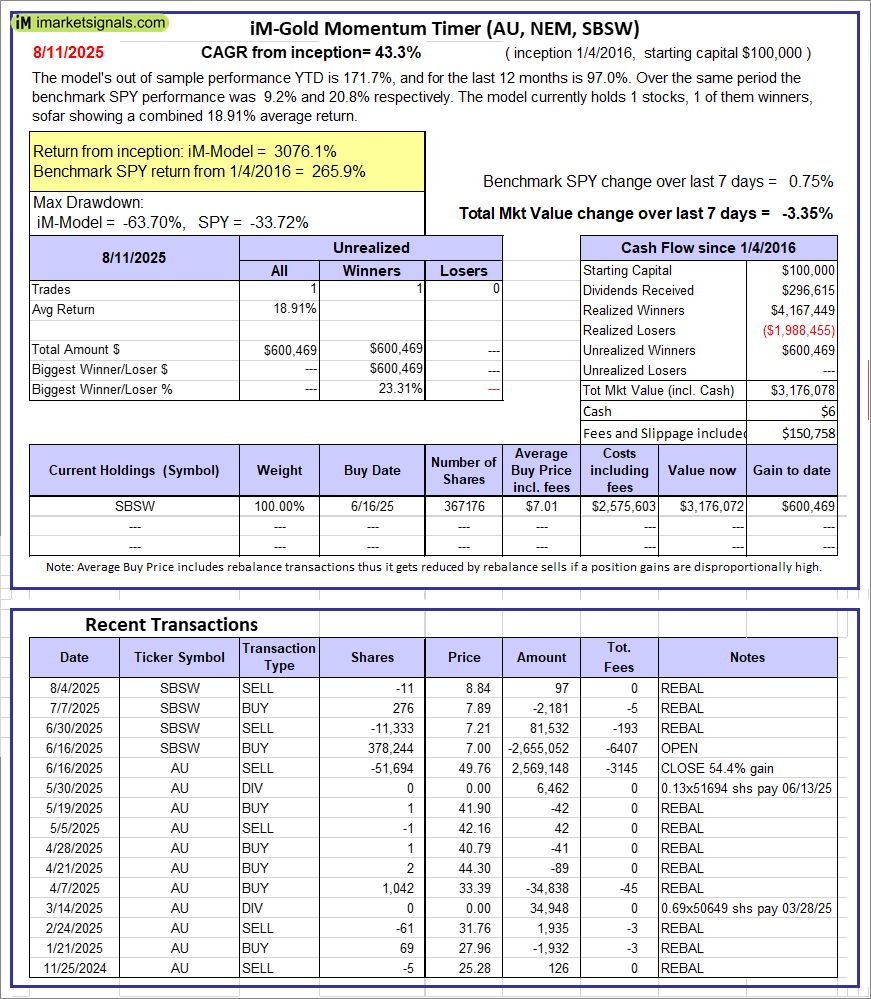 |
iM-Gold Momentum Timer (AU, NEM, SBSW): The model’s out of sample performance YTD is 171.7%, and for the last 12 months is 97.0%. Over the same period the benchmark SPY performance was 9.2% and 20.8% respectively. Over the previous week the market value of iM-Gold Momentum Timer (AU, NEM, SBSW) gained -3.35% at a time when SPY gained 0.75%. A starting capital of $100,000 at inception on 6/30/2016 would have grown to $06 which includes $150,758 cash and excludes Gain to date spent on fees and slippage. |
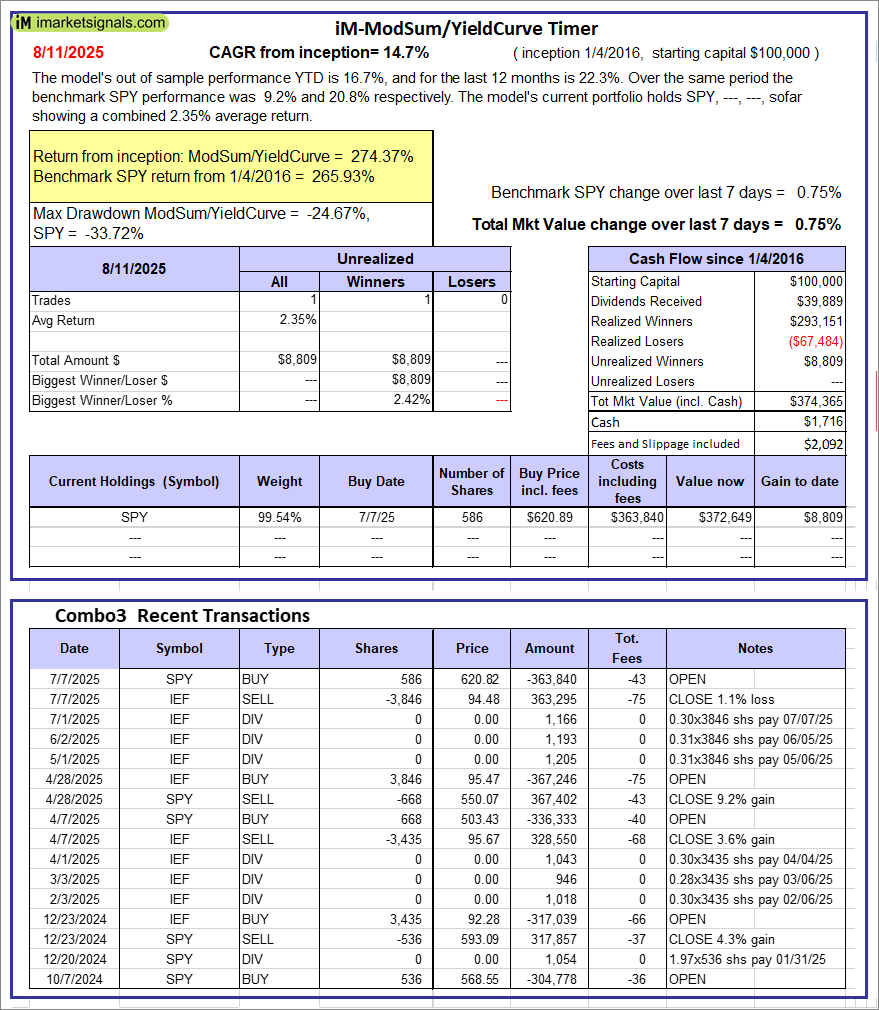 |
iM-ModSum/YieldCurve Timer: The model’s out of sample performance YTD is 16.7%, and for the last 12 months is 22.3%. Over the same period the benchmark SPY performance was 9.2% and 20.8% respectively. Over the previous week the market value of iM-PortSum/YieldCurve Timer gained 0.75% at a time when SPY gained 0.75%. A starting capital of $100,000 at inception on 1/1/2016 would have grown to $374,365 which includes $1,716 cash and excludes $2,092 spent on fees and slippage. |
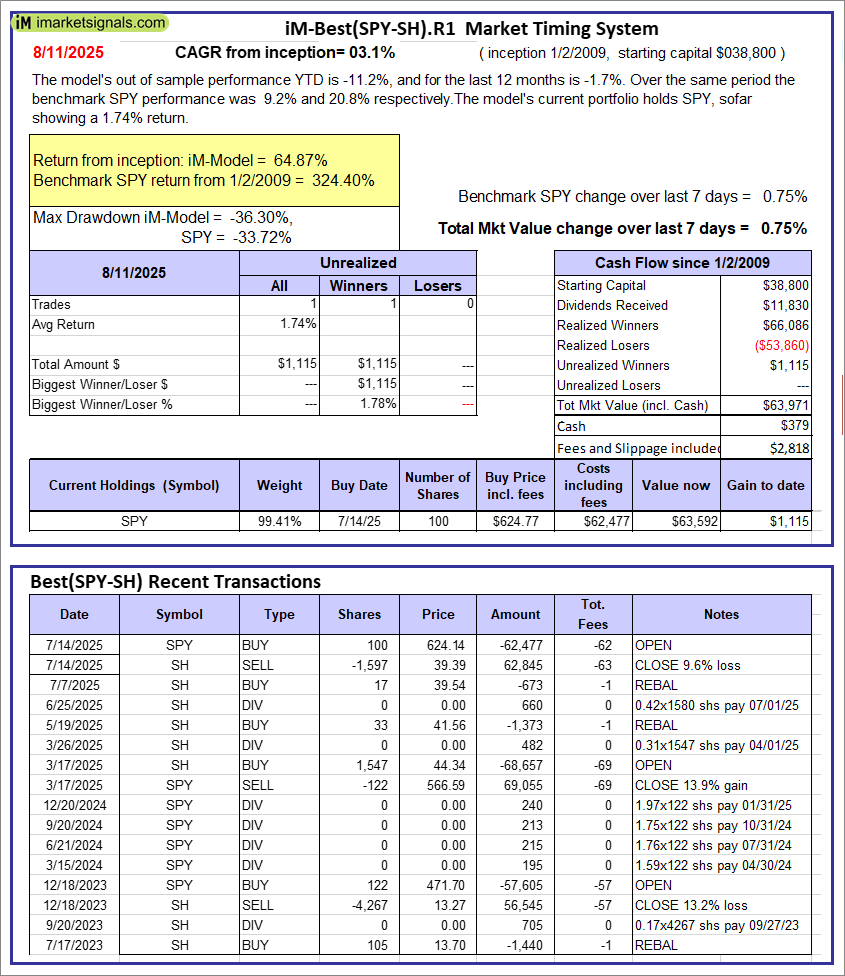 |
iM-Best(SPY-SH).R1: The model’s out of sample performance YTD is -11.2%, and for the last 12 months is -1.7%. Over the same period the benchmark SPY performance was 9.2% and 20.8% respectively. Over the previous week the market value of Best(SPY-SH) gained 0.75% at a time when SPY gained 0.75%. A starting capital of $100,000 at inception on 1/2/2009 would have grown to $63,971 which includes $379 cash and excludes $2,818 spent on fees and slippage. |
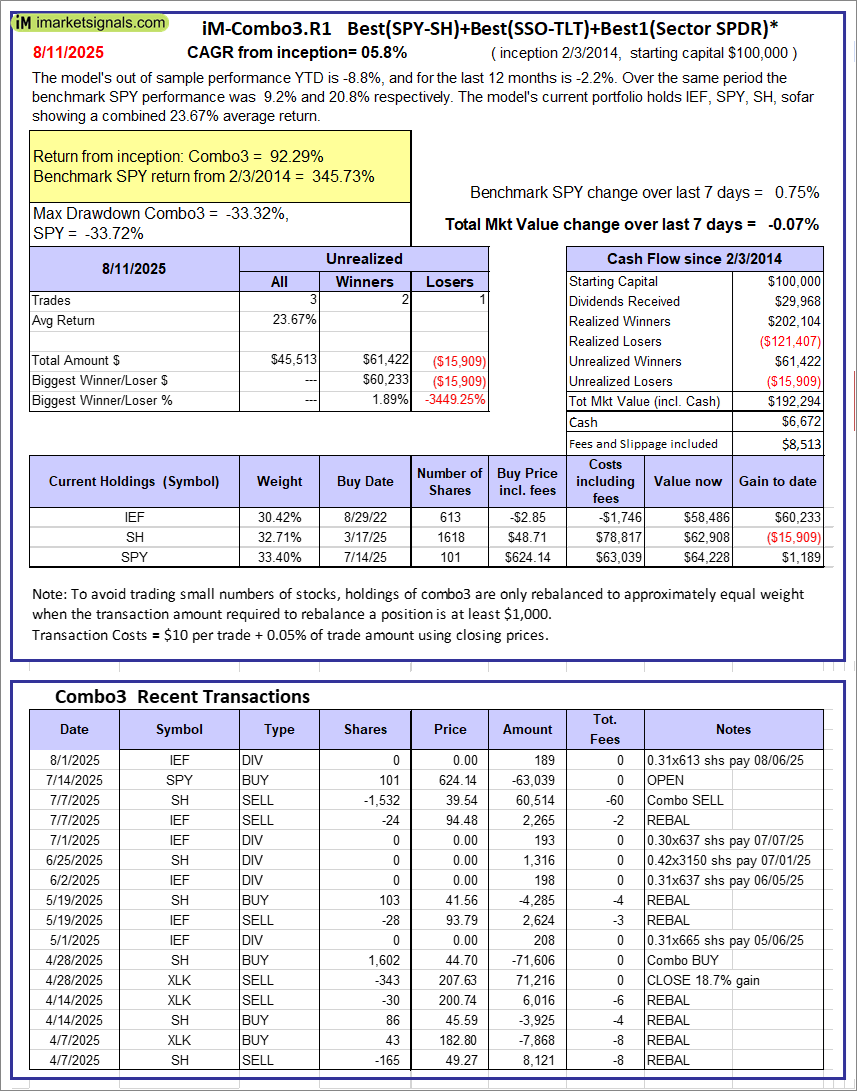 |
iM-Combo3.R1: The model’s out of sample performance YTD is -8.8%, and for the last 12 months is -2.2%. Over the same period the benchmark SPY performance was 9.2% and 20.8% respectively. Over the previous week the market value of iM-Combo3.R1 gained -0.07% at a time when SPY gained 0.75%. A starting capital of $100,000 at inception on 2/3/2014 would have grown to $192,294 which includes $6,672 cash and excludes $8,513 spent on fees and slippage. |
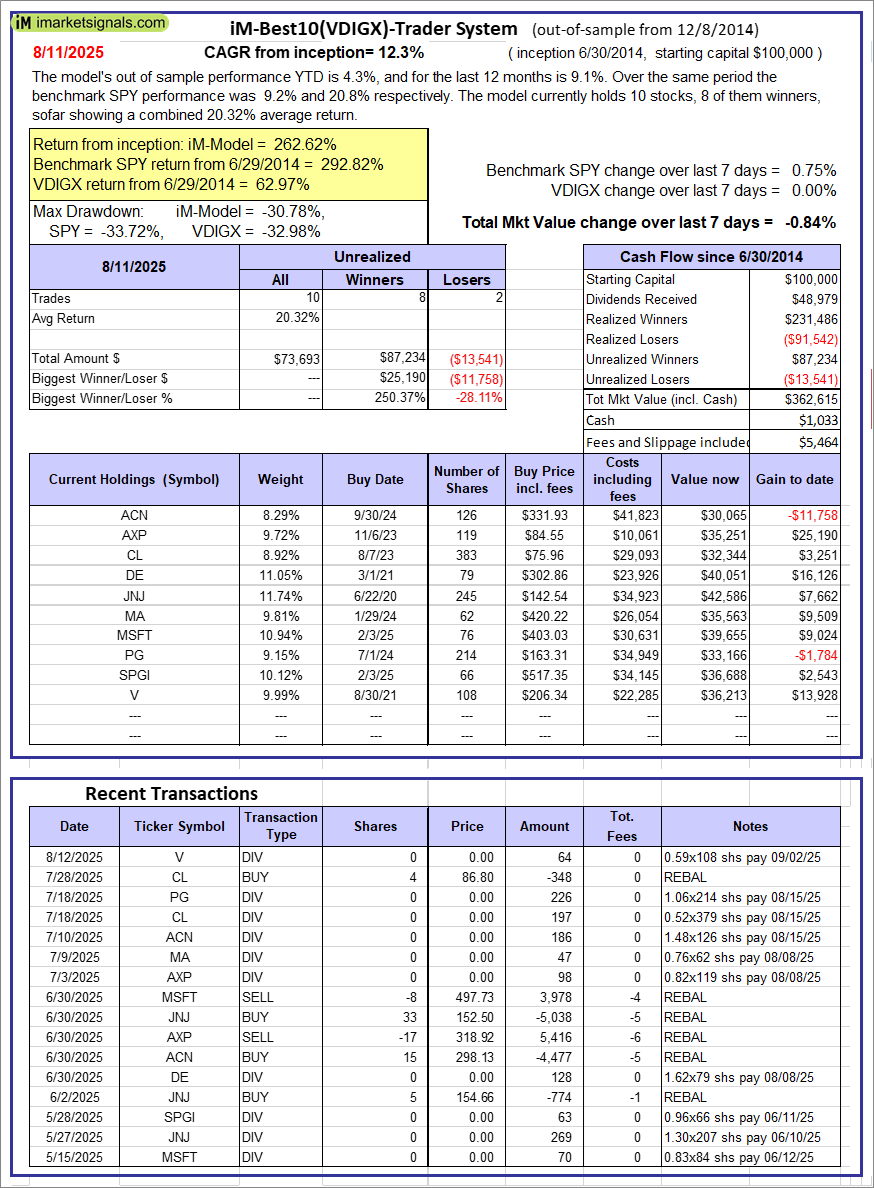 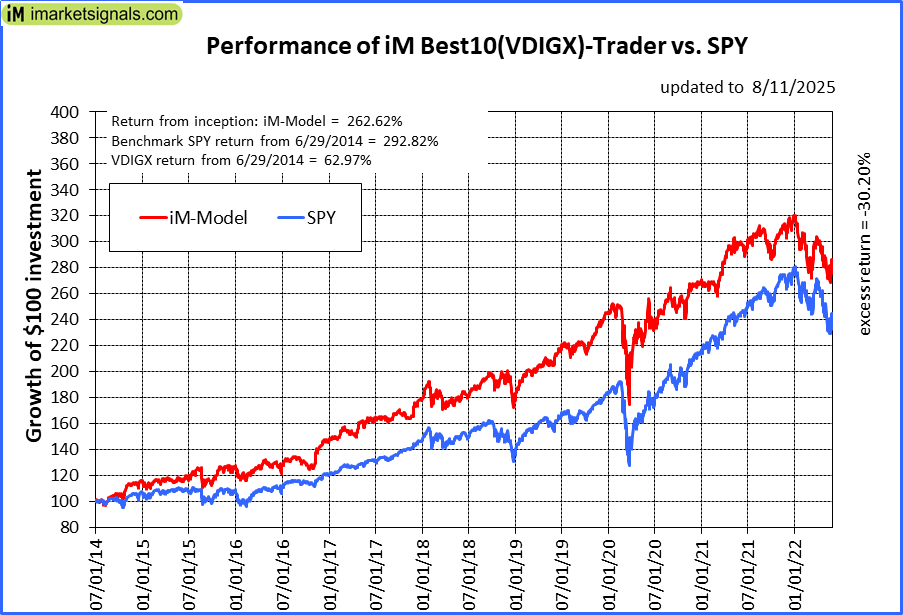 |
iM-Best10(VDIGX)-Trader: The model’s out of sample performance YTD is 4.3%, and for the last 12 months is 9.1%. Over the same period the benchmark SPY performance was 9.2% and 20.8% respectively. Since inception, on 7/1/2014, the model gained 262.62% while the benchmark SPY gained 292.82% and VDIGX gained 62.97% over the same period. Over the previous week the market value of iM-Best10(VDIGX) gained -0.84% at a time when SPY gained 0.75%. A starting capital of $100,000 at inception on 7/1/2014 would have grown to $362,615 which includes $1,033 cash and excludes $5,464 spent on fees and slippage. |
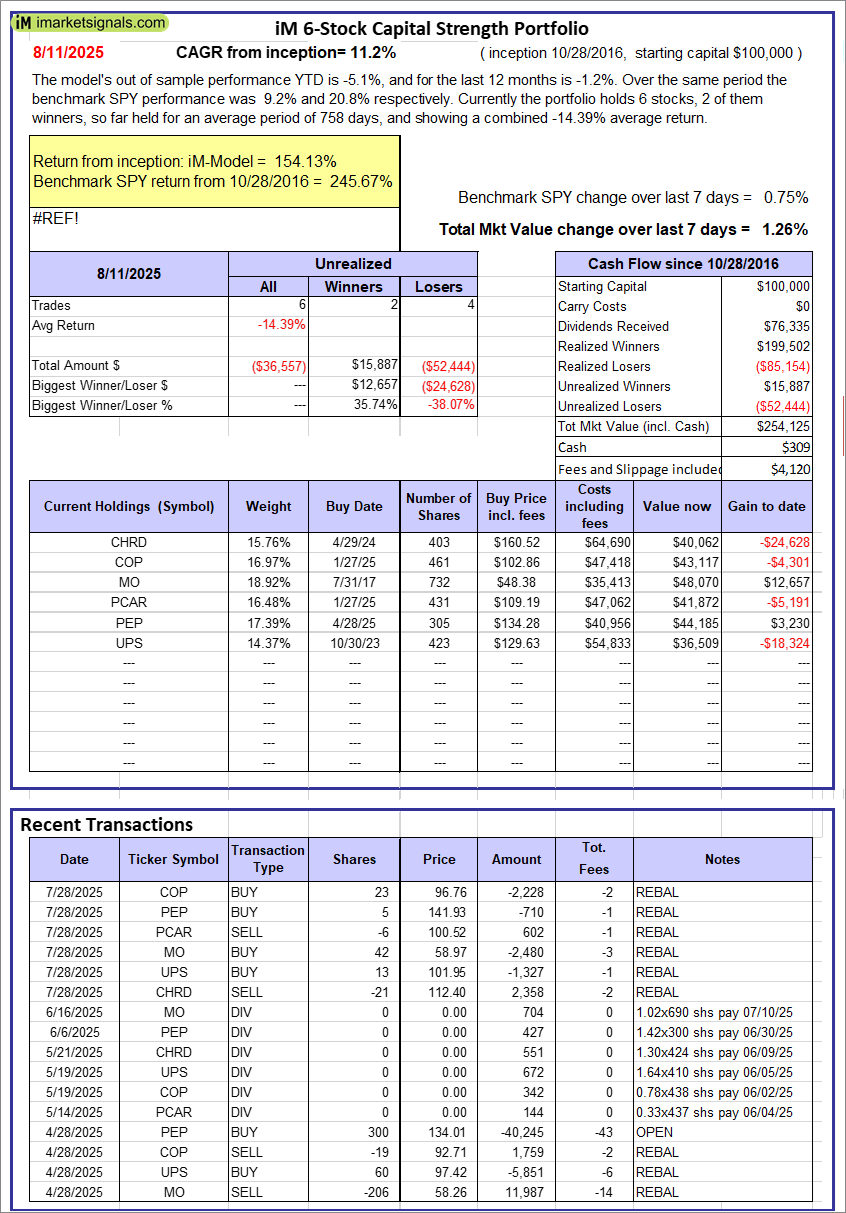 |
iM 6-Stock Capital Strength Portfolio: The model’s out of sample performance YTD is -5.1%, and for the last 12 months is -1.2%. Over the same period the benchmark SPY performance was 9.2% and 20.8% respectively. Over the previous week the market value of the iM 6-Stock Capital Strength Portfolio gained 1.26% at a time when SPY gained 0.75%. A starting capital of $100,000 at inception on 10/28/2016 would have grown to $254,125 which includes $309 cash and excludes $4,120 spent on fees and slippage. |
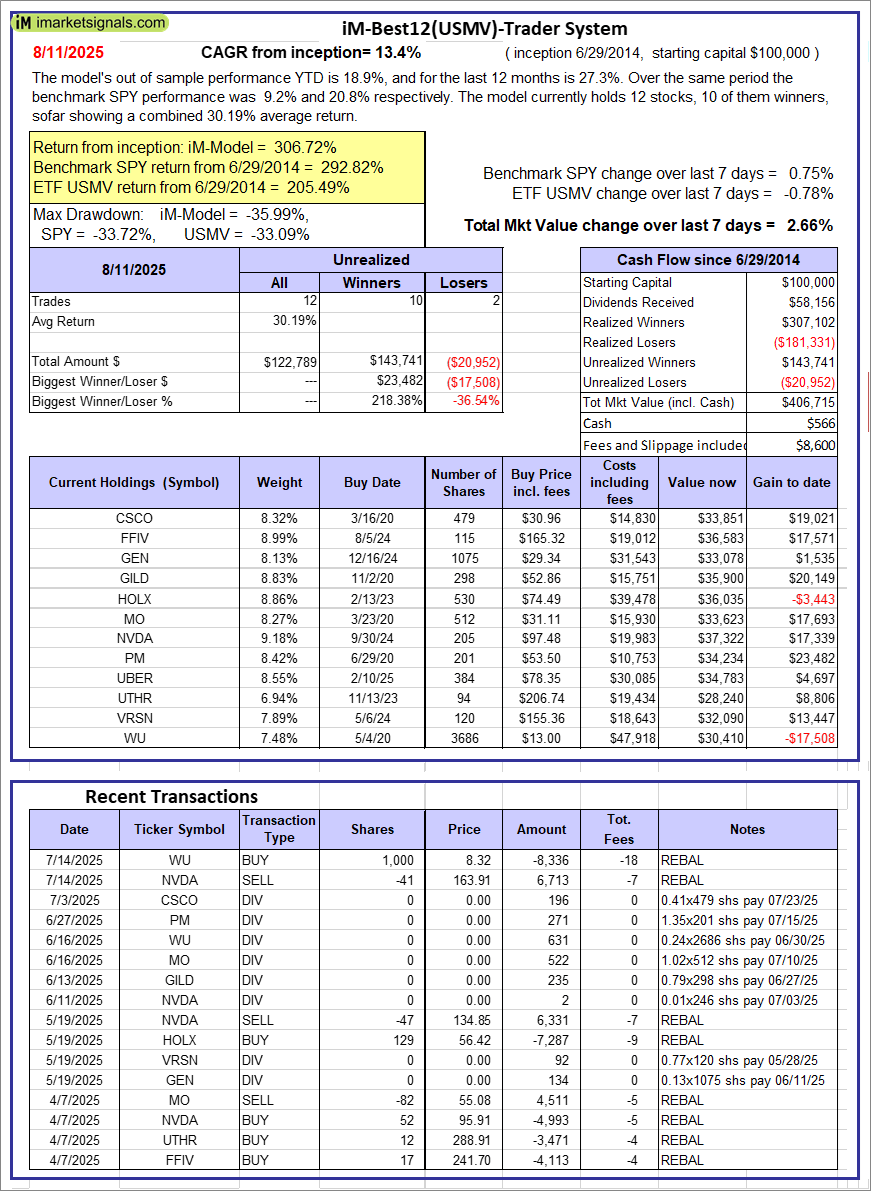 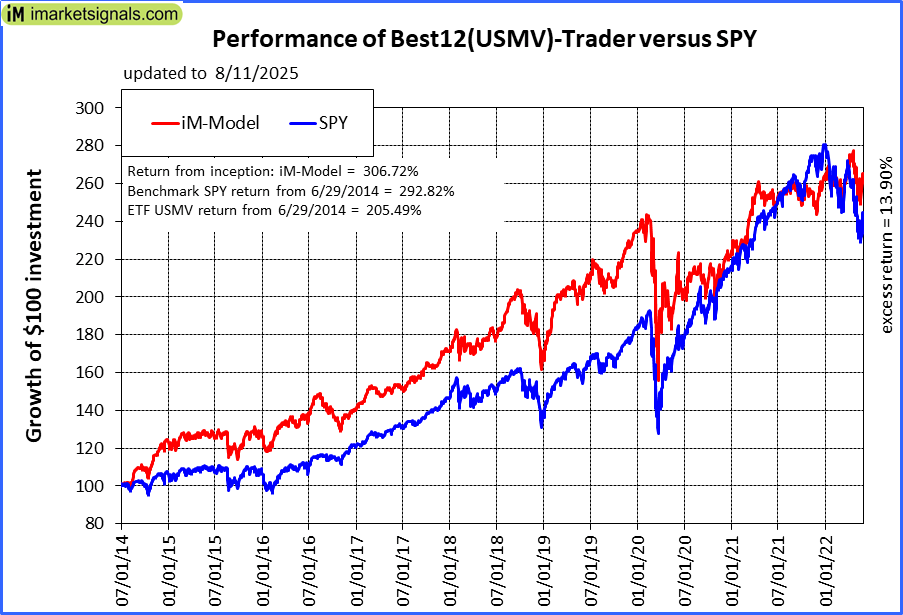 |
iM-Best12(USMV)-Trader: The model’s out of sample performance YTD is 18.9%, and for the last 12 months is 27.3%. Over the same period the benchmark SPY performance was 9.2% and 20.8% respectively. Since inception, on 6/30/2014, the model gained 306.72% while the benchmark SPY gained 292.82% and the ETF USMV gained 205.49% over the same period. Over the previous week the market value of iM-Best12(USMV)-Trader gained 2.66% at a time when SPY gained 0.75%. A starting capital of $100,000 at inception on 6/30/2014 would have grown to $406,715 which includes $566 cash and excludes $8,600 spent on fees and slippage. |
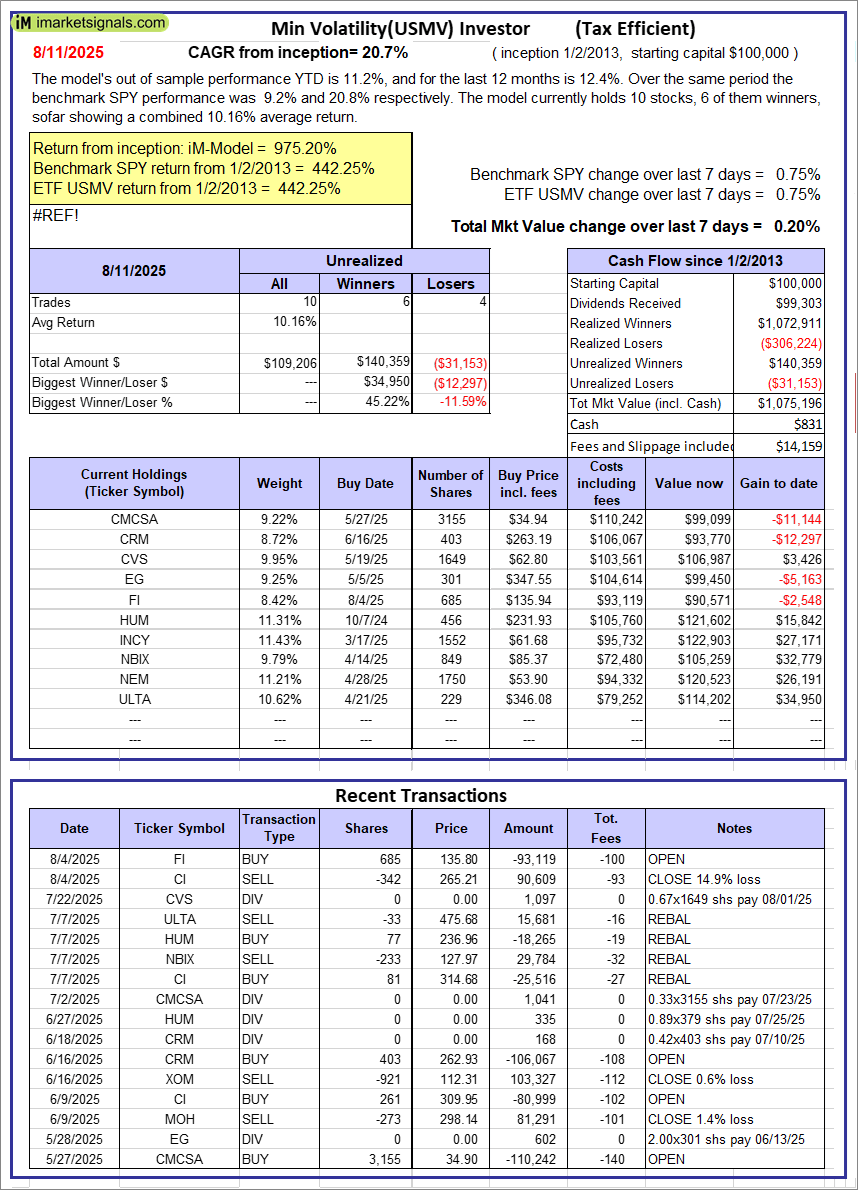 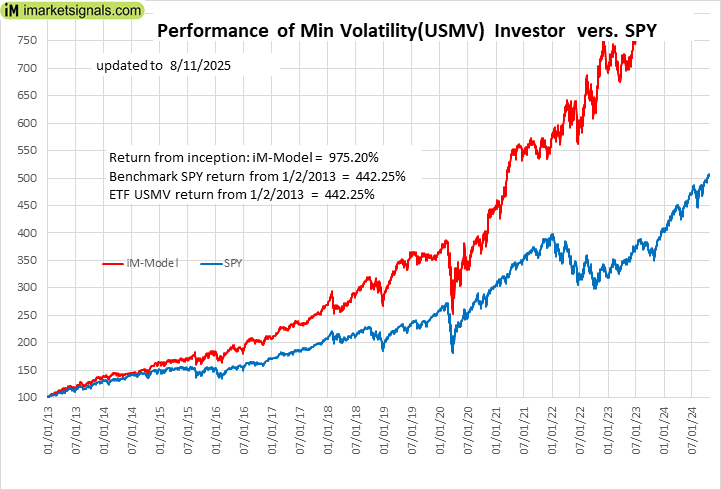 |
iM-Min Volatility(USMV) Investor (Tax Efficient): The model’s out of sample performance YTD is 11.2%, and for the last 12 months is 12.4%. Over the same period the benchmark SPY performance was 9.2% and 20.8% respectively. Since inception, on 1/3/2013, the model gained 975.20% while the benchmark SPY gained 442.25% and the ETF USMV gained 442.25% over the same period. Over the previous week the market value of iM-Best12(USMV)Q1 gained 0.20% at a time when SPY gained 0.75%. A starting capital of $100,000 at inception on 1/3/2013 would have grown to $1,075,196 which includes $831 cash and excludes $14,159 spent on fees and slippage. |
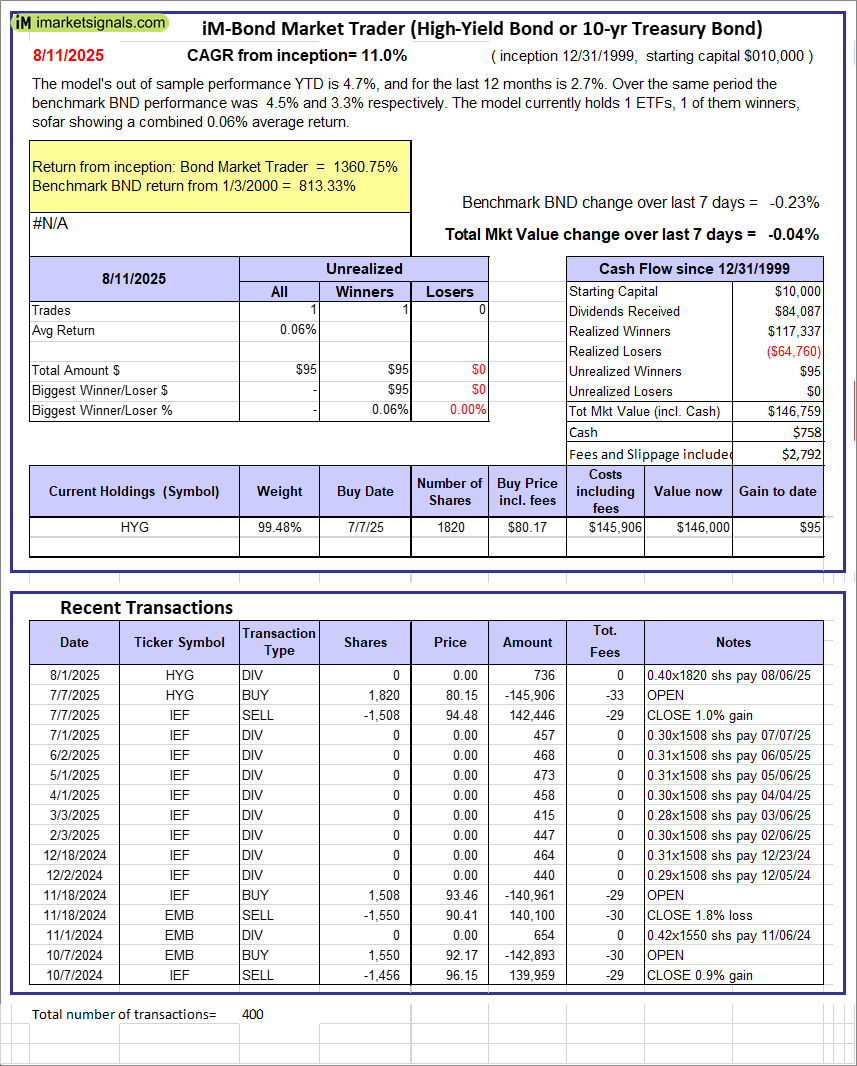 |
iM-Bond Market Trader (High-Yield Bond or 10-yr Treasury Bond): The model’s out of sample performance YTD is 4.7%, and for the last 12 months is 2.7%. Over the same period the benchmark BND performance was 4.5% and 3.3% respectively. Over the previous week the market value of the iM-Bond Market Trader (High-Yield Bond or 10-yr Treasury Bond) gained -0.04% at a time when BND gained -0.23%. A starting capital of $10,000 at inception on 1/3/2000 would have grown to $146,759 which includes $758 cash and excludes $2,792 spent on fees and slippage. |
|
|
iM-ModSum/YieldCurve Timer: The model’s out of sample performance YTD is 16.7%, and for the last 12 months is 22.3%. Over the same period the benchmark SPY performance was 9.2% and 20.8% respectively. Over the previous week the market value of iM-PortSum/YieldCurve Timer gained 0.75% at a time when SPY gained 0.75%. A starting capital of $100,000 at inception on 1/1/2016 would have grown to $374,365 which includes $1,716 cash and excludes $2,092 spent on fees and slippage. |
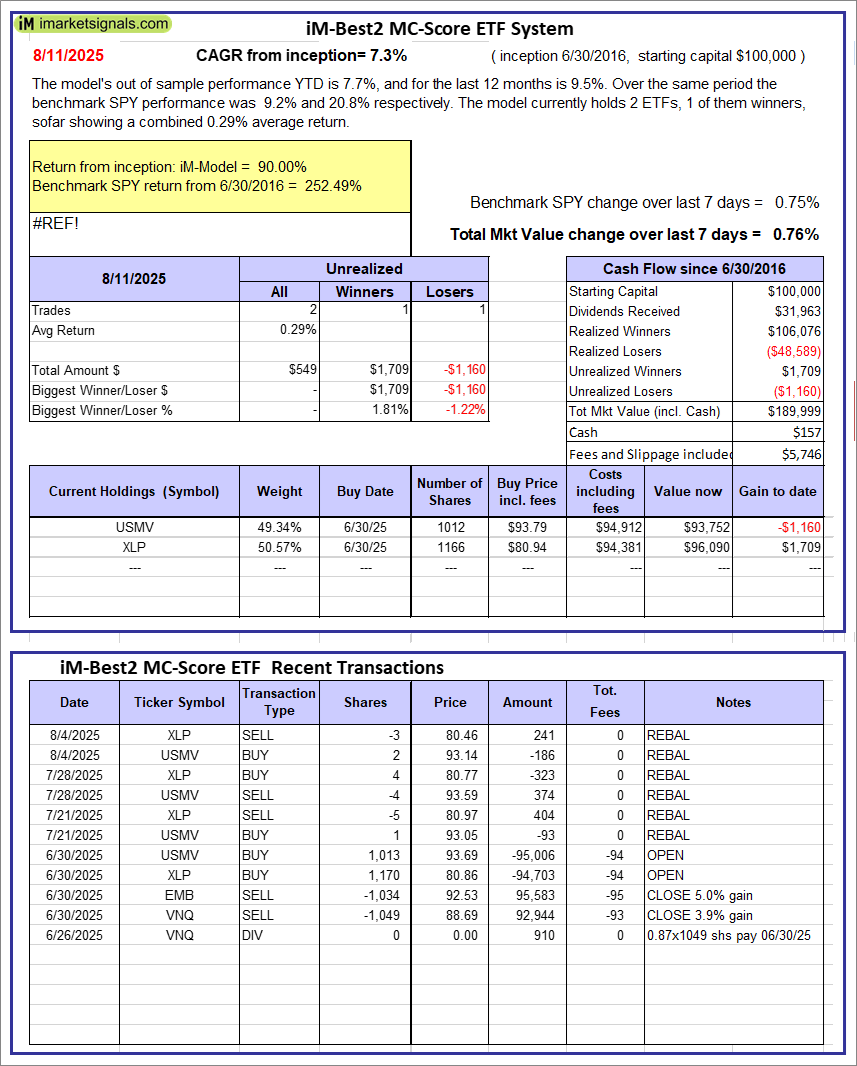 |
iM-Best2 MC-Score ETF System: The model’s out of sample performance YTD is 7.7%, and for the last 12 months is 9.5%. Over the same period the benchmark SPY performance was 9.2% and 20.8% respectively. Over the previous week the market value of the iM-Best2 MC-Score ETF System gained 0.76% at a time when SPY gained 0.75%. A starting capital of $100,000 at inception on 6/30/2016 would have grown to $189,999 which includes $157 cash and excludes $5,746 spent on fees and slippage. |
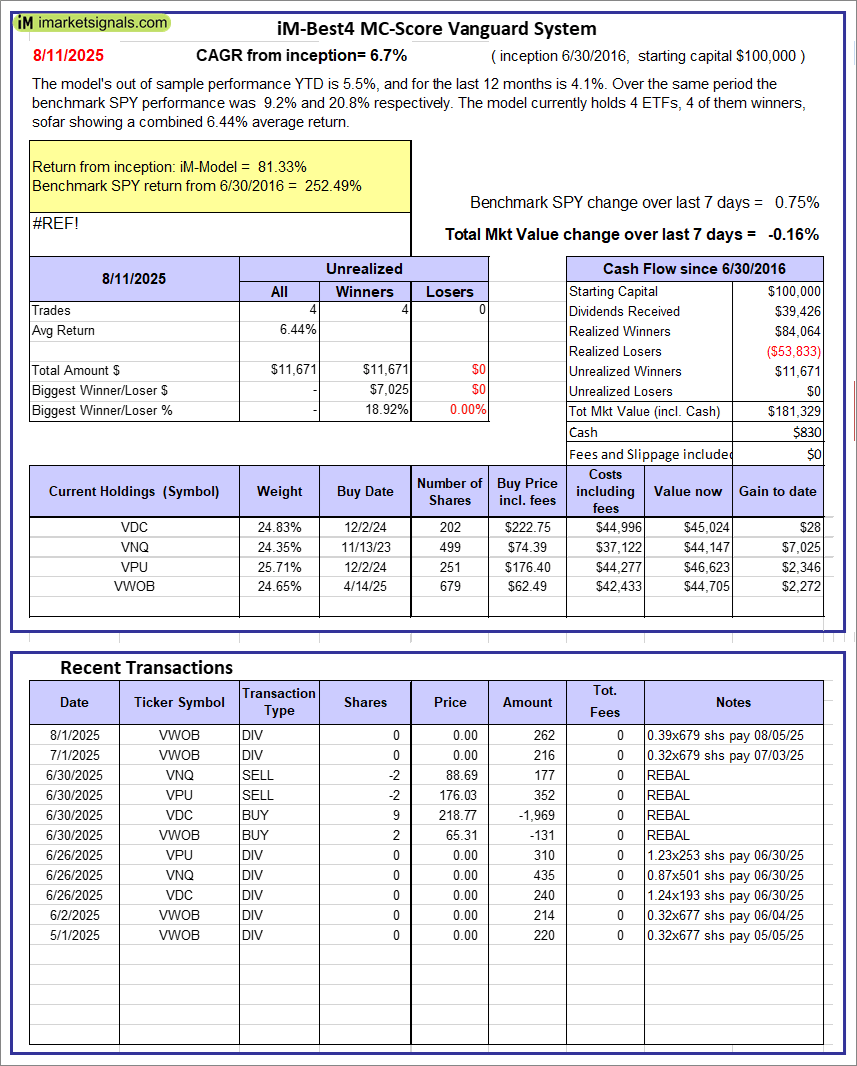 |
iM-Best4 MC-Score Vanguard System: The model’s out of sample performance YTD is 5.5%, and for the last 12 months is 4.1%. Over the same period the benchmark SPY performance was 9.2% and 20.8% respectively. Over the previous week the market value of the iM-Best4 MC-Score Vanguard System gained -0.16% at a time when SPY gained 0.75%. A starting capital of $100,000 at inception on 6/30/2016 would have grown to $181,329 which includes $830 cash and excludes $00 spent on fees and slippage. |
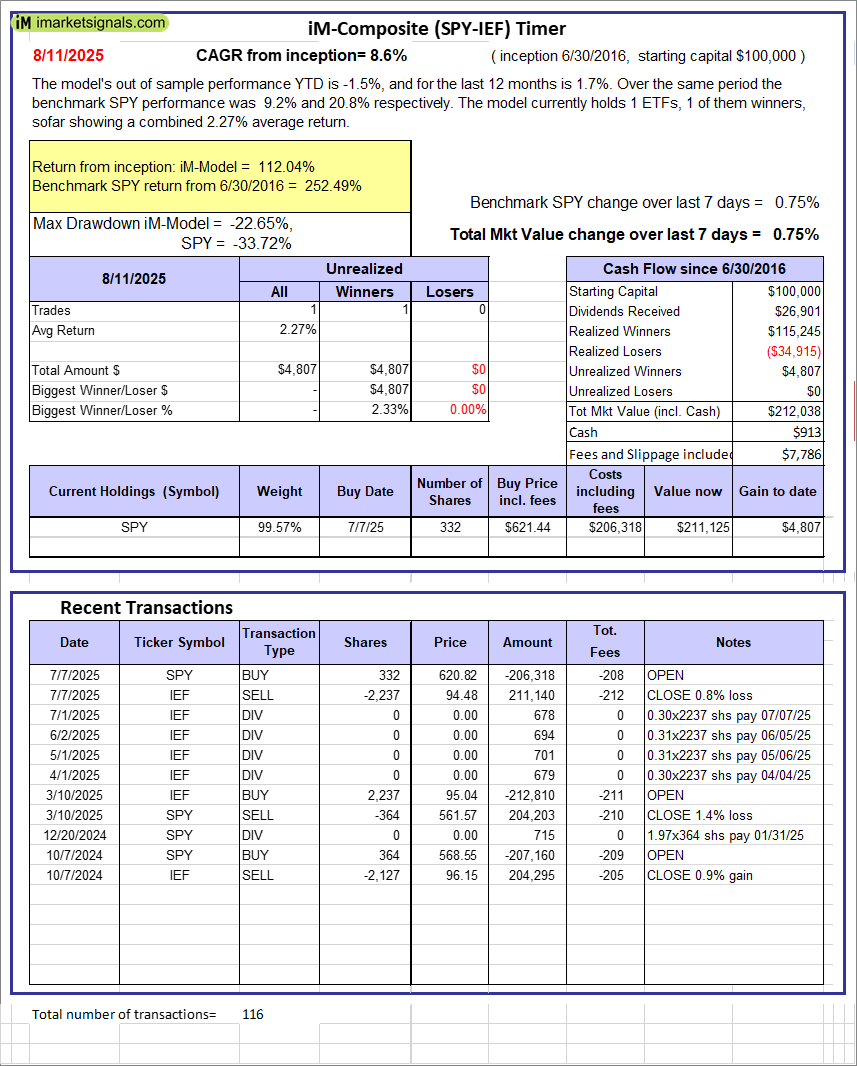 |
iM-Composite (SPY-IEF) Timer: The model’s out of sample performance YTD is -1.5%, and for the last 12 months is 1.7%. Over the same period the benchmark SPY performance was 9.2% and 20.8% respectively. Over the previous week the market value of the iM-Composite (SPY-IEF) Timer gained 0.75% at a time when SPY gained 0.75%. A starting capital of $100,000 at inception on 6/30/2016 would have grown to $212,038 which includes $913 cash and excludes $7,786 spent on fees and slippage. |
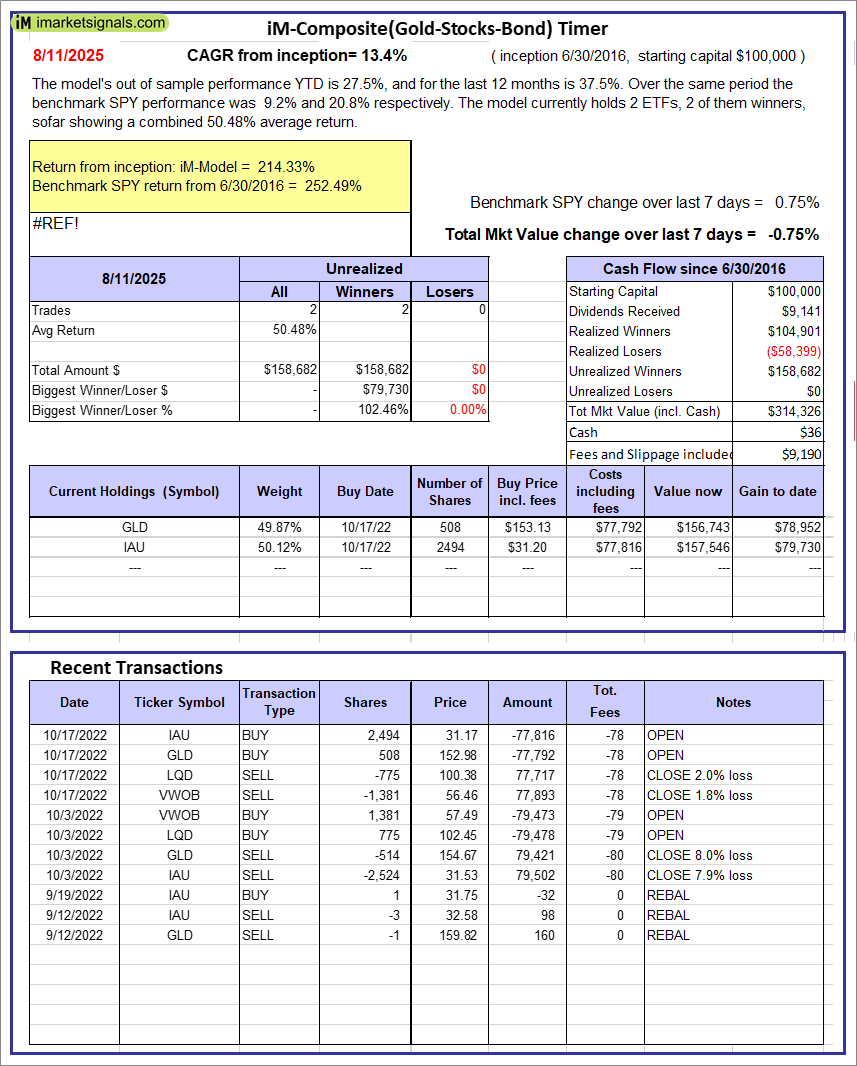 |
iM-Composite(Gold-Stocks-Bond) Timer: The model’s out of sample performance YTD is 27.5%, and for the last 12 months is 37.5%. Over the same period the benchmark SPY performance was 9.2% and 20.8% respectively. Over the previous week the market value of the iM-Composite(Gold-Stocks-Bond) Timer gained -0.75% at a time when SPY gained 0.75%. A starting capital of $100,000 at inception on 6/30/2016 would have grown to $314,326 which includes $36 cash and excludes $9,190 spent on fees and slippage. |
iM-Best Reports – 8/11/2025
Posted in pmp SPY-SH
Leave a Reply
You must be logged in to post a comment.