
  |
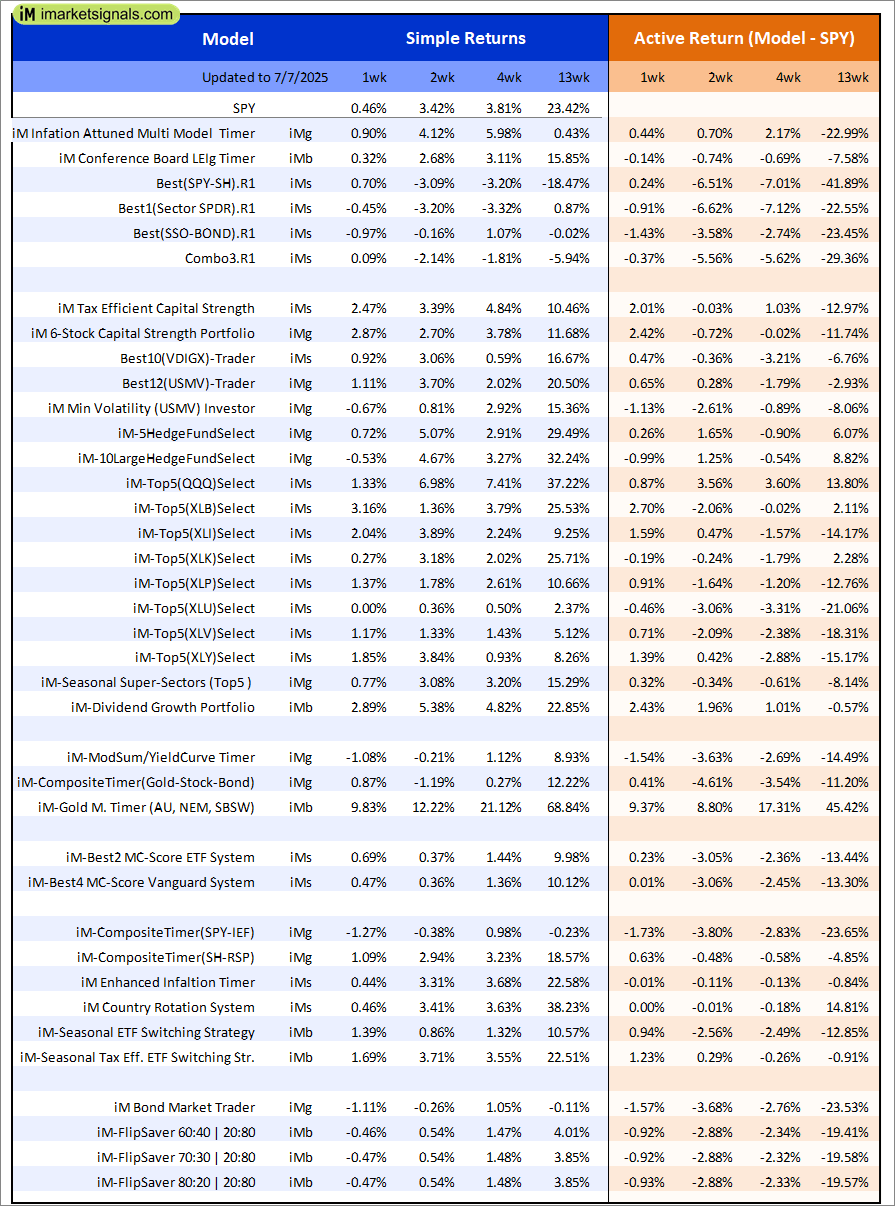
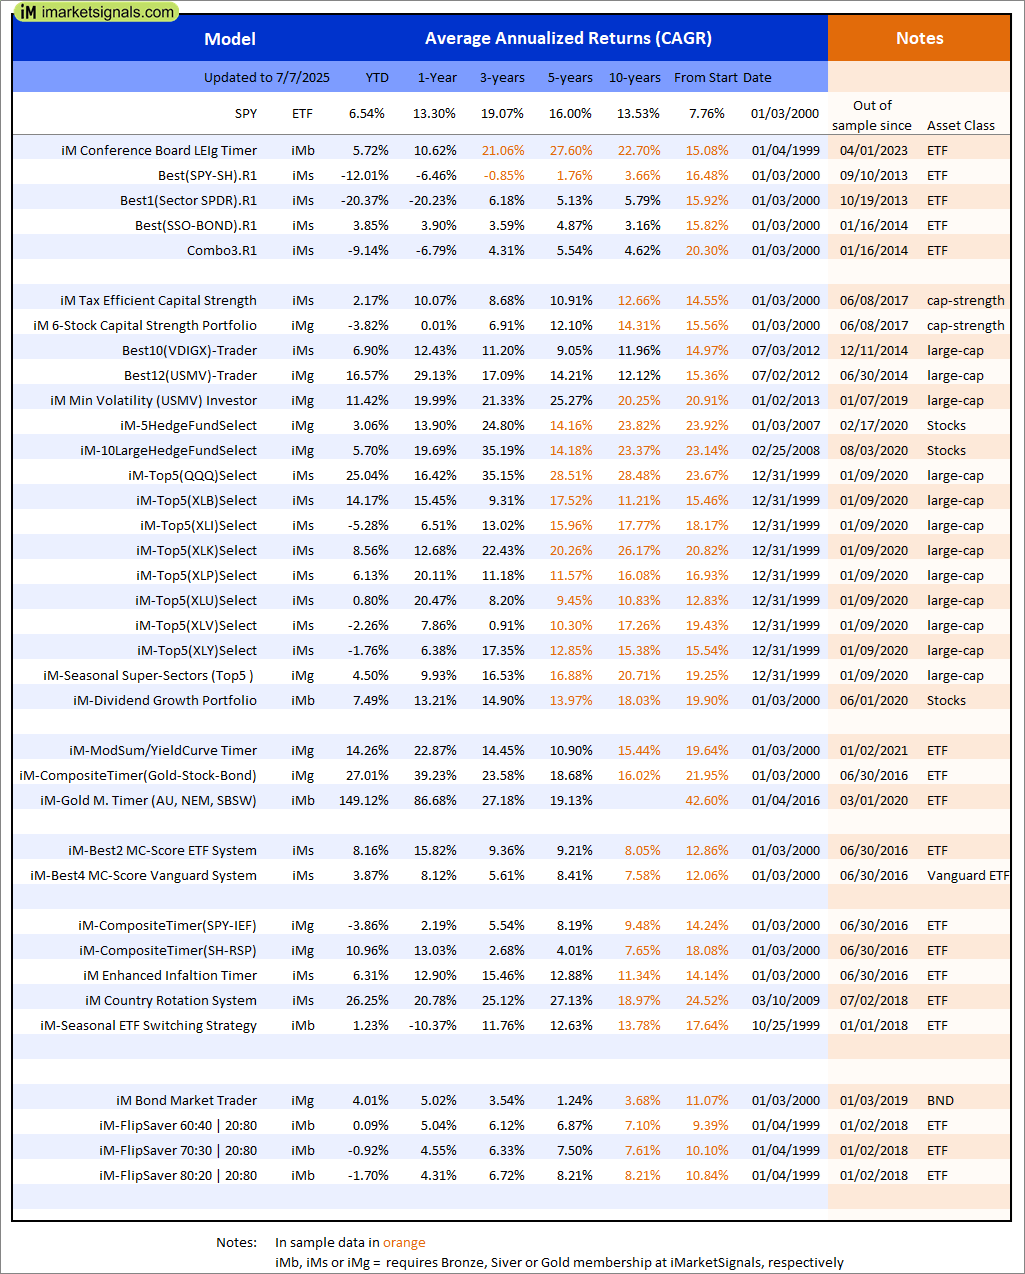
Out of sample performance summary of our models for the past 1, 2, 4 and 13 week periods. The active active return indicates how the models over- or underperformed the benchmark ETF SPY. Also the YTD, and the 1-, 3-, 5- and 10-year annualized returns are shown in the second table |
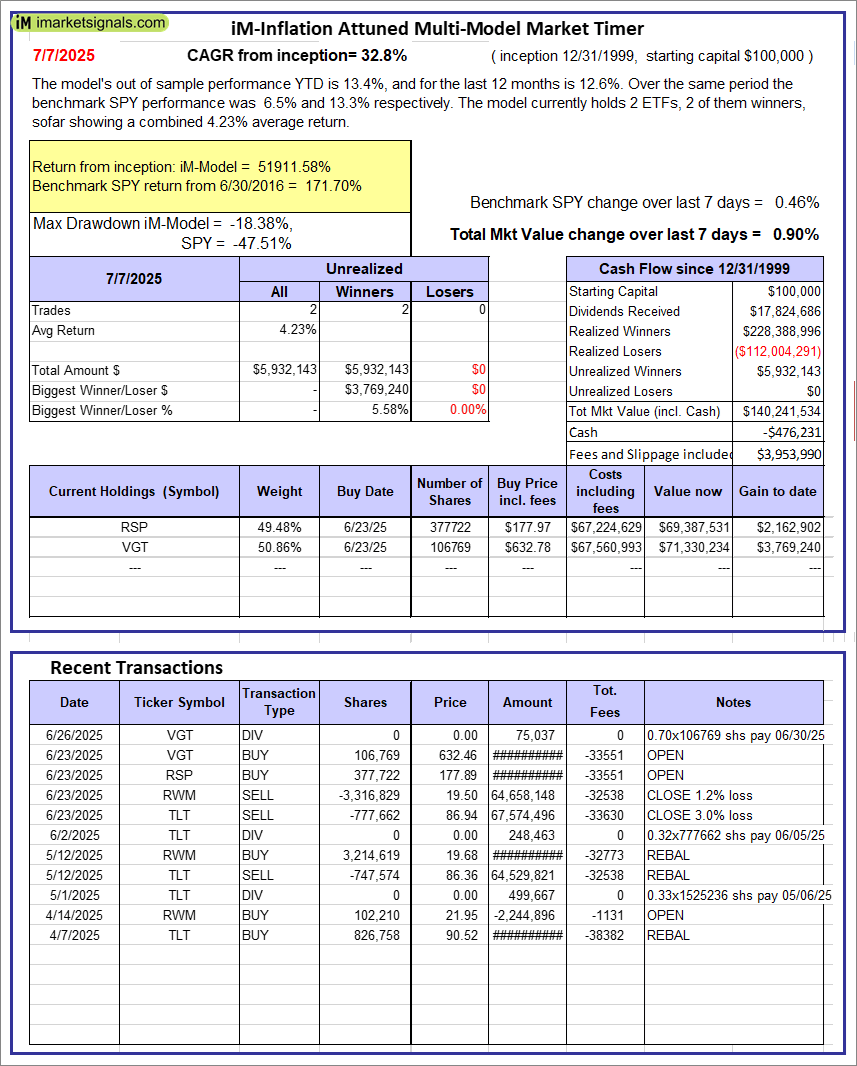 |
iM-Inflation Attuned Multi-Model Market Timer: The model’s out of sample performance YTD is 13.4%, and for the last 12 months is 12.6%. Over the same period the benchmark SPY performance was 6.5% and 13.3% respectively. Over the previous week the market value of the iM-Inflation Attuned Multi-Model Market Timer gained 0.90% at a time when SPY gained 0.46%. A starting capital of $100,000 at inception on 3/24/2017 would have grown to $140,241,534 which includes -$476,231 cash and excludes $3,953,990 spent on fees and slippage. |
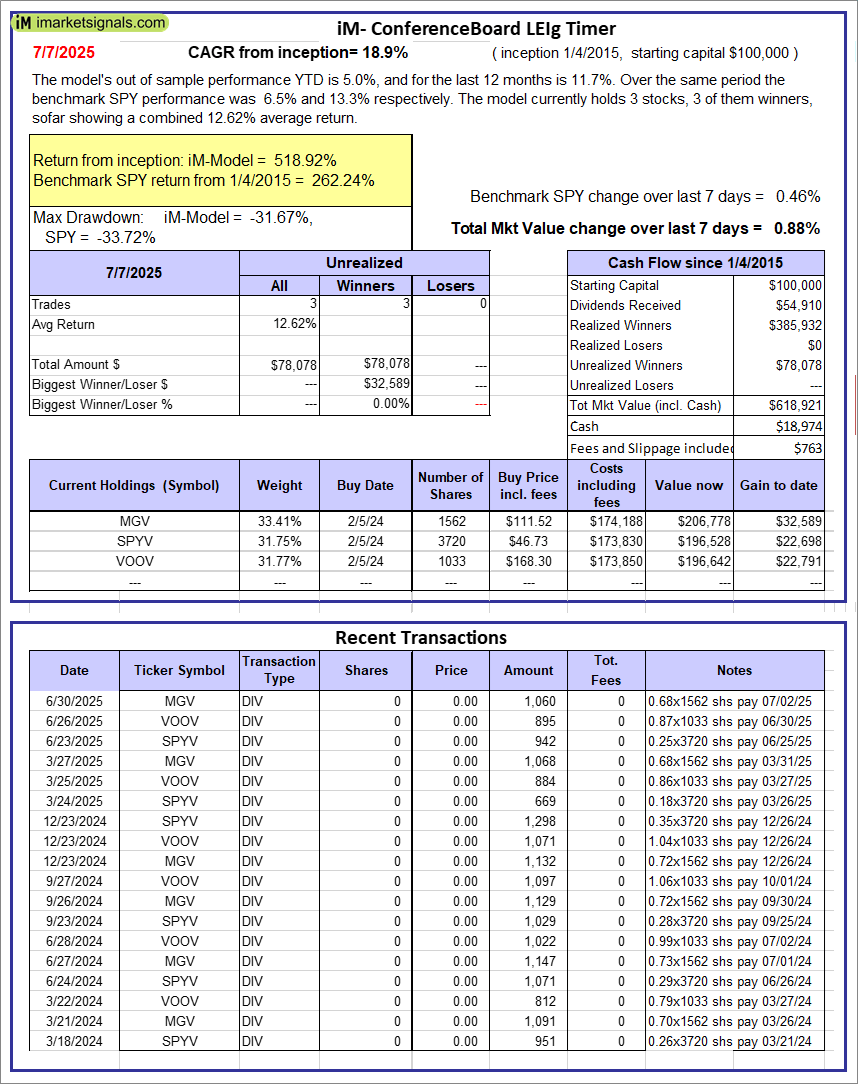 |
iM-Conference Board LEIg Timer: The model’s performance YTD is 14.3%, and for the last 12 months is 7.3%. Over the same period the benchmark SPY performance was 20.1% and 9.4% respectively. Over the previous week the market value of the iM-Conference Board LEIg Timer gained 0.88% at a time when SPY gained 0.46%. A starting capital of $100,000 at inception on 4/5/2017 would have grown to $618,921 which includes $18,974 cash and excludes $763 spent on fees and slippage. |
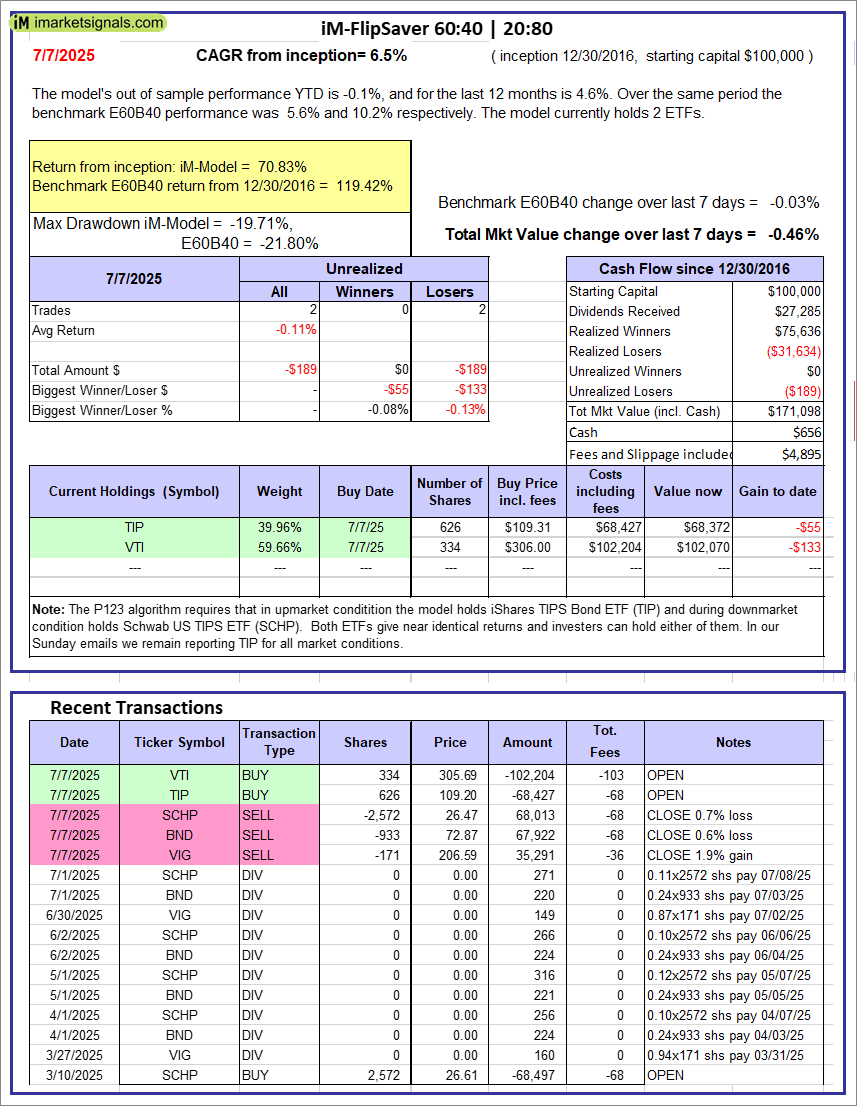 |
iM-FlipSaver 60:40 | 20:80 – 2017: The model’s out of sample performance YTD is -0.1%, and for the last 12 months is 4.6%. Over the same period the benchmark E60B40 performance was 5.6% and 10.2% respectively. Over the previous week the market value of iM-FlipSaver 80:20 | 20:80 gained -0.46% at a time when SPY gained -0.03%. A starting capital of $100,000 at inception on 7/16/2015 would have grown to $171,098 which includes $656 cash and excludes $4,895 spent on fees and slippage. |
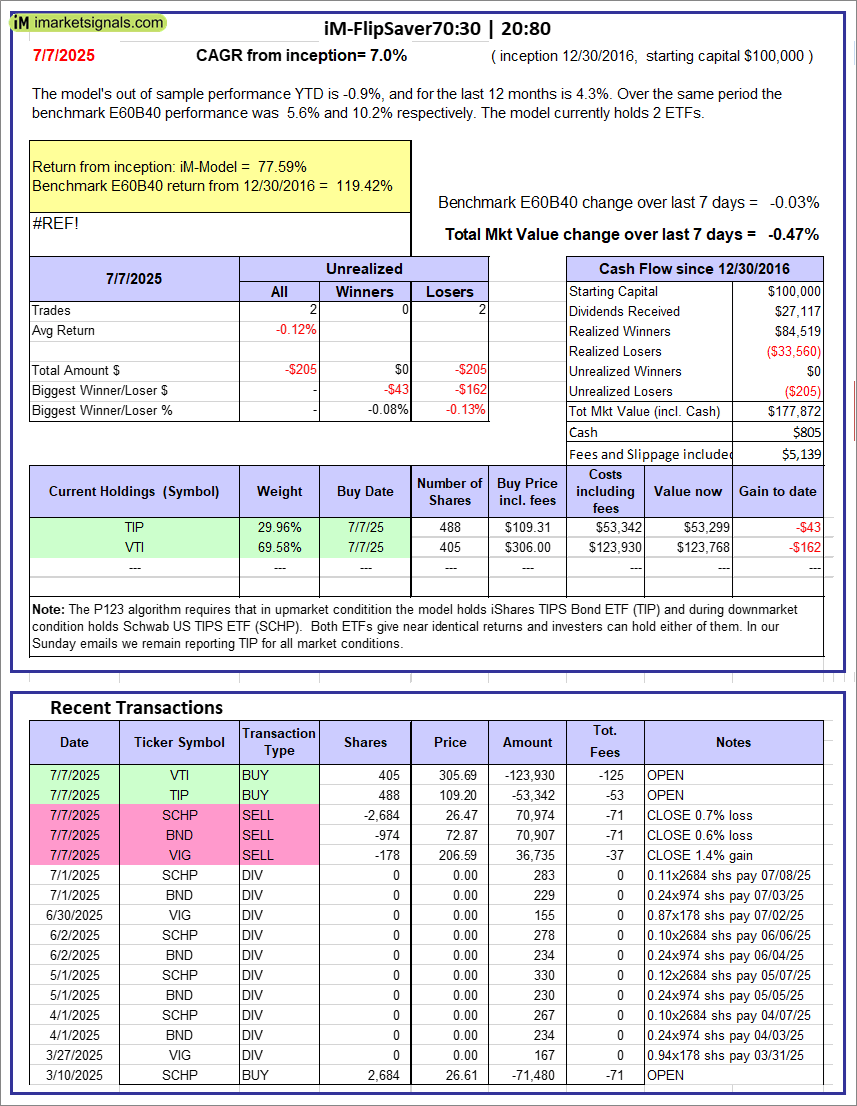 |
iM-FlipSaver 70:30 | 20:80 – 2017: The model’s out of sample performance YTD is -0.9%, and for the last 12 months is 4.3%. Over the same period the benchmark E60B40 performance was 5.6% and 10.2% respectively. Over the previous week the market value of iM-FlipSaver 70:30 | 20:80 gained -0.47% at a time when SPY gained -0.03%. A starting capital of $100,000 at inception on 7/15/2015 would have grown to $177,872 which includes $805 cash and excludes $5,139 spent on fees and slippage. |
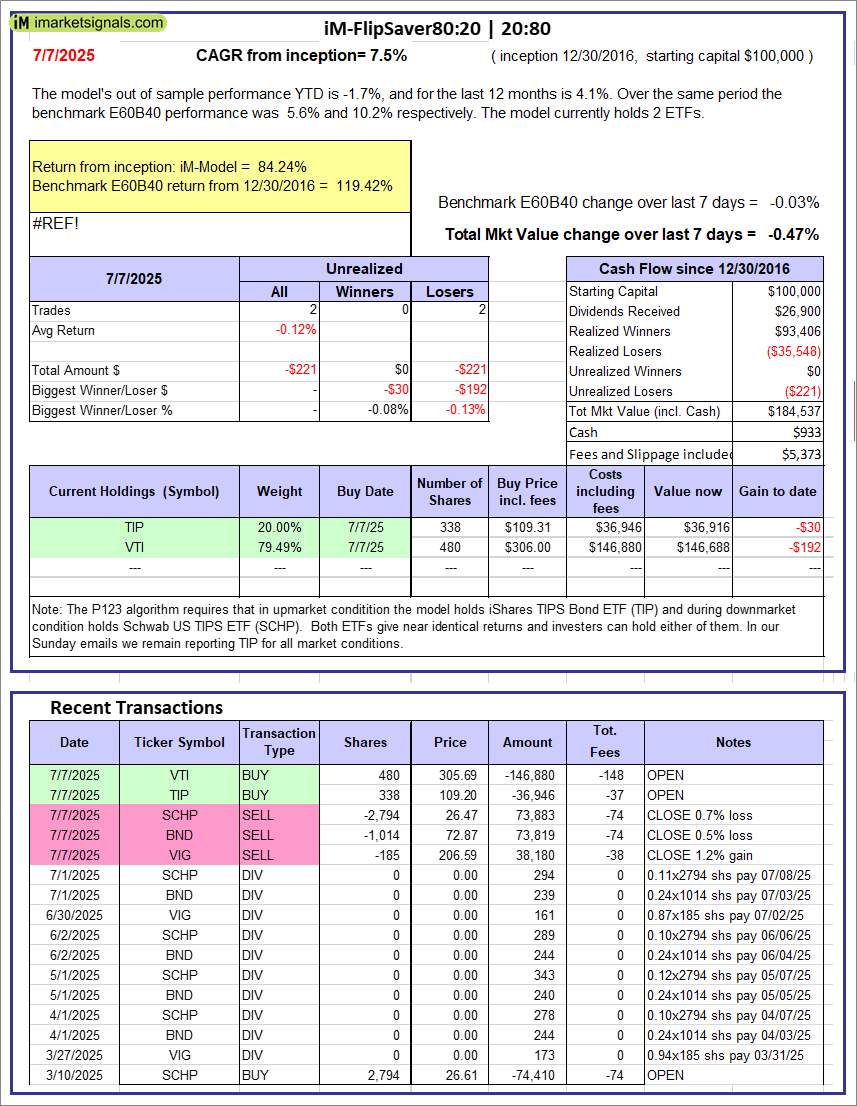 |
iM-FlipSaver 80:20 | 20:80 – 2017: The model’s out of sample performance YTD is -1.7%, and for the last 12 months is 4.1%. Over the same period the benchmark E60B40 performance was 5.6% and 10.2% respectively. Over the previous week the market value of iM-FlipSaver 80:20 | 20:80 gained -0.47% at a time when SPY gained -0.03%. A starting capital of $100,000 at inception on 1/2/2017 would have grown to $184,537 which includes $933 cash and excludes $5,373 spent on fees and slippage. |
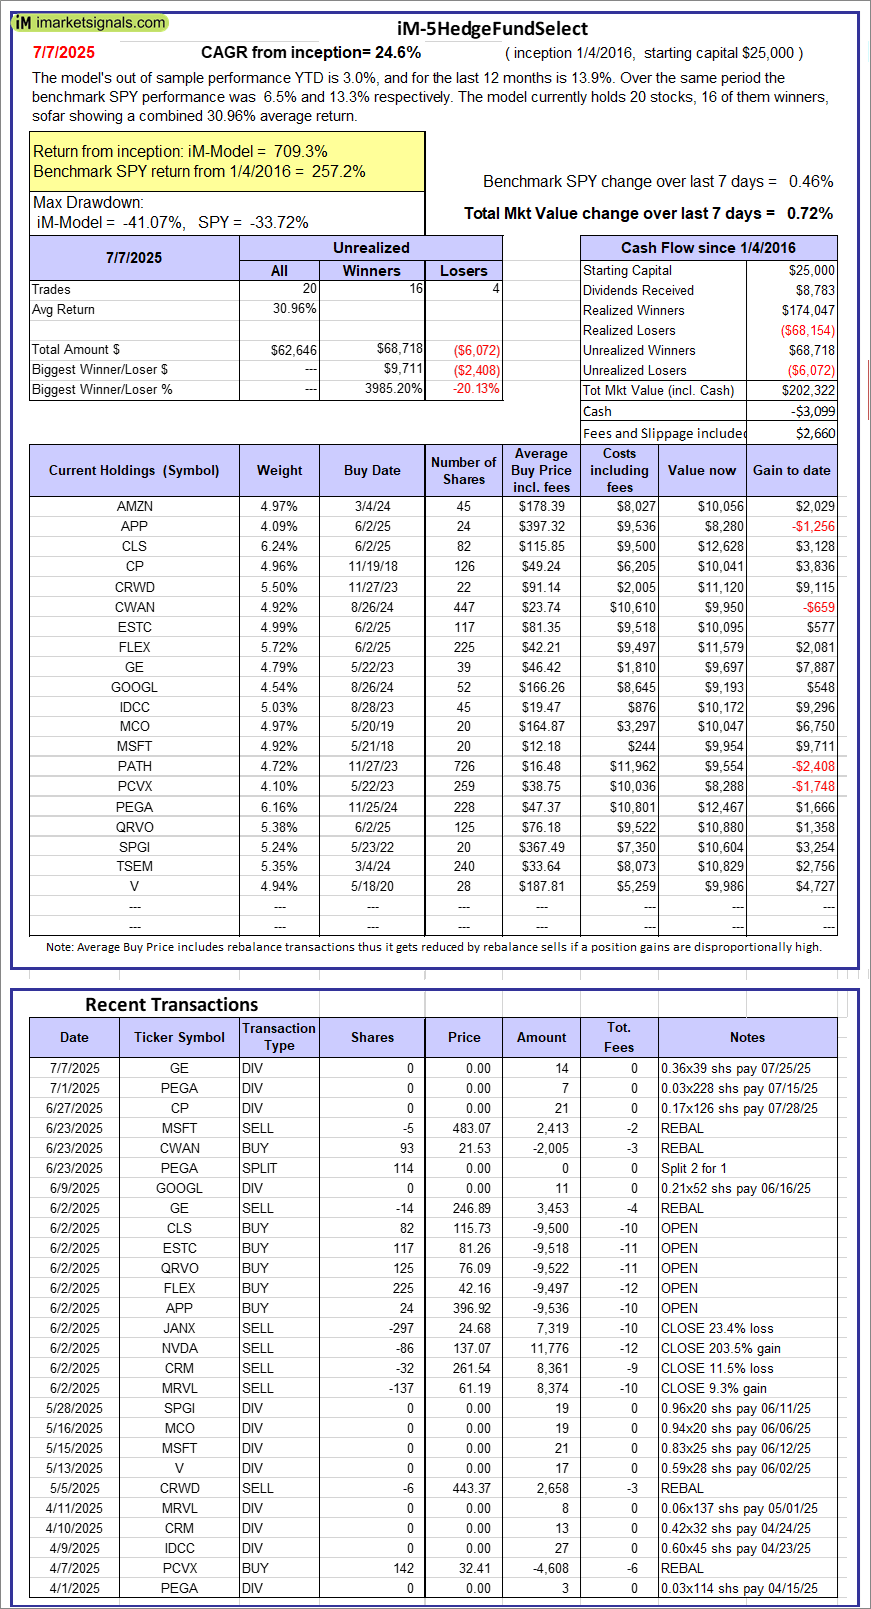 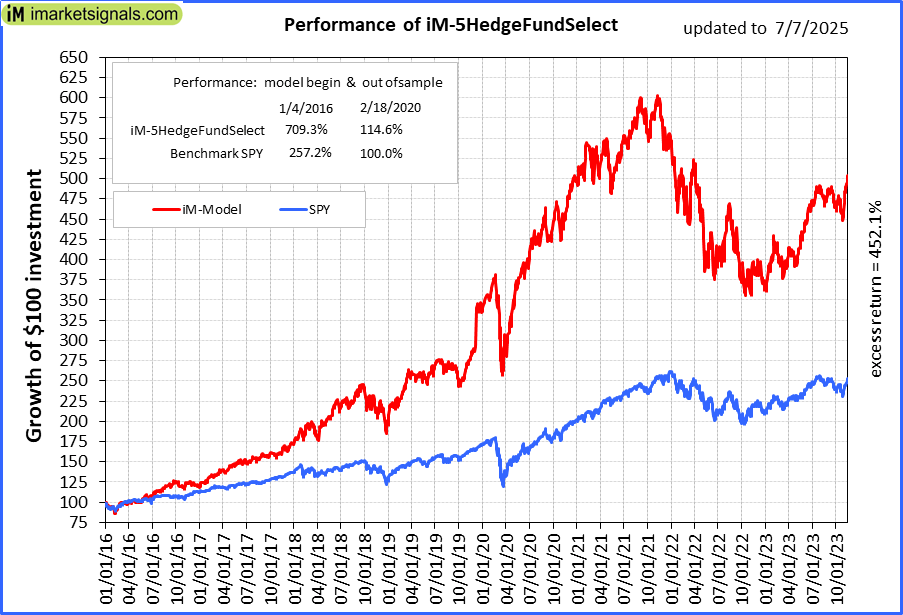 |
iM-5HedgeFundSelect: Since inception, on 1/5/2016, the model gained 709.29% while the benchmark SPY gained 257.17% over the same period. Over the previous week the market value of iM-5HedgeFundSelect gained 0.72% at a time when SPY gained 0.46%. A starting capital of $25,000 at inception on 1/5/2016 would have grown to $202,322 which includes -$3,099 cash and excludes $2,660 spent on fees and slippage. |
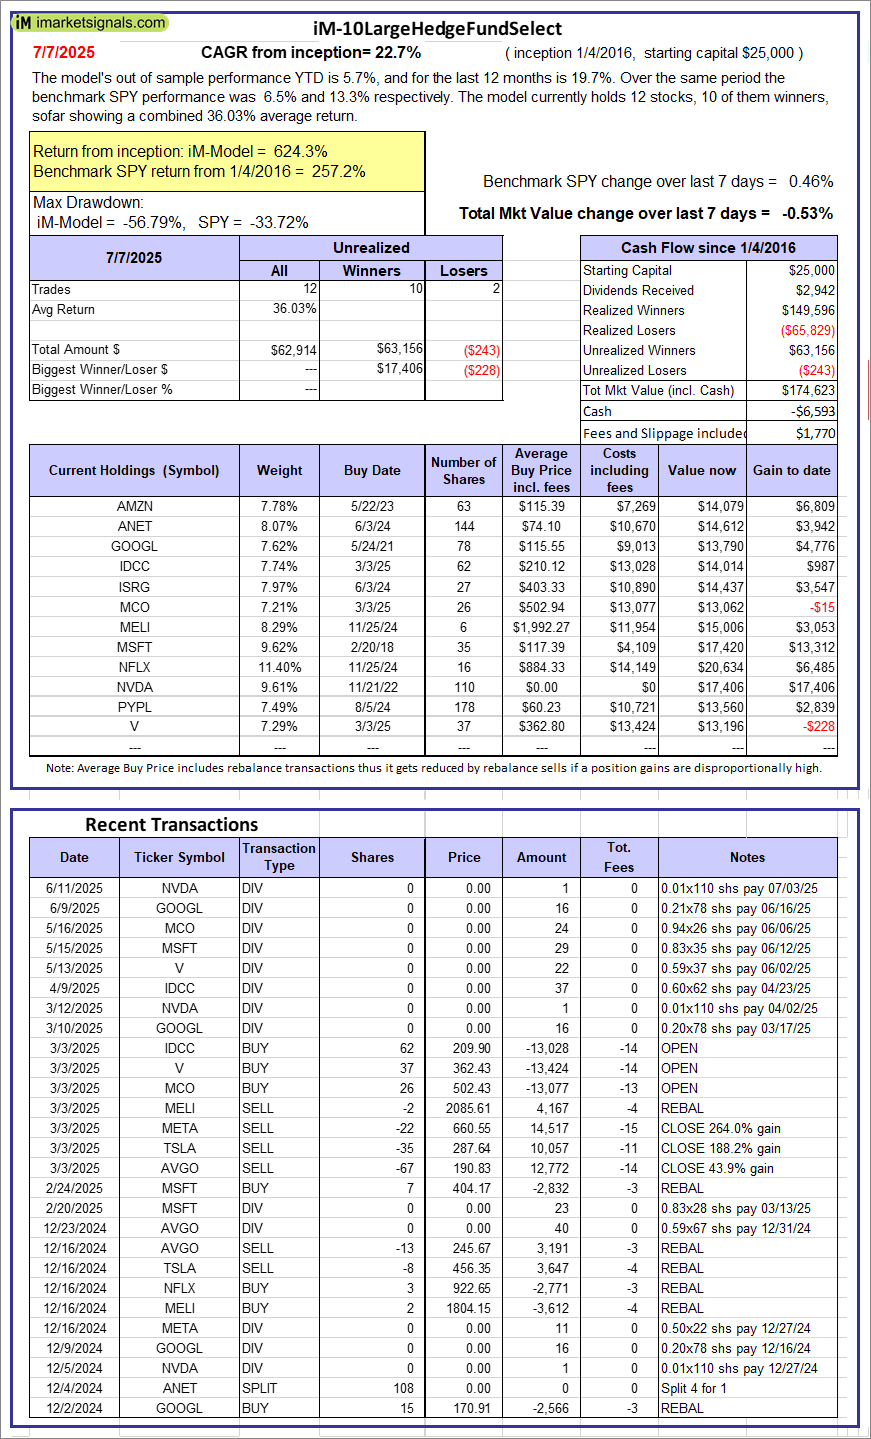 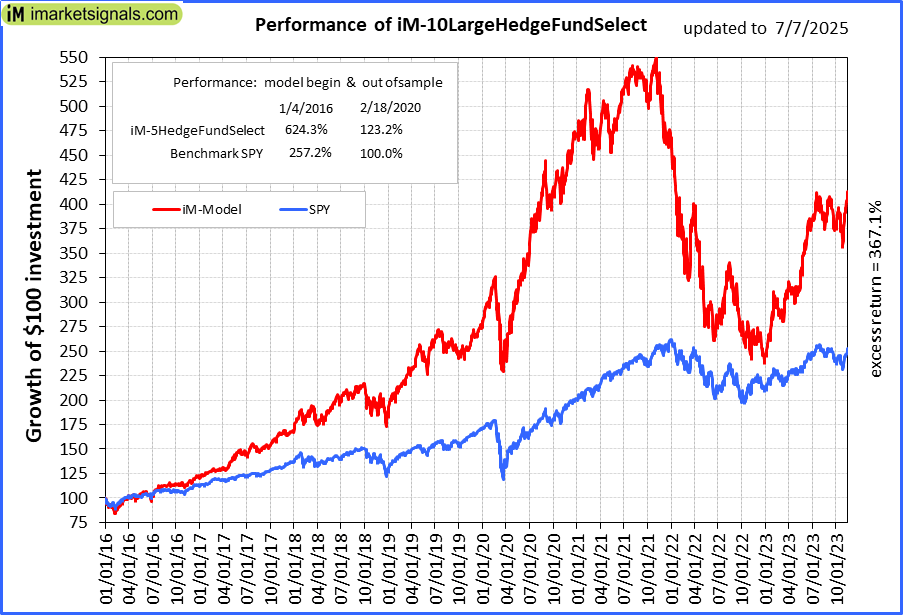 |
iM-10LargeHedgeFundSelect: Since inception, on 1/5/2016, the model gained 624.29% while the benchmark SPY gained 257.17% over the same period. Over the previous week the market value of iM-10LargeHedgeFundSelect gained -0.53% at a time when SPY gained 0.46%. A starting capital of $25,000 at inception on 1/5/2016 would have grown to $174,623 which includes -$6,593 cash and excludes $1,770 spent on fees and slippage. |
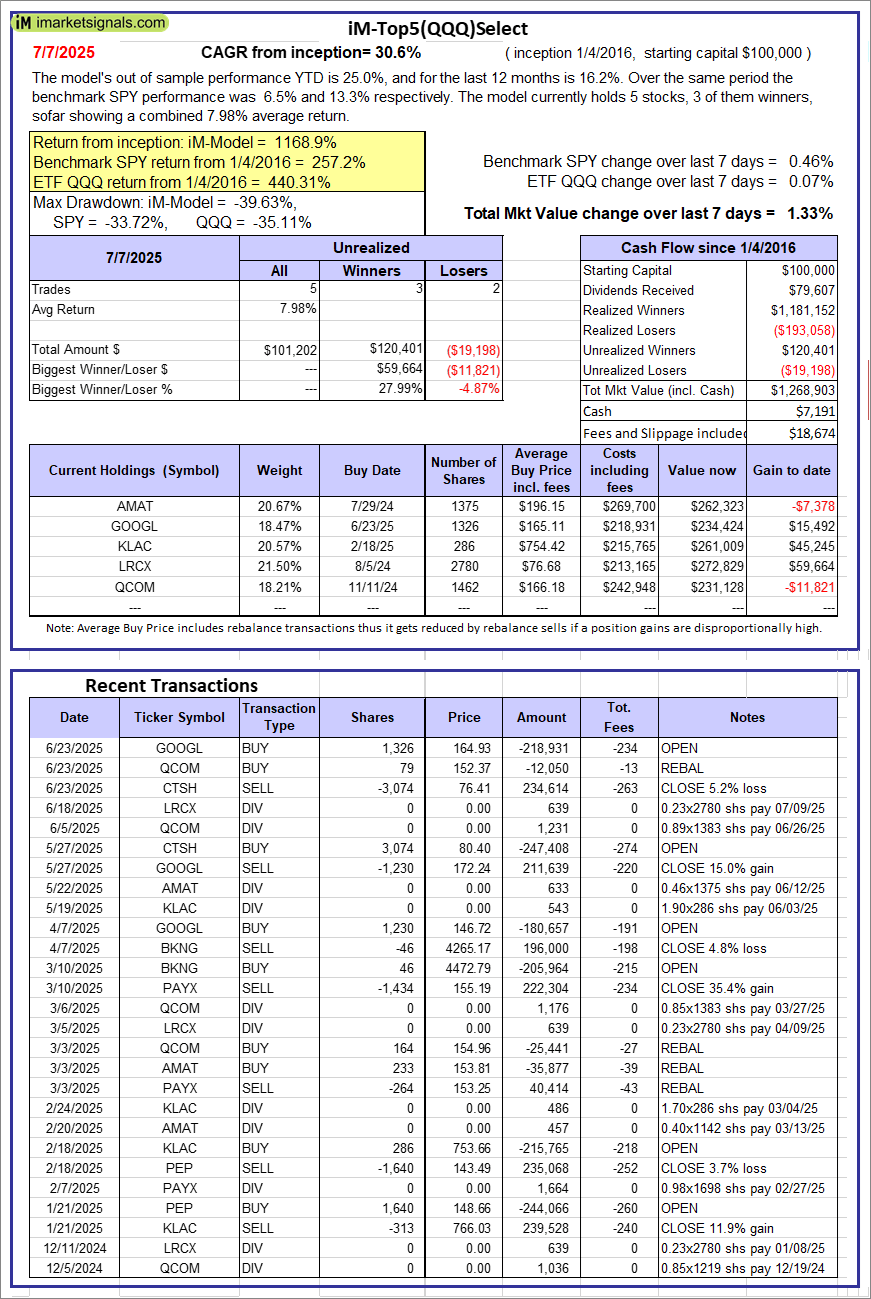 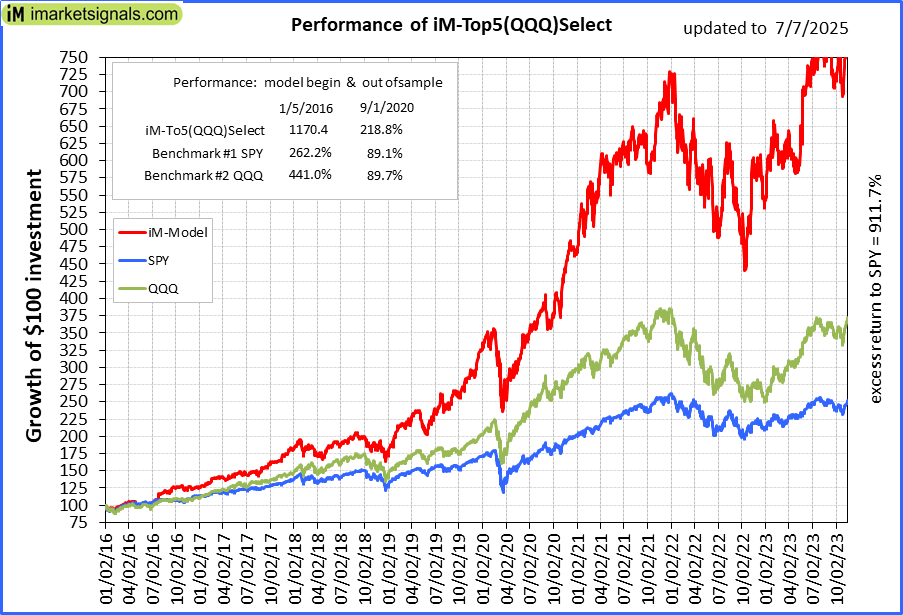 |
iM-Top5(QQQ)Select: Since inception, on 1/5/2016, the model gained 1168.90% while the benchmark SPY gained 257.17% over the same period. Over the previous week the market value of iM-Top5(QQQ)Select gained 1.33% at a time when SPY gained 0.46%. A starting capital of $100,000 at inception on 1/5/2016 would have grown to $1,268,903 which includes $7,191 cash and excludes $18,674 spent on fees and slippage. |
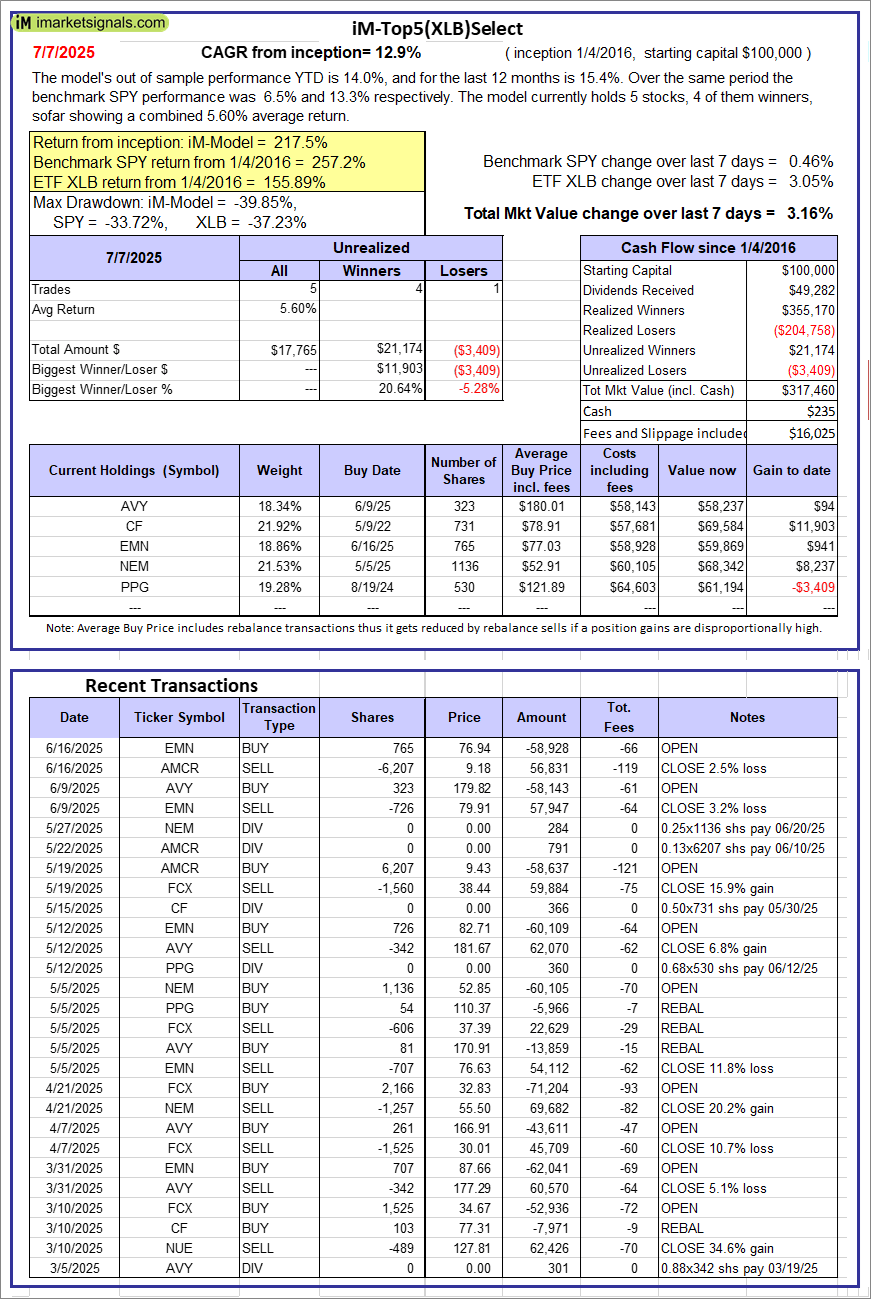 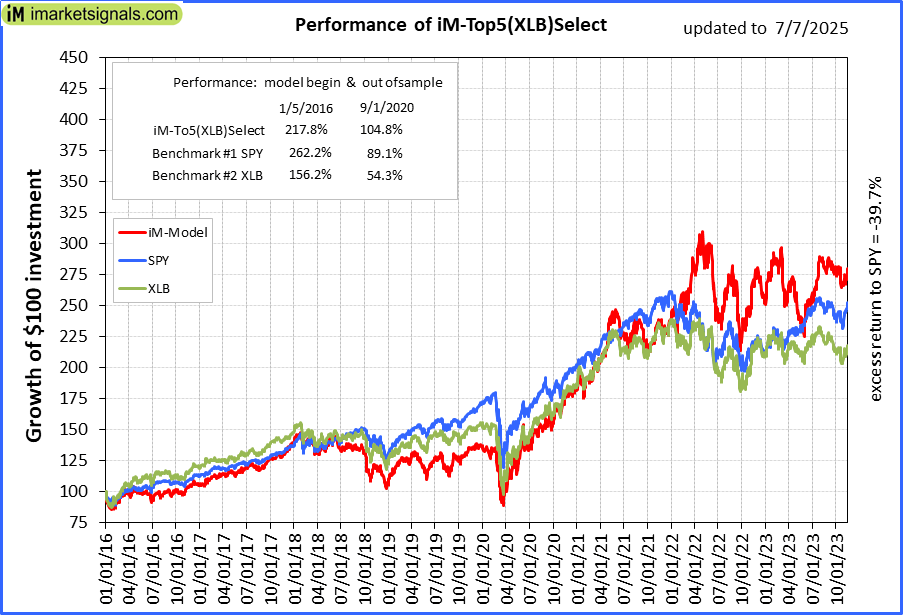 |
iM-Top5(XLB)Select: Since inception, on 1/5/2016, the model gained 217.46% while the benchmark SPY gained 257.17% over the same period. Over the previous week the market value of iM-Top5(XLB)Select gained 3.16% at a time when SPY gained 0.46%. A starting capital of $100,000 at inception on 1/5/2016 would have grown to $317,460 which includes $235 cash and excludes $16,025 spent on fees and slippage. |
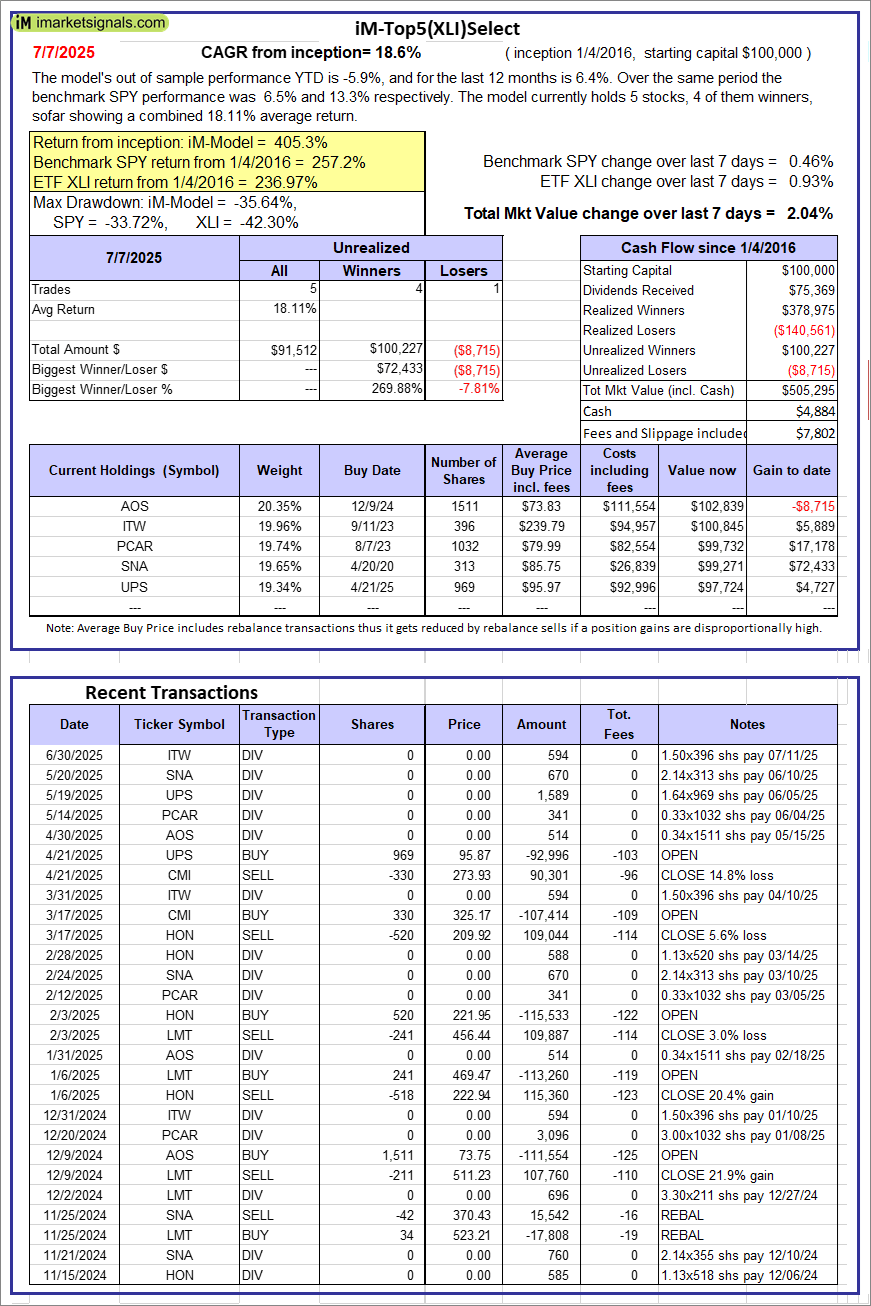 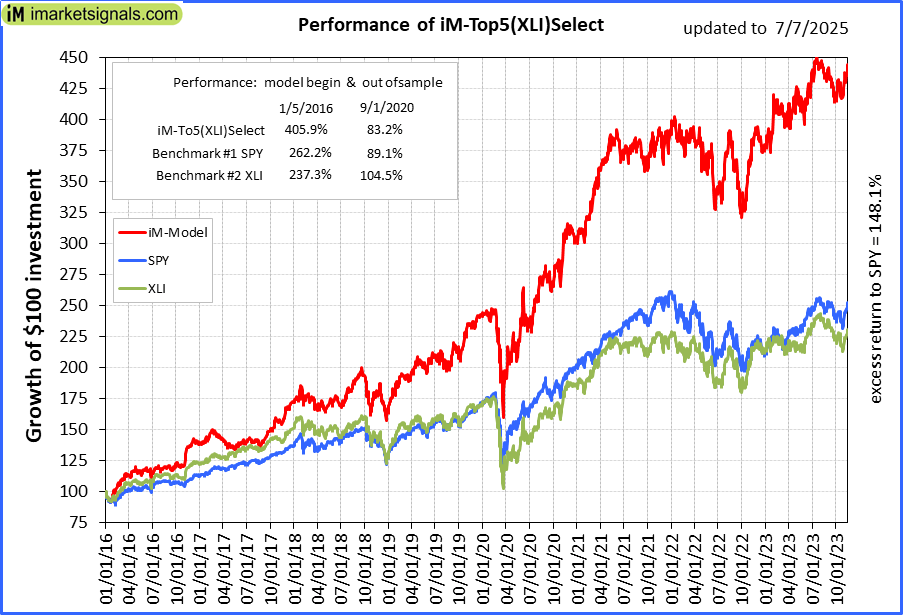 |
iM-Top5(XLI)Select: Since inception, on 1/5/2016, the model gained 405.30% while the benchmark SPY gained 257.17% over the same period. Over the previous week the market value of iM-Top5(XLI)Select gained 2.04% at a time when SPY gained 0.46%. A starting capital of $100,000 at inception on 1/5/2016 would have grown to $505,295 which includes $4,884 cash and excludes $7,802 spent on fees and slippage. |
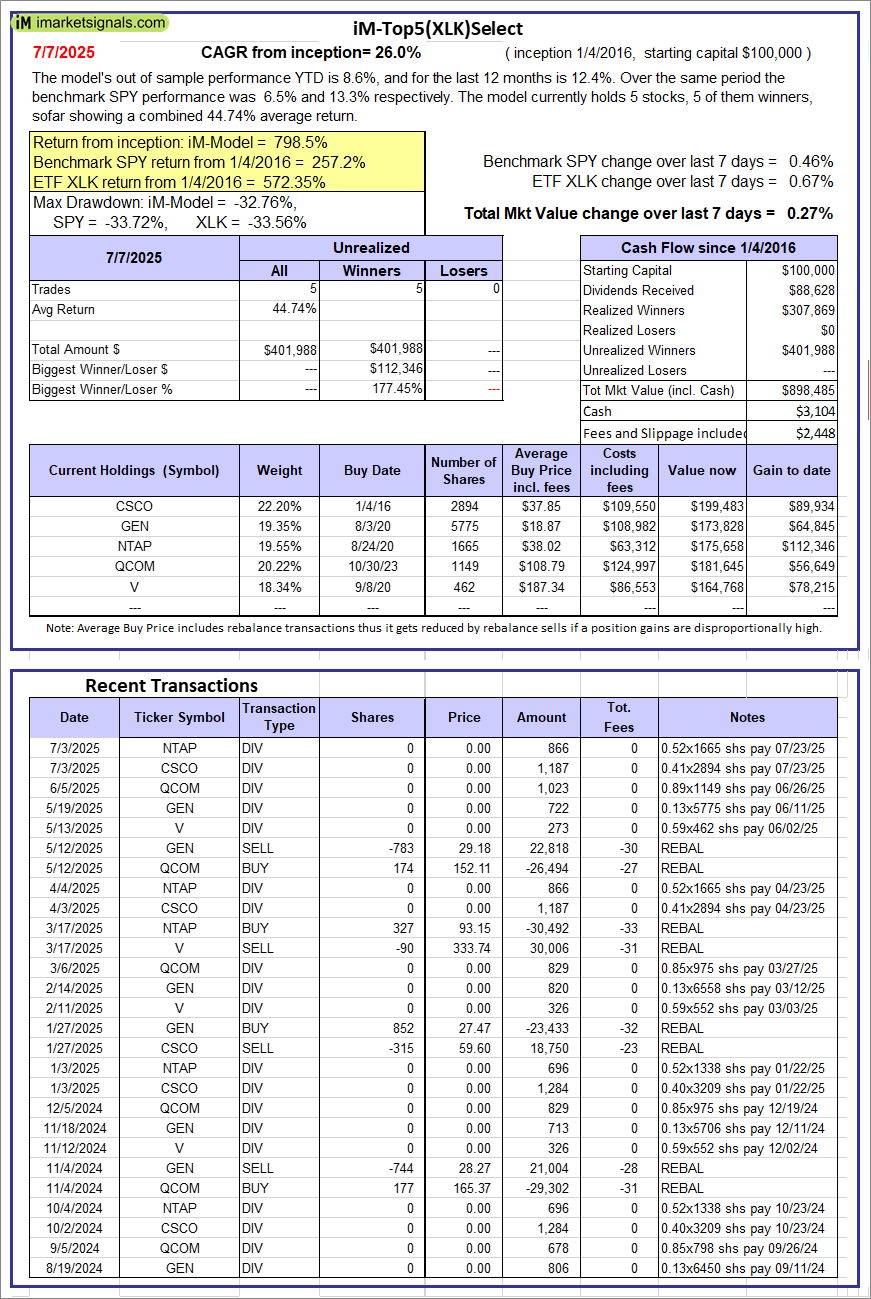 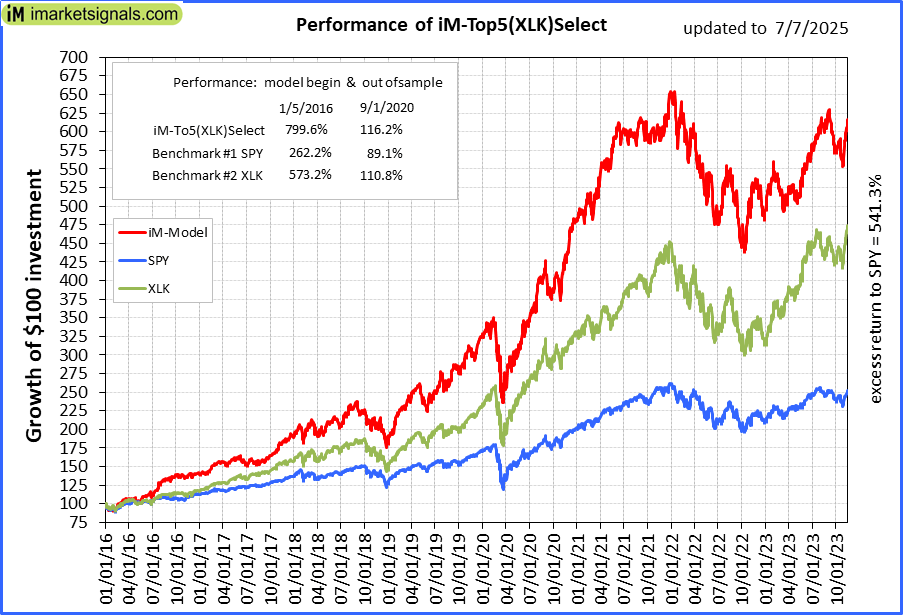 |
iM-Top5(XLK)Select: Since inception, on 1/5/2016, the model gained 798.49% while the benchmark SPY gained 257.17% over the same period. Over the previous week the market value of iM-Top5(XLK)Select gained 0.27% at a time when SPY gained 0.46%. A starting capital of $100,000 at inception on 1/5/2016 would have grown to $898,485 which includes $3,104 cash and excludes $2,448 spent on fees and slippage. |
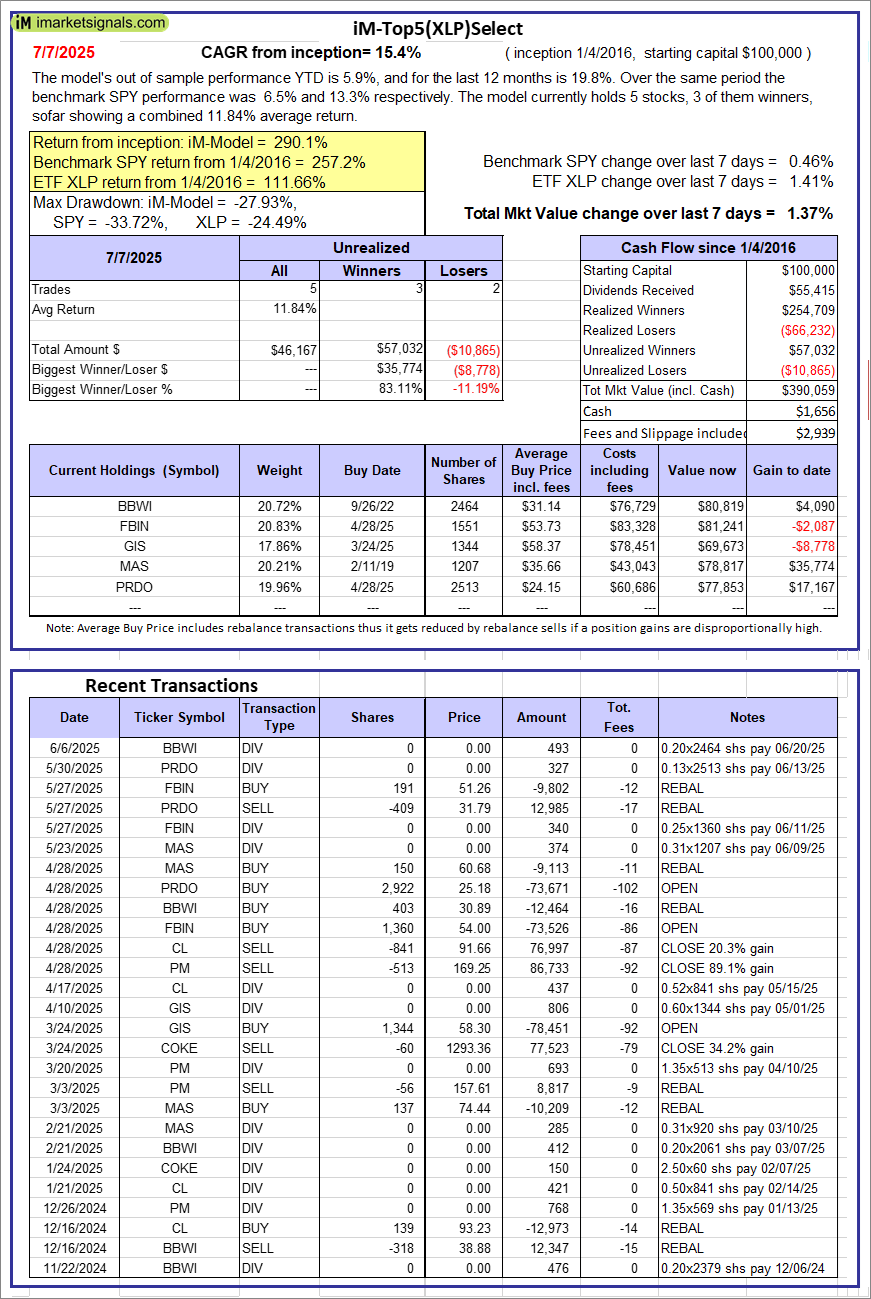 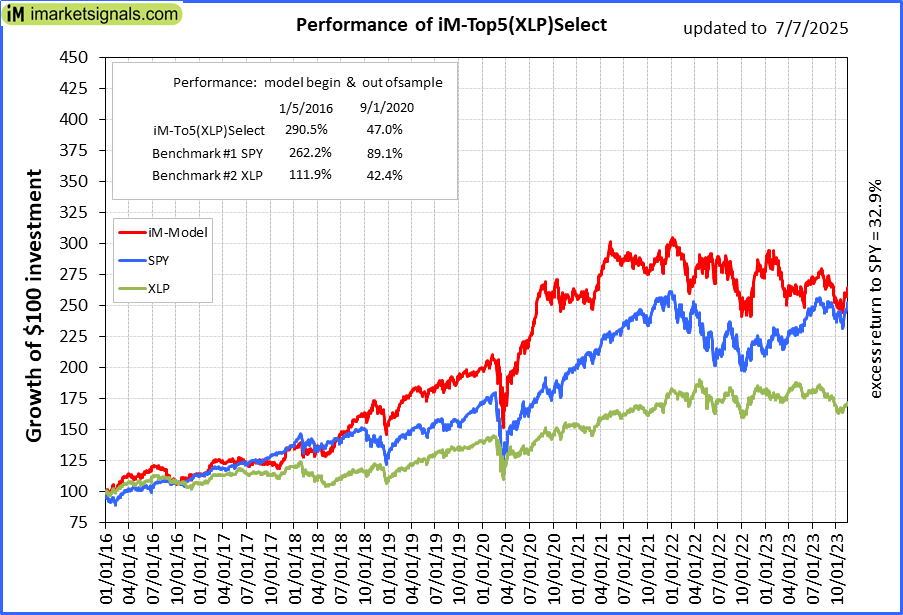 |
iM-Top5(XLP)Select: Since inception, on 1/5/2016, the model gained 290.06% while the benchmark SPY gained 257.17% over the same period. Over the previous week the market value of iM-Top5(XLP)Select gained 1.37% at a time when SPY gained 0.46%. A starting capital of $100,000 at inception on 1/5/2016 would have grown to $390,059 which includes $1,656 cash and excludes $2,939 spent on fees and slippage. |
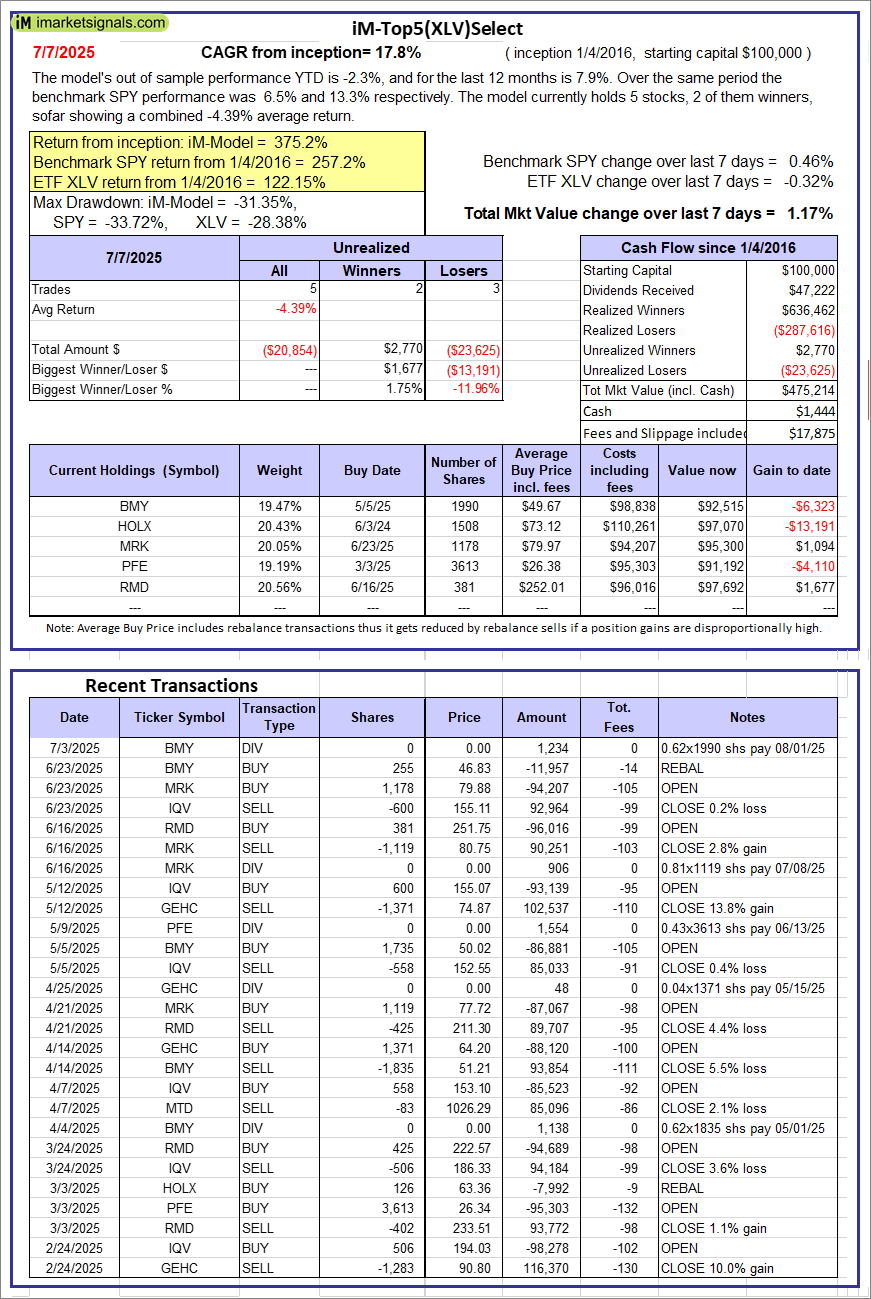 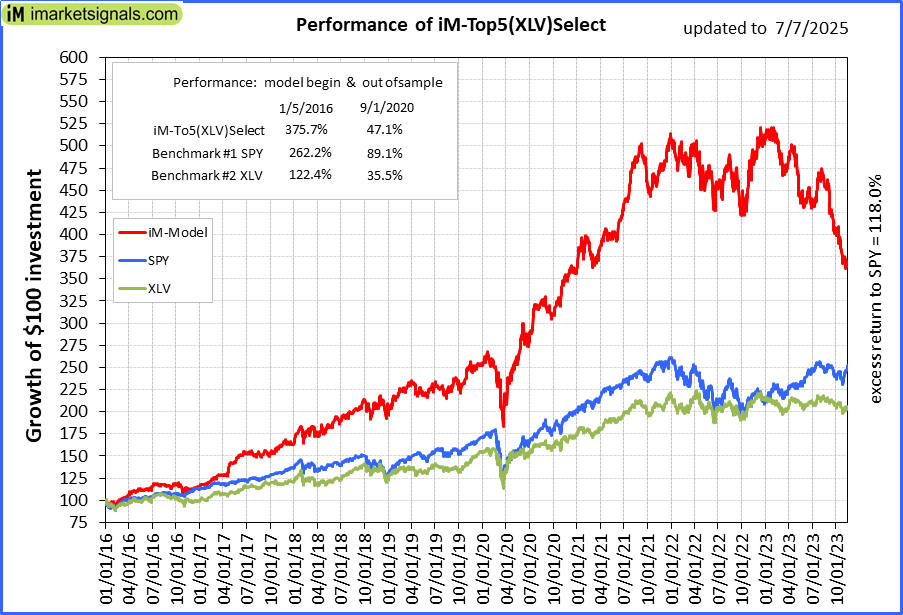 |
iM-Top5(XLV)Select: Since inception, on 1/5/2016, the model gained 375.21% while the benchmark SPY gained 257.17% over the same period. Over the previous week the market value of iM-Top5(XLV)Select gained 1.17% at a time when SPY gained 0.46%. A starting capital of $100,000 at inception on 1/5/2016 would have grown to $475,214 which includes $1,444 cash and excludes $17,875 spent on fees and slippage. |
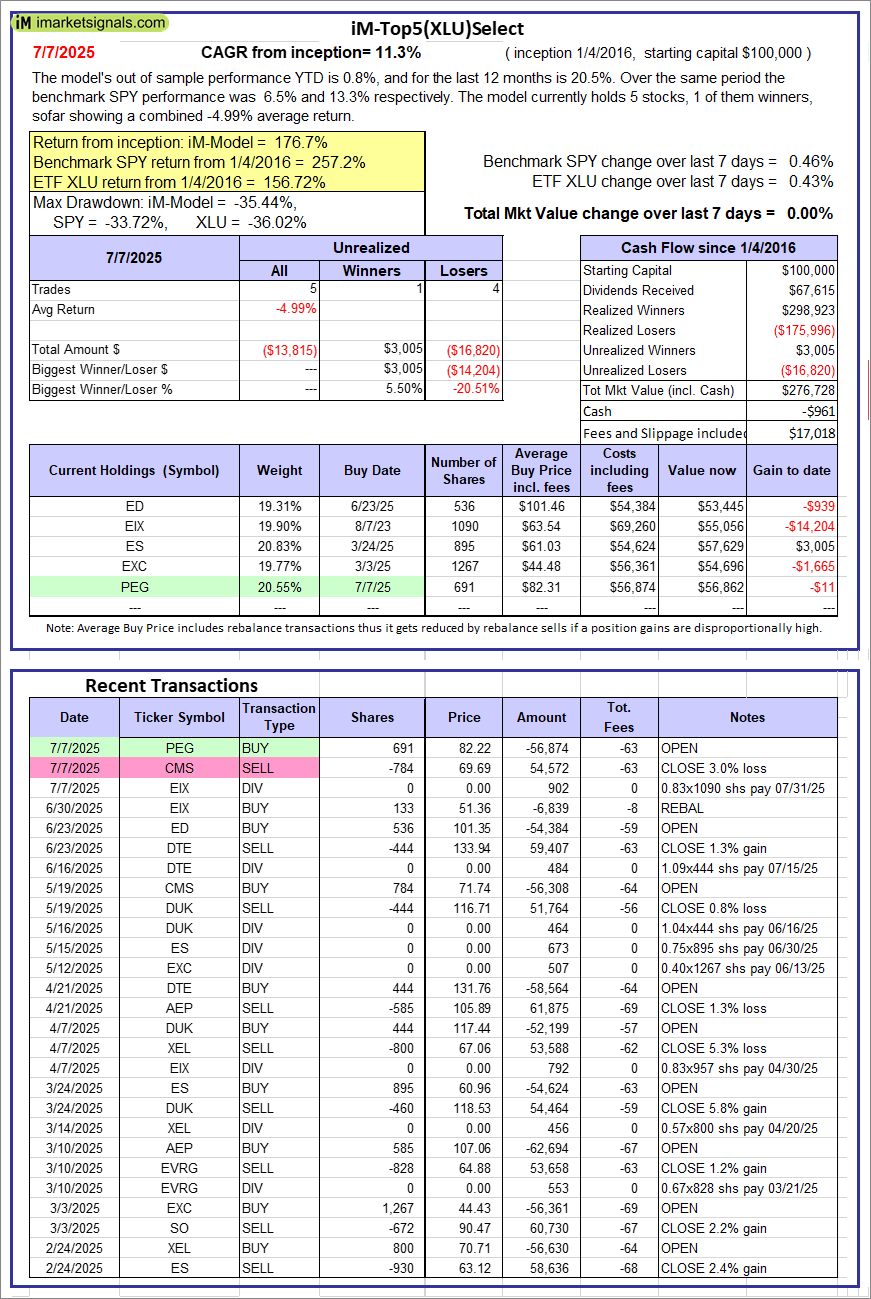 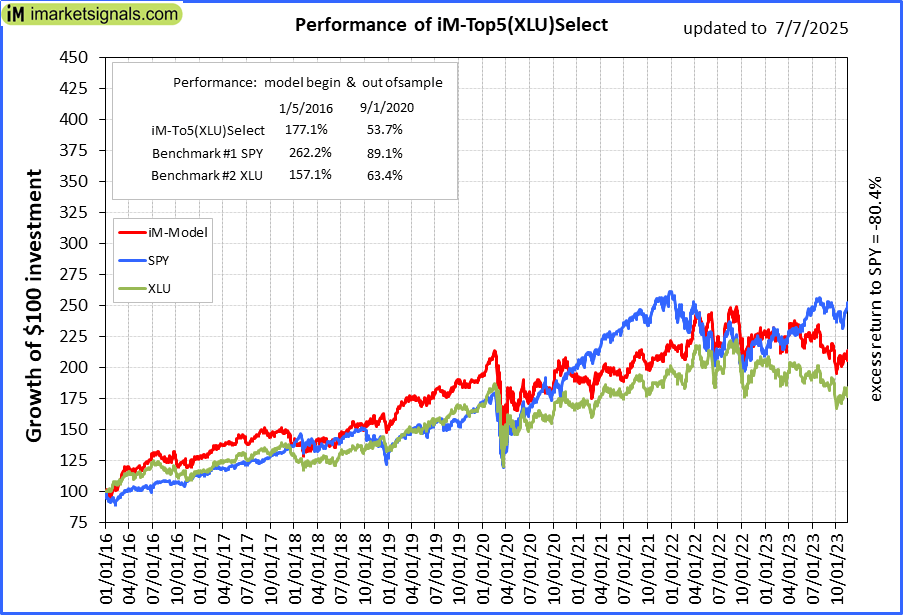 |
iM-Top5(XLU)Select: Since inception, on 1/5/2016, the model gained 176.73% while the benchmark SPY gained 257.17% over the same period. Over the previous week the market value of iM-Top5(XLU)Select gained 0.00% at a time when SPY gained 0.46%. A starting capital of $100,000 at inception on 1/5/2016 would have grown to $276,728 which includes -$961 cash and excludes $17,018 spent on fees and slippage. |
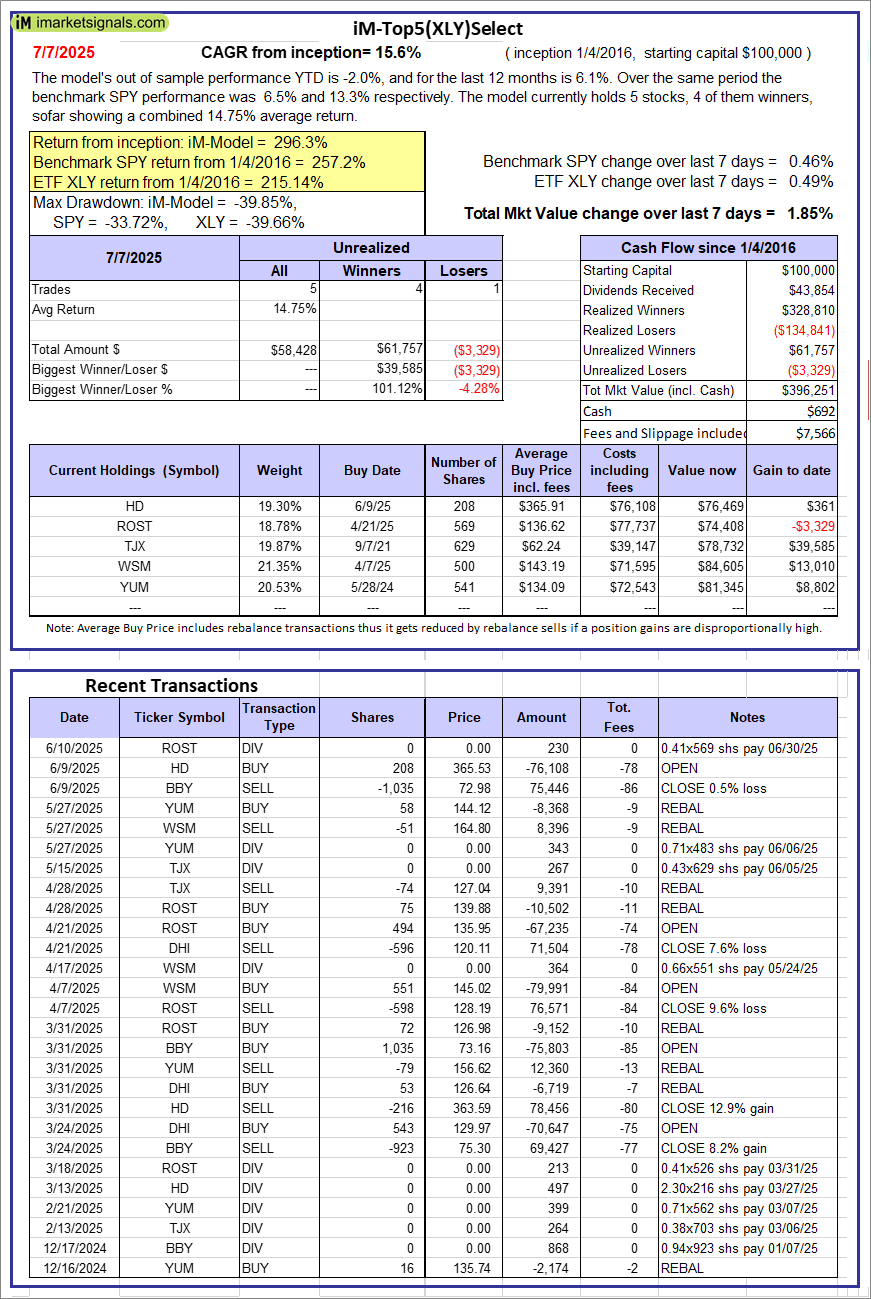 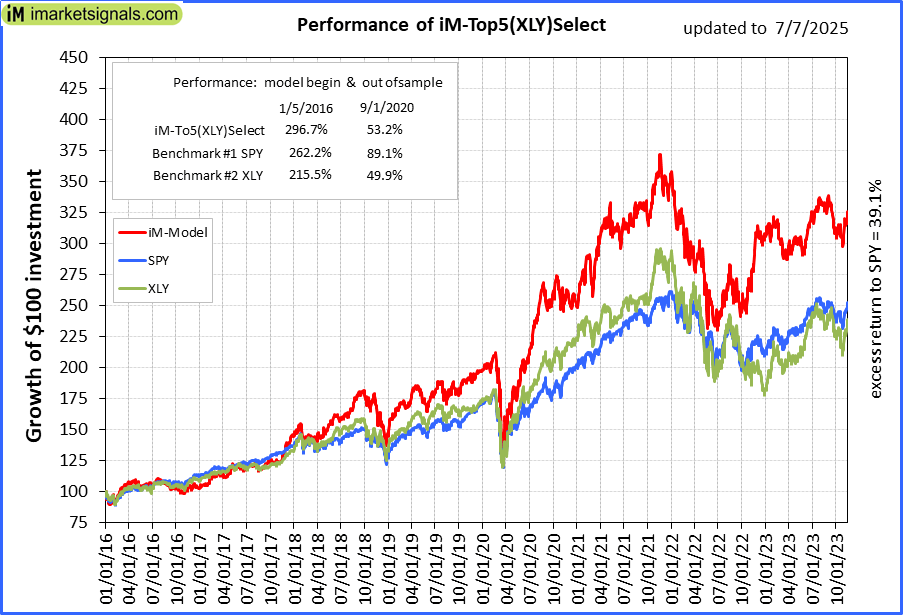 |
iM-Top5(XLY)Select: Since inception, on 1/5/2016, the model gained 296.25% while the benchmark SPY gained 257.17% over the same period. Over the previous week the market value of iM-Top5(XLY)Select gained 1.85% at a time when SPY gained 0.46%. A starting capital of $100,000 at inception on 1/5/2016 would have grown to $396,251 which includes $692 cash and excludes $7,566 spent on fees and slippage. |
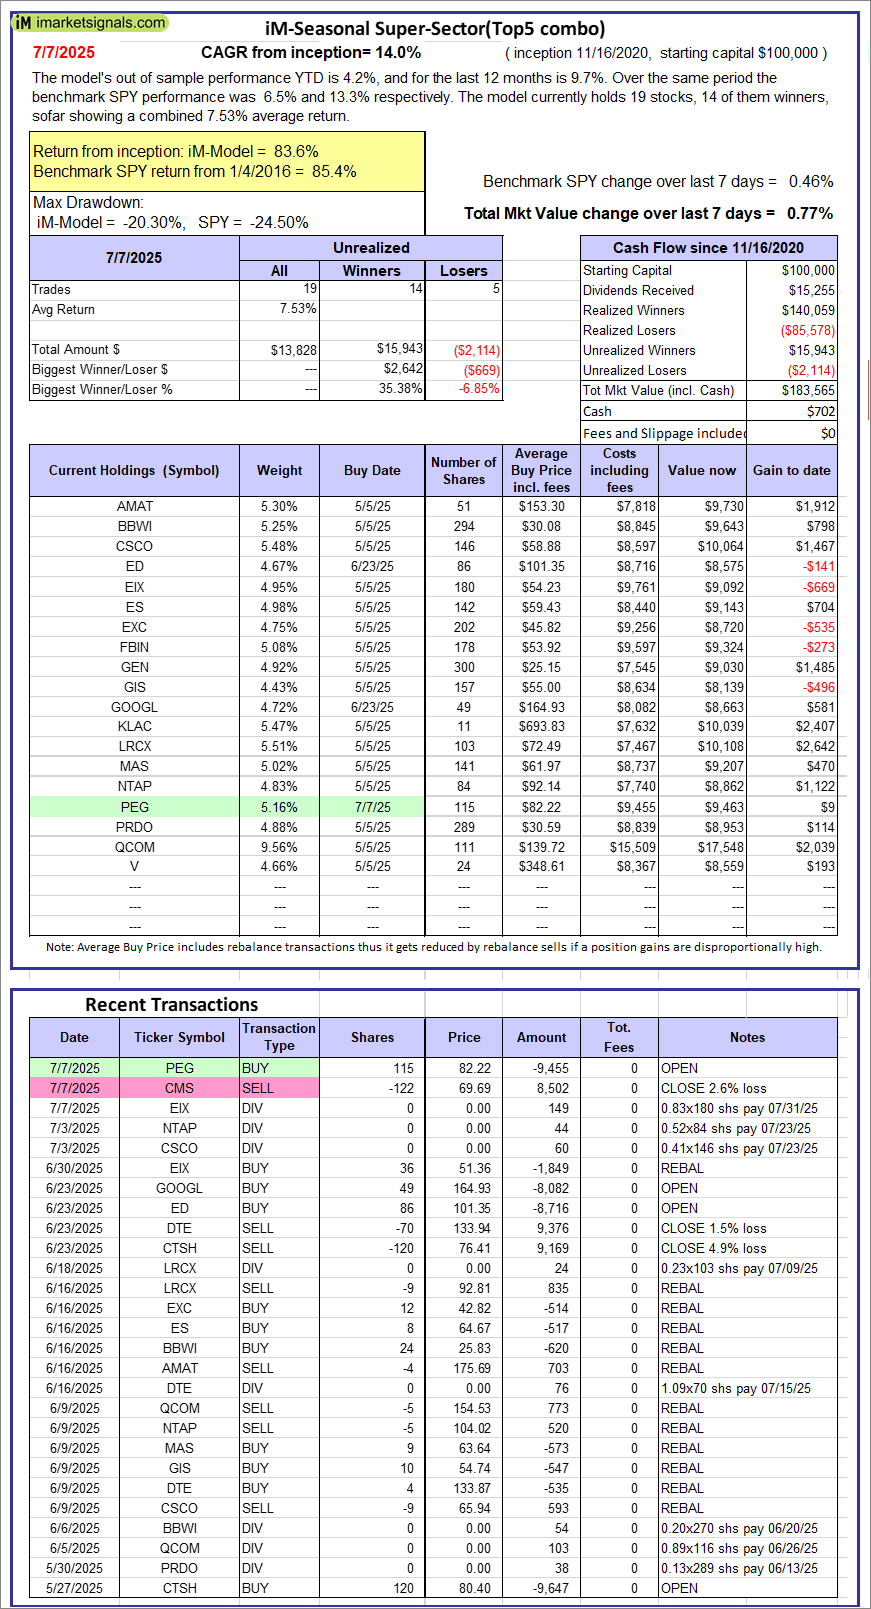 |
iM-Seasonal Super-Sectors (Top5 combo) : Since inception, on 11/17/2020, the model gained 83.56% while the benchmark SPY gained 85.41% over the same period. Over the previous week the market value of iM-Seasonal Super-Sectors (Top5 combo) gained 0.77% at a time when SPY gained 0.46%. A starting capital of $100,000 at inception on 11/17/2020 would have grown to $183,565 which includes $702 cash and excludes $00 spent on fees and slippage. |
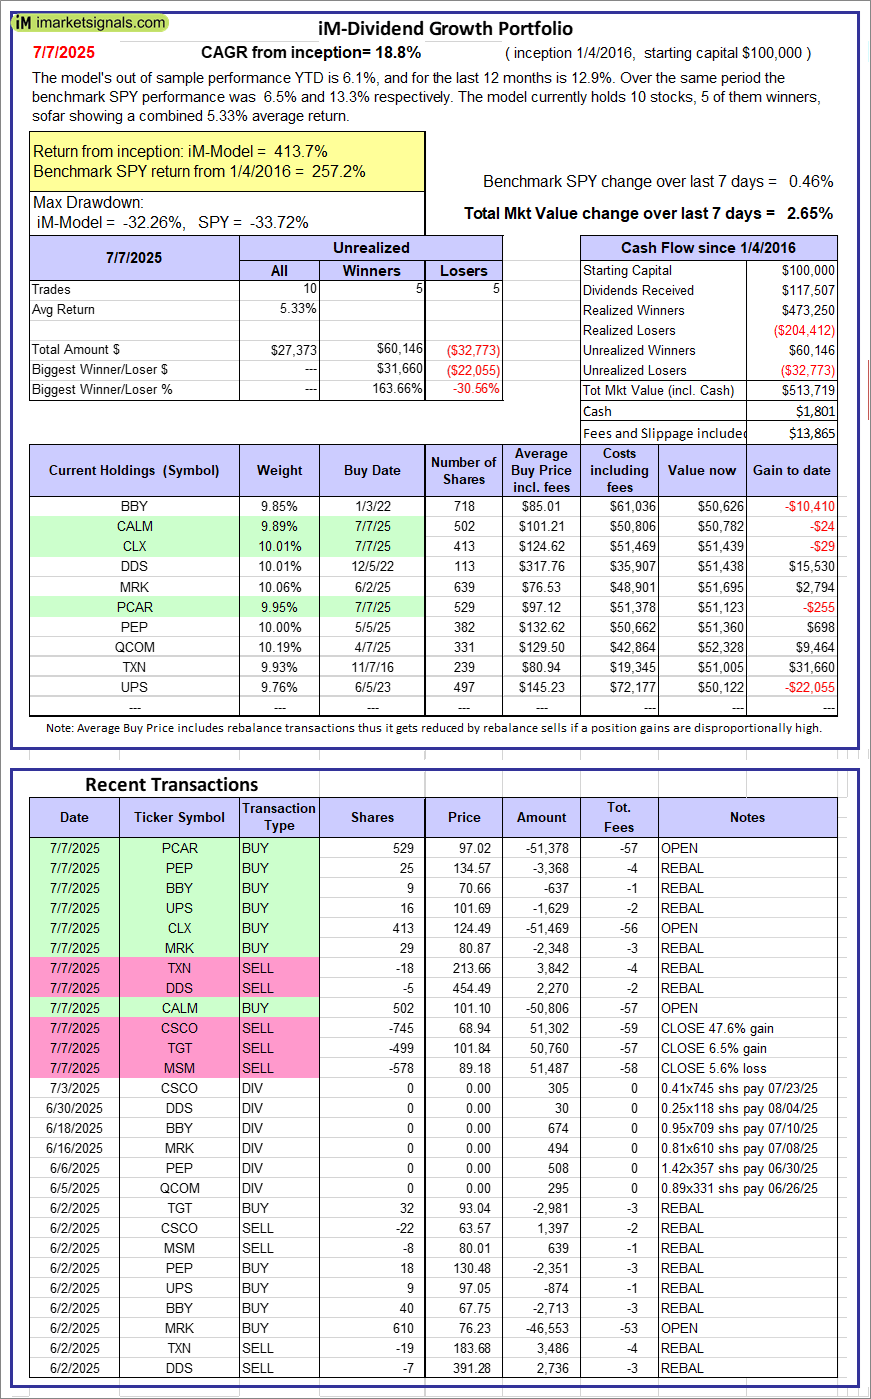 |
iM-Dividend Growth Portfolio: The model’s out of sample performance YTD is 6.1%, and for the last 12 months is 12.9%. Over the same period the benchmark SPY performance was 6.5% and 13.3% respectively. Over the previous week the market value of the iM-Dividend Growth Portfolio gained 2.65% at a time when SPY gained 0.46%. A starting capital of $100,000 at inception on 6/30/2016 would have grown to $513,719 which includes $1,801 cash and excludes $13,865 spent on fees and slippage. |
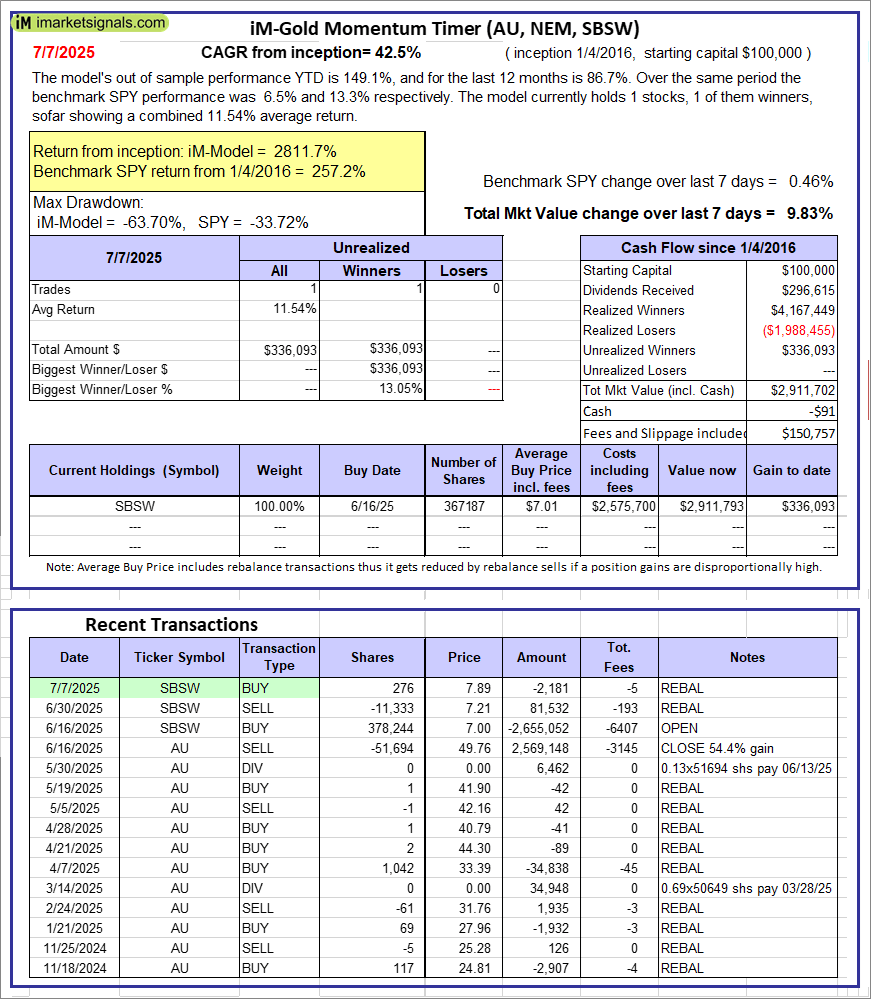 |
iM-Gold Momentum Timer (AU, NEM, SBSW): The model’s out of sample performance YTD is 149.1%, and for the last 12 months is 86.7%. Over the same period the benchmark SPY performance was 6.5% and 13.3% respectively. Over the previous week the market value of iM-Gold Momentum Timer (AU, NEM, SBSW) gained 9.83% at a time when SPY gained 0.46%. A starting capital of $100,000 at inception on 6/30/2016 would have grown to -$91 which includes $150,757 cash and excludes Gain to date spent on fees and slippage. |
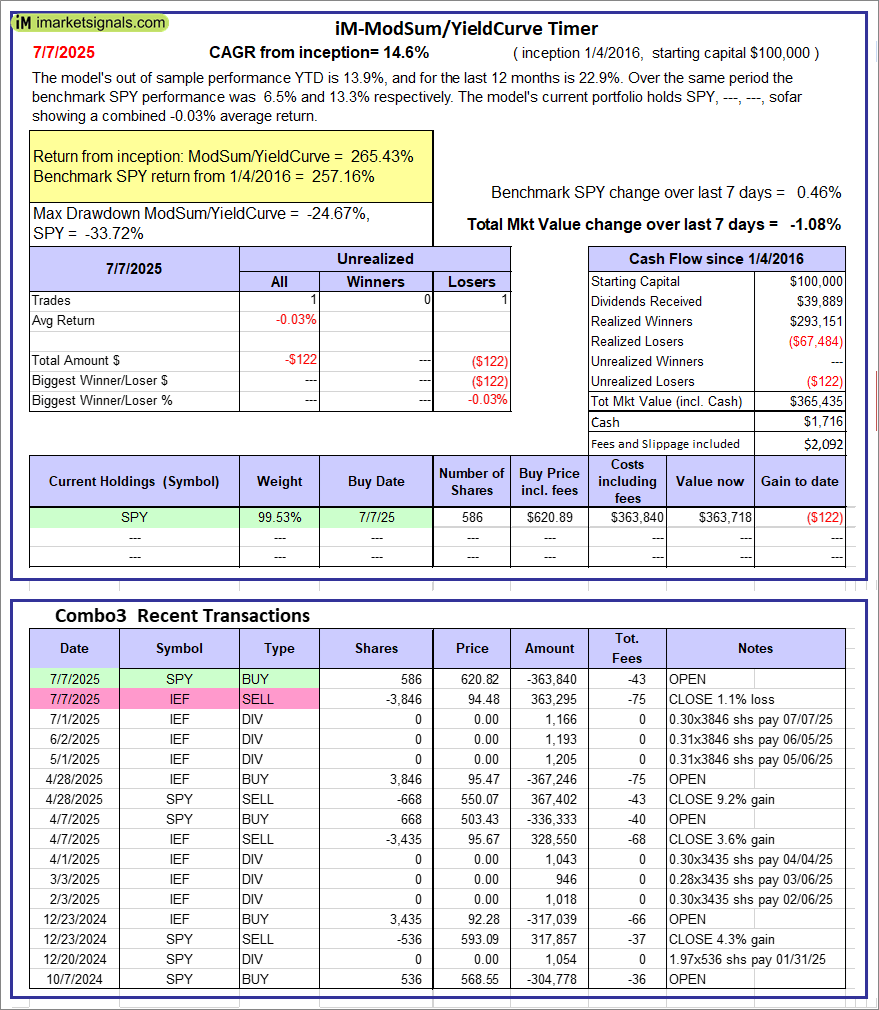 |
iM-ModSum/YieldCurve Timer: The model’s out of sample performance YTD is 13.9%, and for the last 12 months is 22.9%. Over the same period the benchmark SPY performance was 6.5% and 13.3% respectively. Over the previous week the market value of iM-PortSum/YieldCurve Timer gained -1.08% at a time when SPY gained 0.46%. A starting capital of $100,000 at inception on 1/1/2016 would have grown to $365,435 which includes $1,716 cash and excludes $2,092 spent on fees and slippage. |
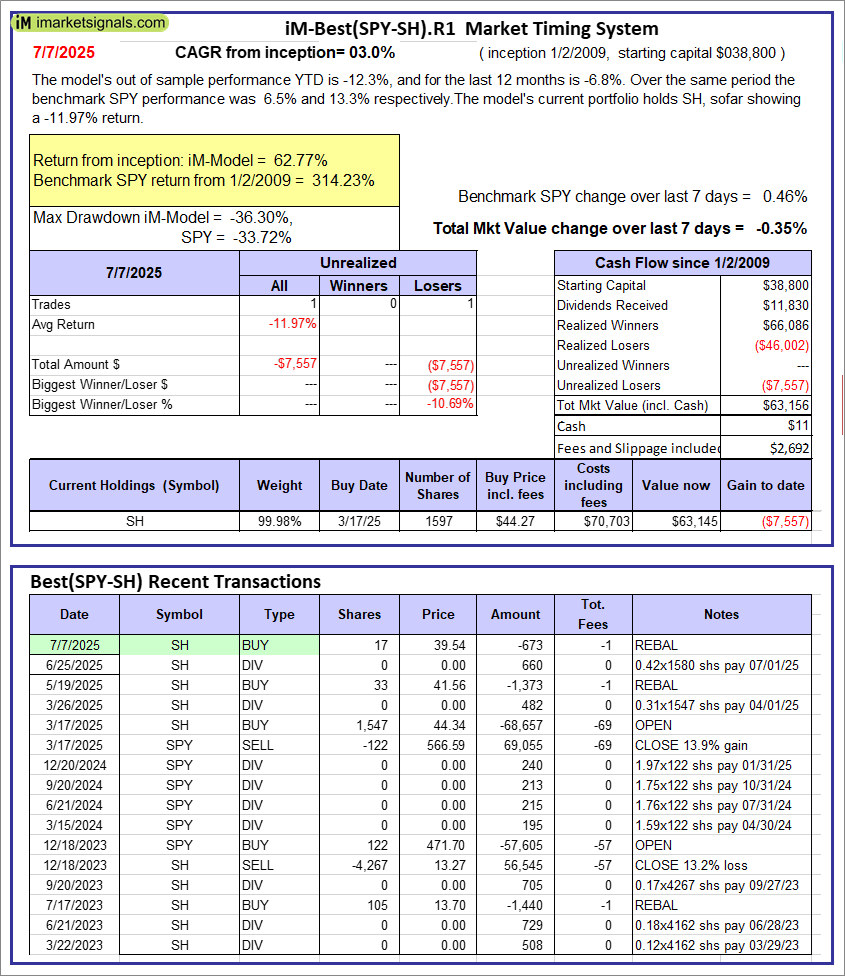 |
iM-Best(SPY-SH).R1: The model’s out of sample performance YTD is -12.3%, and for the last 12 months is -6.8%. Over the same period the benchmark SPY performance was 6.5% and 13.3% respectively. Over the previous week the market value of Best(SPY-SH) gained -0.35% at a time when SPY gained 0.46%. A starting capital of $100,000 at inception on 1/2/2009 would have grown to $63,156 which includes $11 cash and excludes $2,692 spent on fees and slippage. |
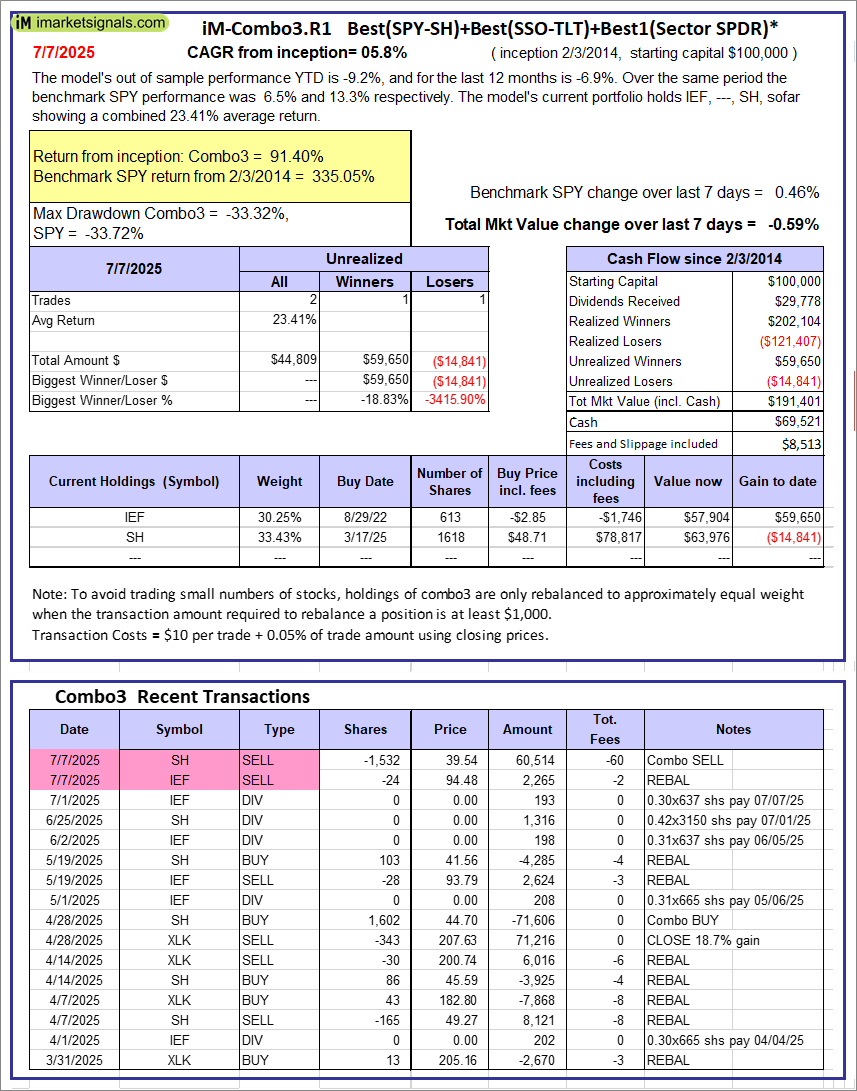 |
iM-Combo3.R1: The model’s out of sample performance YTD is -9.2%, and for the last 12 months is -6.9%. Over the same period the benchmark SPY performance was 6.5% and 13.3% respectively. Over the previous week the market value of iM-Combo3.R1 gained -0.59% at a time when SPY gained 0.46%. A starting capital of $100,000 at inception on 2/3/2014 would have grown to $191,401 which includes $69,521 cash and excludes $8,513 spent on fees and slippage. |
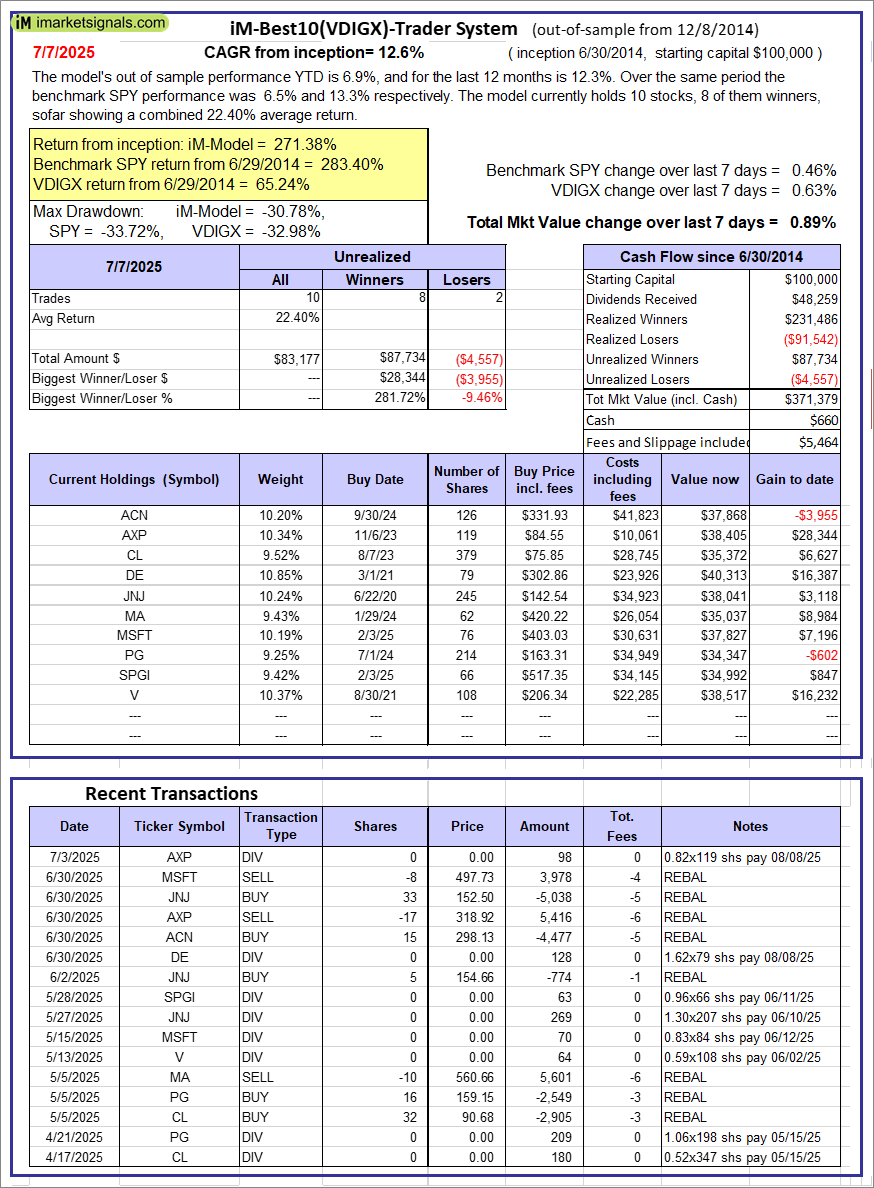 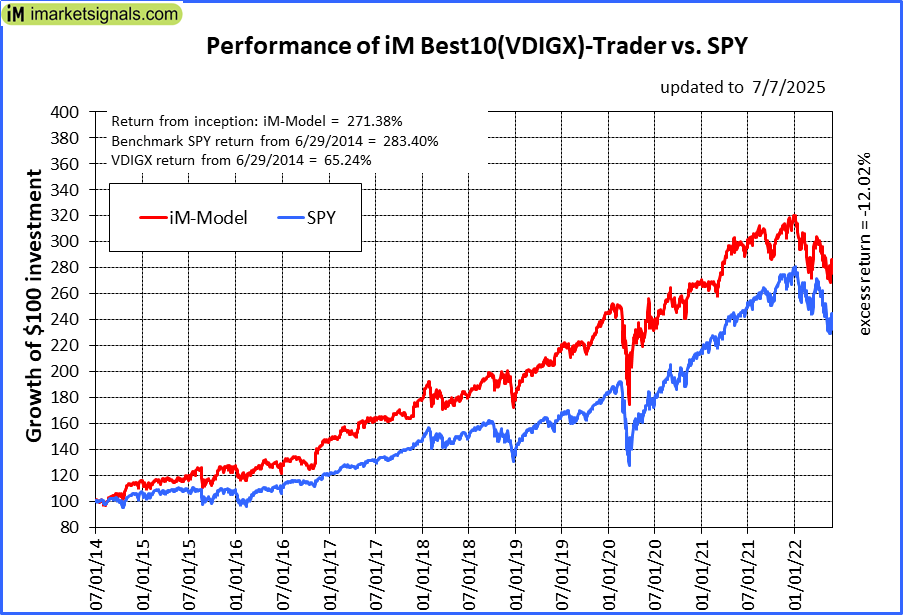 |
iM-Best10(VDIGX)-Trader: The model’s out of sample performance YTD is 6.9%, and for the last 12 months is 12.3%. Over the same period the benchmark SPY performance was 6.5% and 13.3% respectively. Since inception, on 7/1/2014, the model gained 271.38% while the benchmark SPY gained 283.40% and VDIGX gained 65.24% over the same period. Over the previous week the market value of iM-Best10(VDIGX) gained 0.89% at a time when SPY gained 0.46%. A starting capital of $100,000 at inception on 7/1/2014 would have grown to $371,379 which includes $660 cash and excludes $5,464 spent on fees and slippage. |
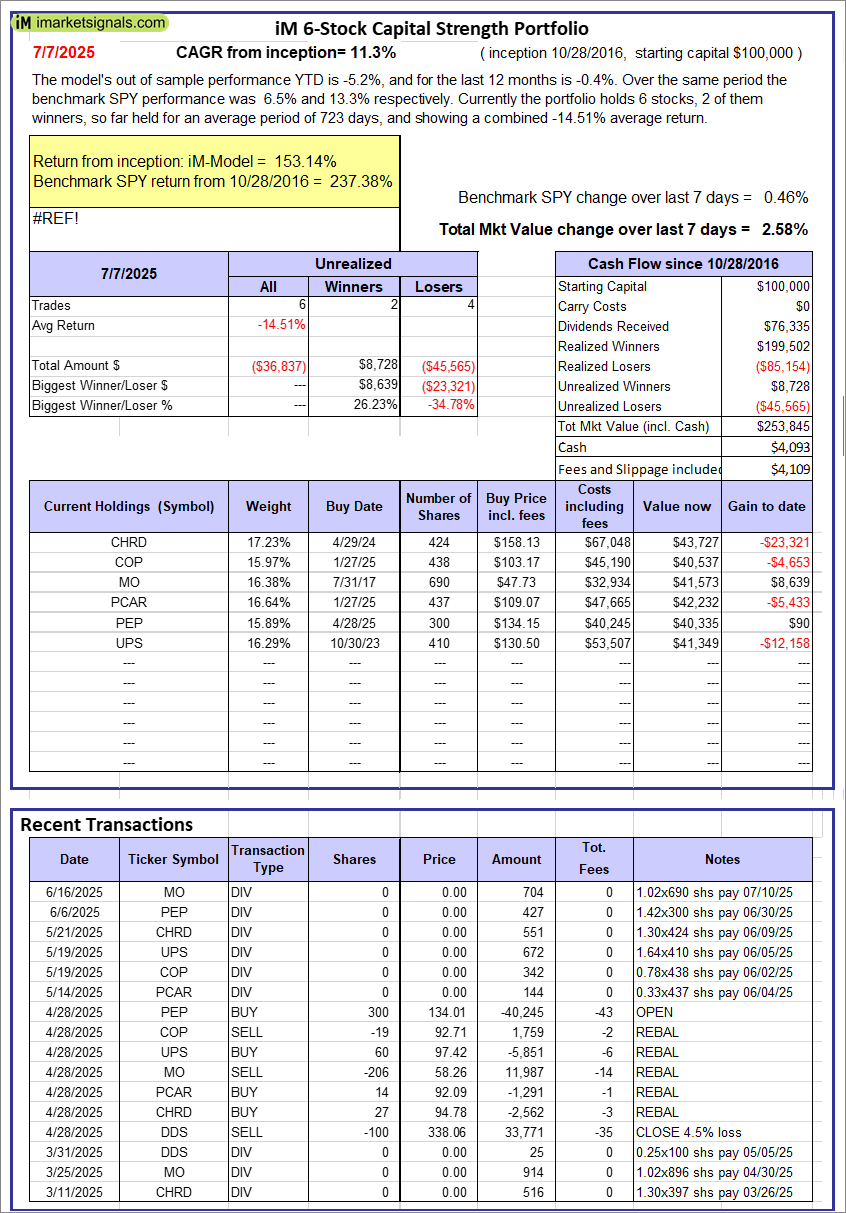 |
iM 6-Stock Capital Strength Portfolio: The model’s out of sample performance YTD is -5.2%, and for the last 12 months is -0.4%. Over the same period the benchmark SPY performance was 6.5% and 13.3% respectively. Over the previous week the market value of the iM 6-Stock Capital Strength Portfolio gained 2.58% at a time when SPY gained 0.46%. A starting capital of $100,000 at inception on 10/28/2016 would have grown to $253,845 which includes $4,093 cash and excludes $4,109 spent on fees and slippage. |
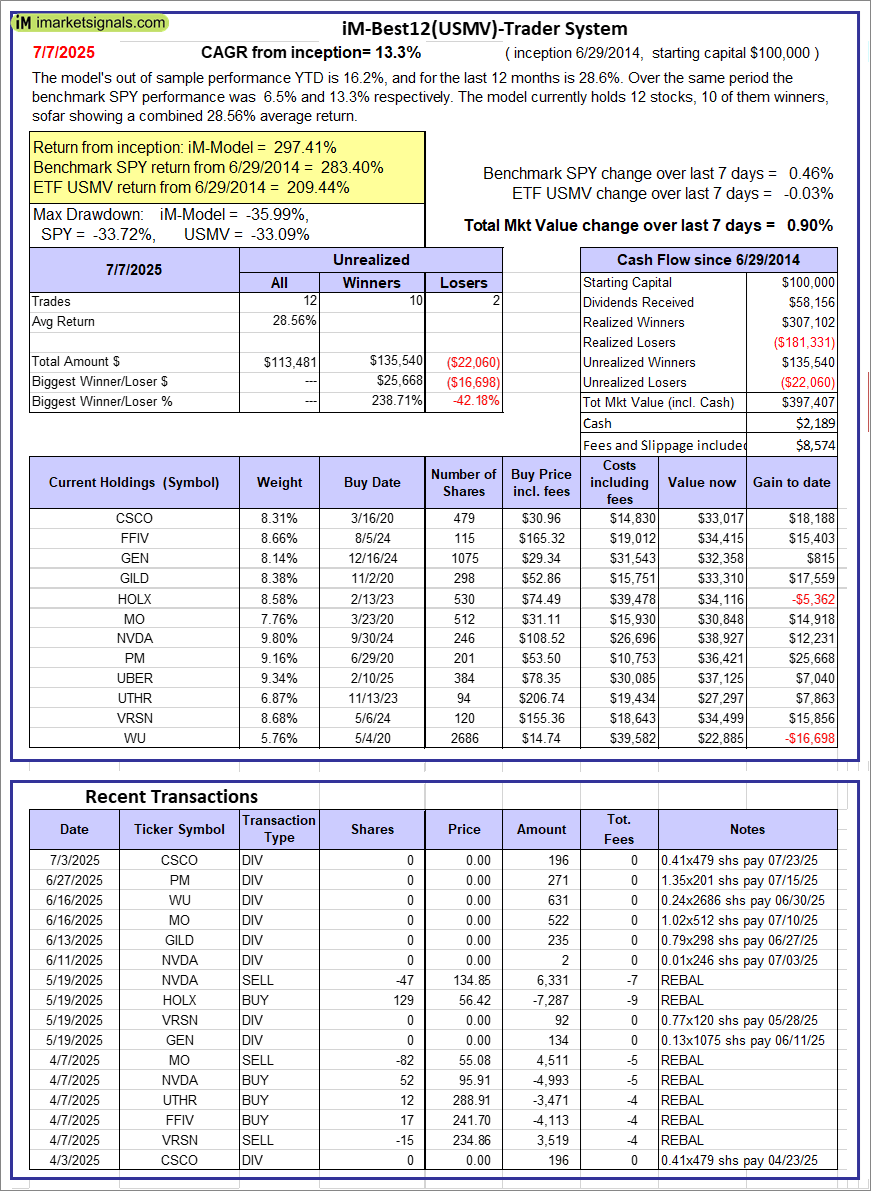 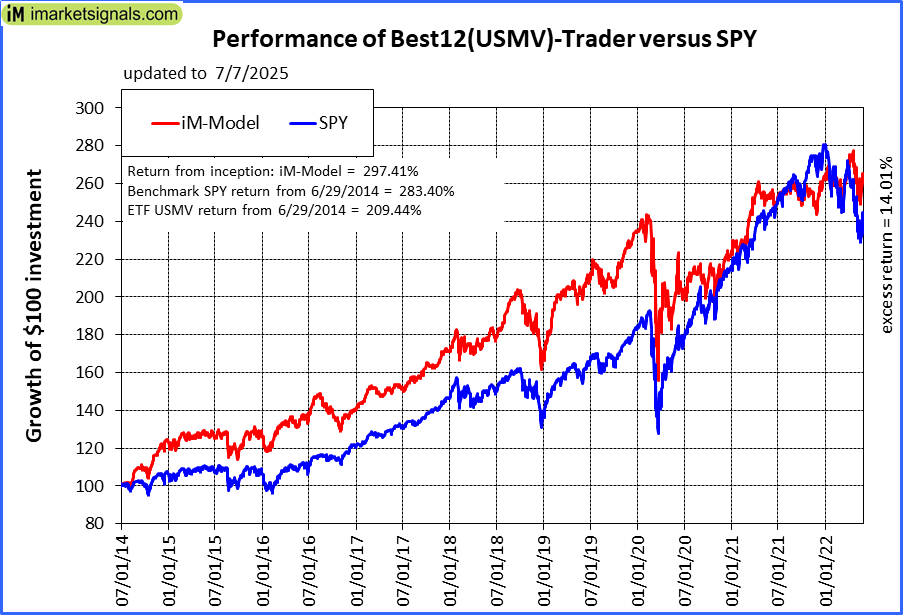 |
iM-Best12(USMV)-Trader: The model’s out of sample performance YTD is 16.2%, and for the last 12 months is 28.6%. Over the same period the benchmark SPY performance was 6.5% and 13.3% respectively. Since inception, on 6/30/2014, the model gained 297.41% while the benchmark SPY gained 283.40% and the ETF USMV gained 209.44% over the same period. Over the previous week the market value of iM-Best12(USMV)-Trader gained 0.90% at a time when SPY gained 0.46%. A starting capital of $100,000 at inception on 6/30/2014 would have grown to $397,407 which includes $2,189 cash and excludes $8,574 spent on fees and slippage. |
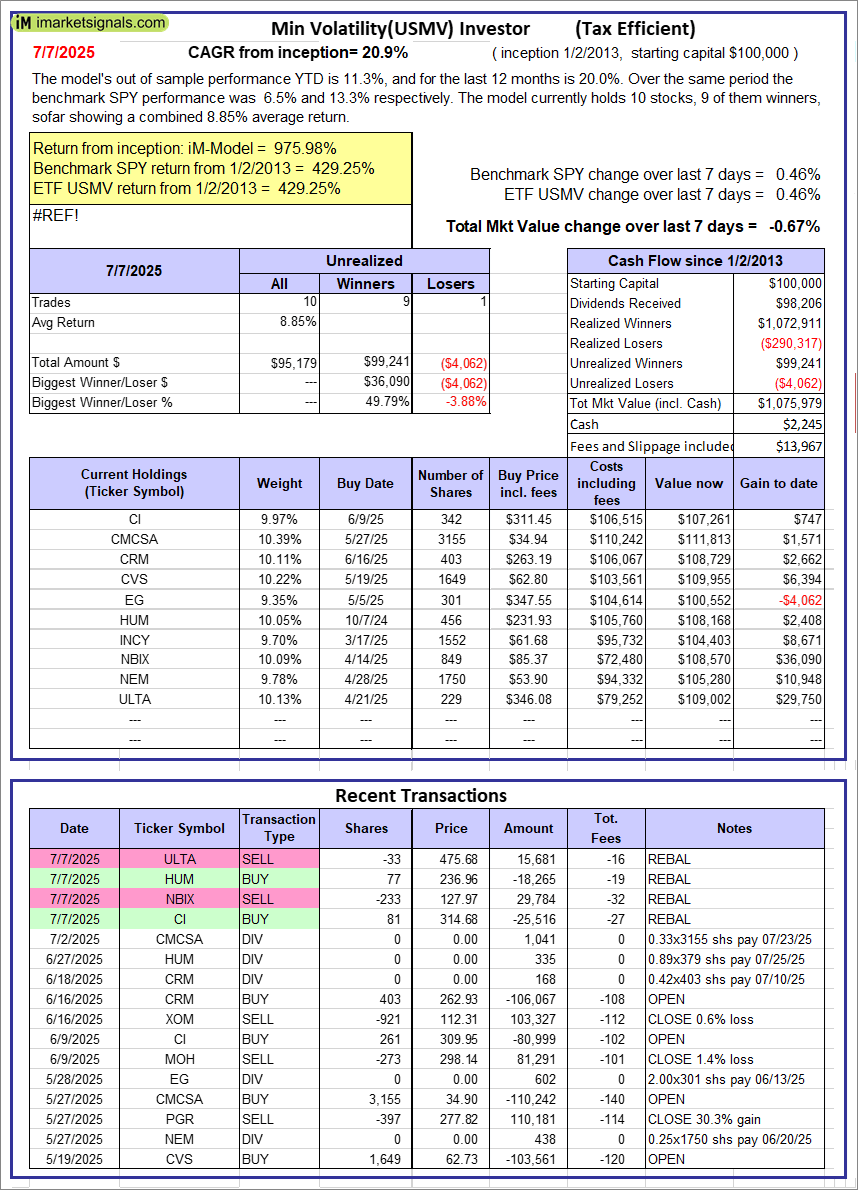 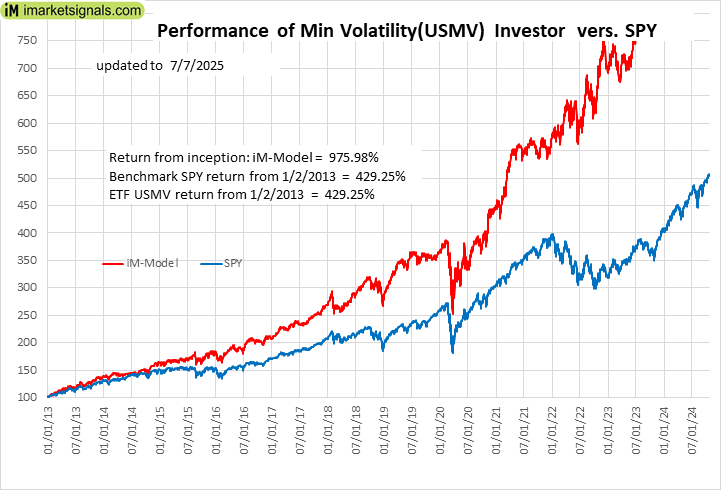 |
iM-Min Volatility(USMV) Investor (Tax Efficient): The model’s out of sample performance YTD is 11.3%, and for the last 12 months is 20.0%. Over the same period the benchmark SPY performance was 6.5% and 13.3% respectively. Since inception, on 1/3/2013, the model gained 975.98% while the benchmark SPY gained 429.25% and the ETF USMV gained 429.25% over the same period. Over the previous week the market value of iM-Best12(USMV)Q1 gained -0.67% at a time when SPY gained 0.46%. A starting capital of $100,000 at inception on 1/3/2013 would have grown to $1,075,979 which includes $2,245 cash and excludes $13,967 spent on fees and slippage. |
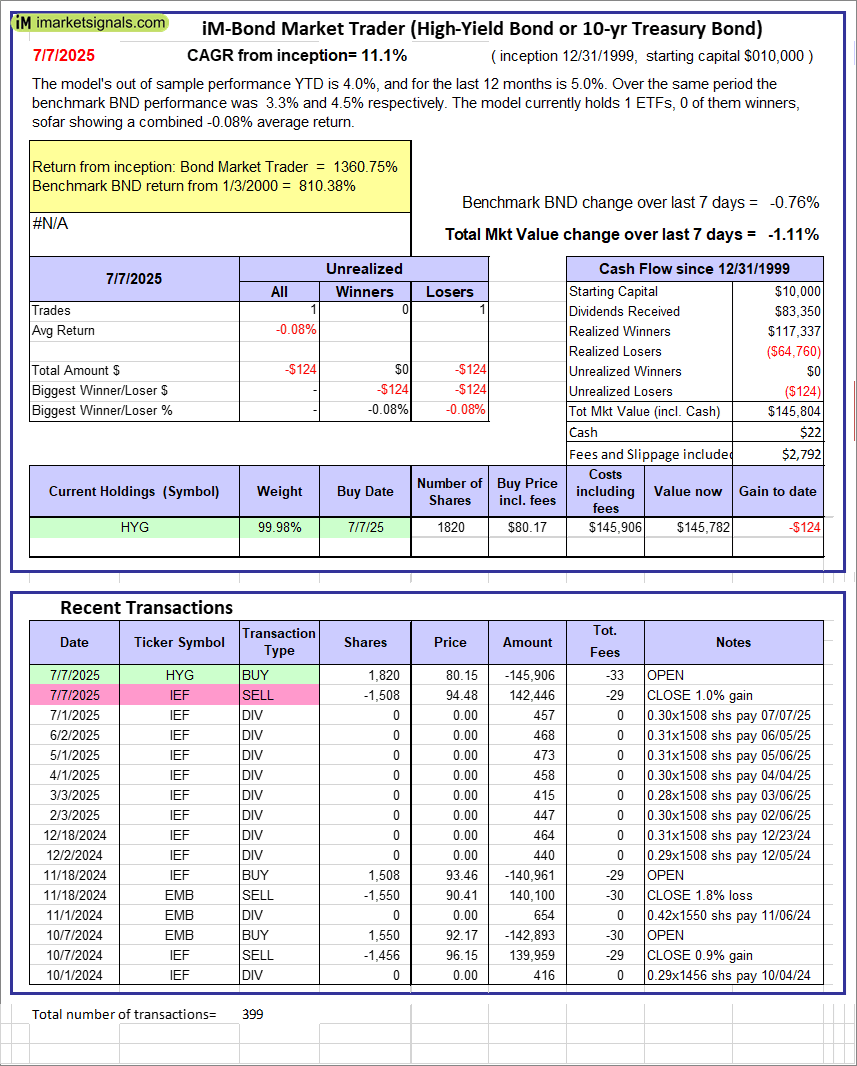 |
iM-Bond Market Trader (High-Yield Bond or 10-yr Treasury Bond): The model’s out of sample performance YTD is 4.0%, and for the last 12 months is 5.0%. Over the same period the benchmark BND performance was 3.3% and 4.5% respectively. Over the previous week the market value of the iM-Bond Market Trader (High-Yield Bond or 10-yr Treasury Bond) gained -1.11% at a time when BND gained -0.76%. A starting capital of $10,000 at inception on 1/3/2000 would have grown to $145,804 which includes $22 cash and excludes $2,792 spent on fees and slippage. |
|
|
iM-ModSum/YieldCurve Timer: The model’s out of sample performance YTD is 13.9%, and for the last 12 months is 22.9%. Over the same period the benchmark SPY performance was 6.5% and 13.3% respectively. Over the previous week the market value of iM-PortSum/YieldCurve Timer gained -1.08% at a time when SPY gained 0.46%. A starting capital of $100,000 at inception on 1/1/2016 would have grown to $365,435 which includes $1,716 cash and excludes $2,092 spent on fees and slippage. |
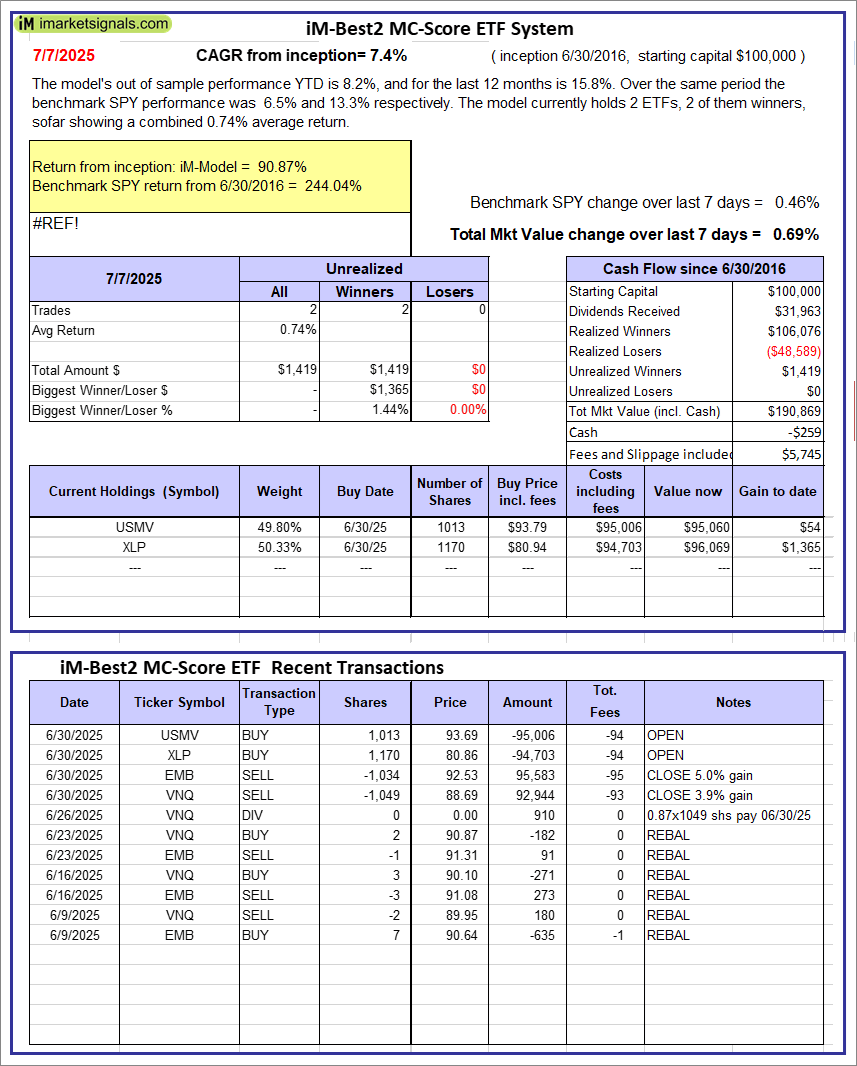 |
iM-Best2 MC-Score ETF System: The model’s out of sample performance YTD is 8.2%, and for the last 12 months is 15.8%. Over the same period the benchmark SPY performance was 6.5% and 13.3% respectively. Over the previous week the market value of the iM-Best2 MC-Score ETF System gained 0.69% at a time when SPY gained 0.46%. A starting capital of $100,000 at inception on 6/30/2016 would have grown to $190,869 which includes -$259 cash and excludes $5,745 spent on fees and slippage. |
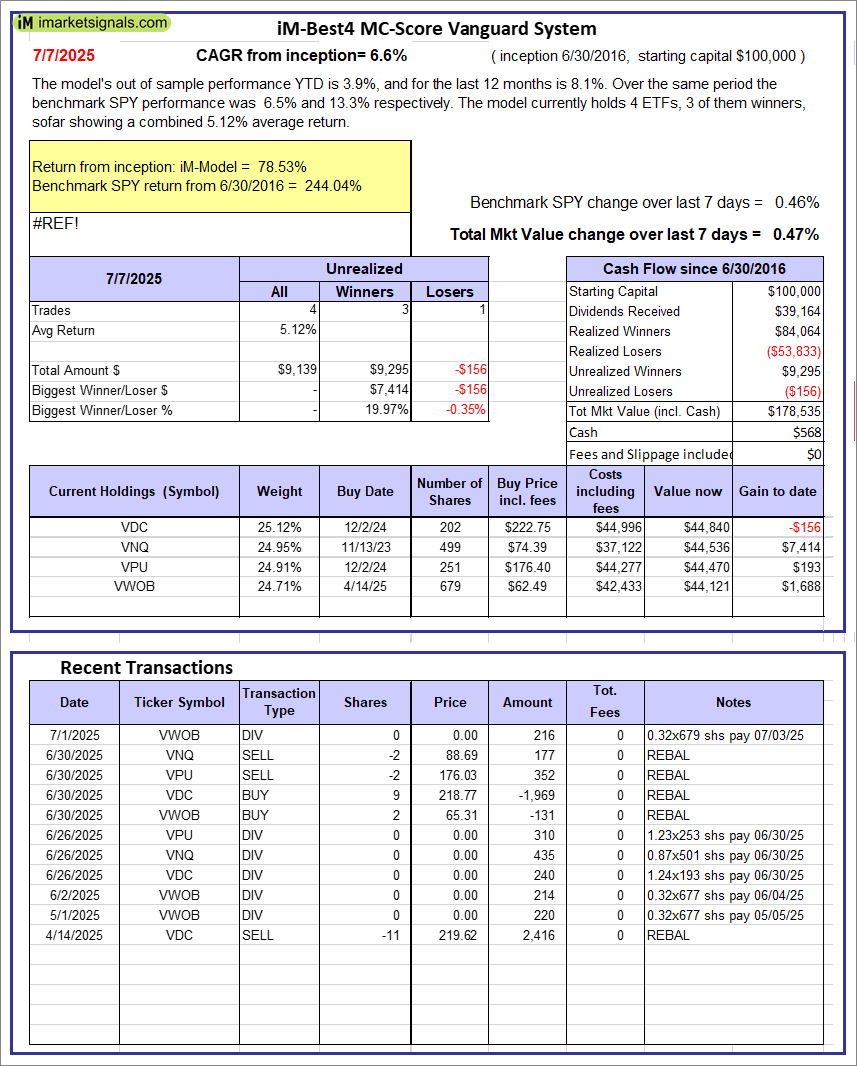 |
iM-Best4 MC-Score Vanguard System: The model’s out of sample performance YTD is 3.9%, and for the last 12 months is 8.1%. Over the same period the benchmark SPY performance was 6.5% and 13.3% respectively. Over the previous week the market value of the iM-Best4 MC-Score Vanguard System gained 0.47% at a time when SPY gained 0.46%. A starting capital of $100,000 at inception on 6/30/2016 would have grown to $178,535 which includes $568 cash and excludes $00 spent on fees and slippage. |
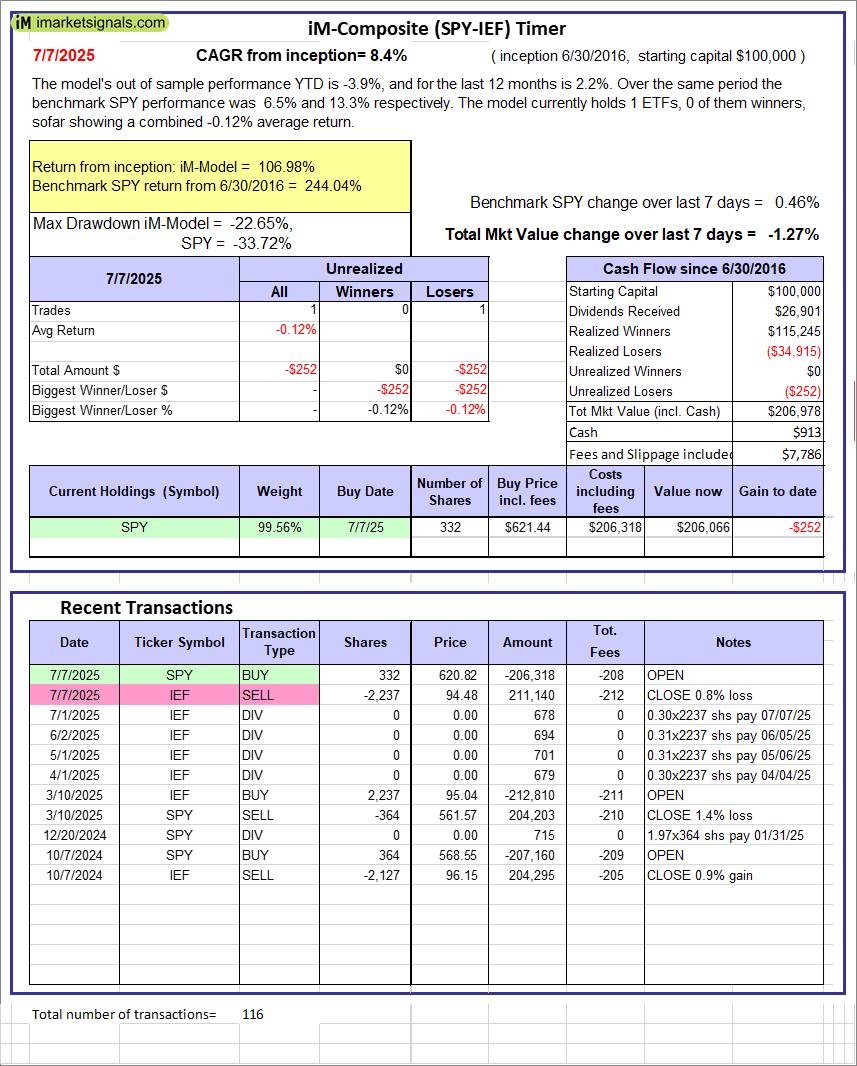 |
iM-Composite (SPY-IEF) Timer: The model’s out of sample performance YTD is -3.9%, and for the last 12 months is 2.2%. Over the same period the benchmark SPY performance was 6.5% and 13.3% respectively. Over the previous week the market value of the iM-Composite (SPY-IEF) Timer gained -1.27% at a time when SPY gained 0.46%. A starting capital of $100,000 at inception on 6/30/2016 would have grown to $206,978 which includes $913 cash and excludes $7,786 spent on fees and slippage. |
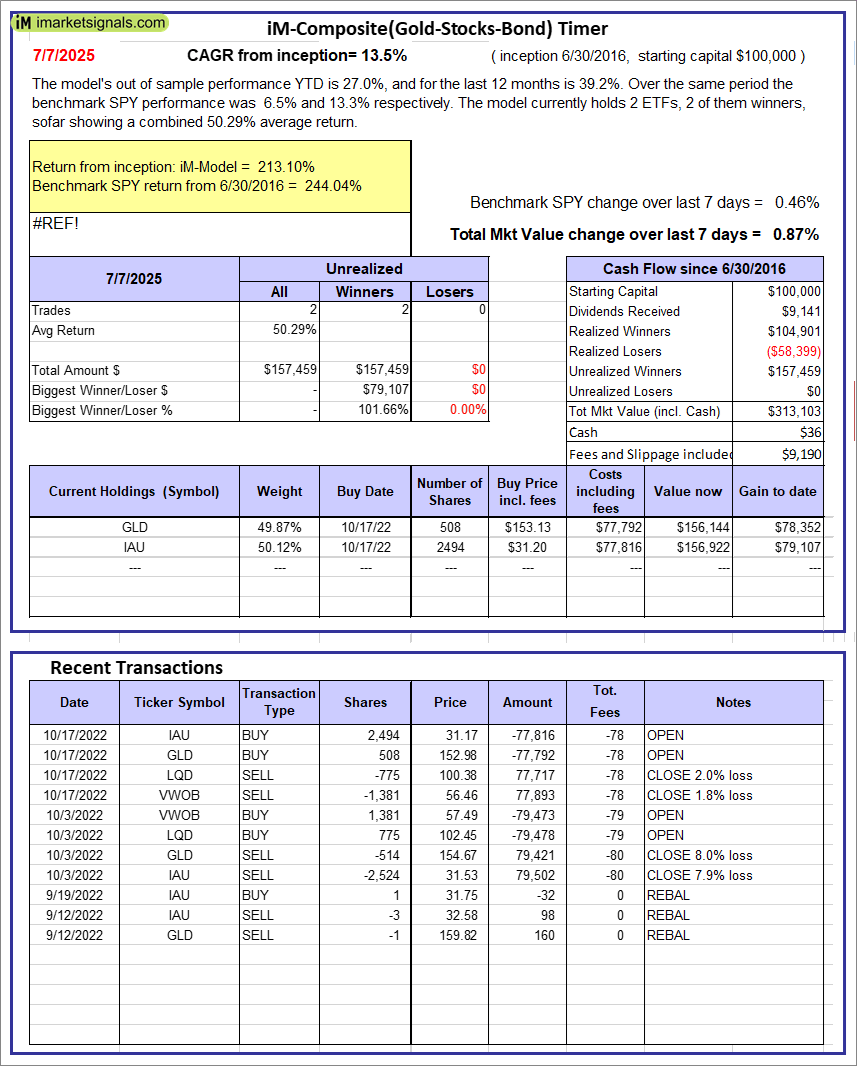 |
iM-Composite(Gold-Stocks-Bond) Timer: The model’s out of sample performance YTD is 27.0%, and for the last 12 months is 39.2%. Over the same period the benchmark SPY performance was 6.5% and 13.3% respectively. Over the previous week the market value of the iM-Composite(Gold-Stocks-Bond) Timer gained 0.87% at a time when SPY gained 0.46%. A starting capital of $100,000 at inception on 6/30/2016 would have grown to $313,103 which includes $36 cash and excludes $9,190 spent on fees and slippage. |
iM-Best Reports – 7/8/2025
Posted in pmp SPY-SH
Leave a Reply
You must be logged in to post a comment.