
  |
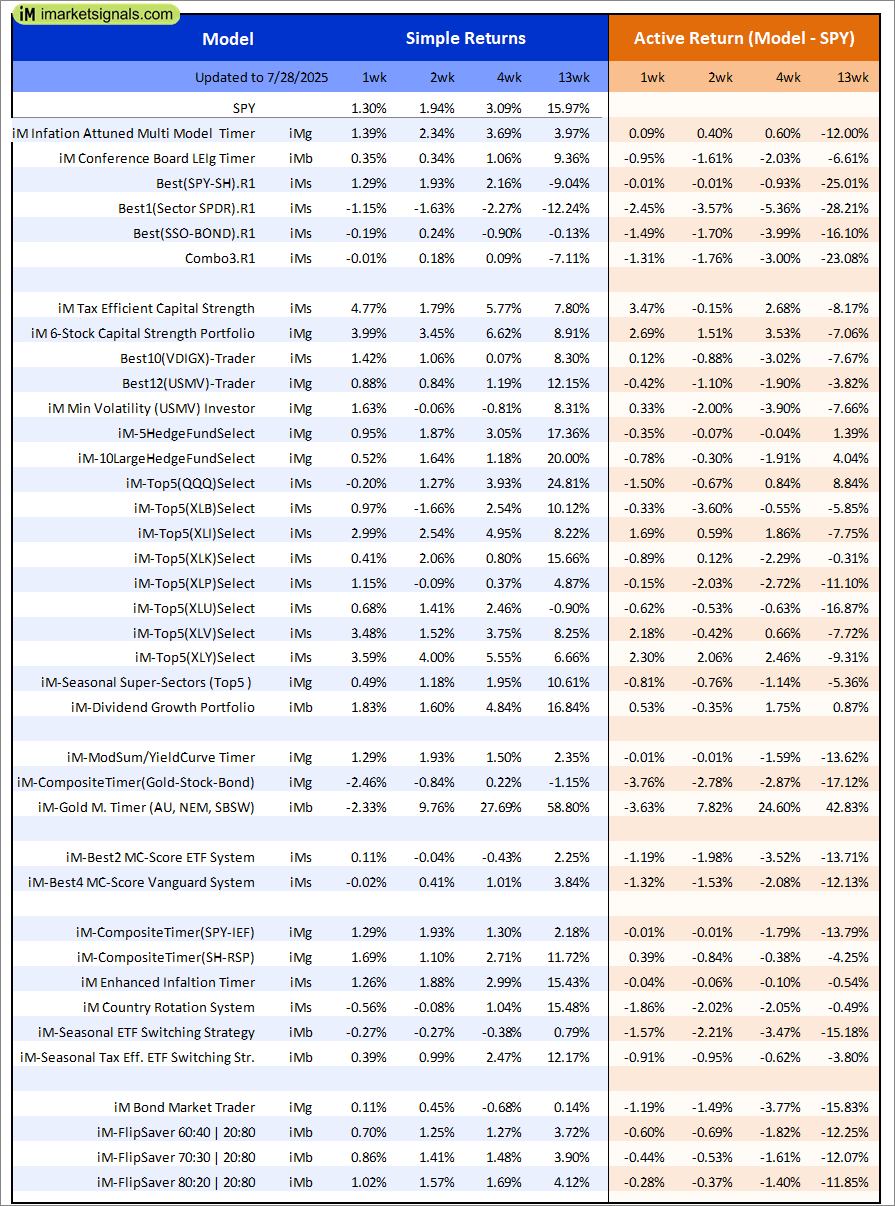
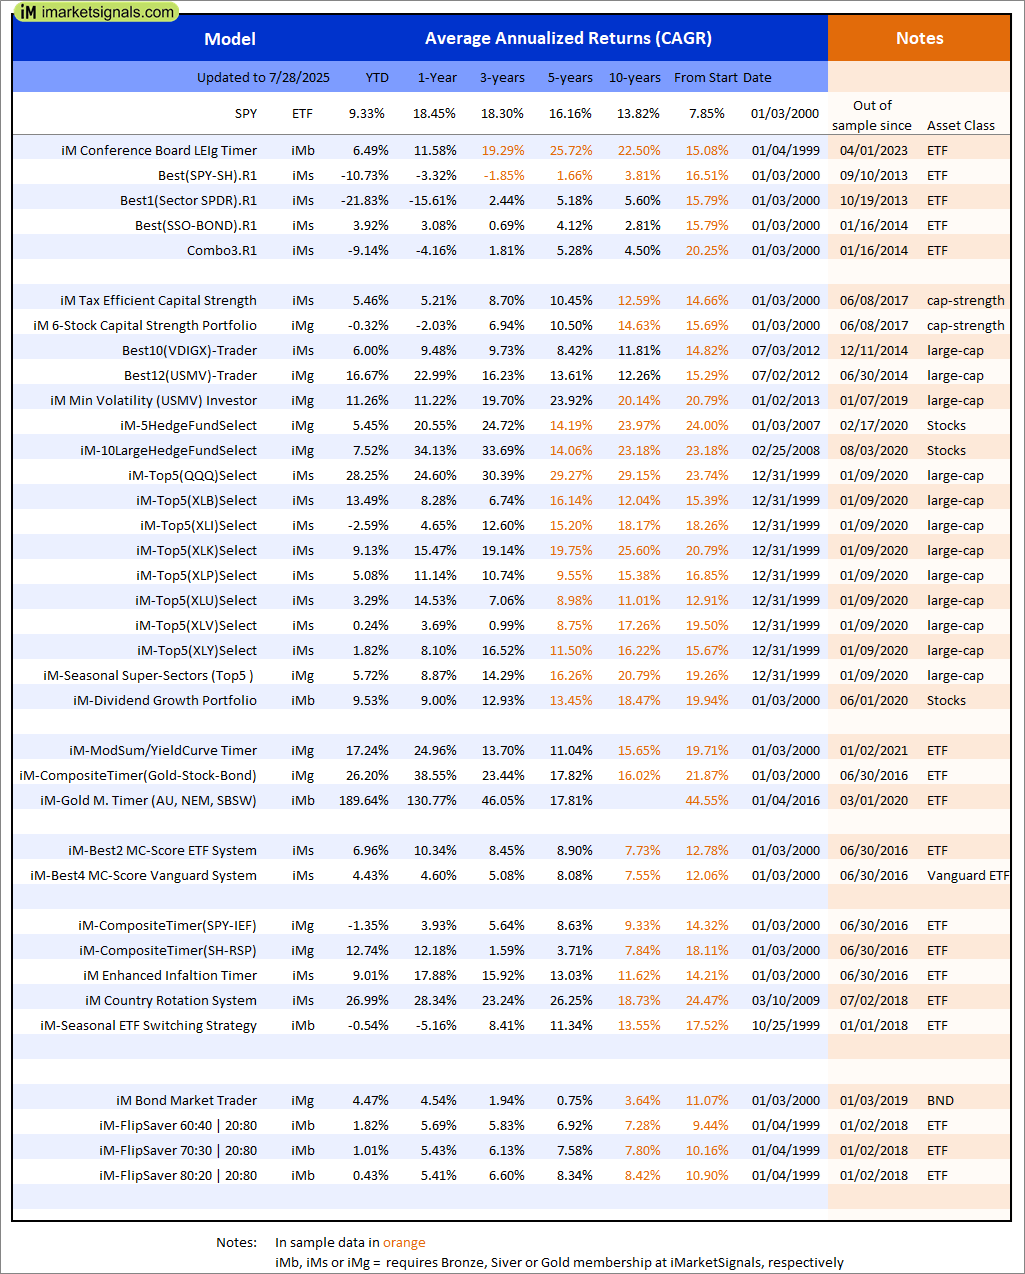
Out of sample performance summary of our models for the past 1, 2, 4 and 13 week periods. The active active return indicates how the models over- or underperformed the benchmark ETF SPY. Also the YTD, and the 1-, 3-, 5- and 10-year annualized returns are shown in the second table |
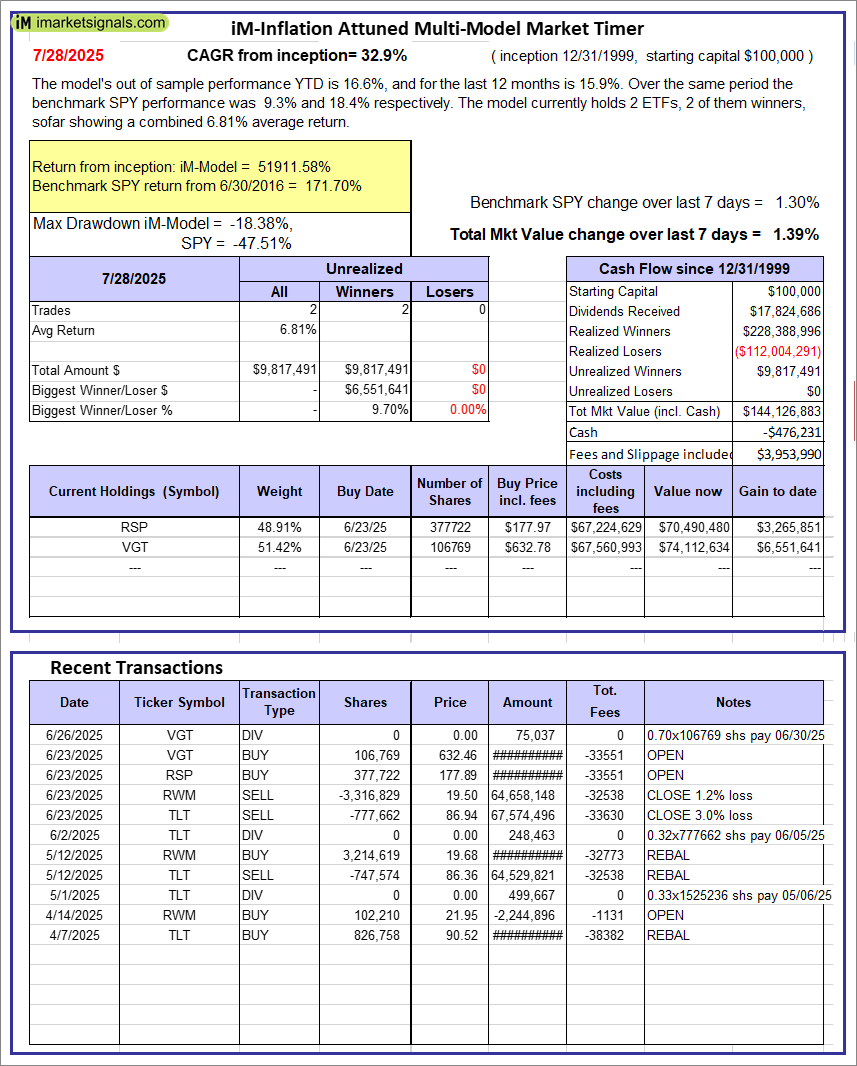 |
iM-Inflation Attuned Multi-Model Market Timer: The model’s out of sample performance YTD is 16.6%, and for the last 12 months is 15.9%. Over the same period the benchmark SPY performance was 9.3% and 18.4% respectively. Over the previous week the market value of the iM-Inflation Attuned Multi-Model Market Timer gained 1.39% at a time when SPY gained 1.30%. A starting capital of $100,000 at inception on 3/24/2017 would have grown to $144,126,883 which includes -$476,231 cash and excludes $3,953,990 spent on fees and slippage. |
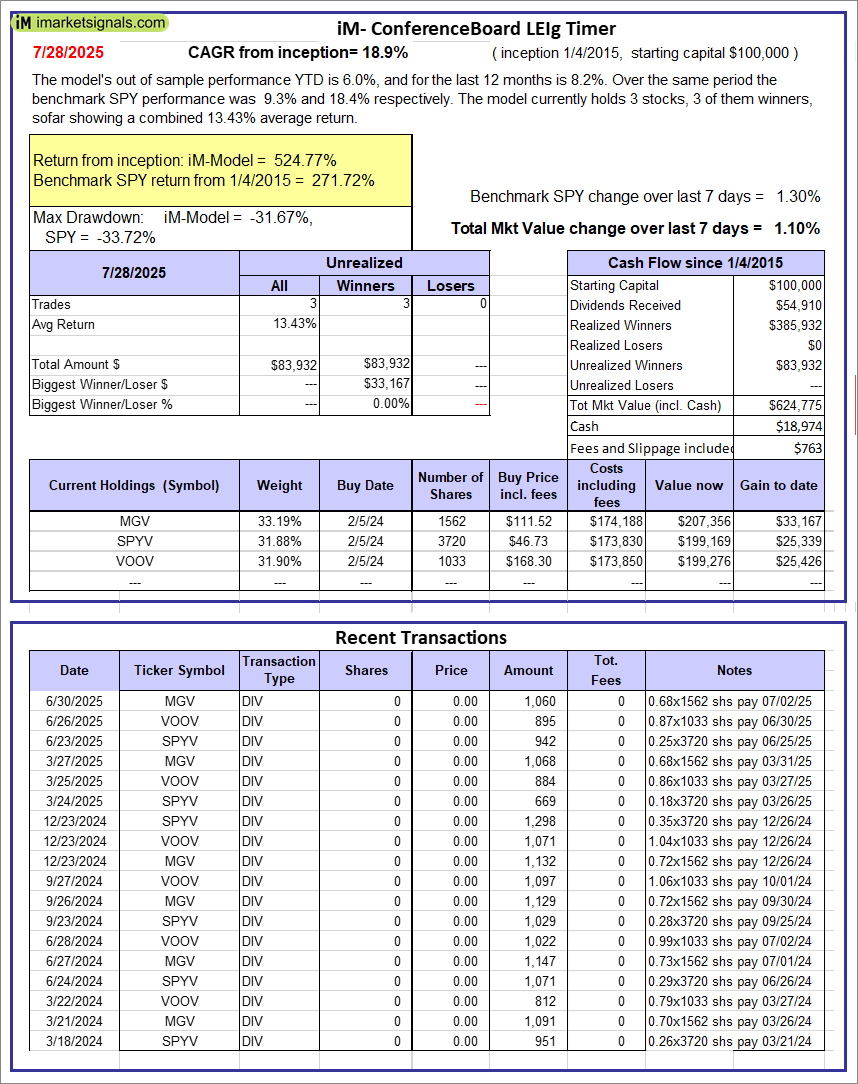 |
iM-Conference Board LEIg Timer: The model’s performance YTD is 14.3%, and for the last 12 months is 7.3%. Over the same period the benchmark SPY performance was 20.1% and 9.4% respectively. Over the previous week the market value of the iM-Conference Board LEIg Timer gained 1.10% at a time when SPY gained 1.30%. A starting capital of $100,000 at inception on 4/5/2017 would have grown to $624,775 which includes $18,974 cash and excludes $763 spent on fees and slippage. |
 |
iM-FlipSaver 60:40 | 20:80 – 2017: The model’s out of sample performance YTD is 1.6%, and for the last 12 months is 5.4%. Over the same period the benchmark E60B40 performance was 7.4% and 13.0% respectively. Over the previous week the market value of iM-FlipSaver 80:20 | 20:80 gained 0.70% at a time when SPY gained 0.75%. A starting capital of $100,000 at inception on 7/16/2015 would have grown to $174,064 which includes $656 cash and excludes $4,895 spent on fees and slippage. |
 |
iM-FlipSaver 70:30 | 20:80 – 2017: The model’s out of sample performance YTD is 1.0%, and for the last 12 months is 5.4%. Over the same period the benchmark E60B40 performance was 7.4% and 13.0% respectively. Over the previous week the market value of iM-FlipSaver 70:30 | 20:80 gained 0.86% at a time when SPY gained 0.75%. A starting capital of $100,000 at inception on 7/15/2015 would have grown to $181,341 which includes $805 cash and excludes $5,139 spent on fees and slippage. |
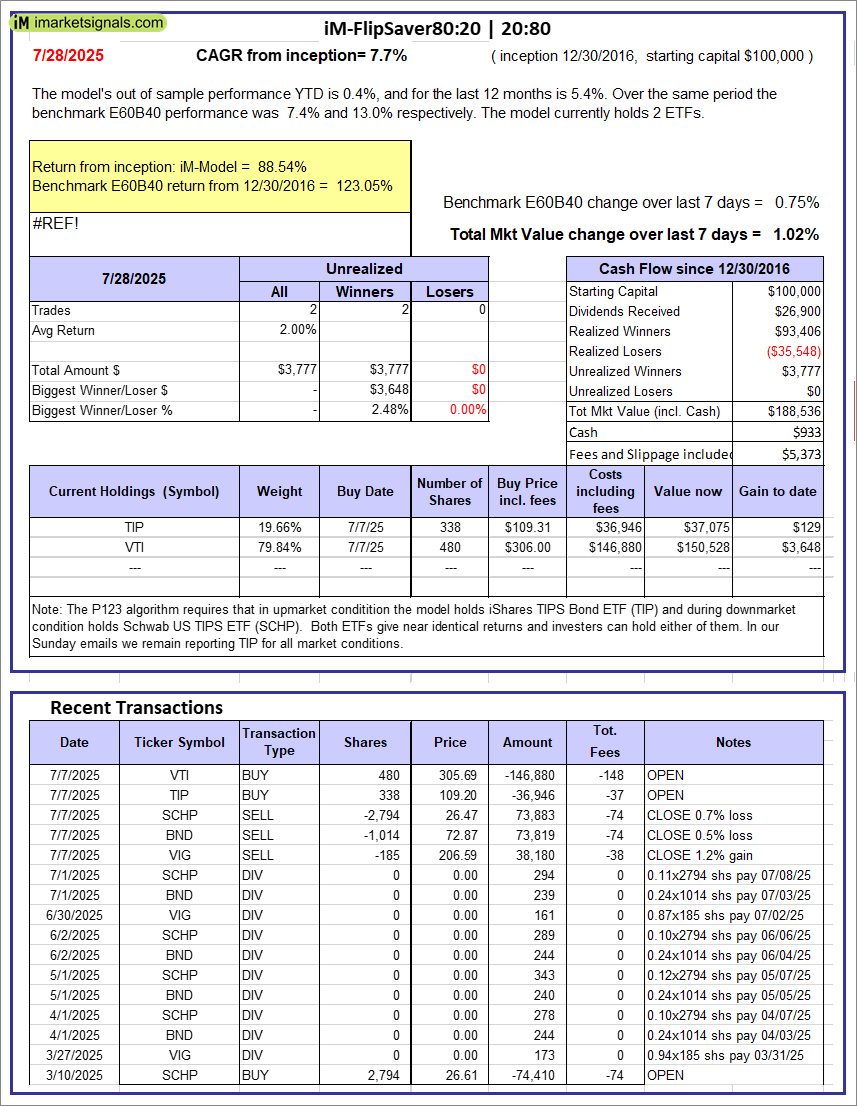 |
iM-FlipSaver 80:20 | 20:80 – 2017: The model’s out of sample performance YTD is 0.4%, and for the last 12 months is 5.4%. Over the same period the benchmark E60B40 performance was 7.4% and 13.0% respectively. Over the previous week the market value of iM-FlipSaver 80:20 | 20:80 gained 1.02% at a time when SPY gained 0.75%. A starting capital of $100,000 at inception on 1/2/2017 would have grown to $188,536 which includes $933 cash and excludes $5,373 spent on fees and slippage. |
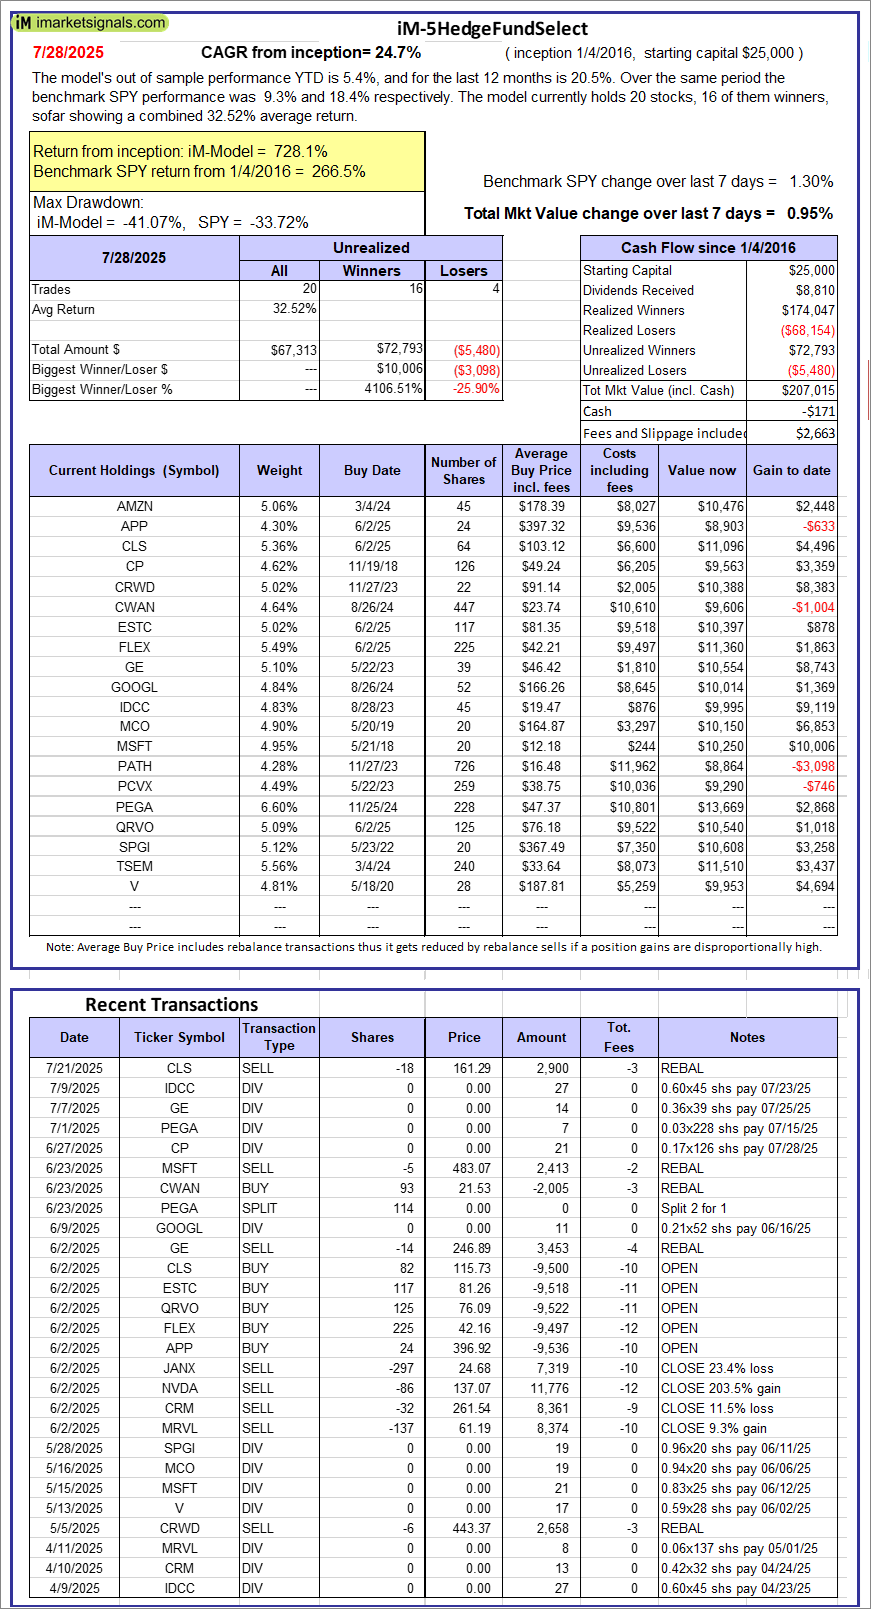 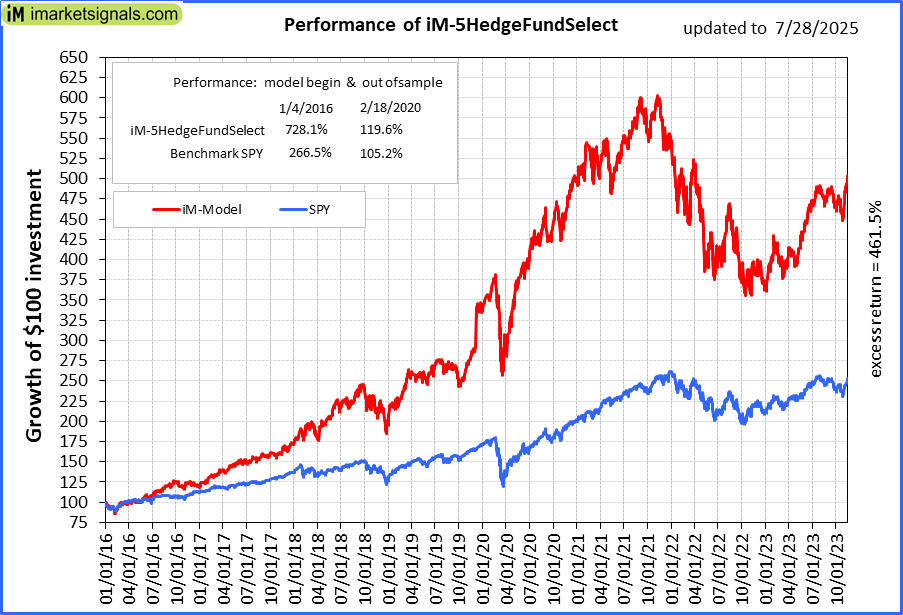 |
iM-5HedgeFundSelect: Since inception, on 1/5/2016, the model gained 728.06% while the benchmark SPY gained 266.52% over the same period. Over the previous week the market value of iM-5HedgeFundSelect gained 0.95% at a time when SPY gained 1.30%. A starting capital of $25,000 at inception on 1/5/2016 would have grown to $207,015 which includes -$171 cash and excludes $2,663 spent on fees and slippage. |
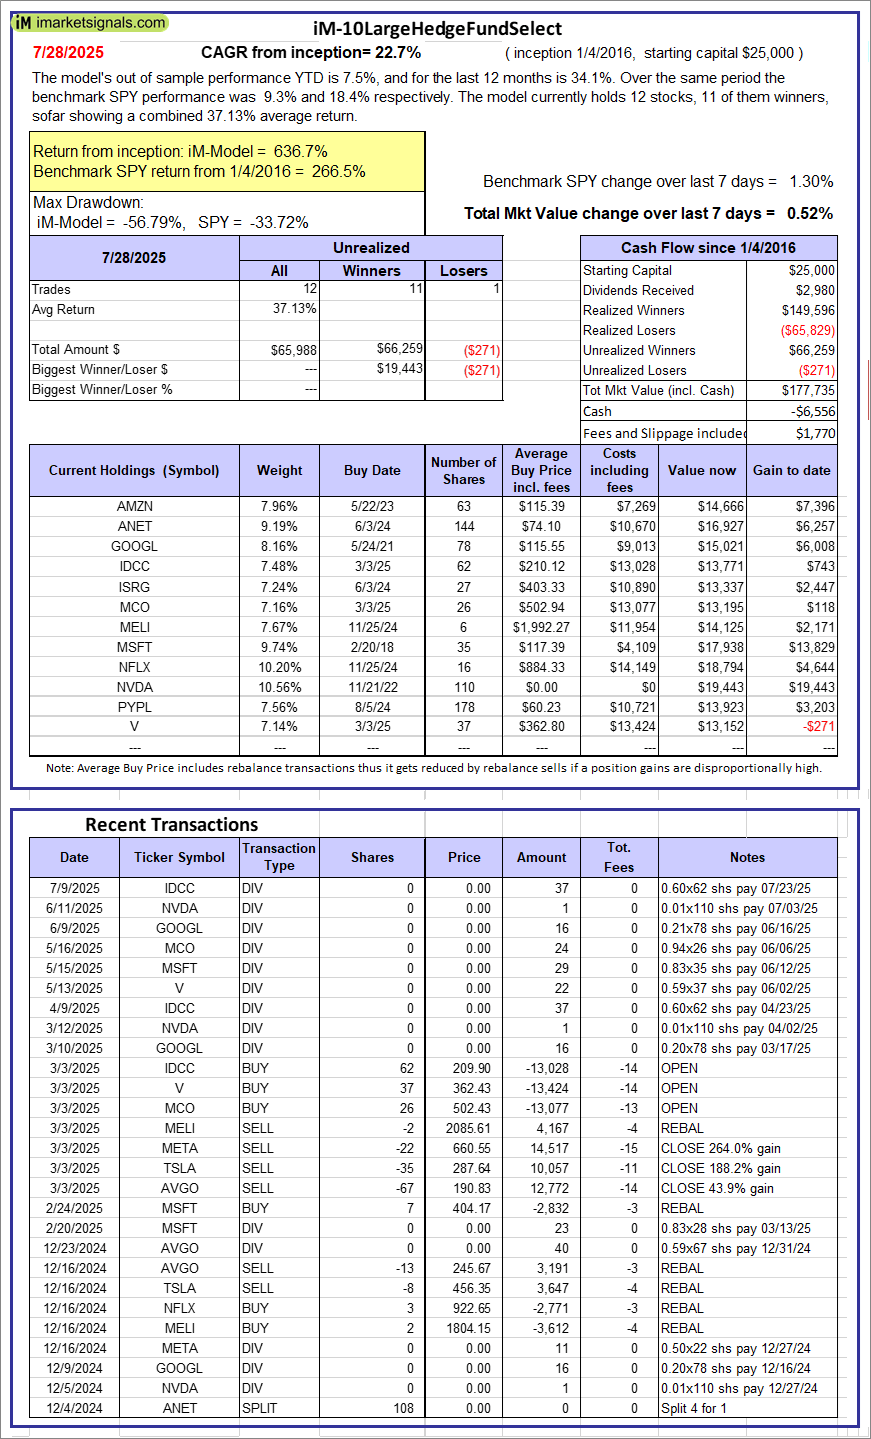 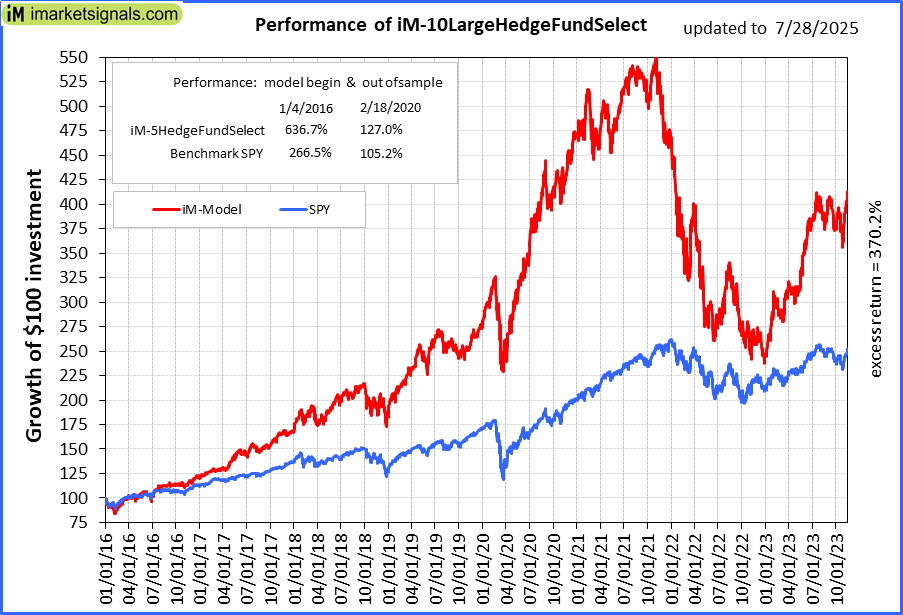 |
iM-10LargeHedgeFundSelect: Since inception, on 1/5/2016, the model gained 636.73% while the benchmark SPY gained 266.52% over the same period. Over the previous week the market value of iM-10LargeHedgeFundSelect gained 0.52% at a time when SPY gained 1.30%. A starting capital of $25,000 at inception on 1/5/2016 would have grown to $177,735 which includes -$6,556 cash and excludes $1,770 spent on fees and slippage. |
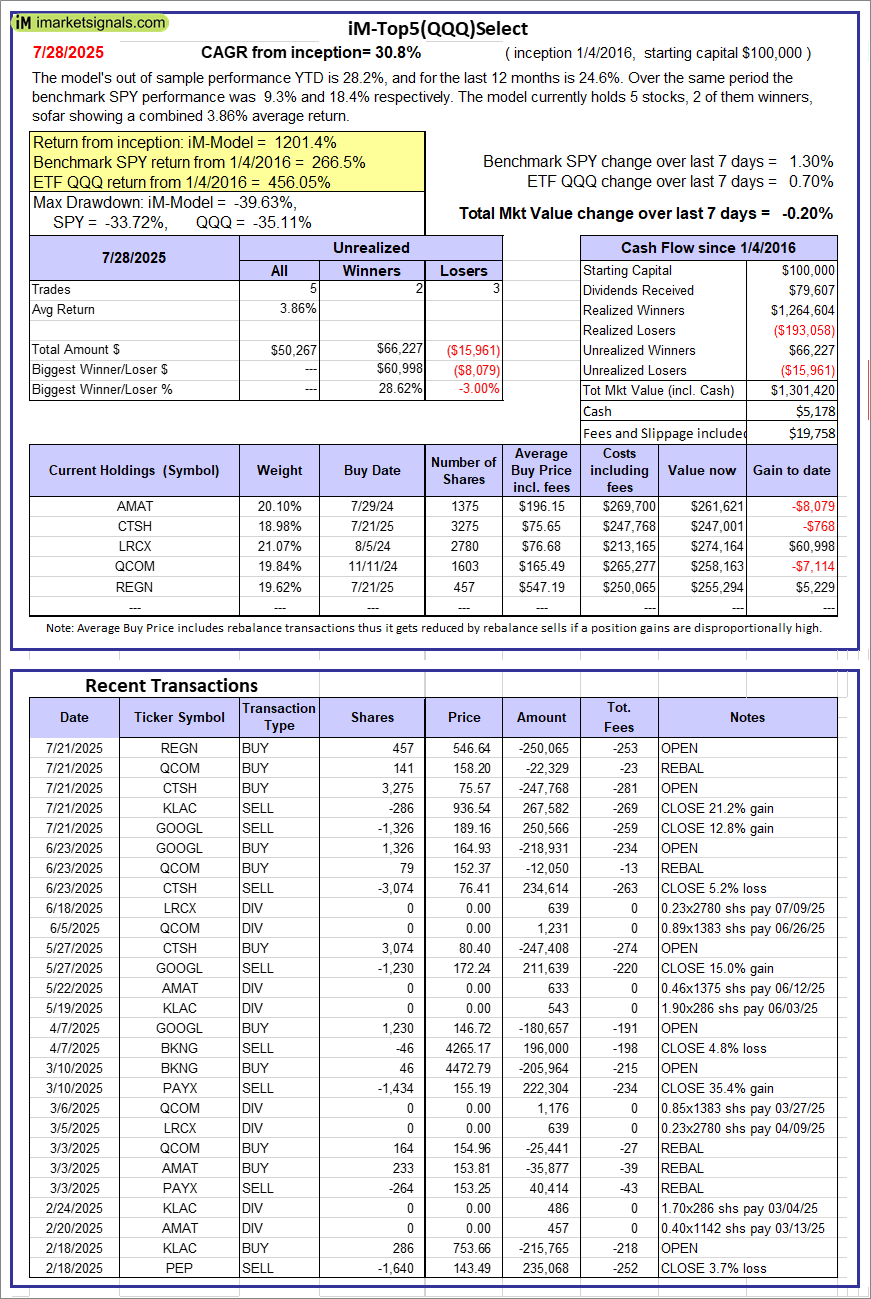 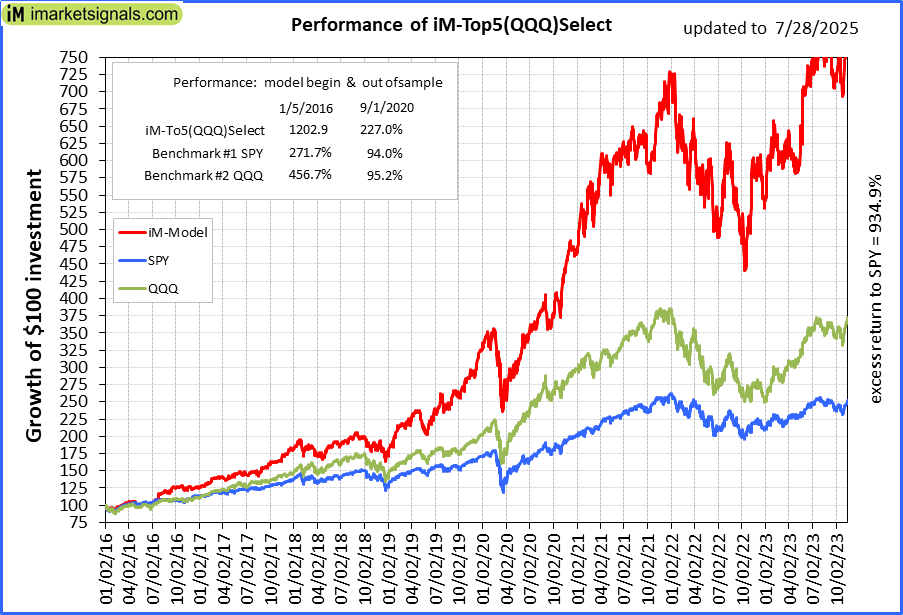 |
iM-Top5(QQQ)Select: Since inception, on 1/5/2016, the model gained 1201.42% while the benchmark SPY gained 266.52% over the same period. Over the previous week the market value of iM-Top5(QQQ)Select gained -0.20% at a time when SPY gained 1.30%. A starting capital of $100,000 at inception on 1/5/2016 would have grown to $1,301,420 which includes $5,178 cash and excludes $19,758 spent on fees and slippage. |
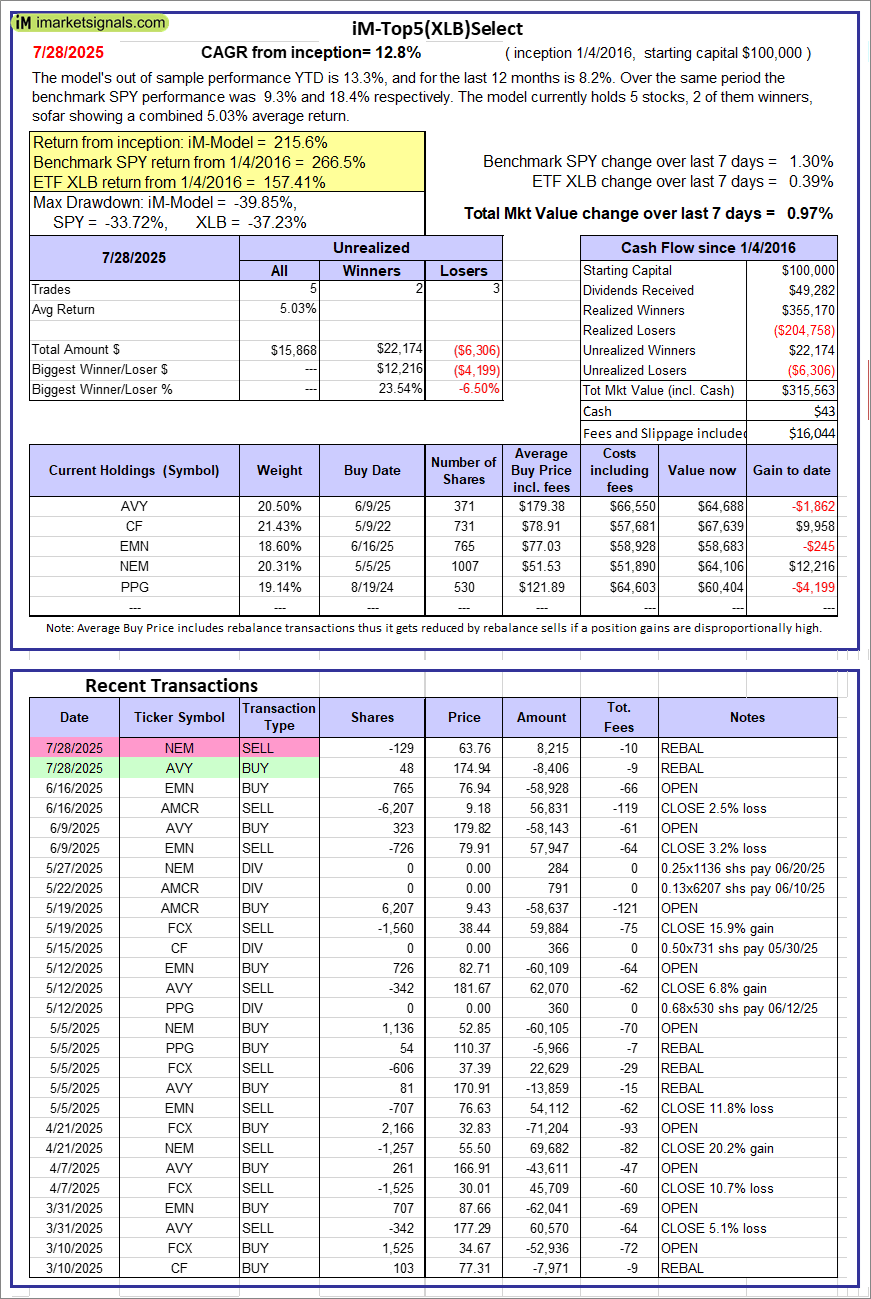 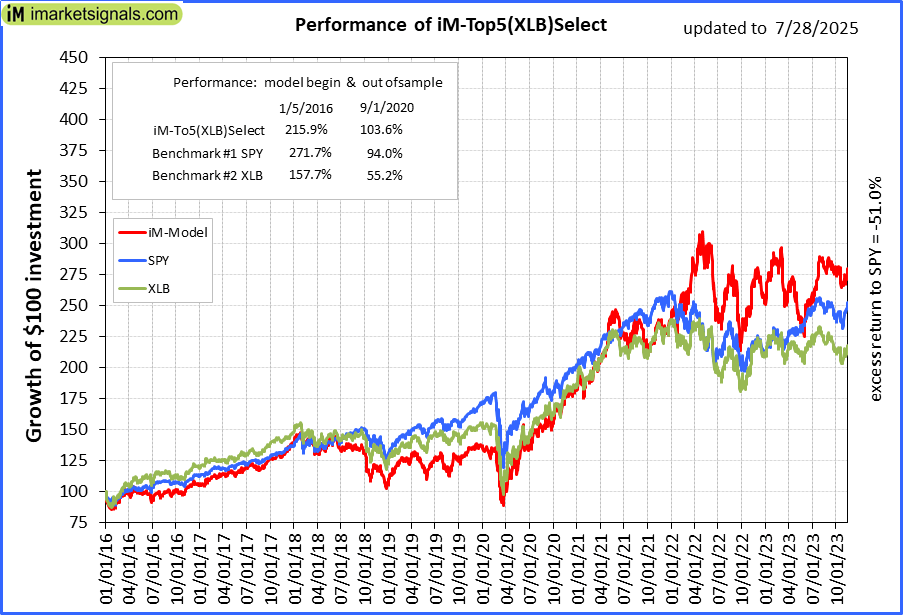 |
iM-Top5(XLB)Select: Since inception, on 1/5/2016, the model gained 215.56% while the benchmark SPY gained 266.52% over the same period. Over the previous week the market value of iM-Top5(XLB)Select gained 0.97% at a time when SPY gained 1.30%. A starting capital of $100,000 at inception on 1/5/2016 would have grown to $315,563 which includes $43 cash and excludes $16,044 spent on fees and slippage. |
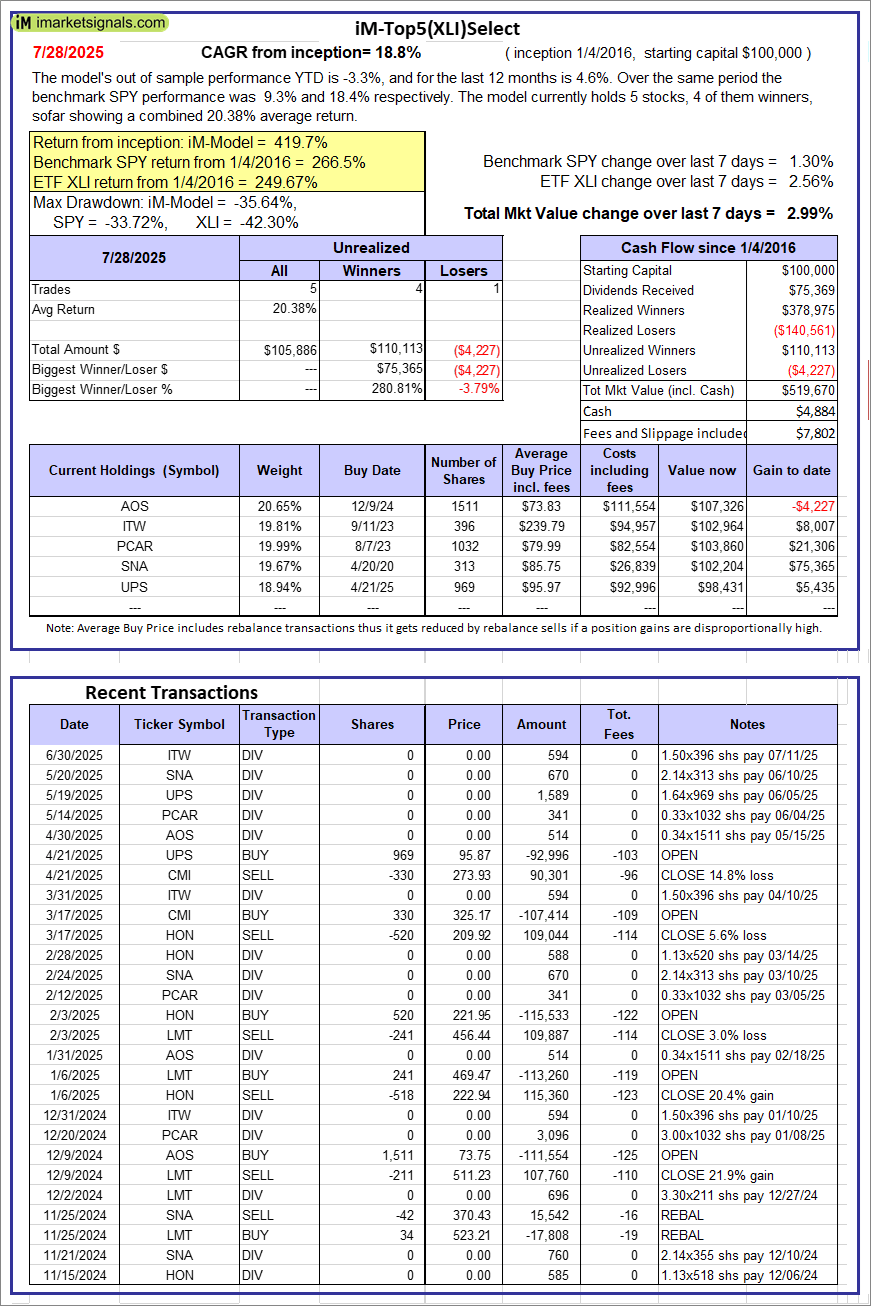  |
iM-Top5(XLI)Select: Since inception, on 1/5/2016, the model gained 419.67% while the benchmark SPY gained 266.52% over the same period. Over the previous week the market value of iM-Top5(XLI)Select gained 2.99% at a time when SPY gained 1.30%. A starting capital of $100,000 at inception on 1/5/2016 would have grown to $519,670 which includes $4,884 cash and excludes $7,802 spent on fees and slippage. |
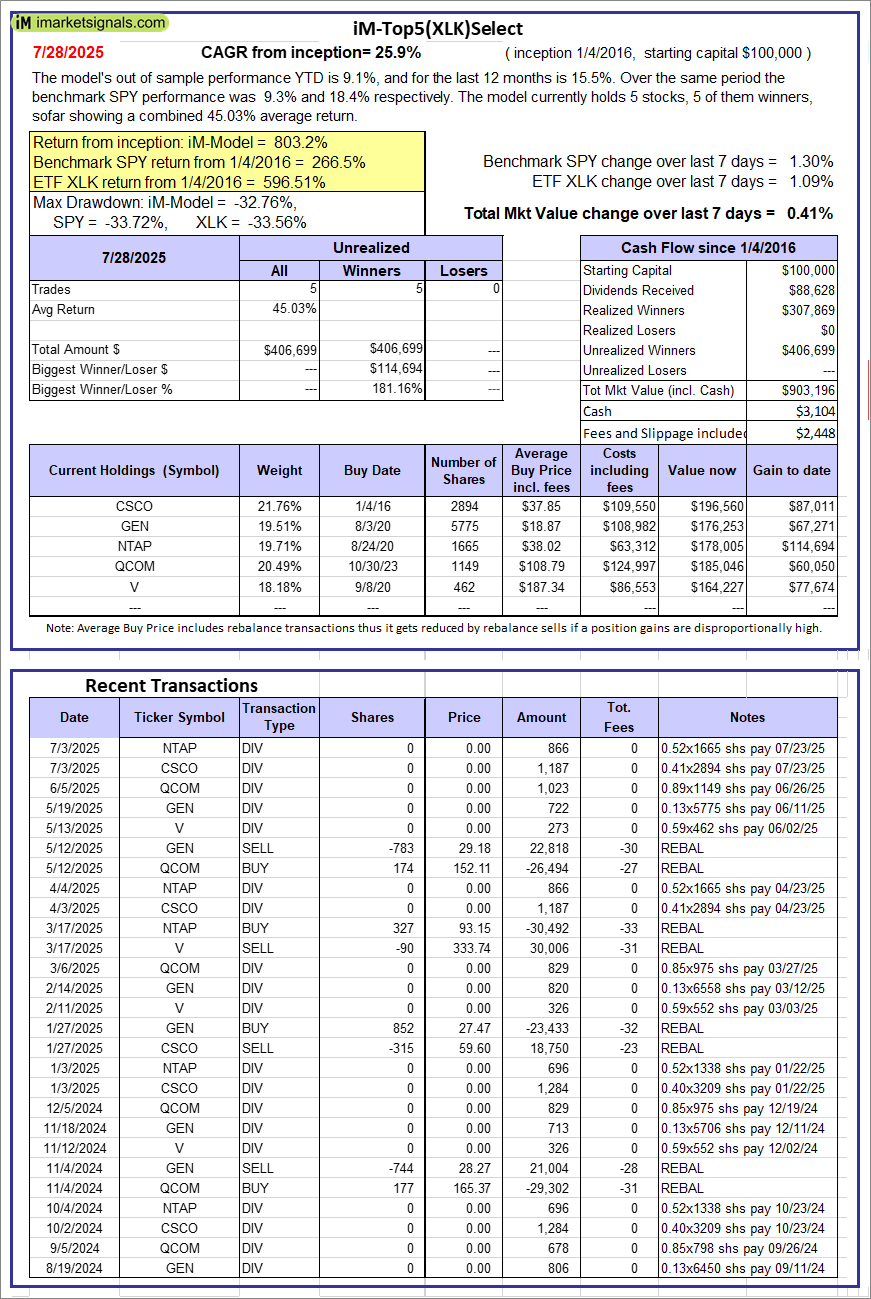 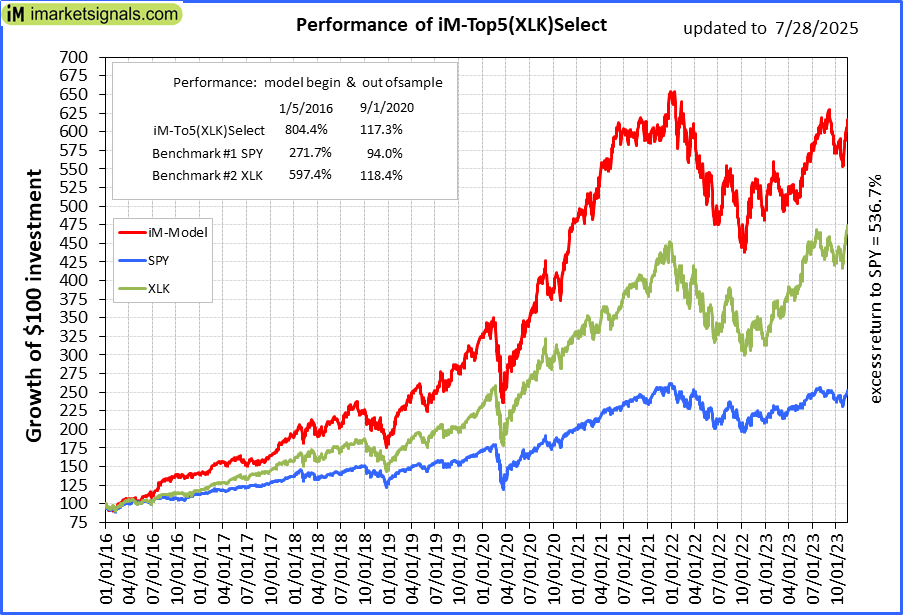 |
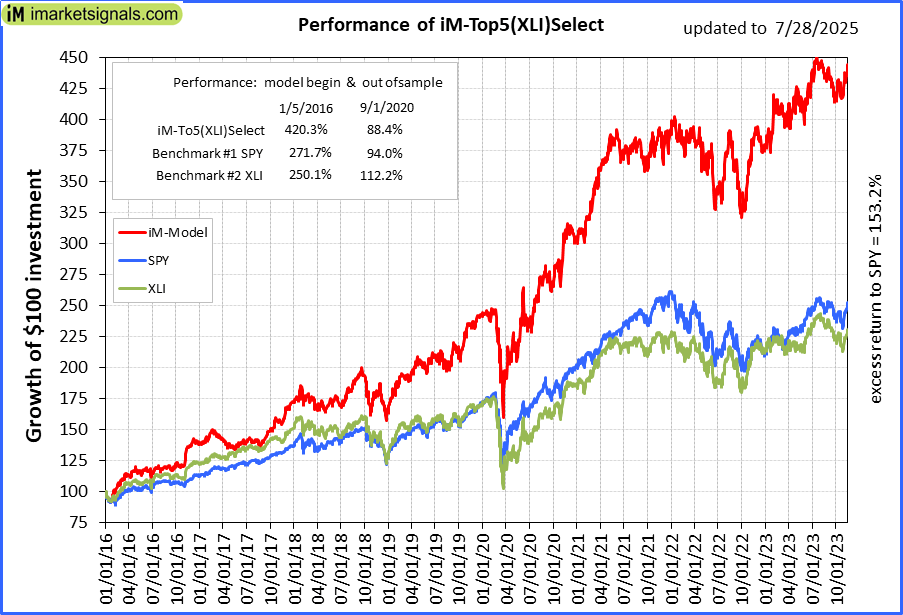
iM-Top5(XLK)Select: Since inception, on 1/5/2016, the model gained 803.20% while the benchmark SPY gained 266.52% over the same period. Over the previous week the market value of iM-Top5(XLK)Select gained 0.41% at a time when SPY gained 1.30%. A starting capital of $100,000 at inception on 1/5/2016 would have grown to $903,196 which includes $3,104 cash and excludes $2,448 spent on fees and slippage. |
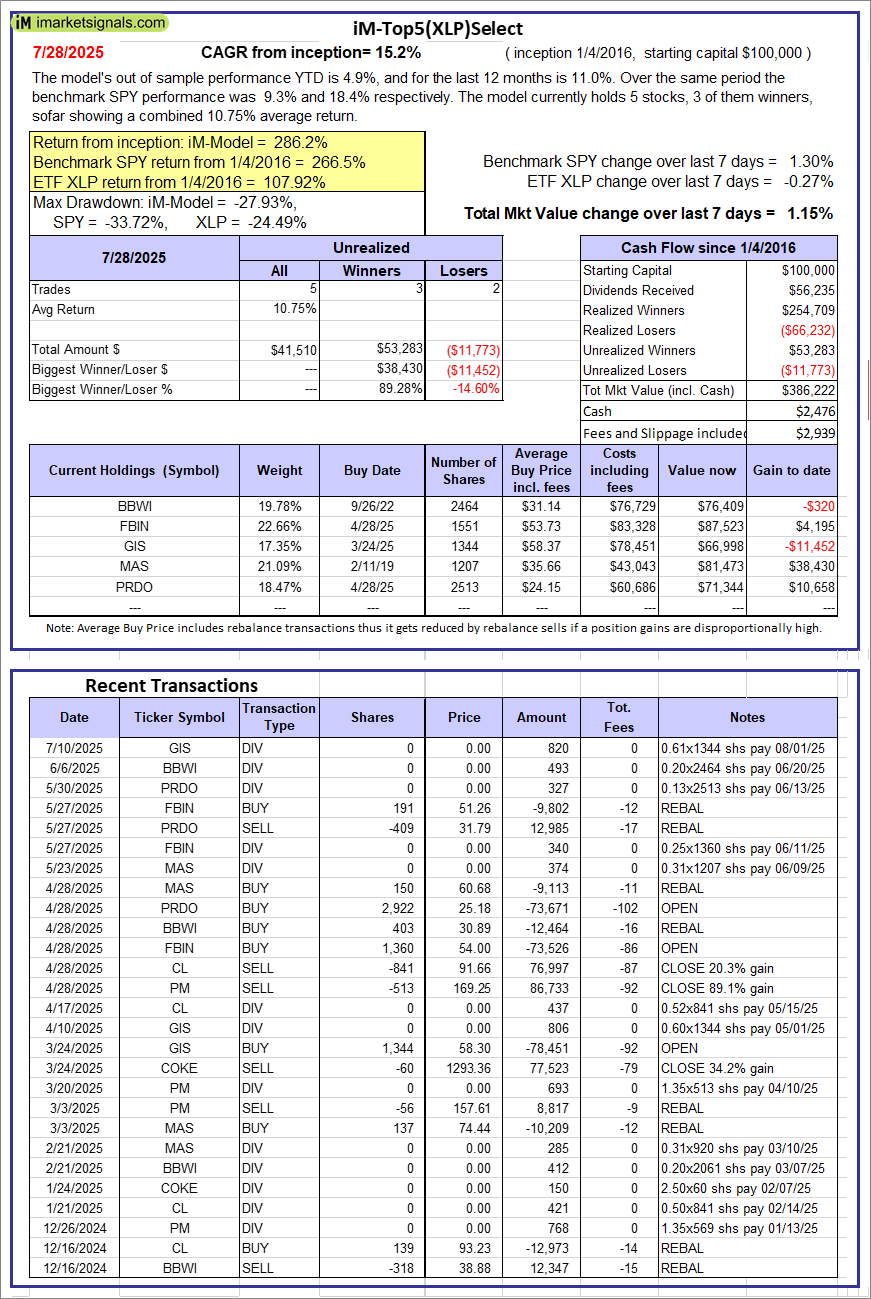 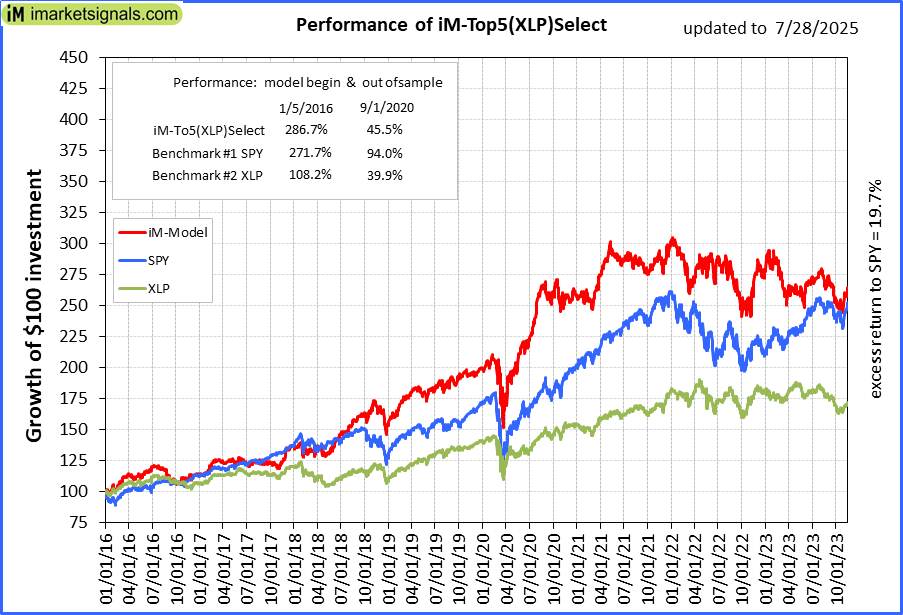 |
iM-Top5(XLP)Select: Since inception, on 1/5/2016, the model gained 286.22% while the benchmark SPY gained 266.52% over the same period. Over the previous week the market value of iM-Top5(XLP)Select gained 1.15% at a time when SPY gained 1.30%. A starting capital of $100,000 at inception on 1/5/2016 would have grown to $386,222 which includes $2,476 cash and excludes $2,939 spent on fees and slippage. |
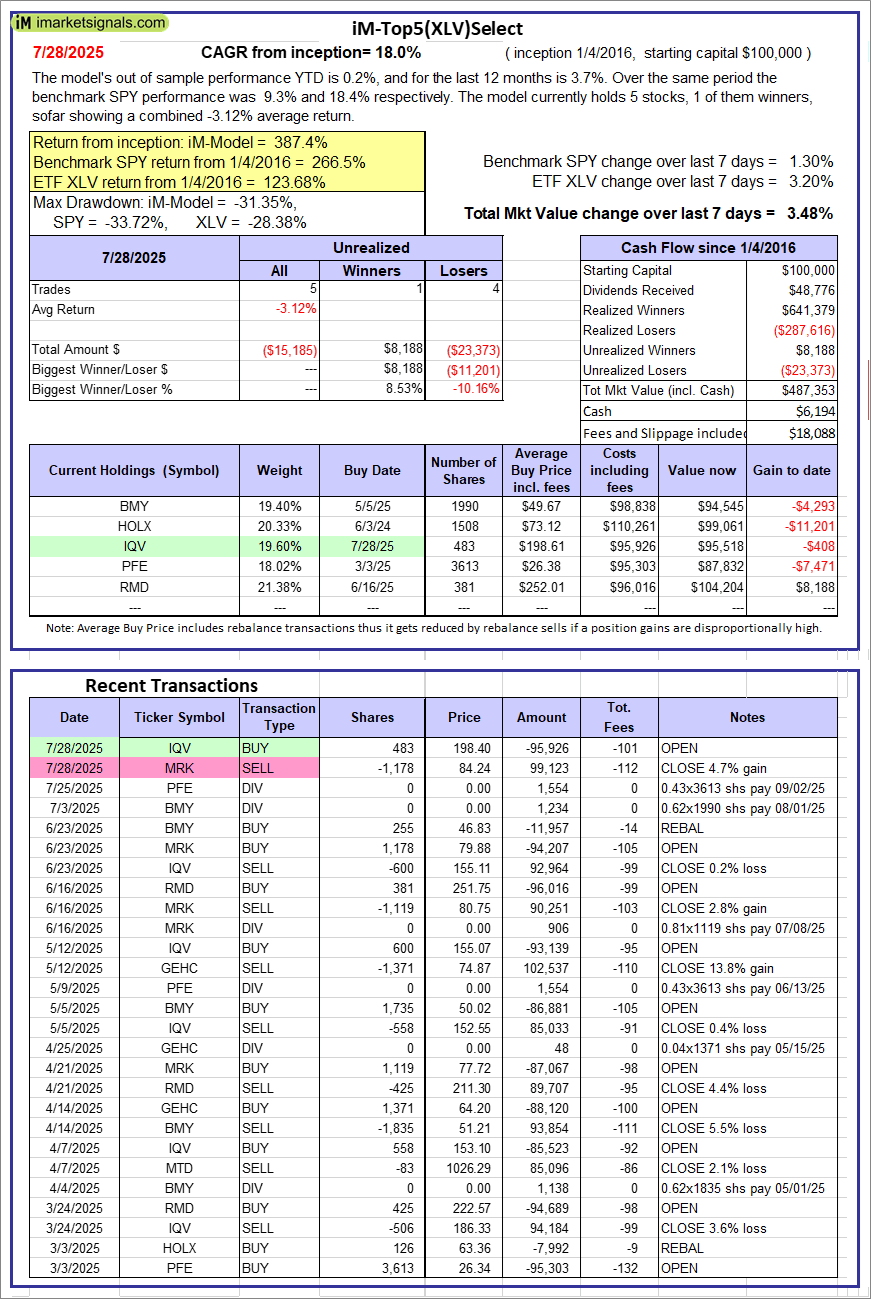 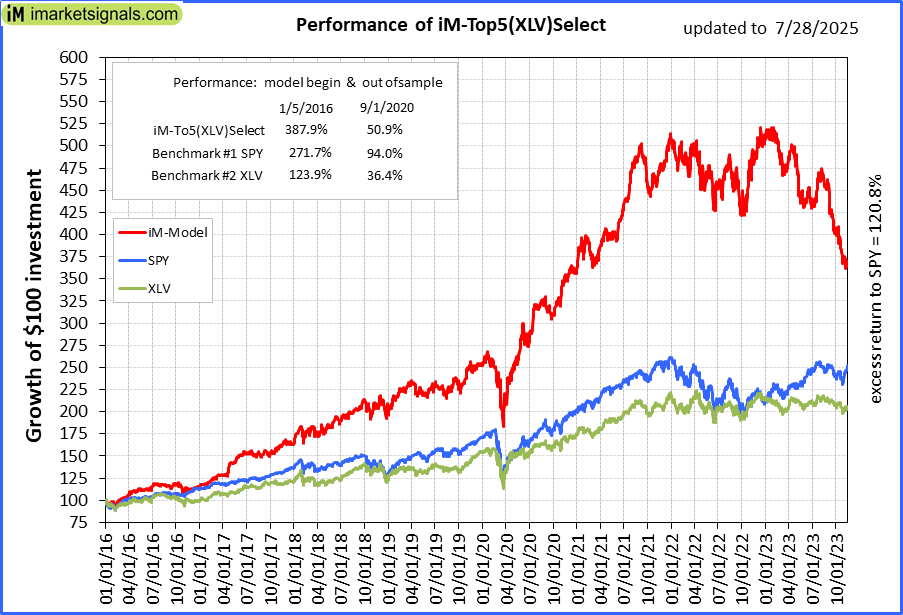 |
iM-Top5(XLV)Select: Since inception, on 1/5/2016, the model gained 387.35% while the benchmark SPY gained 266.52% over the same period. Over the previous week the market value of iM-Top5(XLV)Select gained 3.48% at a time when SPY gained 1.30%. A starting capital of $100,000 at inception on 1/5/2016 would have grown to $487,353 which includes $6,194 cash and excludes $18,088 spent on fees and slippage. |
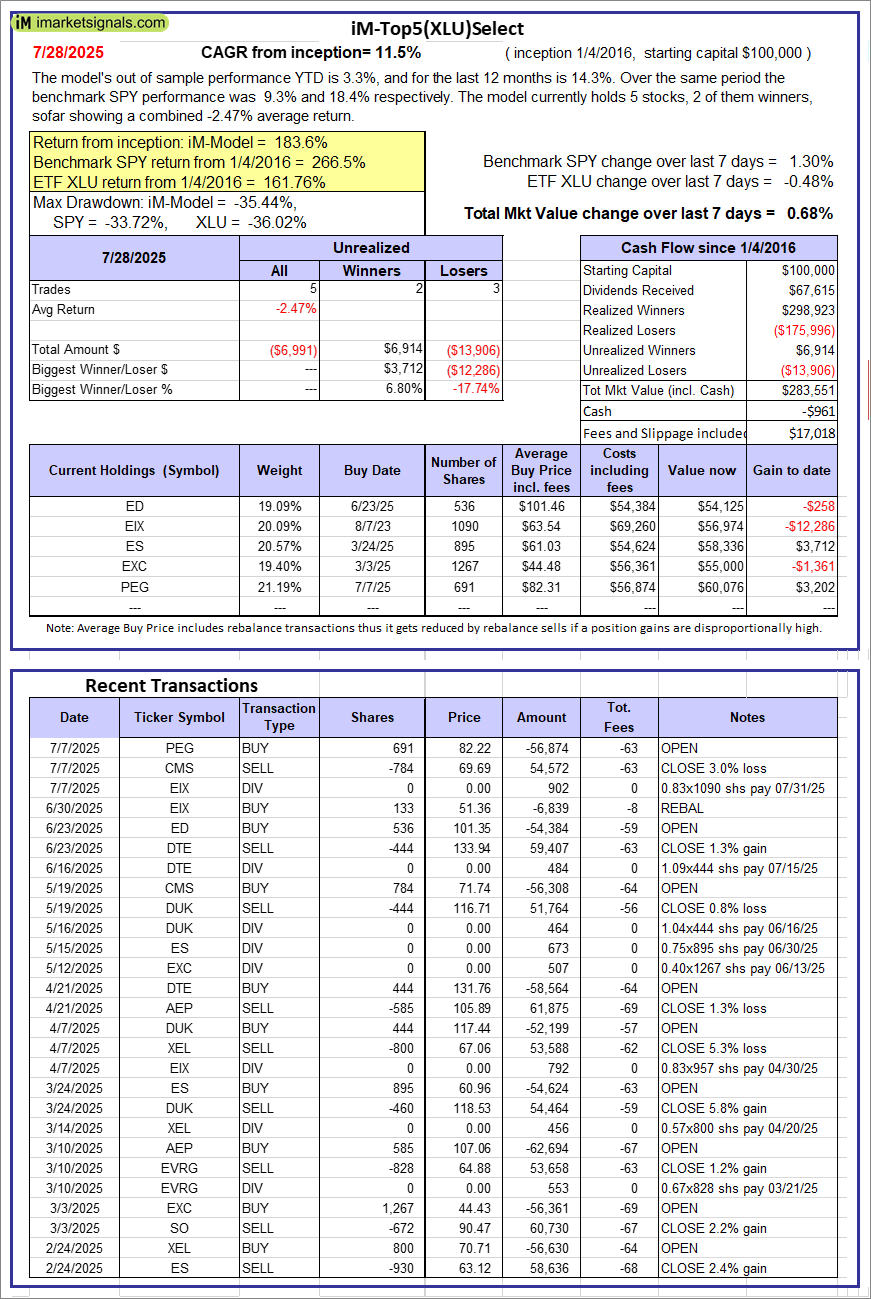 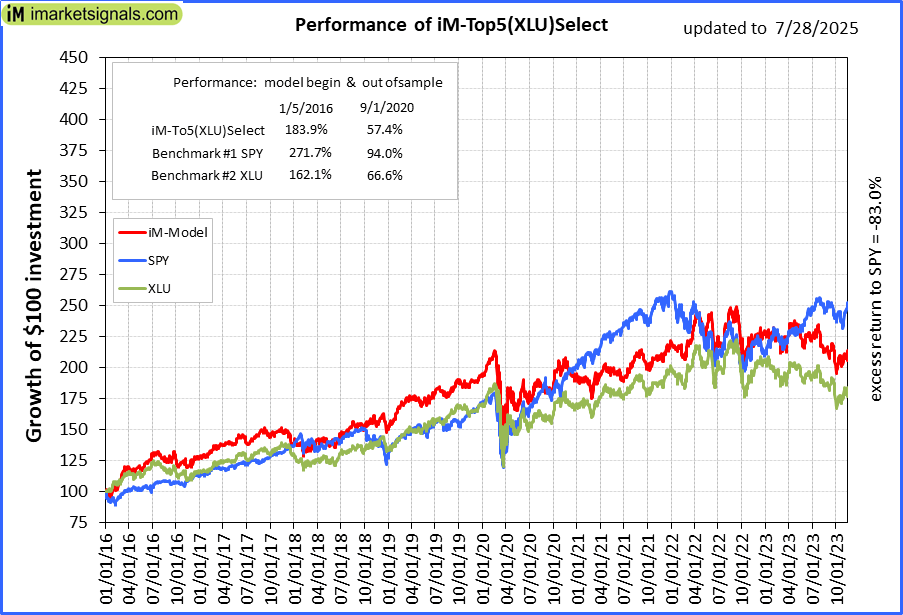 |
iM-Top5(XLU)Select: Since inception, on 1/5/2016, the model gained 183.55% while the benchmark SPY gained 266.52% over the same period. Over the previous week the market value of iM-Top5(XLU)Select gained 0.68% at a time when SPY gained 1.30%. A starting capital of $100,000 at inception on 1/5/2016 would have grown to $283,551 which includes -$961 cash and excludes $17,018 spent on fees and slippage. |
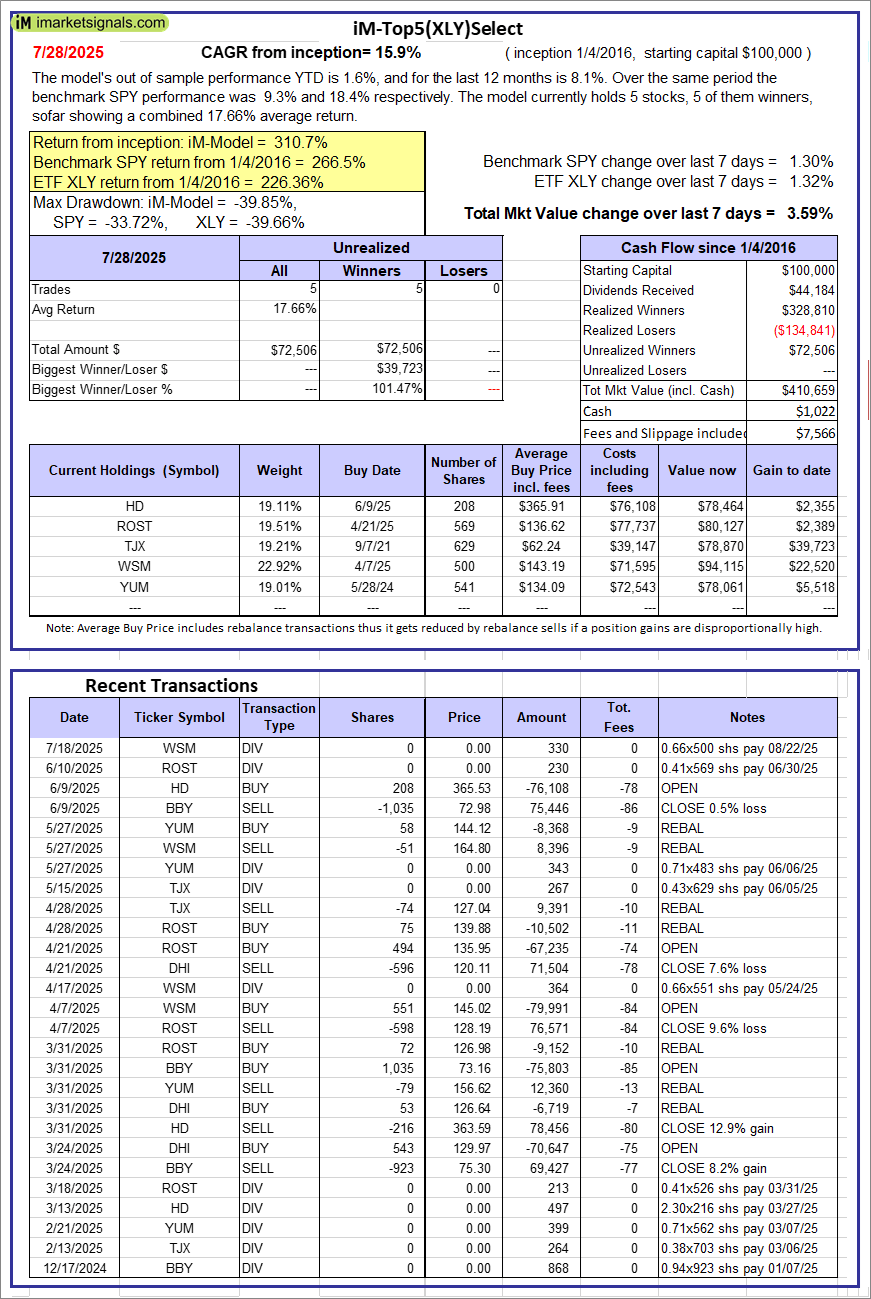 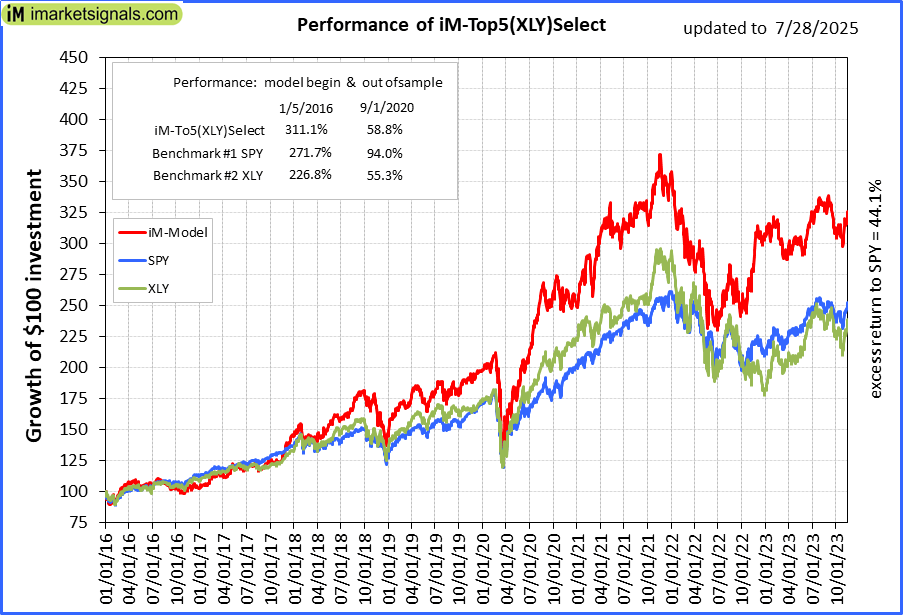 |
iM-Top5(XLY)Select: Since inception, on 1/5/2016, the model gained 310.66% while the benchmark SPY gained 266.52% over the same period. Over the previous week the market value of iM-Top5(XLY)Select gained 3.59% at a time when SPY gained 1.30%. A starting capital of $100,000 at inception on 1/5/2016 would have grown to $410,659 which includes $1,022 cash and excludes $7,566 spent on fees and slippage. |
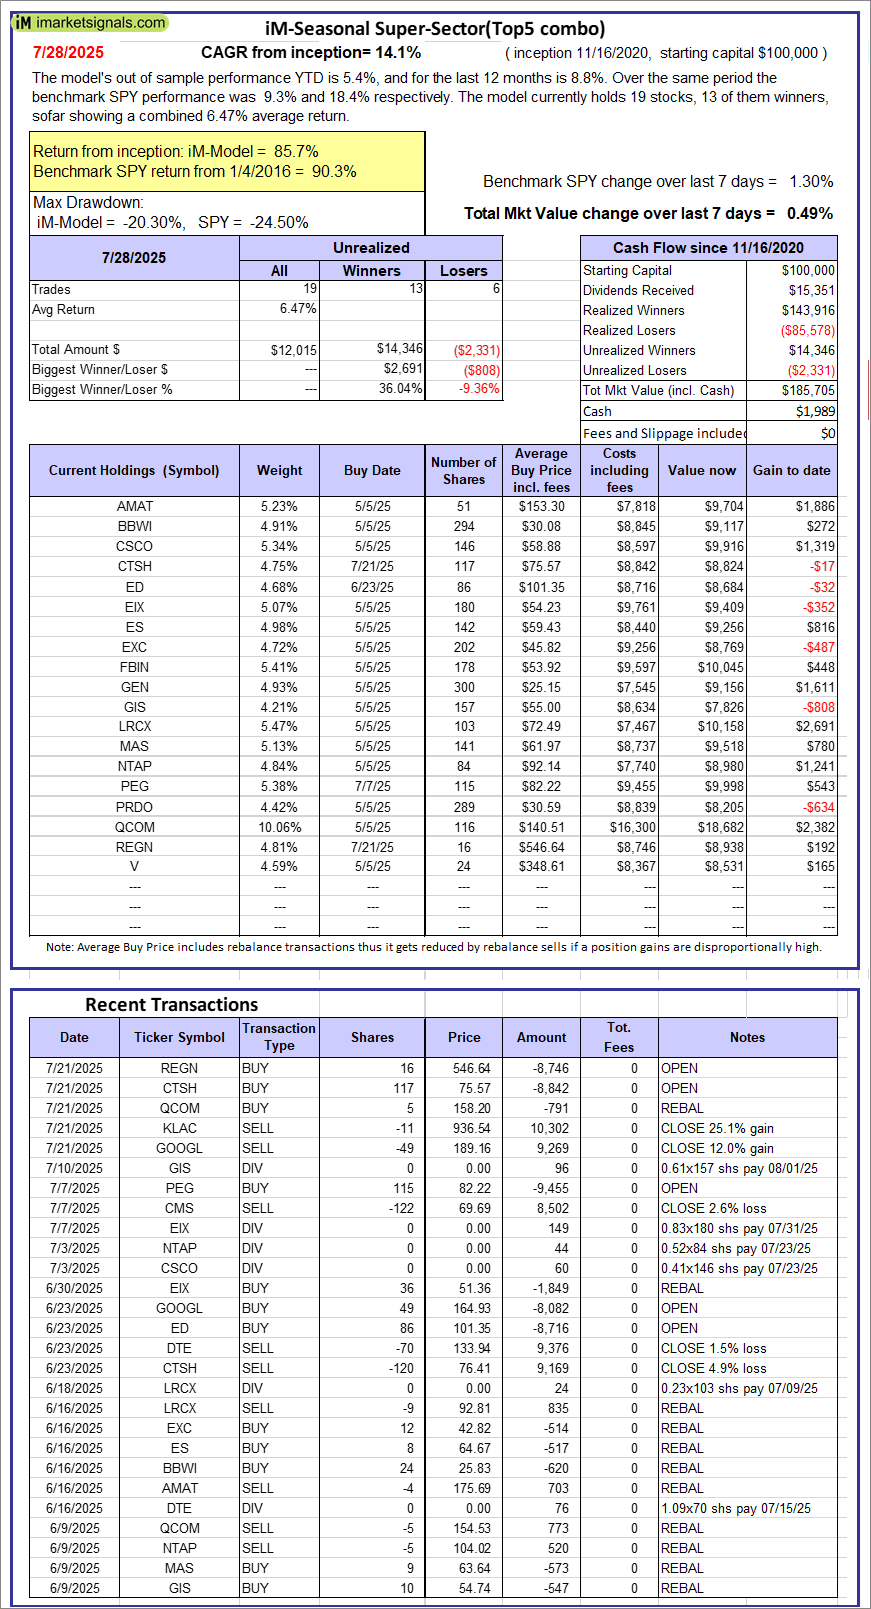 |
iM-Seasonal Super-Sectors (Top5 combo) : Since inception, on 11/17/2020, the model gained 85.70% while the benchmark SPY gained 90.26% over the same period. Over the previous week the market value of iM-Seasonal Super-Sectors (Top5 combo) gained 0.49% at a time when SPY gained 1.30%. A starting capital of $100,000 at inception on 11/17/2020 would have grown to $185,705 which includes $1,989 cash and excludes $00 spent on fees and slippage. |
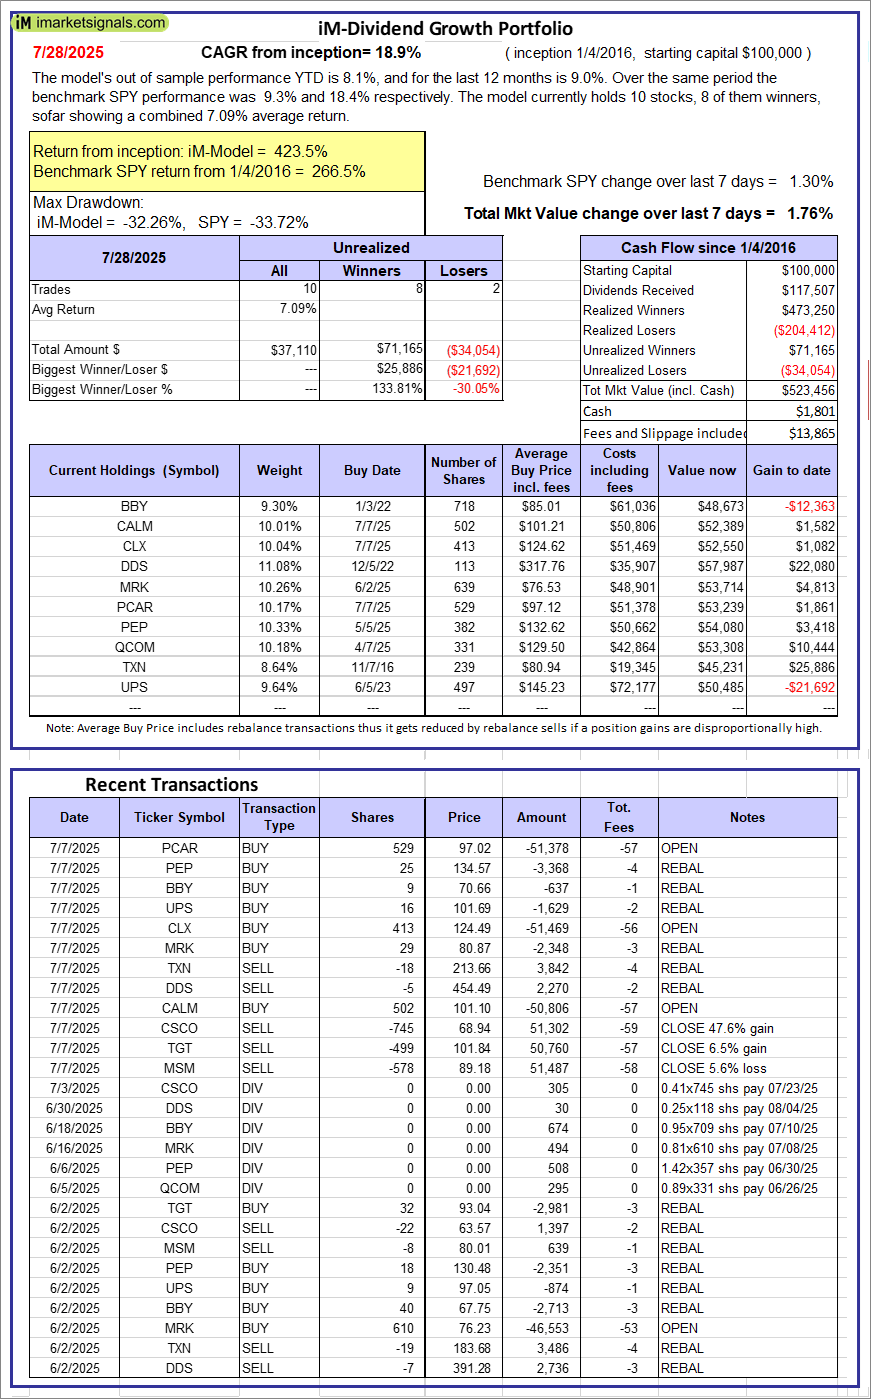 |
iM-Dividend Growth Portfolio: The model’s out of sample performance YTD is 8.1%, and for the last 12 months is 9.0%. Over the same period the benchmark SPY performance was 9.3% and 18.4% respectively. Over the previous week the market value of the iM-Dividend Growth Portfolio gained 1.76% at a time when SPY gained 1.30%. A starting capital of $100,000 at inception on 6/30/2016 would have grown to $523,456 which includes $1,801 cash and excludes $13,865 spent on fees and slippage. |
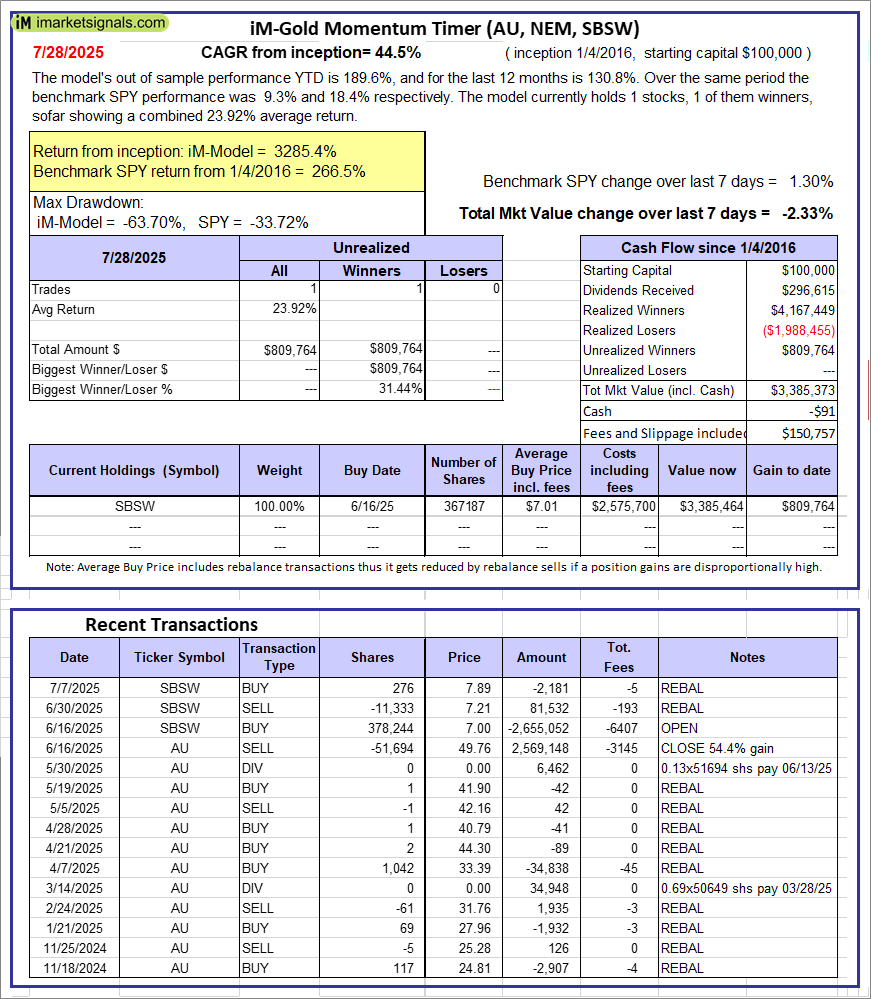 |
iM-Gold Momentum Timer (AU, NEM, SBSW): The model’s out of sample performance YTD is 189.6%, and for the last 12 months is 130.8%. Over the same period the benchmark SPY performance was 9.3% and 18.4% respectively. Over the previous week the market value of iM-Gold Momentum Timer (AU, NEM, SBSW) gained -2.33% at a time when SPY gained 1.30%. A starting capital of $100,000 at inception on 6/30/2016 would have grown to -$91 which includes $150,757 cash and excludes Gain to date spent on fees and slippage. |
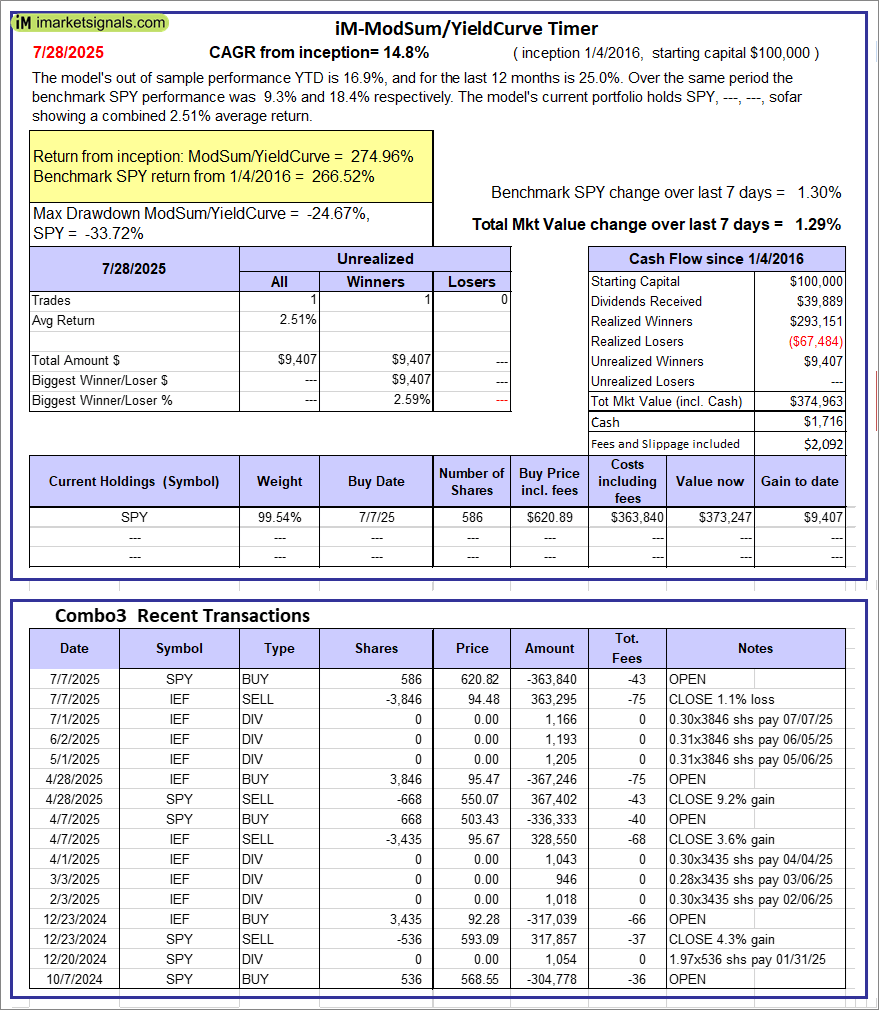 |
iM-ModSum/YieldCurve Timer: The model’s out of sample performance YTD is 16.9%, and for the last 12 months is 25.0%. Over the same period the benchmark SPY performance was 9.3% and 18.4% respectively. Over the previous week the market value of iM-PortSum/YieldCurve Timer gained 1.29% at a time when SPY gained 1.30%. A starting capital of $100,000 at inception on 1/1/2016 would have grown to $374,963 which includes $1,716 cash and excludes $2,092 spent on fees and slippage. |
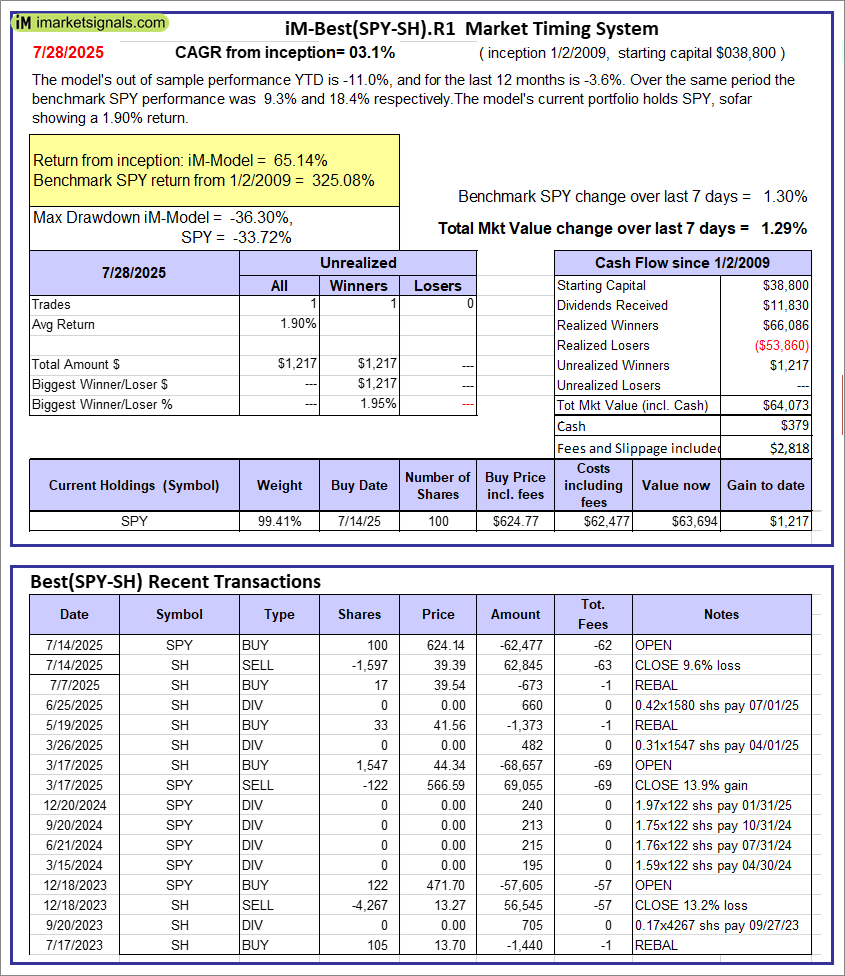 |
iM-Best(SPY-SH).R1: The model’s out of sample performance YTD is -11.0%, and for the last 12 months is -3.6%. Over the same period the benchmark SPY performance was 9.3% and 18.4% respectively. Over the previous week the market value of Best(SPY-SH) gained 1.29% at a time when SPY gained 1.30%. A starting capital of $100,000 at inception on 1/2/2009 would have grown to $64,073 which includes $379 cash and excludes $2,818 spent on fees and slippage. |
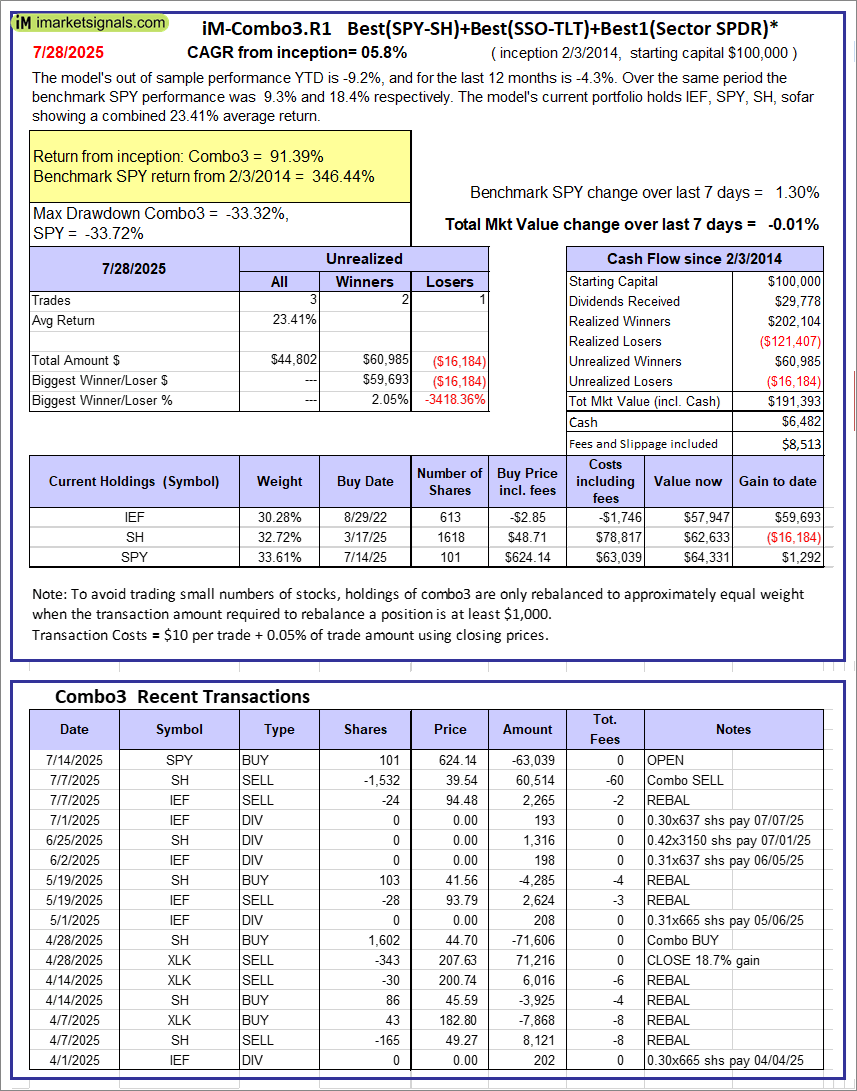 |
iM-Combo3.R1: The model’s out of sample performance YTD is -9.2%, and for the last 12 months is -4.3%. Over the same period the benchmark SPY performance was 9.3% and 18.4% respectively. Over the previous week the market value of iM-Combo3.R1 gained -0.01% at a time when SPY gained 1.30%. A starting capital of $100,000 at inception on 2/3/2014 would have grown to $191,393 which includes $6,482 cash and excludes $8,513 spent on fees and slippage. |
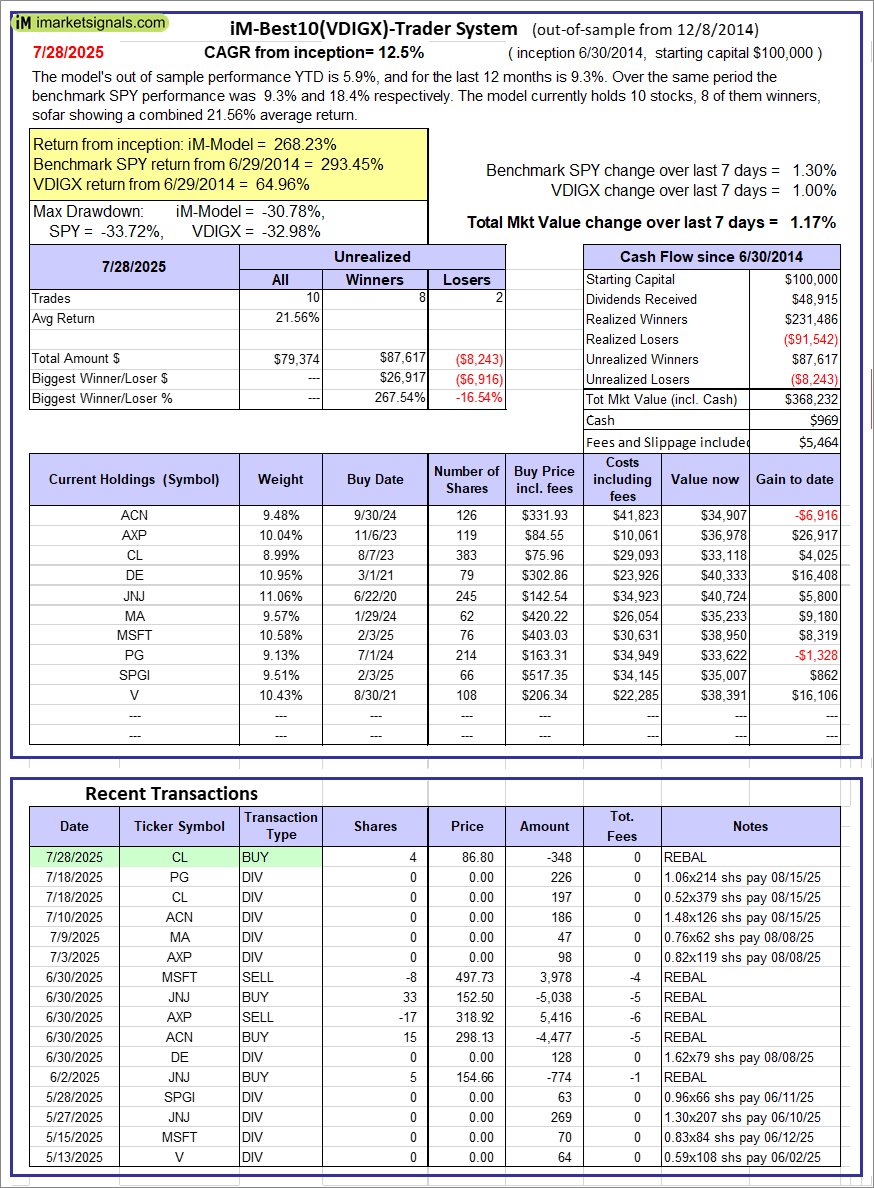 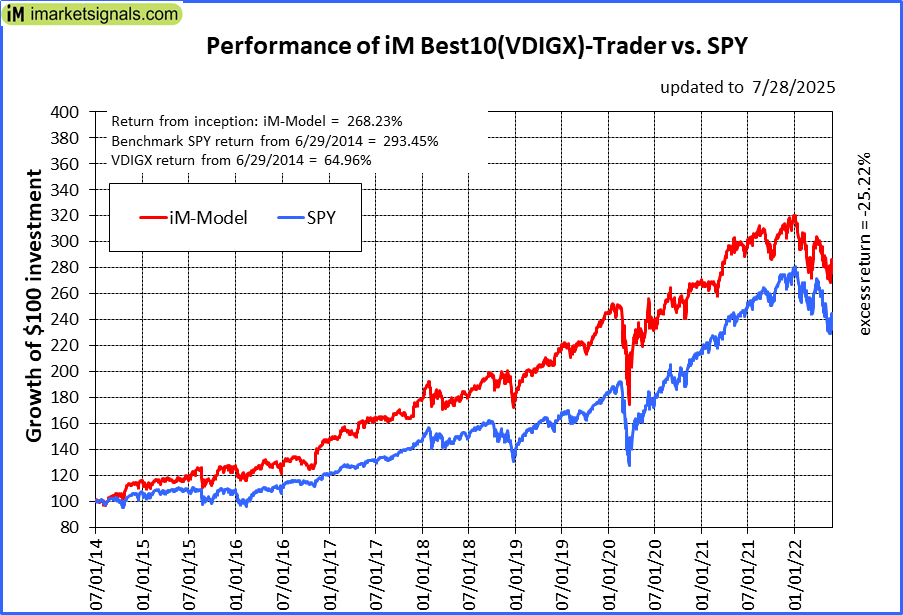 |
iM-Best10(VDIGX)-Trader: The model’s out of sample performance YTD is 5.9%, and for the last 12 months is 9.3%. Over the same period the benchmark SPY performance was 9.3% and 18.4% respectively. Since inception, on 7/1/2014, the model gained 268.23% while the benchmark SPY gained 293.45% and VDIGX gained 64.96% over the same period. Over the previous week the market value of iM-Best10(VDIGX) gained 1.17% at a time when SPY gained 1.30%. A starting capital of $100,000 at inception on 7/1/2014 would have grown to $368,232 which includes $969 cash and excludes $5,464 spent on fees and slippage. |
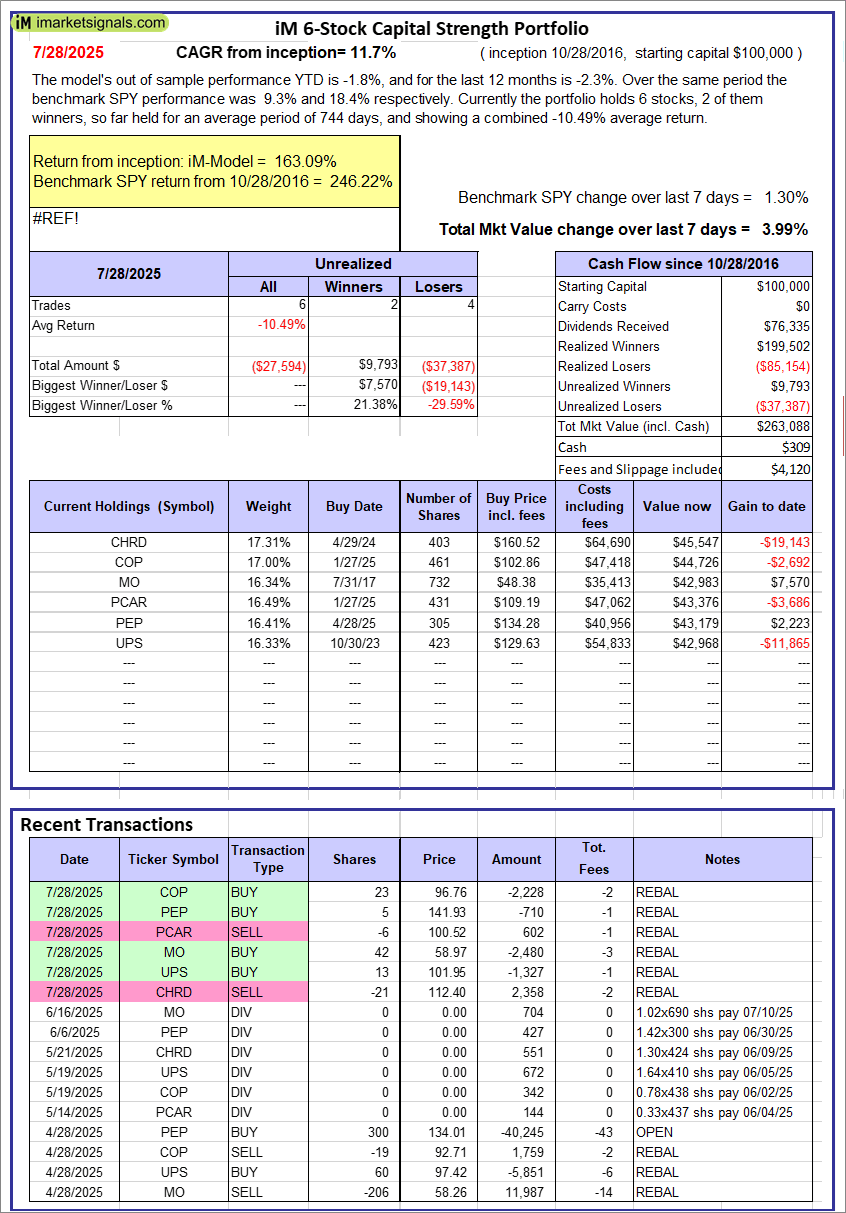 |
iM 6-Stock Capital Strength Portfolio: The model’s out of sample performance YTD is -1.8%, and for the last 12 months is -2.3%. Over the same period the benchmark SPY performance was 9.3% and 18.4% respectively. Over the previous week the market value of the iM 6-Stock Capital Strength Portfolio gained 3.99% at a time when SPY gained 1.30%. A starting capital of $100,000 at inception on 10/28/2016 would have grown to $263,088 which includes $309 cash and excludes $4,120 spent on fees and slippage. |
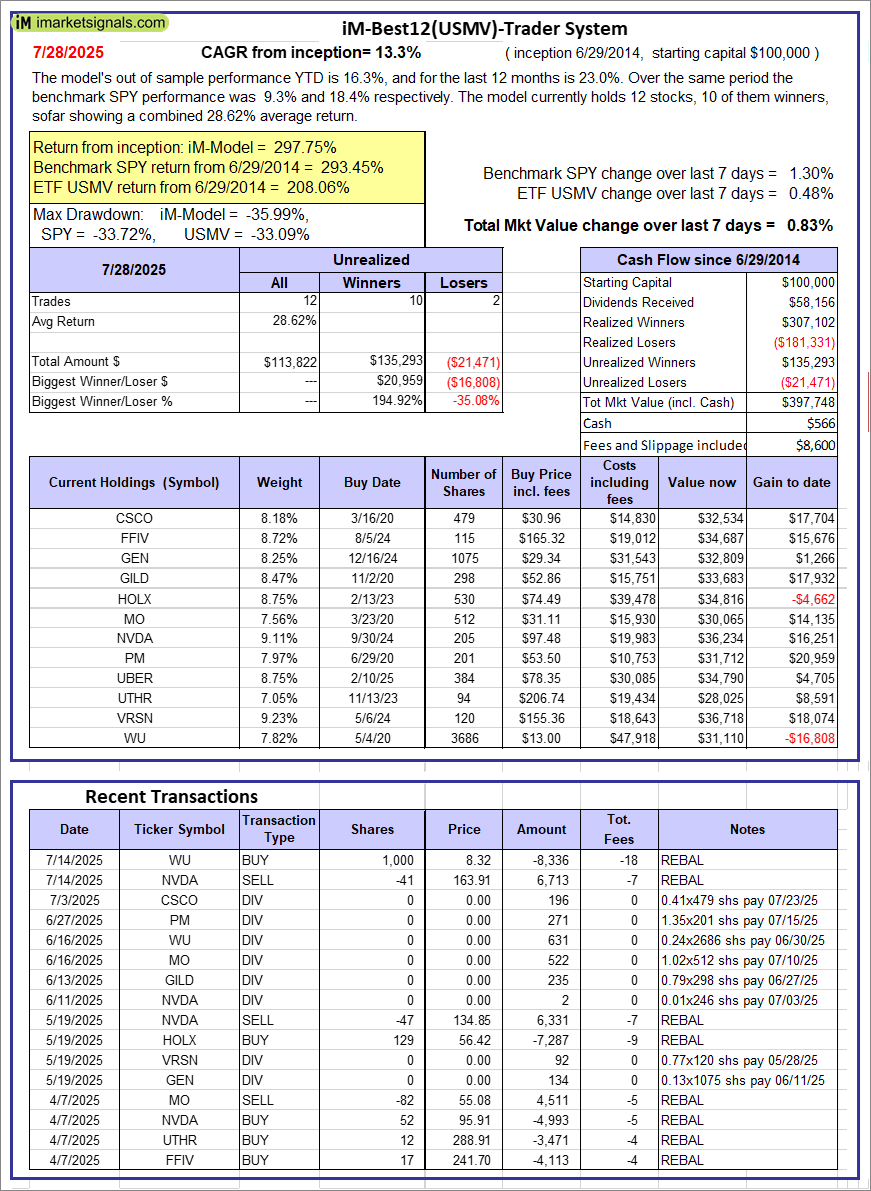 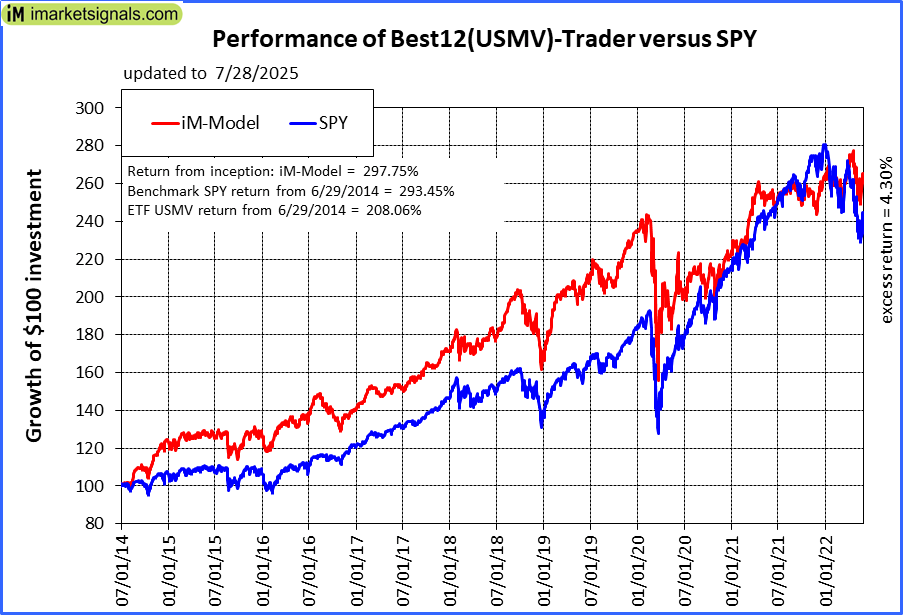 |
iM-Best12(USMV)-Trader: The model’s out of sample performance YTD is 16.3%, and for the last 12 months is 23.0%. Over the same period the benchmark SPY performance was 9.3% and 18.4% respectively. Since inception, on 6/30/2014, the model gained 297.75% while the benchmark SPY gained 293.45% and the ETF USMV gained 208.06% over the same period. Over the previous week the market value of iM-Best12(USMV)-Trader gained 0.83% at a time when SPY gained 1.30%. A starting capital of $100,000 at inception on 6/30/2014 would have grown to $397,748 which includes $566 cash and excludes $8,600 spent on fees and slippage. |
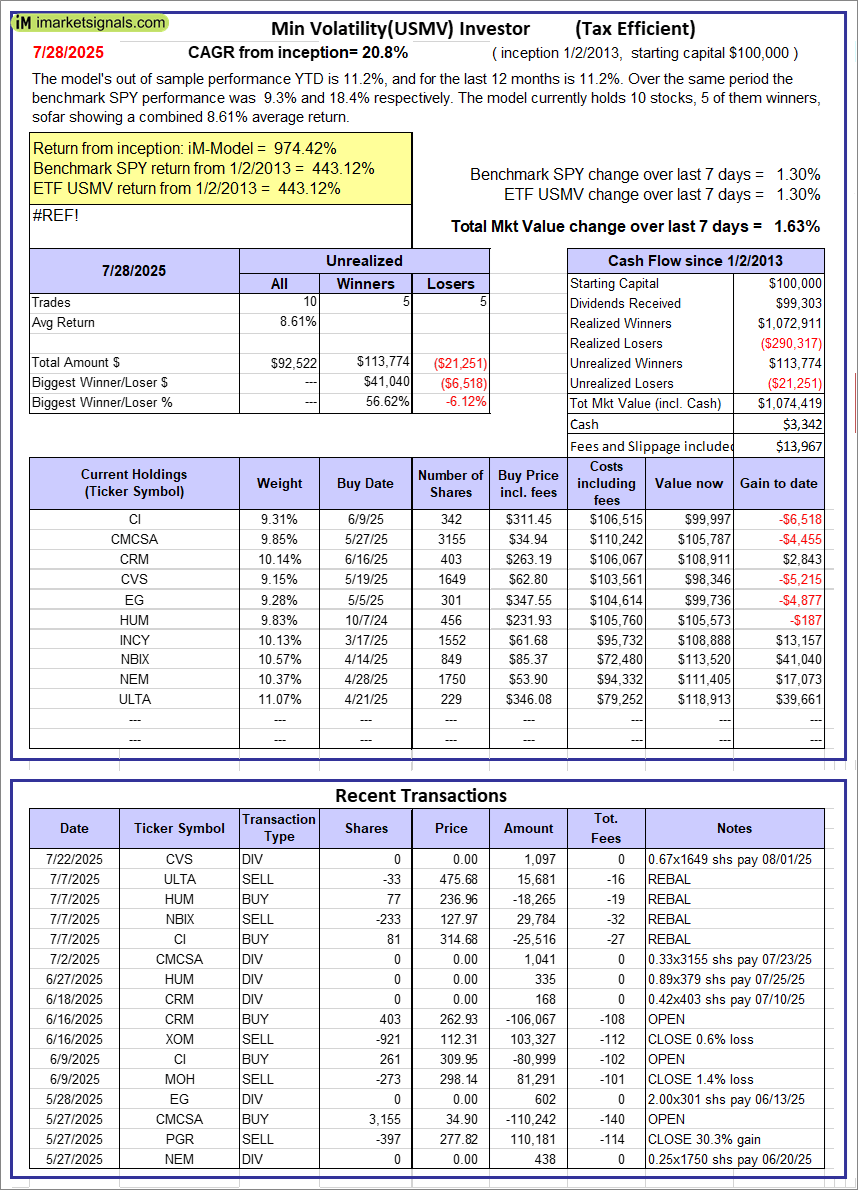 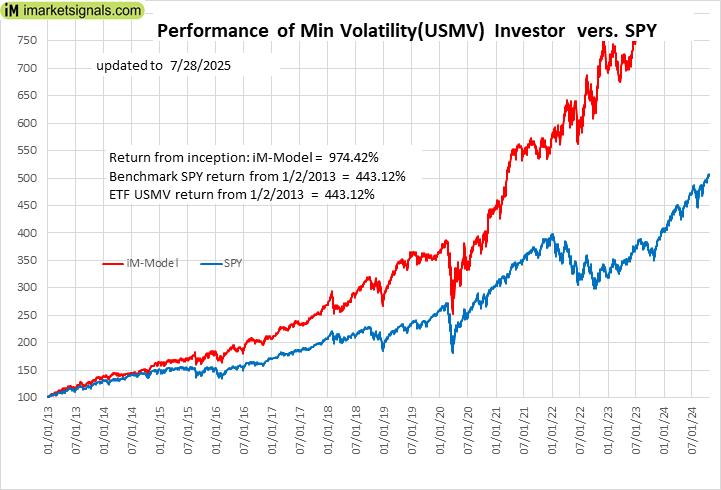 |
iM-Min Volatility(USMV) Investor (Tax Efficient): The model’s out of sample performance YTD is 11.2%, and for the last 12 months is 11.2%. Over the same period the benchmark SPY performance was 9.3% and 18.4% respectively. Since inception, on 1/3/2013, the model gained 974.42% while the benchmark SPY gained 443.12% and the ETF USMV gained 443.12% over the same period. Over the previous week the market value of iM-Best12(USMV)Q1 gained 1.63% at a time when SPY gained 1.30%. A starting capital of $100,000 at inception on 1/3/2013 would have grown to $1,074,419 which includes $3,342 cash and excludes $13,967 spent on fees and slippage. |
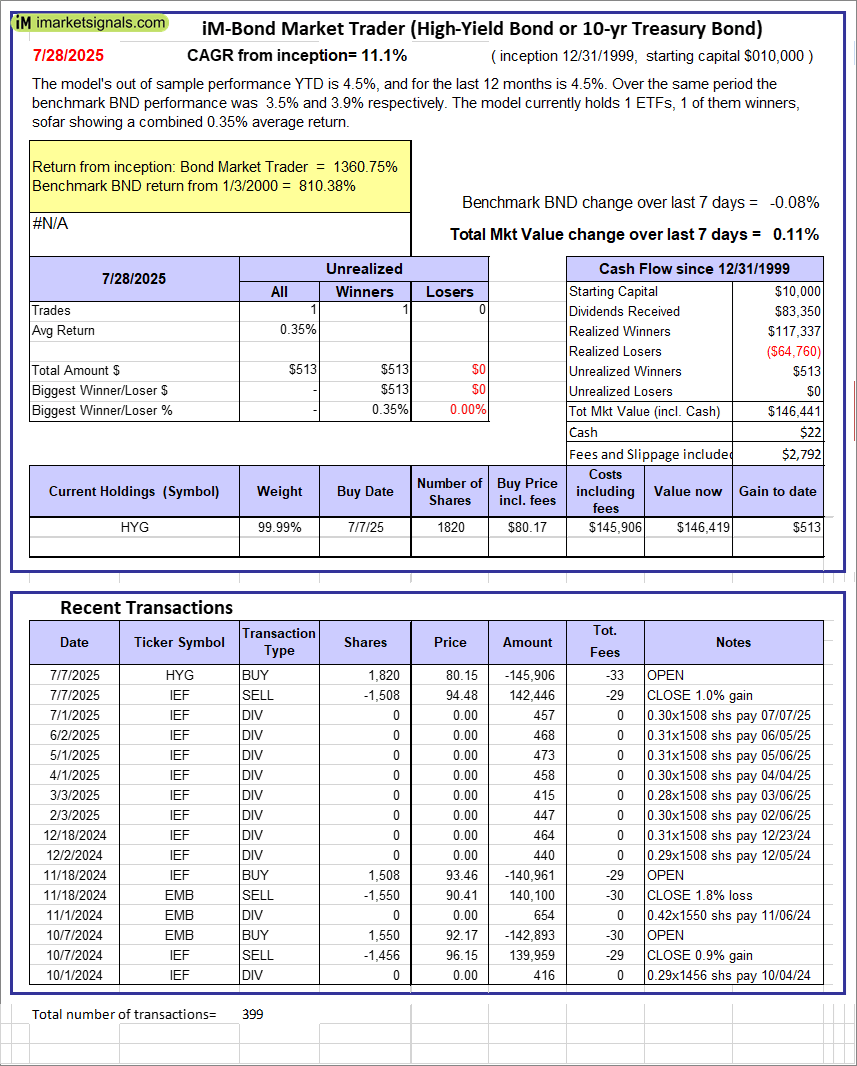 |
iM-Bond Market Trader (High-Yield Bond or 10-yr Treasury Bond): The model’s out of sample performance YTD is 4.5%, and for the last 12 months is 4.5%. Over the same period the benchmark BND performance was 3.5% and 3.9% respectively. Over the previous week the market value of the iM-Bond Market Trader (High-Yield Bond or 10-yr Treasury Bond) gained 0.11% at a time when BND gained -0.08%. A starting capital of $10,000 at inception on 1/3/2000 would have grown to $146,441 which includes $22 cash and excludes $2,792 spent on fees and slippage. |
|
|
iM-ModSum/YieldCurve Timer: The model’s out of sample performance YTD is 16.9%, and for the last 12 months is 25.0%. Over the same period the benchmark SPY performance was 9.3% and 18.4% respectively. Over the previous week the market value of iM-PortSum/YieldCurve Timer gained 1.29% at a time when SPY gained 1.30%. A starting capital of $100,000 at inception on 1/1/2016 would have grown to $374,963 which includes $1,716 cash and excludes $2,092 spent on fees and slippage. |
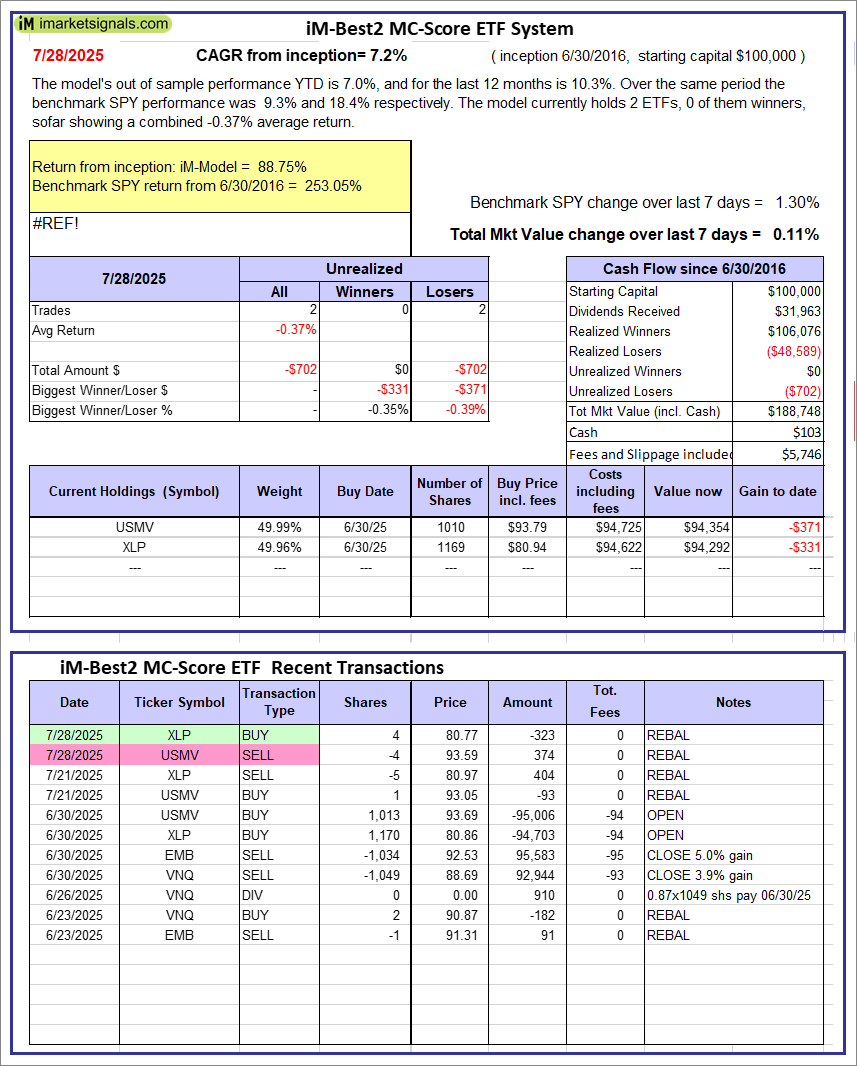 |
iM-Best2 MC-Score ETF System: The model’s out of sample performance YTD is 7.0%, and for the last 12 months is 10.3%. Over the same period the benchmark SPY performance was 9.3% and 18.4% respectively. Over the previous week the market value of the iM-Best2 MC-Score ETF System gained 0.11% at a time when SPY gained 1.30%. A starting capital of $100,000 at inception on 6/30/2016 would have grown to $188,748 which includes $103 cash and excludes $5,746 spent on fees and slippage. |
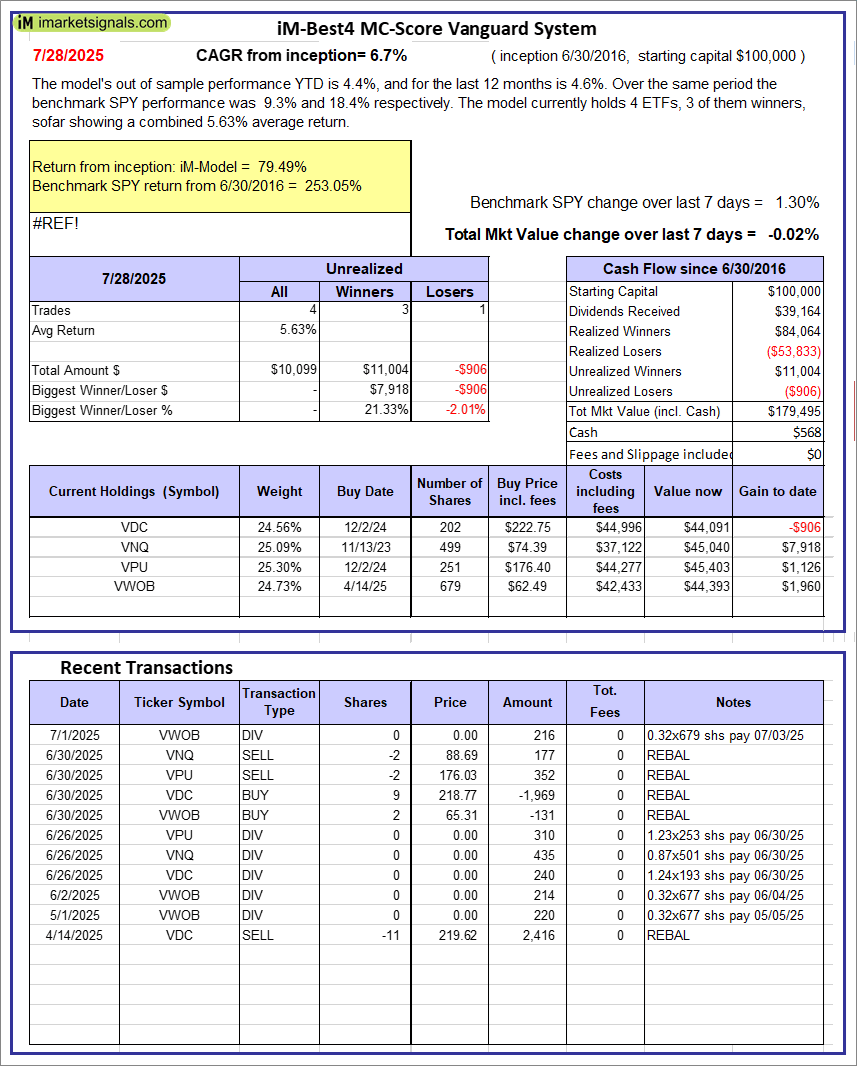 |
iM-Best4 MC-Score Vanguard System: The model’s out of sample performance YTD is 4.4%, and for the last 12 months is 4.6%. Over the same period the benchmark SPY performance was 9.3% and 18.4% respectively. Over the previous week the market value of the iM-Best4 MC-Score Vanguard System gained -0.02% at a time when SPY gained 1.30%. A starting capital of $100,000 at inception on 6/30/2016 would have grown to $179,495 which includes $568 cash and excludes $00 spent on fees and slippage. |
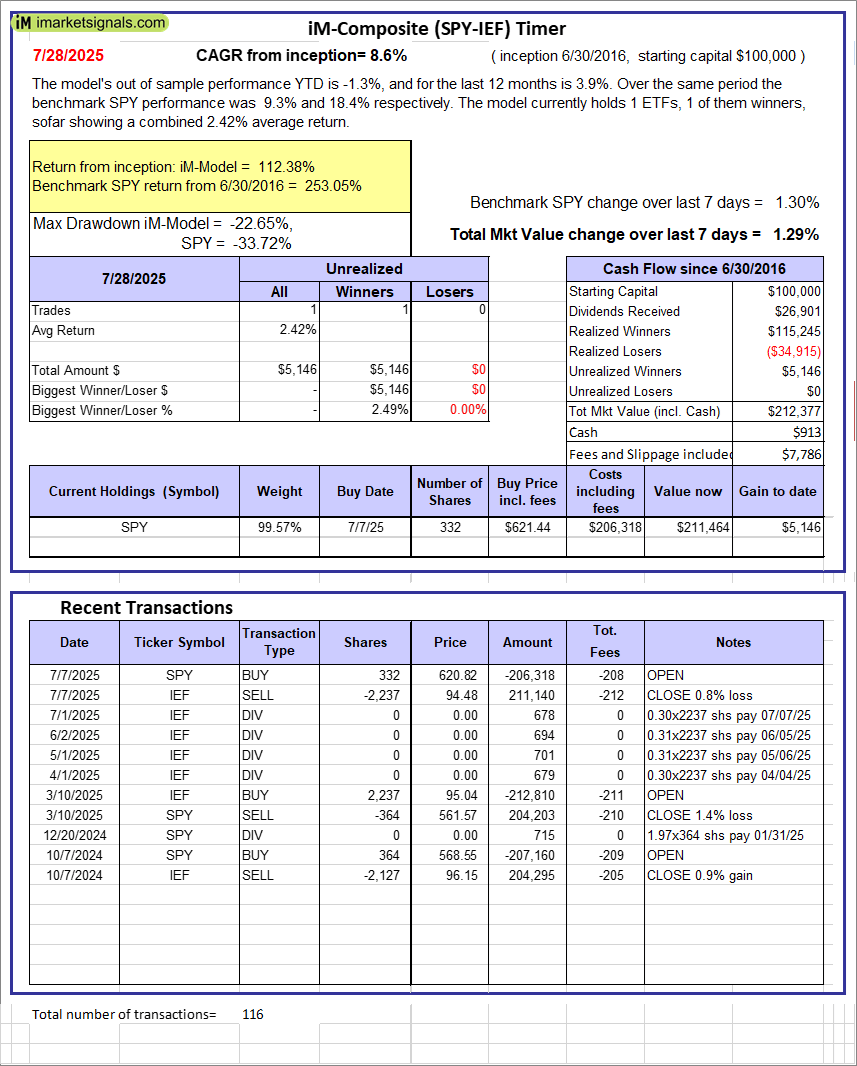 |
iM-Composite (SPY-IEF) Timer: The model’s out of sample performance YTD is -1.3%, and for the last 12 months is 3.9%. Over the same period the benchmark SPY performance was 9.3% and 18.4% respectively. Over the previous week the market value of the iM-Composite (SPY-IEF) Timer gained 1.29% at a time when SPY gained 1.30%. A starting capital of $100,000 at inception on 6/30/2016 would have grown to $212,377 which includes $913 cash and excludes $7,786 spent on fees and slippage. |
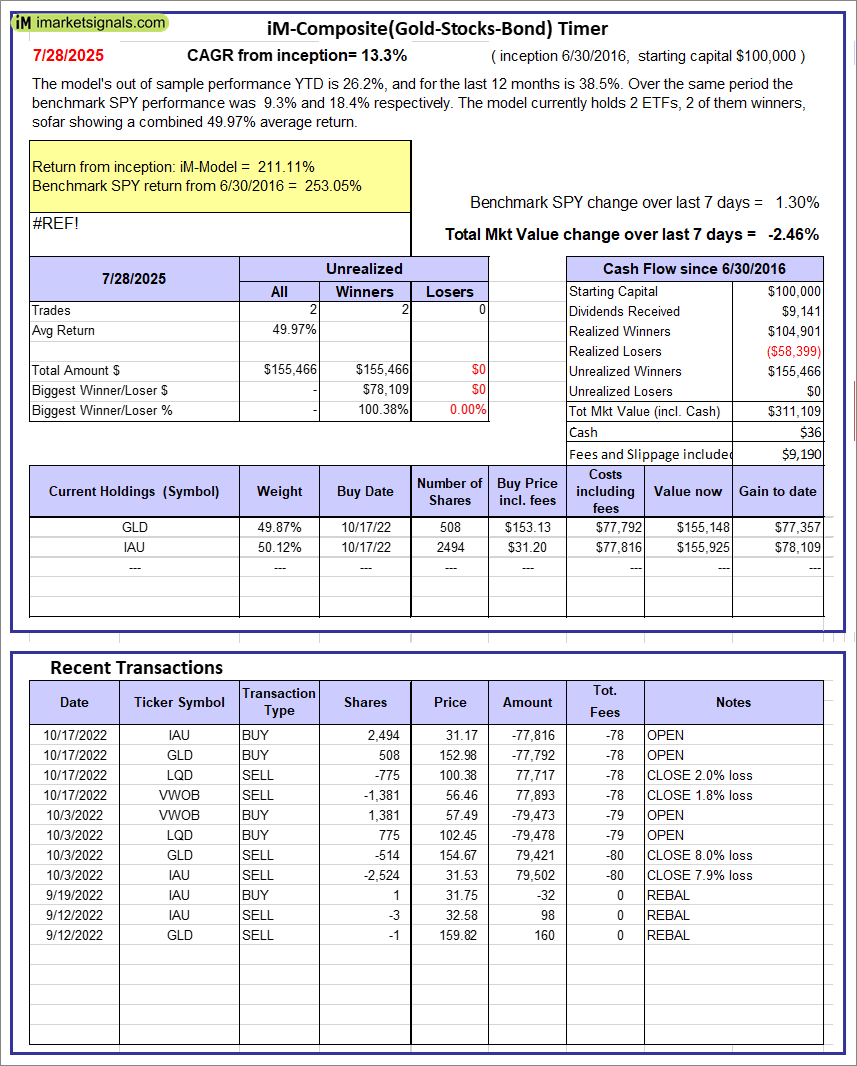 |
iM-Composite(Gold-Stocks-Bond) Timer: The model’s out of sample performance YTD is 26.2%, and for the last 12 months is 38.5%. Over the same period the benchmark SPY performance was 9.3% and 18.4% respectively. Over the previous week the market value of the iM-Composite(Gold-Stocks-Bond) Timer gained -2.46% at a time when SPY gained 1.30%. A starting capital of $100,000 at inception on 6/30/2016 would have grown to $311,109 which includes $36 cash and excludes $9,190 spent on fees and slippage. |
iM-Best Reports – 7/29/2025
Posted in pmp SPY-SH
Leave a Reply
You must be logged in to post a comment.