
  |
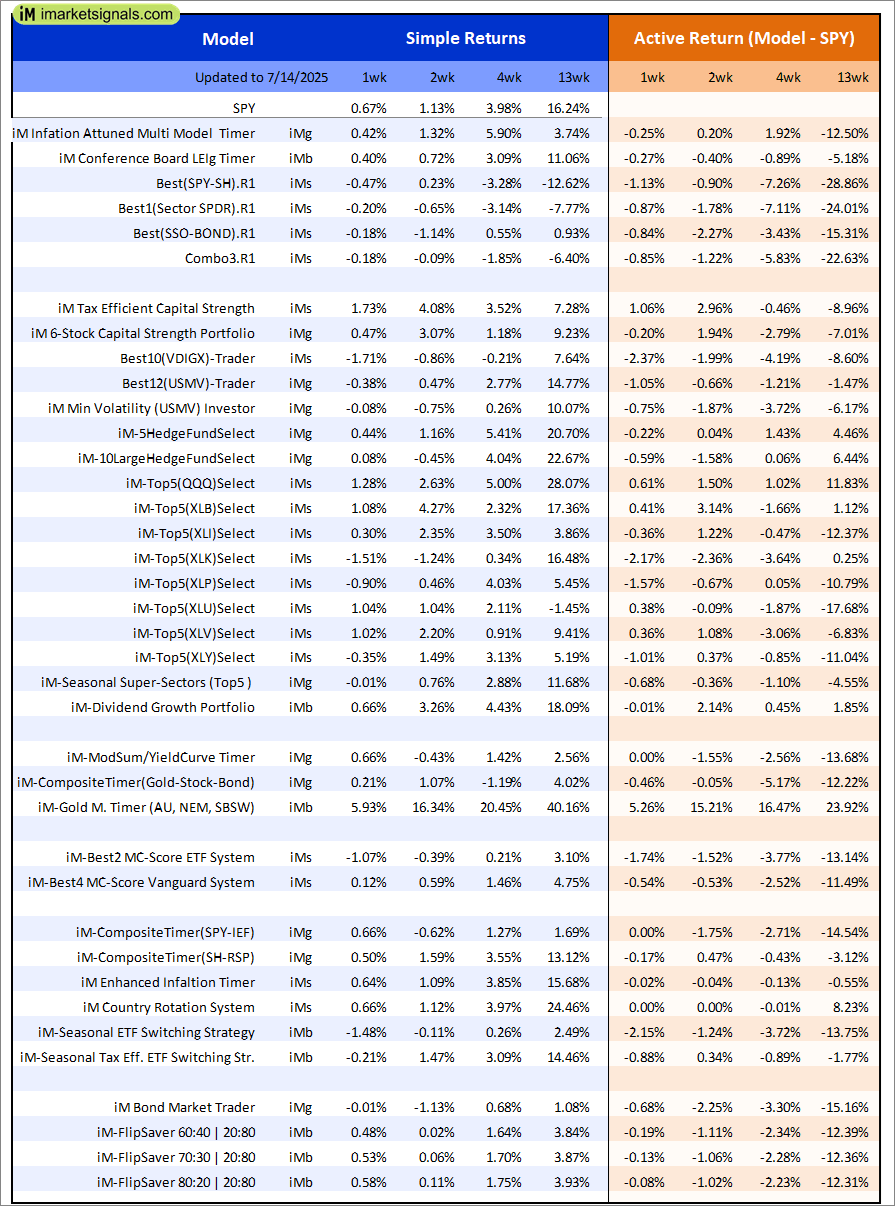
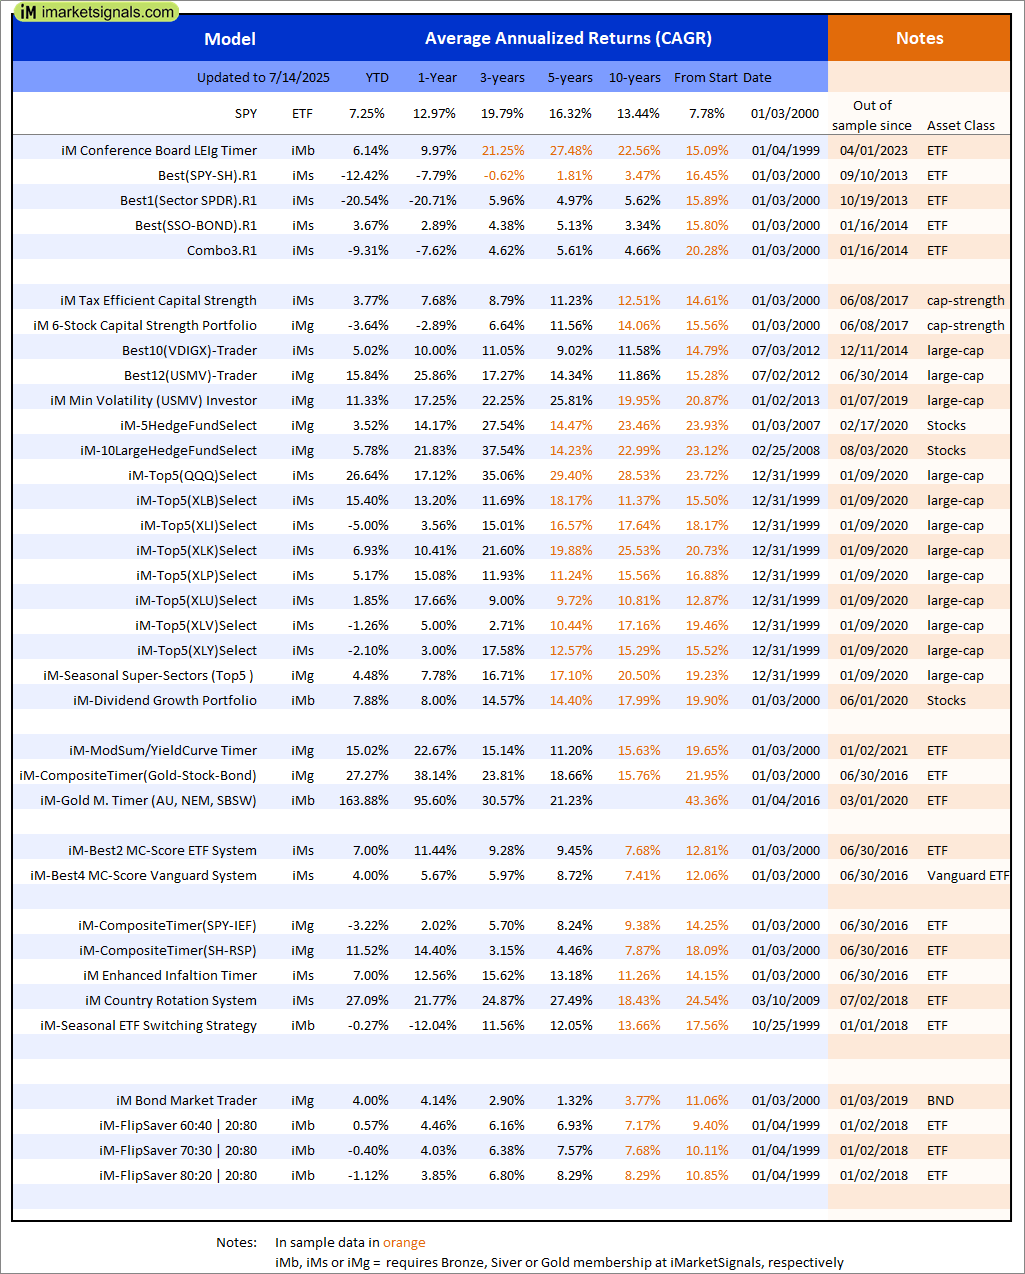
Out of sample performance summary of our models for the past 1, 2, 4 and 13 week periods. The active active return indicates how the models over- or underperformed the benchmark ETF SPY. Also the YTD, and the 1-, 3-, 5- and 10-year annualized returns are shown in the second table |
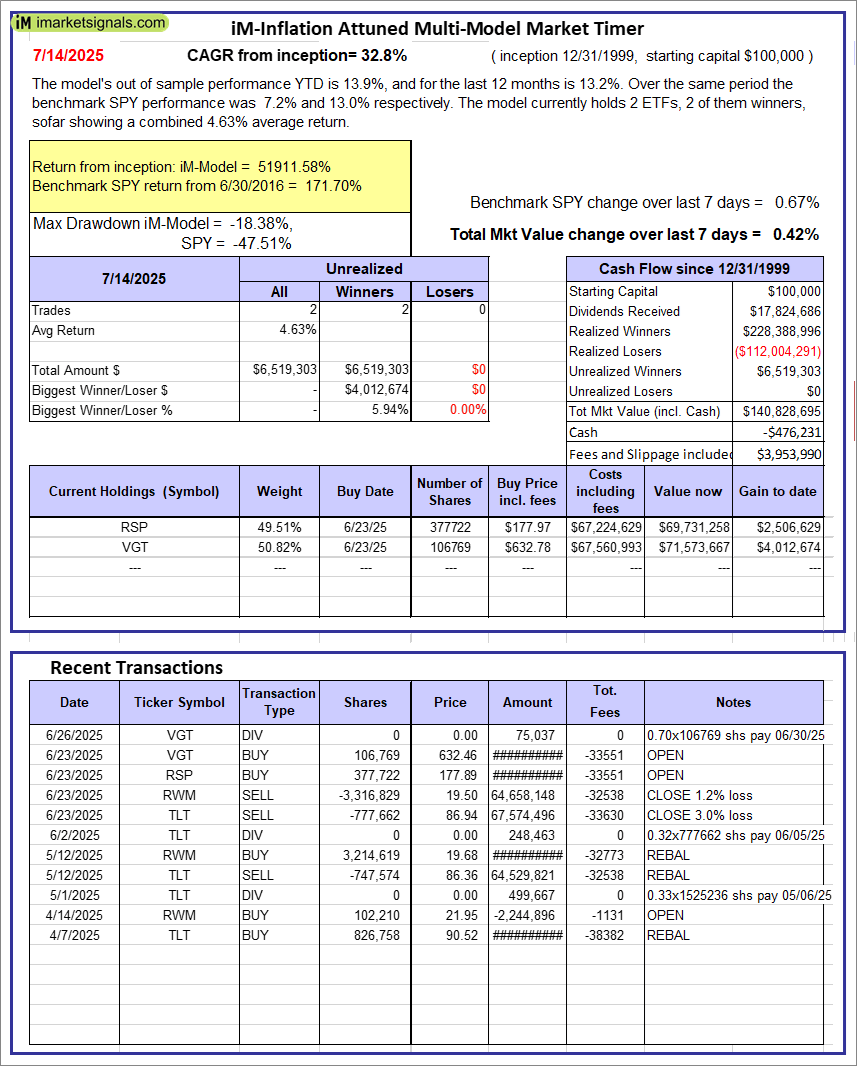 |
iM-Inflation Attuned Multi-Model Market Timer: The model’s out of sample performance YTD is 13.9%, and for the last 12 months is 13.2%. Over the same period the benchmark SPY performance was 7.2% and 13.0% respectively. Over the previous week the market value of the iM-Inflation Attuned Multi-Model Market Timer gained 0.42% at a time when SPY gained 0.67%. A starting capital of $100,000 at inception on 3/24/2017 would have grown to $140,828,695 which includes -$476,231 cash and excludes $3,953,990 spent on fees and slippage. |
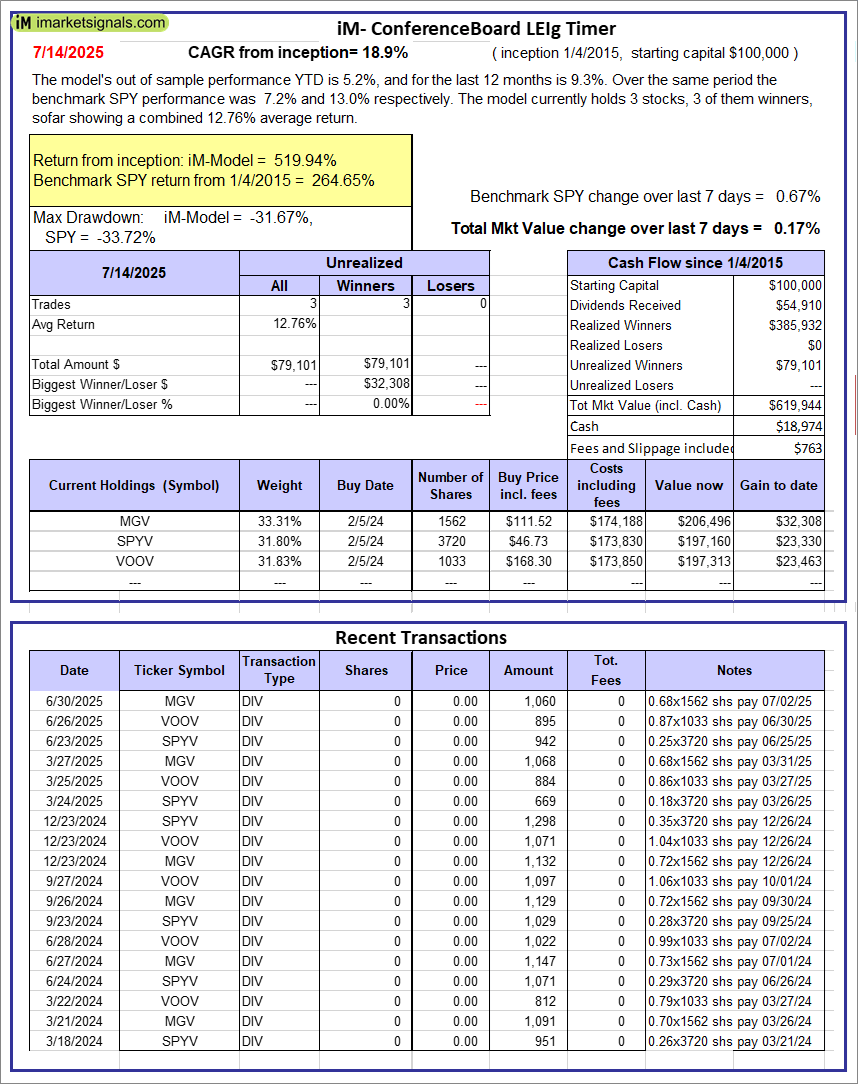 |
iM-Conference Board LEIg Timer: The model’s performance YTD is 14.3%, and for the last 12 months is 7.3%. Over the same period the benchmark SPY performance was 20.1% and 9.4% respectively. Over the previous week the market value of the iM-Conference Board LEIg Timer gained 0.17% at a time when SPY gained 0.67%. A starting capital of $100,000 at inception on 4/5/2017 would have grown to $619,944 which includes $18,974 cash and excludes $763 spent on fees and slippage. |
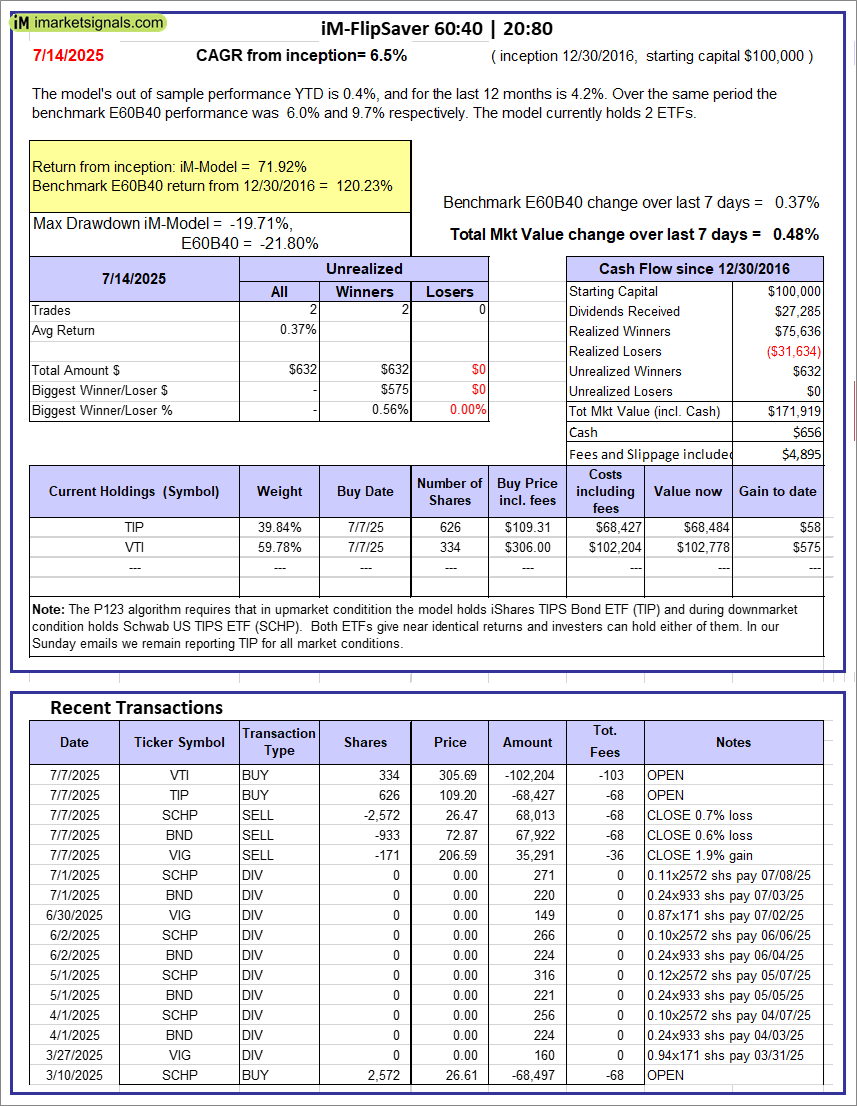 |
iM-FlipSaver 60:40 | 20:80 – 2017: The model’s out of sample performance YTD is 0.4%, and for the last 12 months is 4.2%. Over the same period the benchmark E60B40 performance was 6.0% and 9.7% respectively. Over the previous week the market value of iM-FlipSaver 80:20 | 20:80 gained 0.48% at a time when SPY gained 0.37%. A starting capital of $100,000 at inception on 7/16/2015 would have grown to $171,919 which includes $656 cash and excludes $4,895 spent on fees and slippage. |
 |
iM-FlipSaver 70:30 | 20:80 – 2017: The model’s out of sample performance YTD is -0.4%, and for the last 12 months is 4.0%. Over the same period the benchmark E60B40 performance was 6.0% and 9.7% respectively. Over the previous week the market value of iM-FlipSaver 70:30 | 20:80 gained 0.53% at a time when SPY gained 0.37%. A starting capital of $100,000 at inception on 7/15/2015 would have grown to $178,819 which includes $805 cash and excludes $5,139 spent on fees and slippage. |
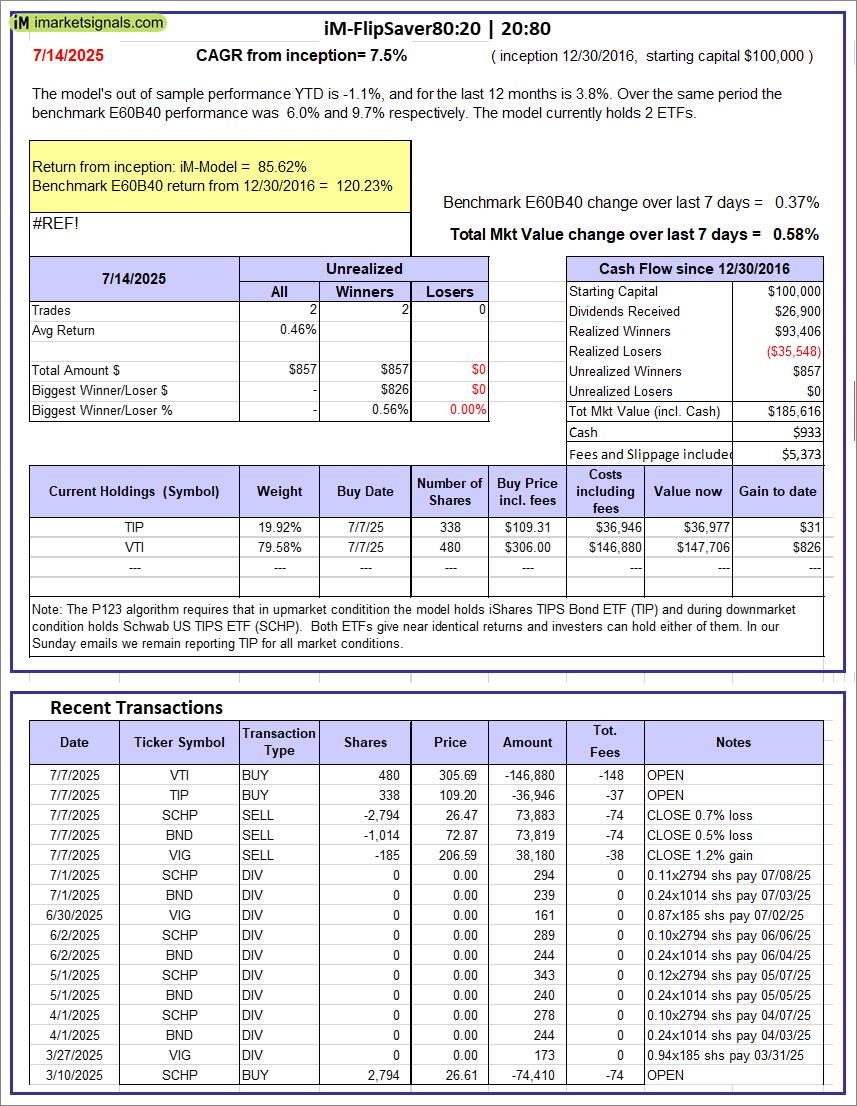 |
iM-FlipSaver 80:20 | 20:80 – 2017: The model’s out of sample performance YTD is -1.1%, and for the last 12 months is 3.8%. Over the same period the benchmark E60B40 performance was 6.0% and 9.7% respectively. Over the previous week the market value of iM-FlipSaver 80:20 | 20:80 gained 0.58% at a time when SPY gained 0.37%. A starting capital of $100,000 at inception on 1/2/2017 would have grown to $185,616 which includes $933 cash and excludes $5,373 spent on fees and slippage. |
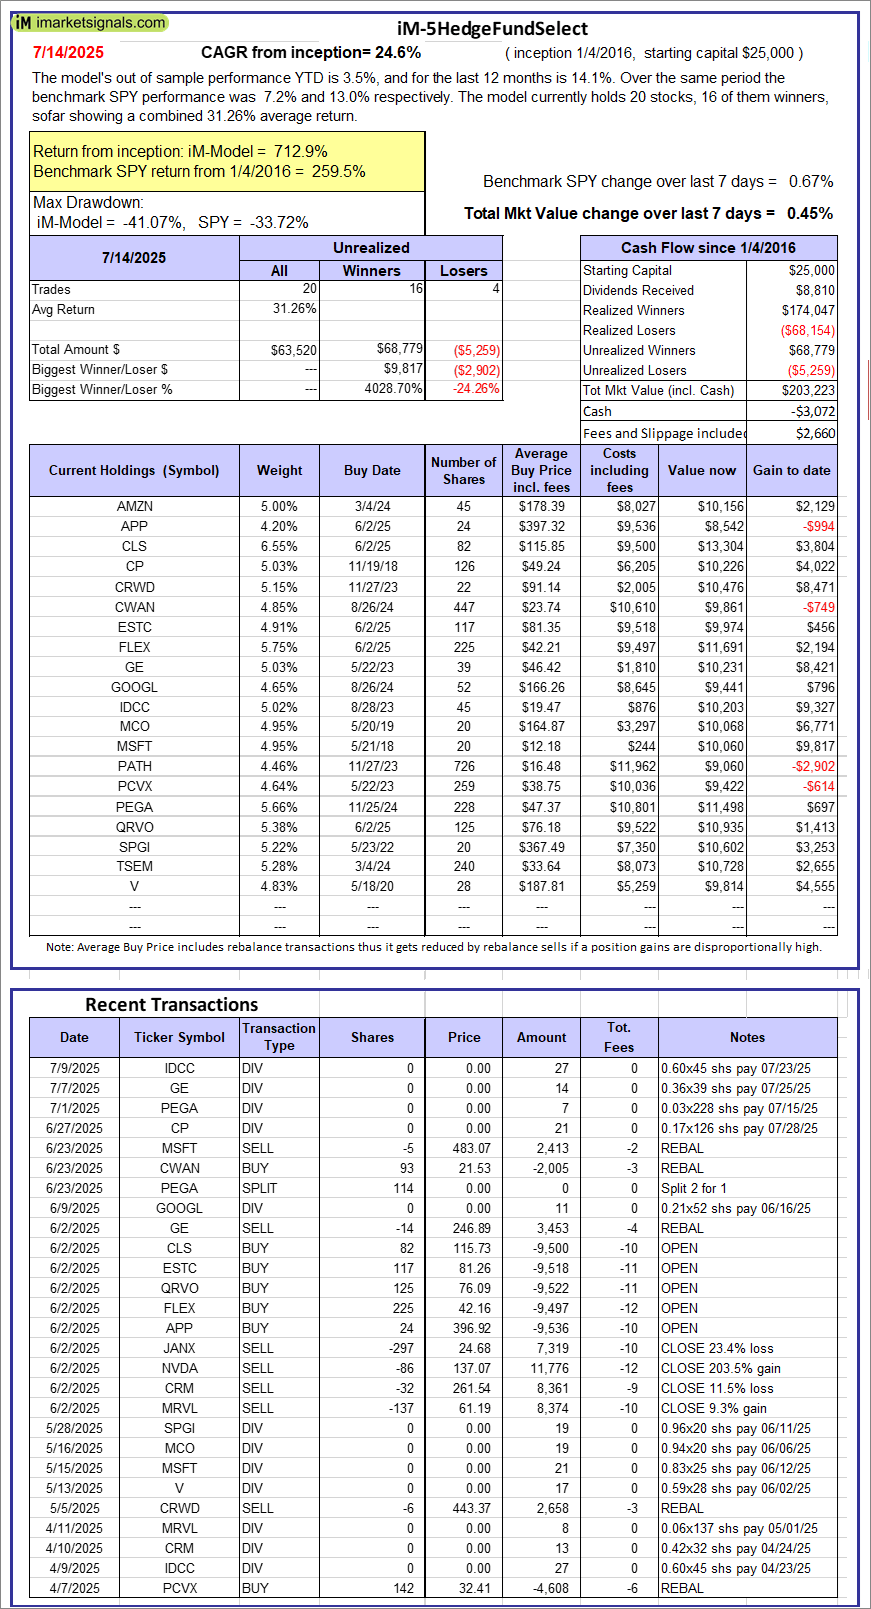 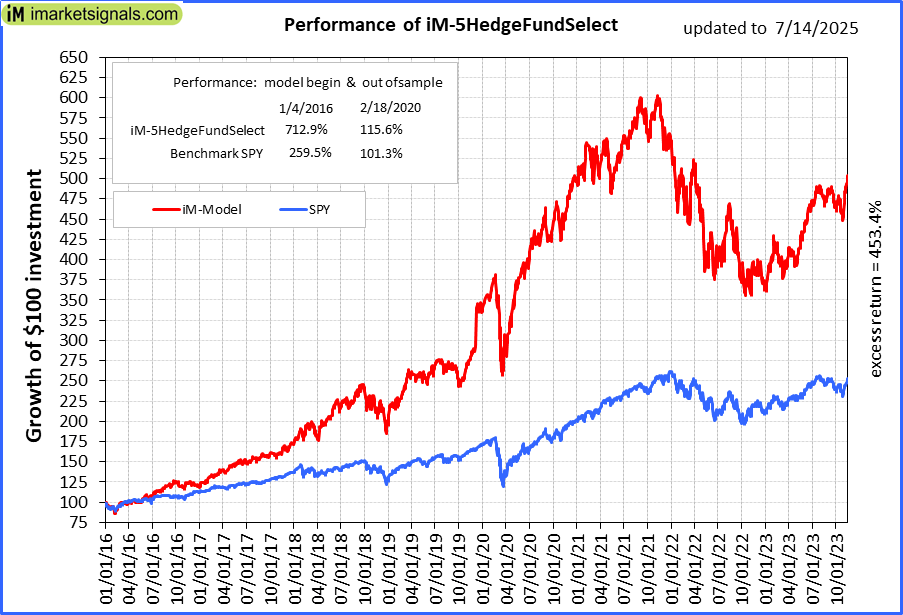 |
iM-5HedgeFundSelect: Since inception, on 1/5/2016, the model gained 712.89% while the benchmark SPY gained 259.54% over the same period. Over the previous week the market value of iM-5HedgeFundSelect gained 0.45% at a time when SPY gained 0.67%. A starting capital of $25,000 at inception on 1/5/2016 would have grown to $203,223 which includes -$3,072 cash and excludes $2,660 spent on fees and slippage. |
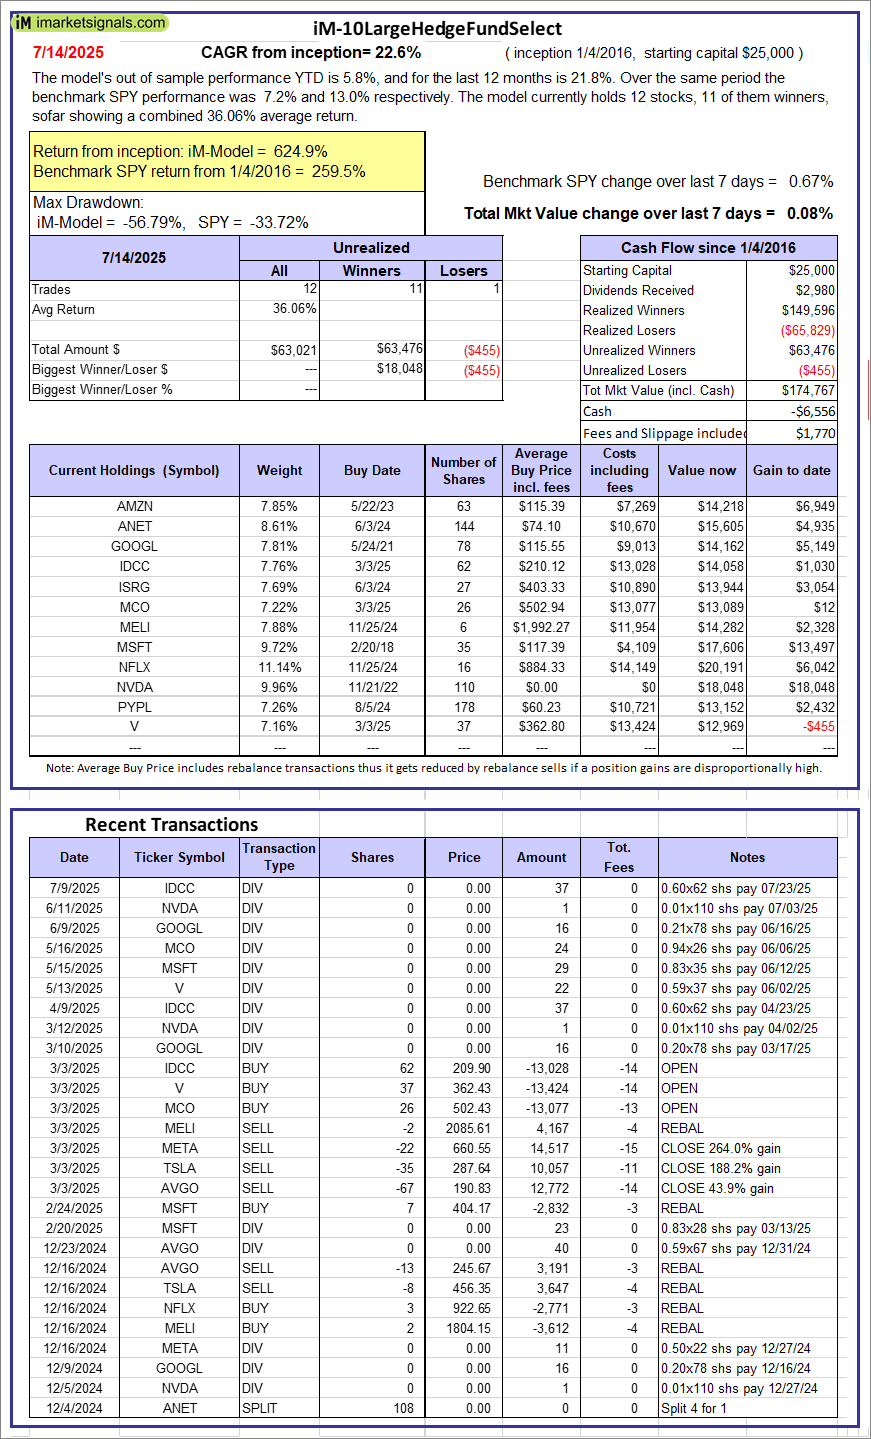 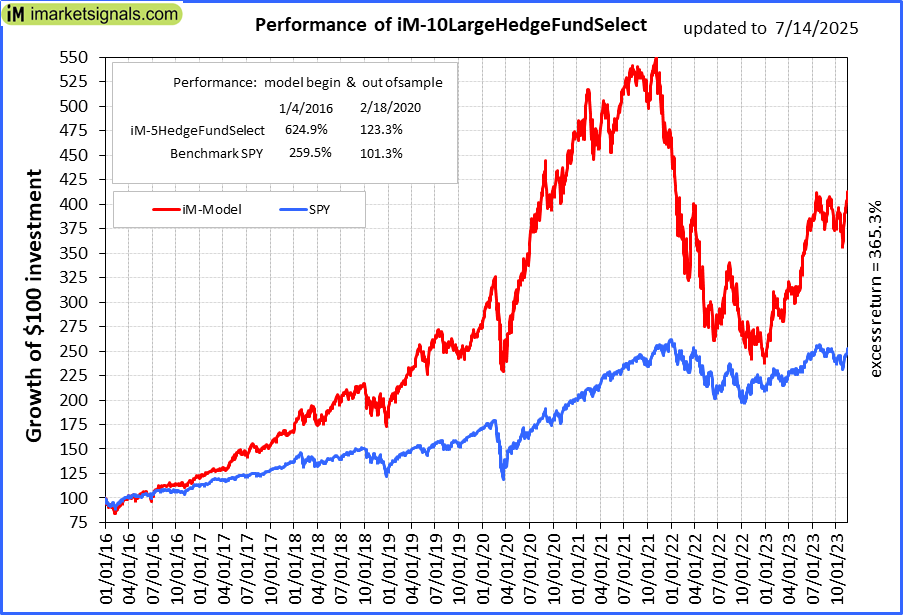 |
iM-10LargeHedgeFundSelect: Since inception, on 1/5/2016, the model gained 624.86% while the benchmark SPY gained 259.54% over the same period. Over the previous week the market value of iM-10LargeHedgeFundSelect gained 0.08% at a time when SPY gained 0.67%. A starting capital of $25,000 at inception on 1/5/2016 would have grown to $174,767 which includes -$6,556 cash and excludes $1,770 spent on fees and slippage. |
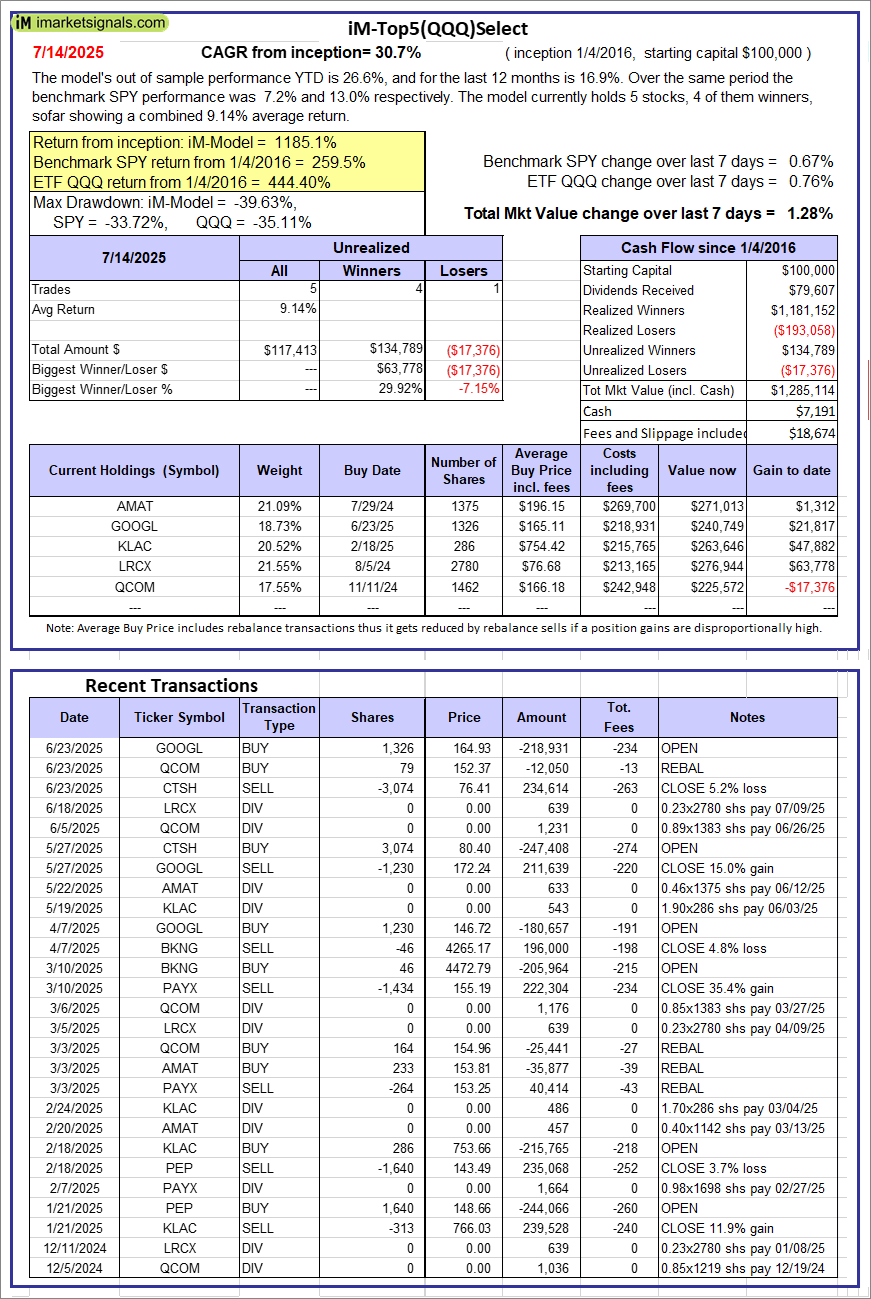 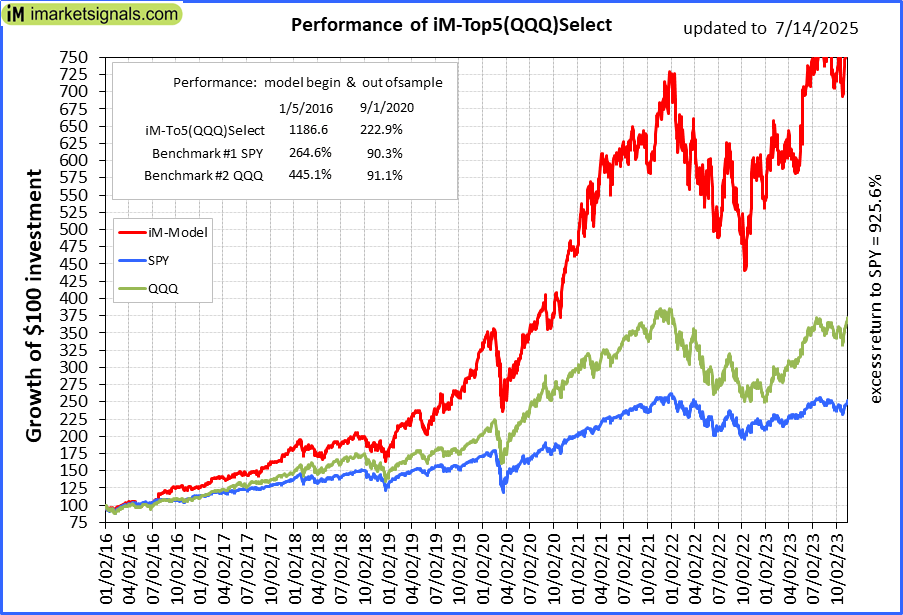 |
iM-Top5(QQQ)Select: Since inception, on 1/5/2016, the model gained 1185.11% while the benchmark SPY gained 259.54% over the same period. Over the previous week the market value of iM-Top5(QQQ)Select gained 1.28% at a time when SPY gained 0.67%. A starting capital of $100,000 at inception on 1/5/2016 would have grown to $1,285,114 which includes $7,191 cash and excludes $18,674 spent on fees and slippage. |
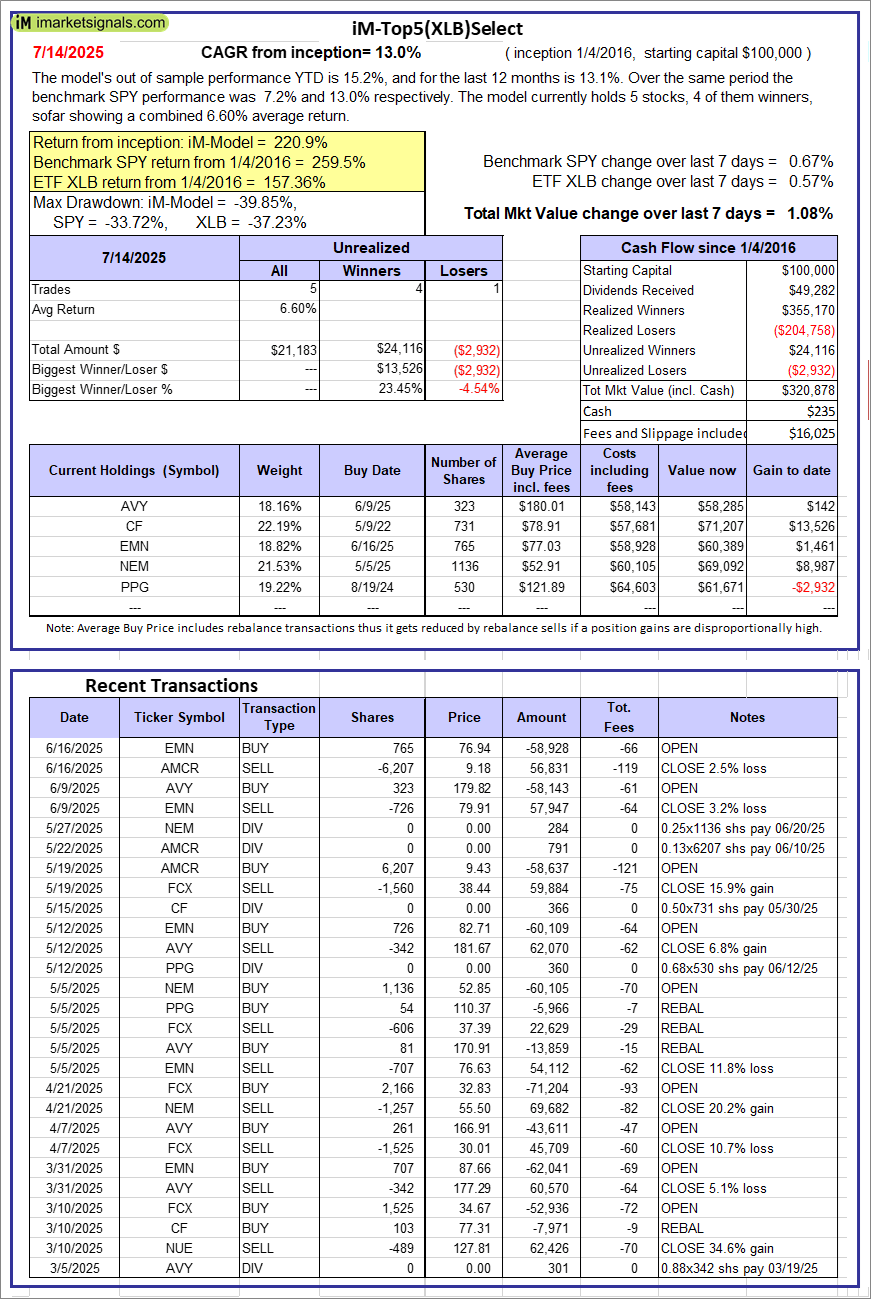 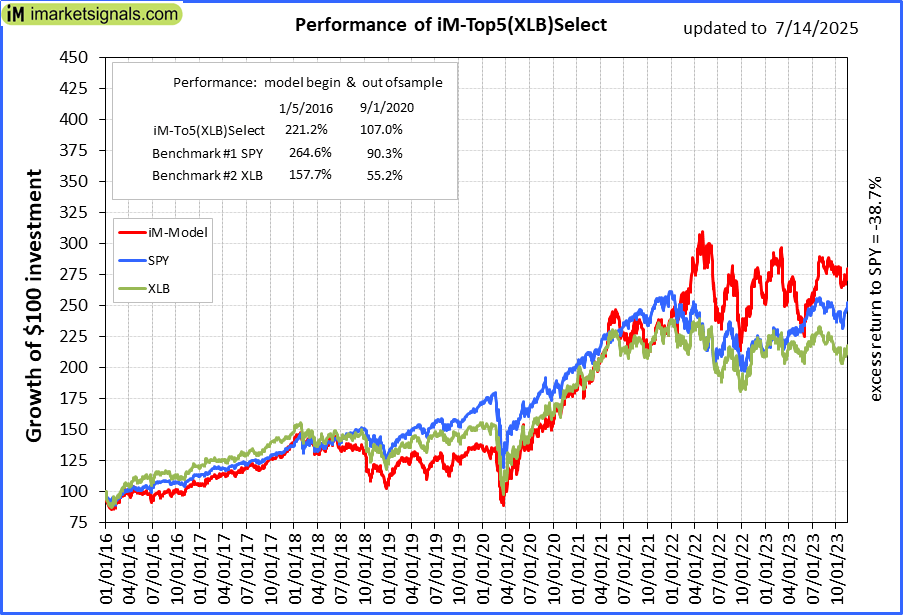 |
iM-Top5(XLB)Select: Since inception, on 1/5/2016, the model gained 220.88% while the benchmark SPY gained 259.54% over the same period. Over the previous week the market value of iM-Top5(XLB)Select gained 1.08% at a time when SPY gained 0.67%. A starting capital of $100,000 at inception on 1/5/2016 would have grown to $320,878 which includes $235 cash and excludes $16,025 spent on fees and slippage. |
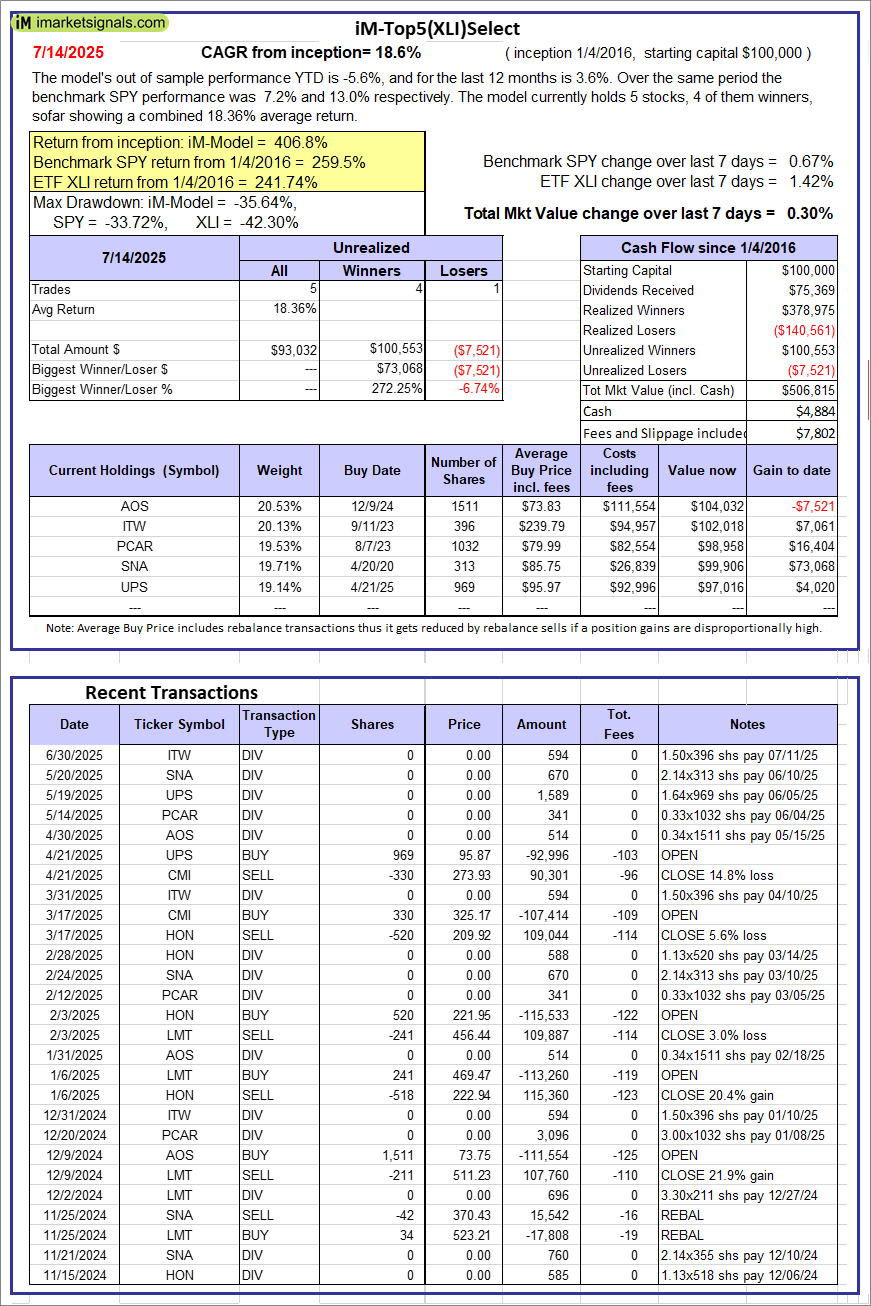 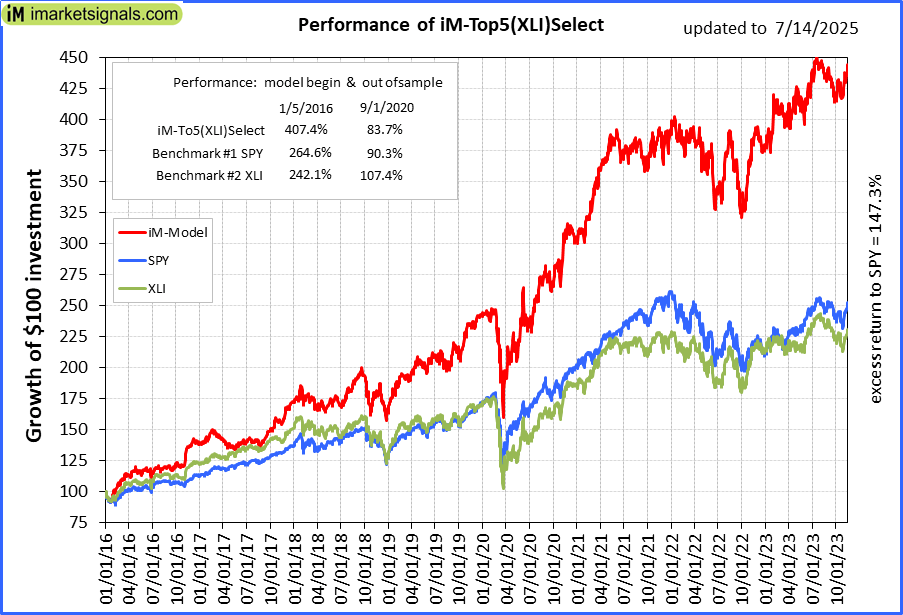 |
iM-Top5(XLI)Select: Since inception, on 1/5/2016, the model gained 406.82% while the benchmark SPY gained 259.54% over the same period. Over the previous week the market value of iM-Top5(XLI)Select gained 0.30% at a time when SPY gained 0.67%. A starting capital of $100,000 at inception on 1/5/2016 would have grown to $506,815 which includes $4,884 cash and excludes $7,802 spent on fees and slippage. |
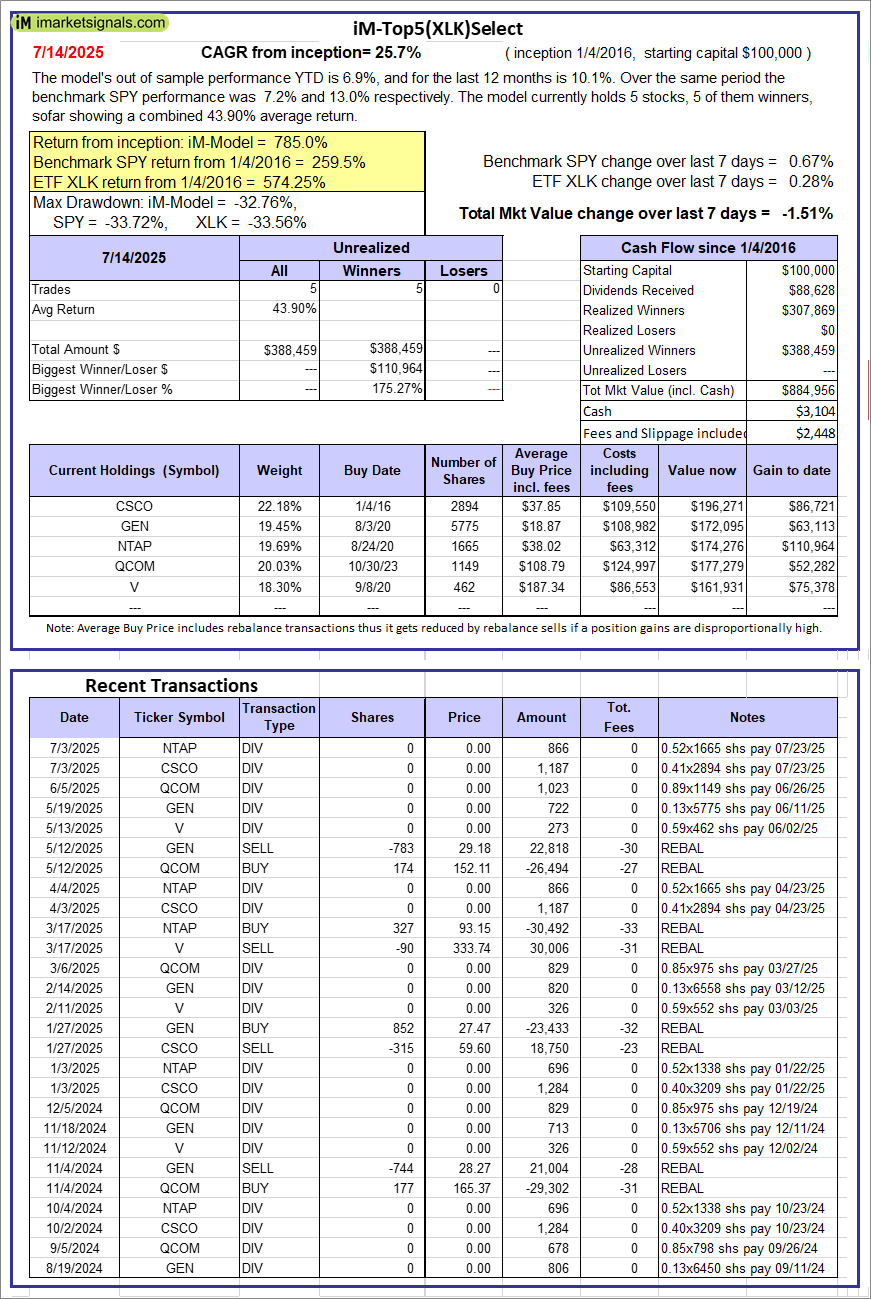 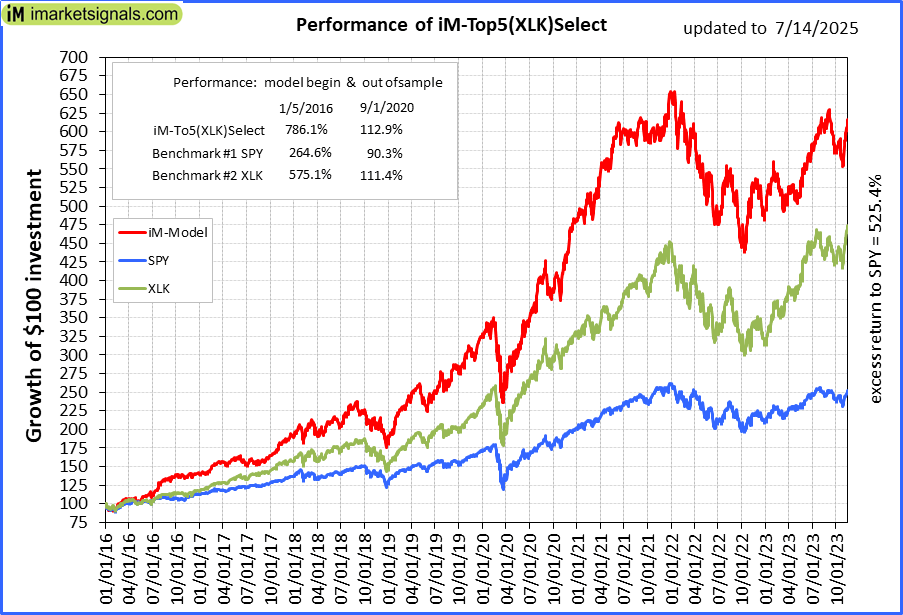 |
iM-Top5(XLK)Select: Since inception, on 1/5/2016, the model gained 784.96% while the benchmark SPY gained 259.54% over the same period. Over the previous week the market value of iM-Top5(XLK)Select gained -1.51% at a time when SPY gained 0.67%. A starting capital of $100,000 at inception on 1/5/2016 would have grown to $884,956 which includes $3,104 cash and excludes $2,448 spent on fees and slippage. |
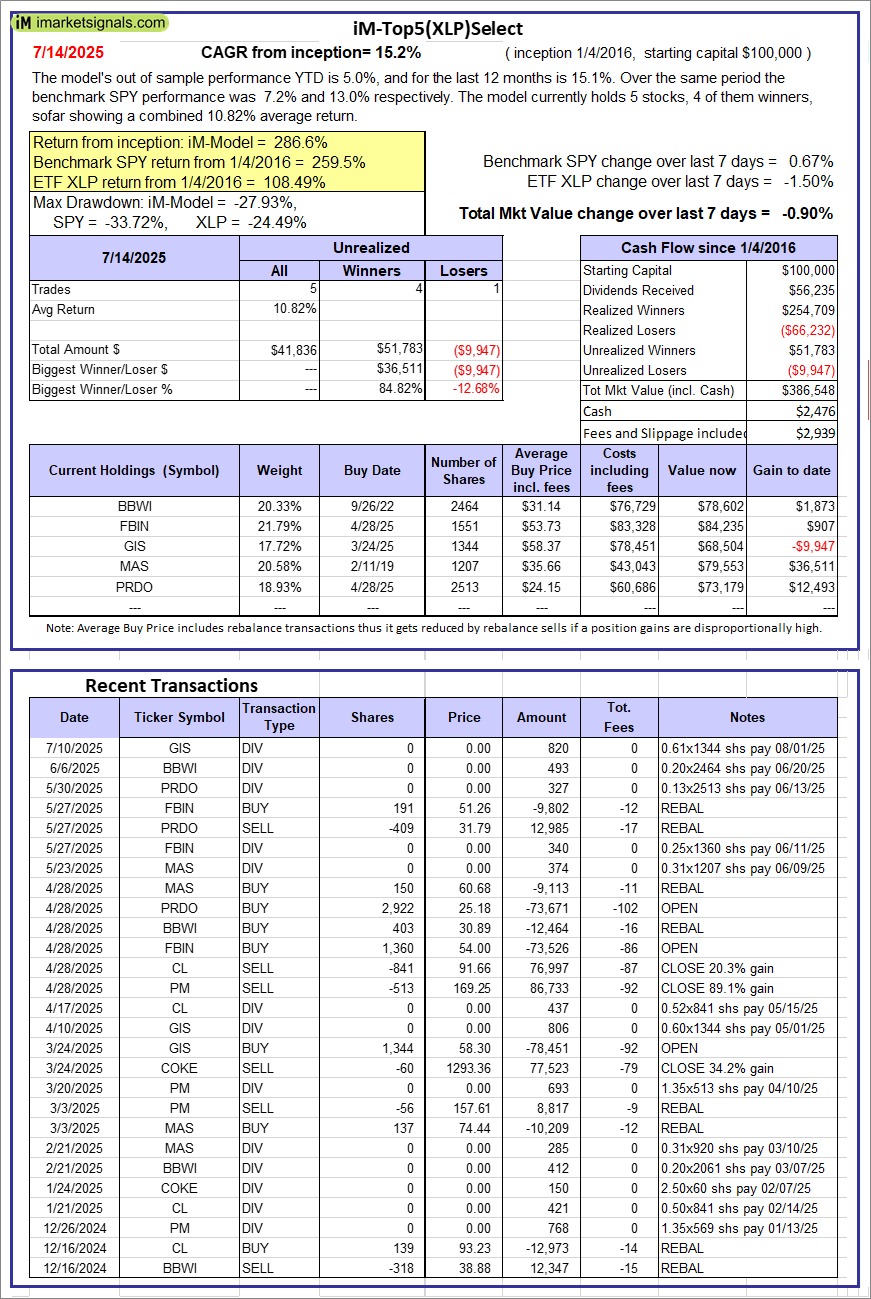 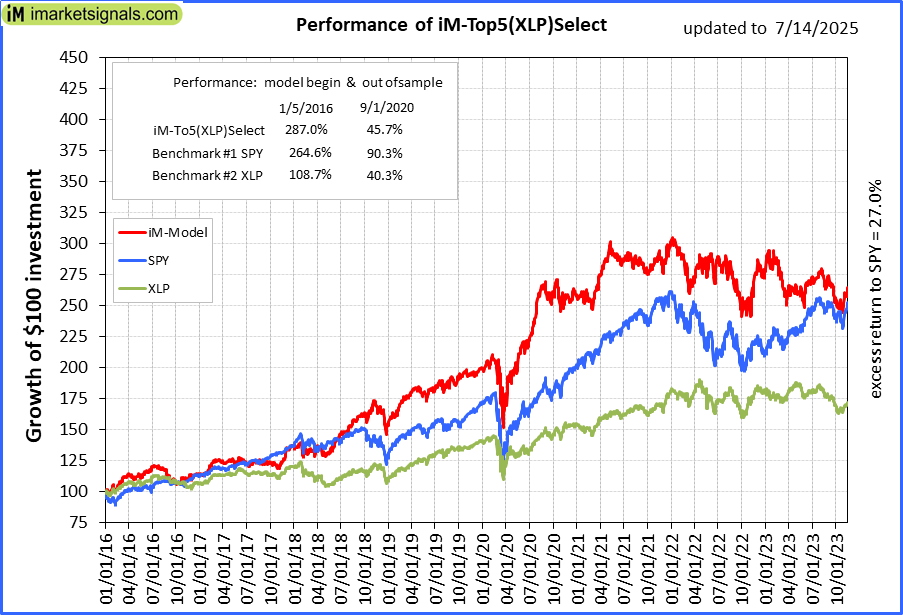 |
iM-Top5(XLP)Select: Since inception, on 1/5/2016, the model gained 286.55% while the benchmark SPY gained 259.54% over the same period. Over the previous week the market value of iM-Top5(XLP)Select gained -0.90% at a time when SPY gained 0.67%. A starting capital of $100,000 at inception on 1/5/2016 would have grown to $386,548 which includes $2,476 cash and excludes $2,939 spent on fees and slippage. |
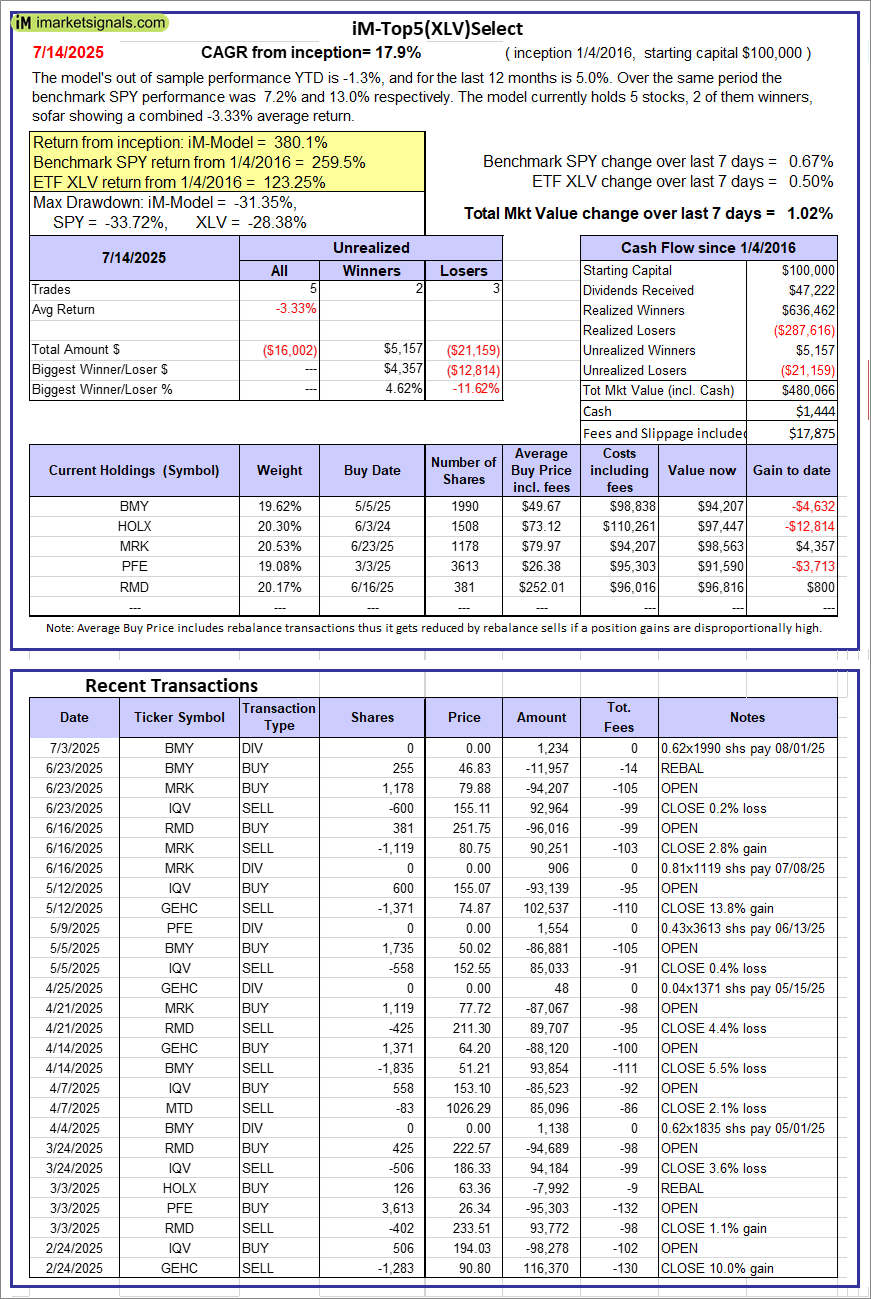 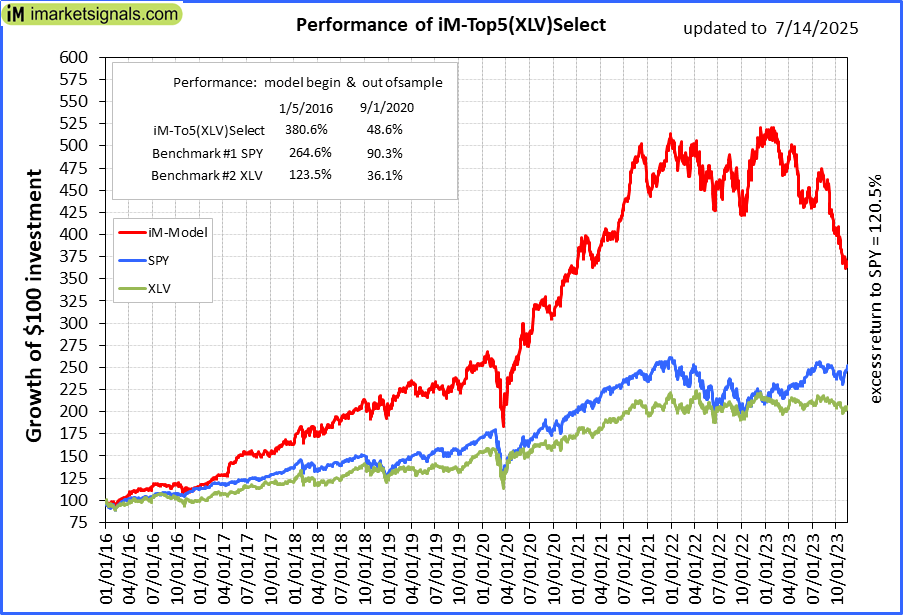 |
iM-Top5(XLV)Select: Since inception, on 1/5/2016, the model gained 380.07% while the benchmark SPY gained 259.54% over the same period. Over the previous week the market value of iM-Top5(XLV)Select gained 1.02% at a time when SPY gained 0.67%. A starting capital of $100,000 at inception on 1/5/2016 would have grown to $480,066 which includes $1,444 cash and excludes $17,875 spent on fees and slippage. |
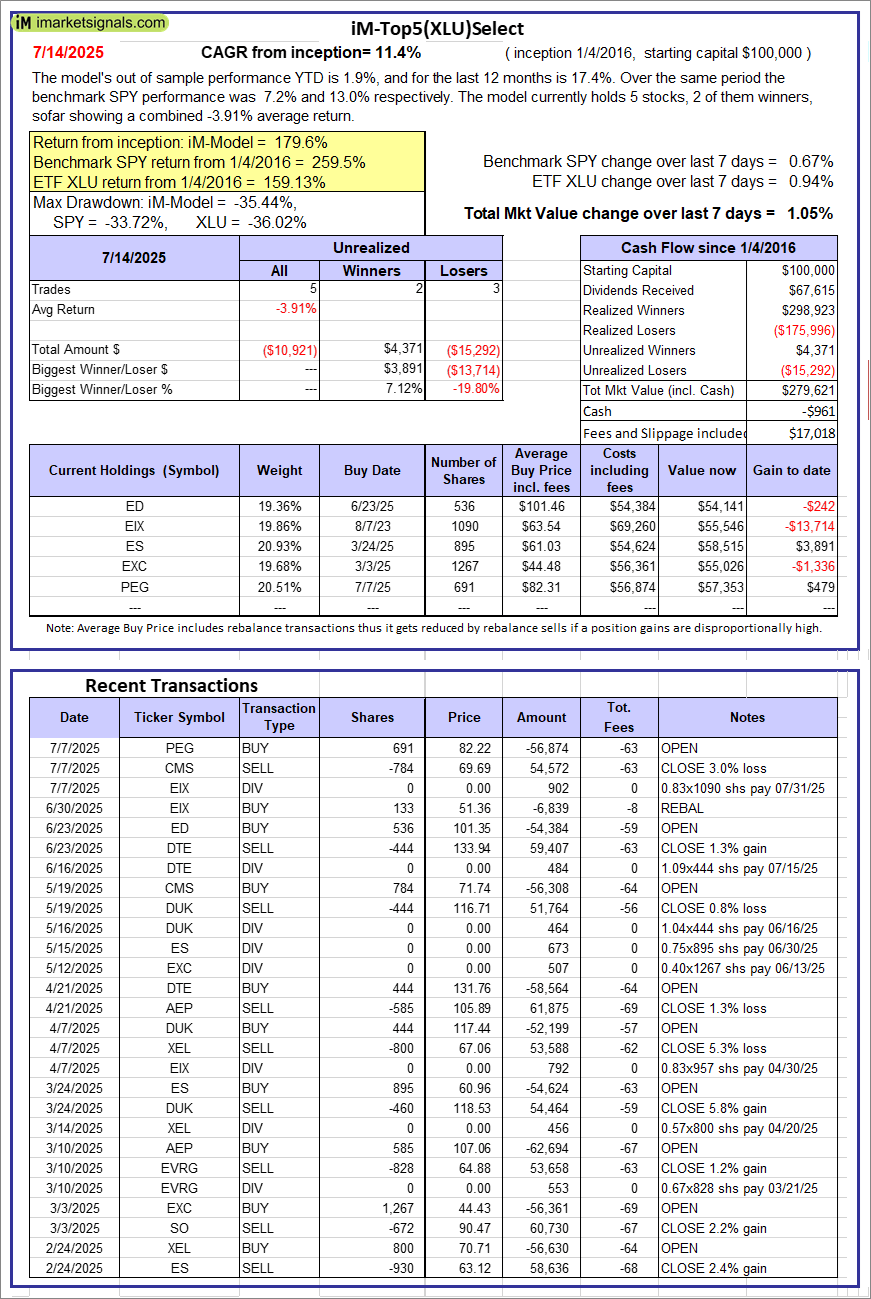 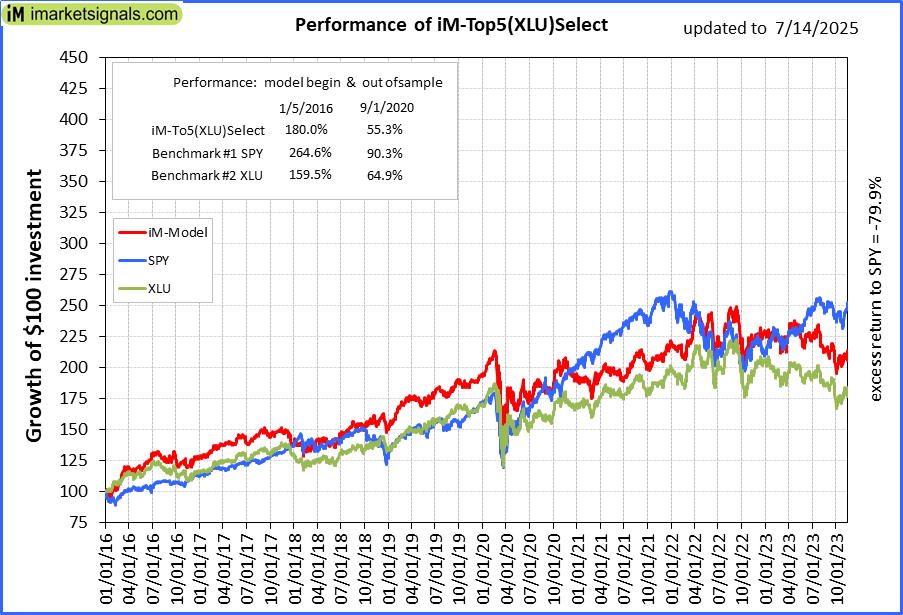 |
iM-Top5(XLU)Select: Since inception, on 1/5/2016, the model gained 179.62% while the benchmark SPY gained 259.54% over the same period. Over the previous week the market value of iM-Top5(XLU)Select gained 1.05% at a time when SPY gained 0.67%. A starting capital of $100,000 at inception on 1/5/2016 would have grown to $279,621 which includes -$961 cash and excludes $17,018 spent on fees and slippage. |
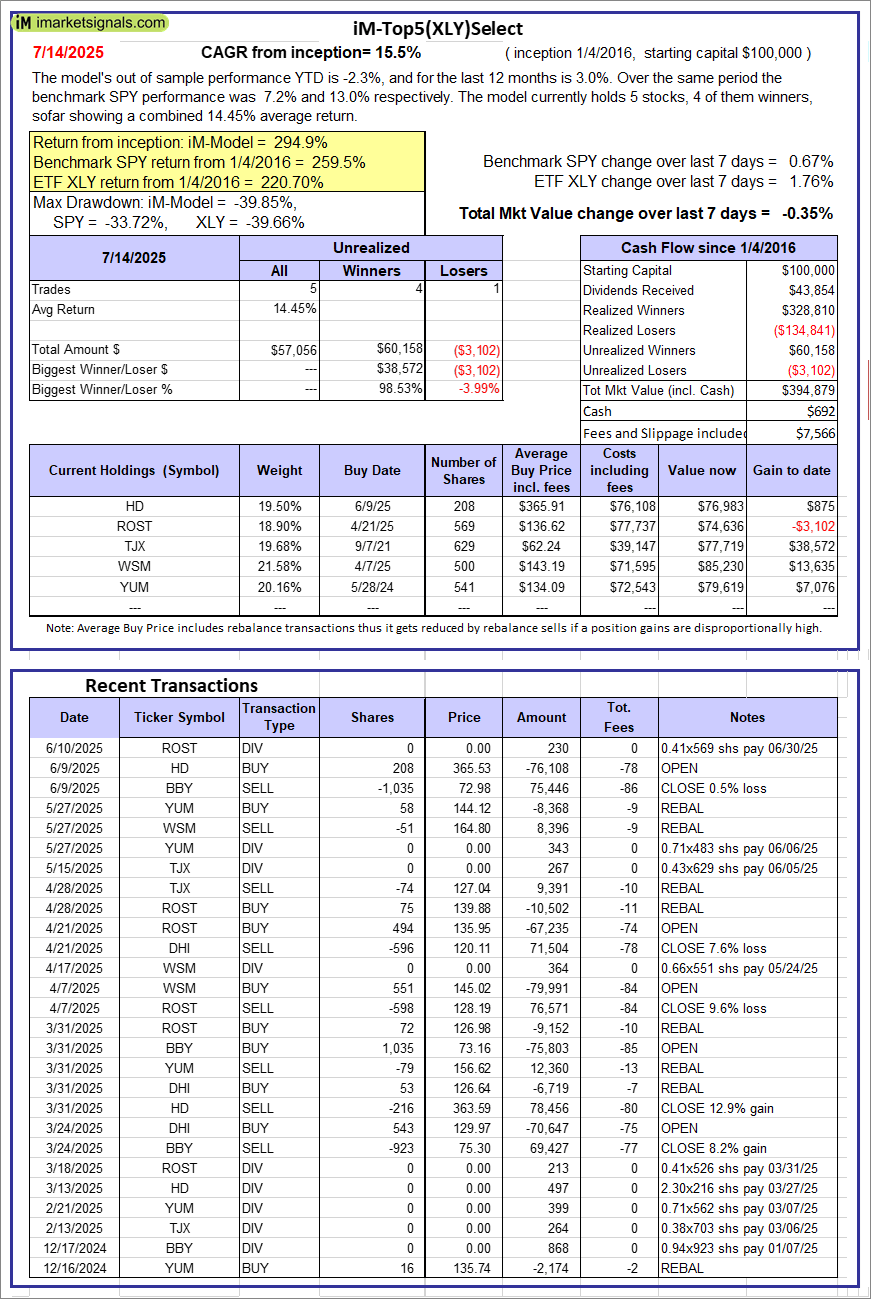 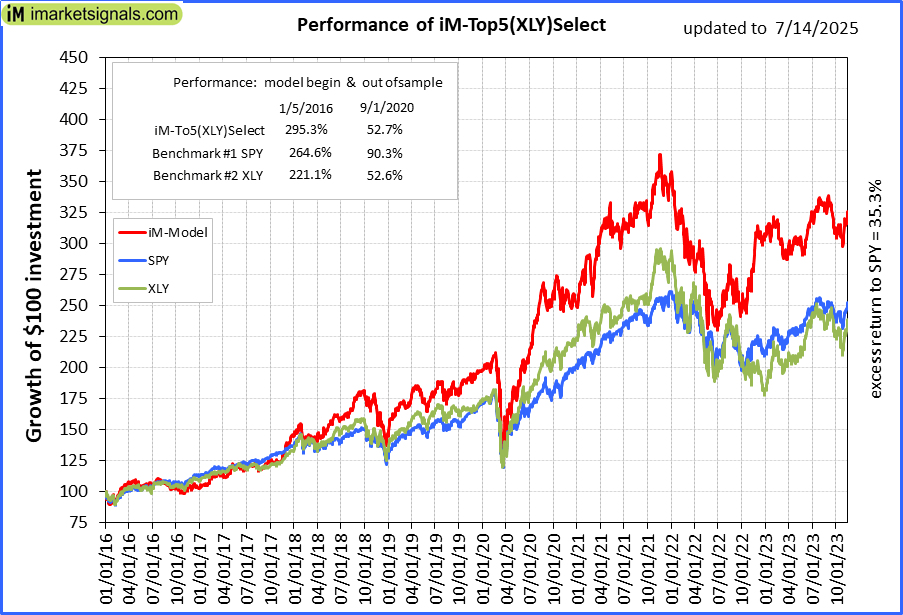 |
iM-Top5(XLY)Select: Since inception, on 1/5/2016, the model gained 294.88% while the benchmark SPY gained 259.54% over the same period. Over the previous week the market value of iM-Top5(XLY)Select gained -0.35% at a time when SPY gained 0.67%. A starting capital of $100,000 at inception on 1/5/2016 would have grown to $394,879 which includes $692 cash and excludes $7,566 spent on fees and slippage. |
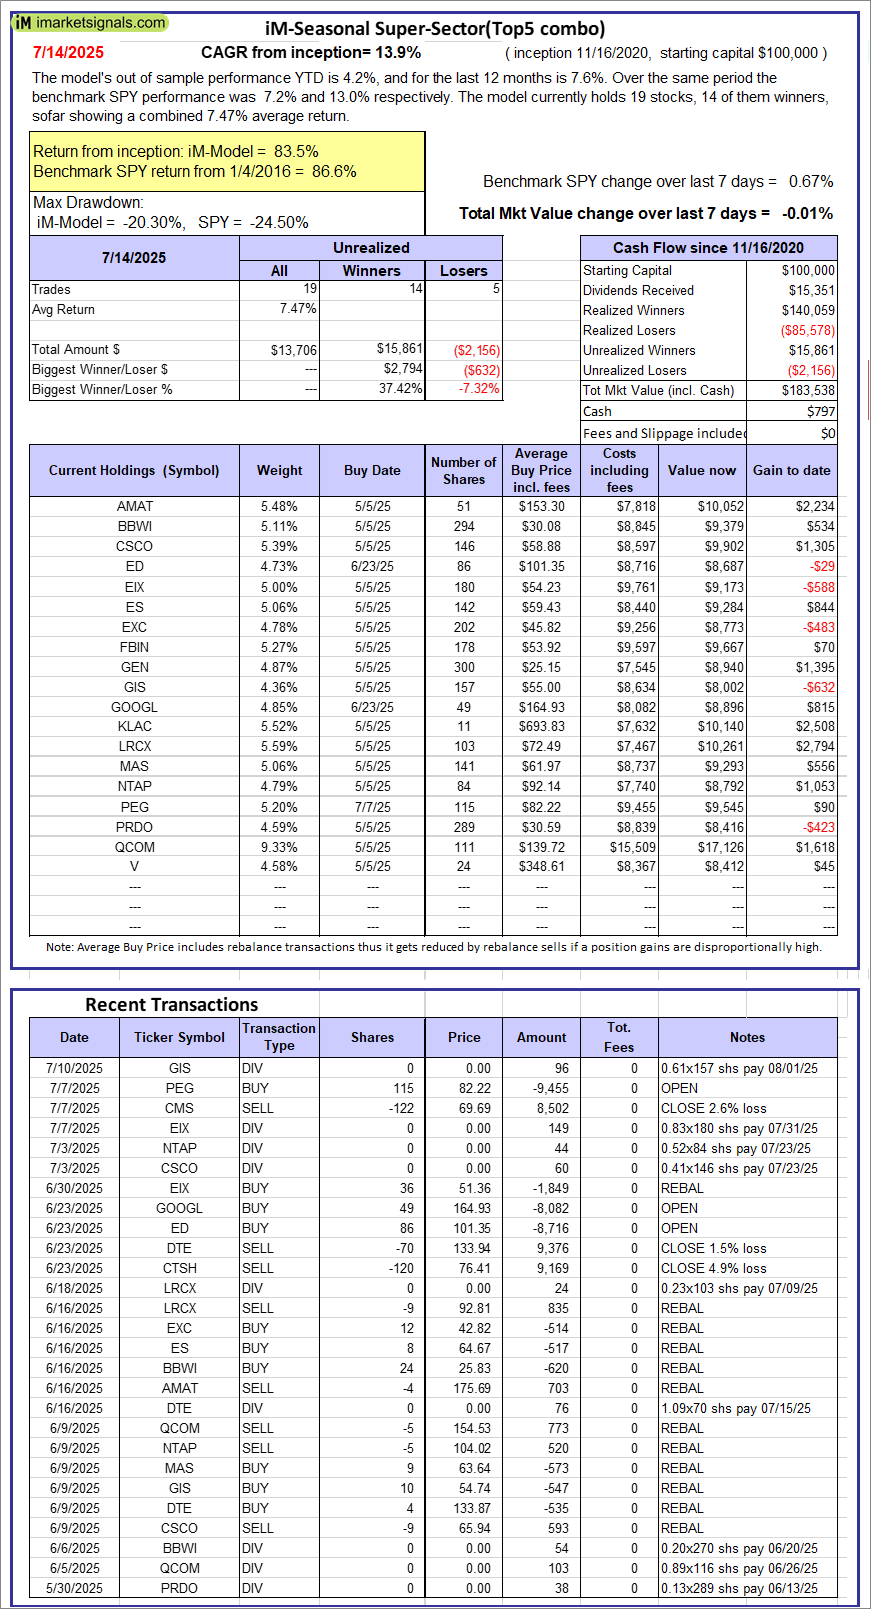 |
iM-Seasonal Super-Sectors (Top5 combo) : Since inception, on 11/17/2020, the model gained 83.54% while the benchmark SPY gained 86.64% over the same period. Over the previous week the market value of iM-Seasonal Super-Sectors (Top5 combo) gained -0.01% at a time when SPY gained 0.67%. A starting capital of $100,000 at inception on 11/17/2020 would have grown to $183,538 which includes $797 cash and excludes $00 spent on fees and slippage. |
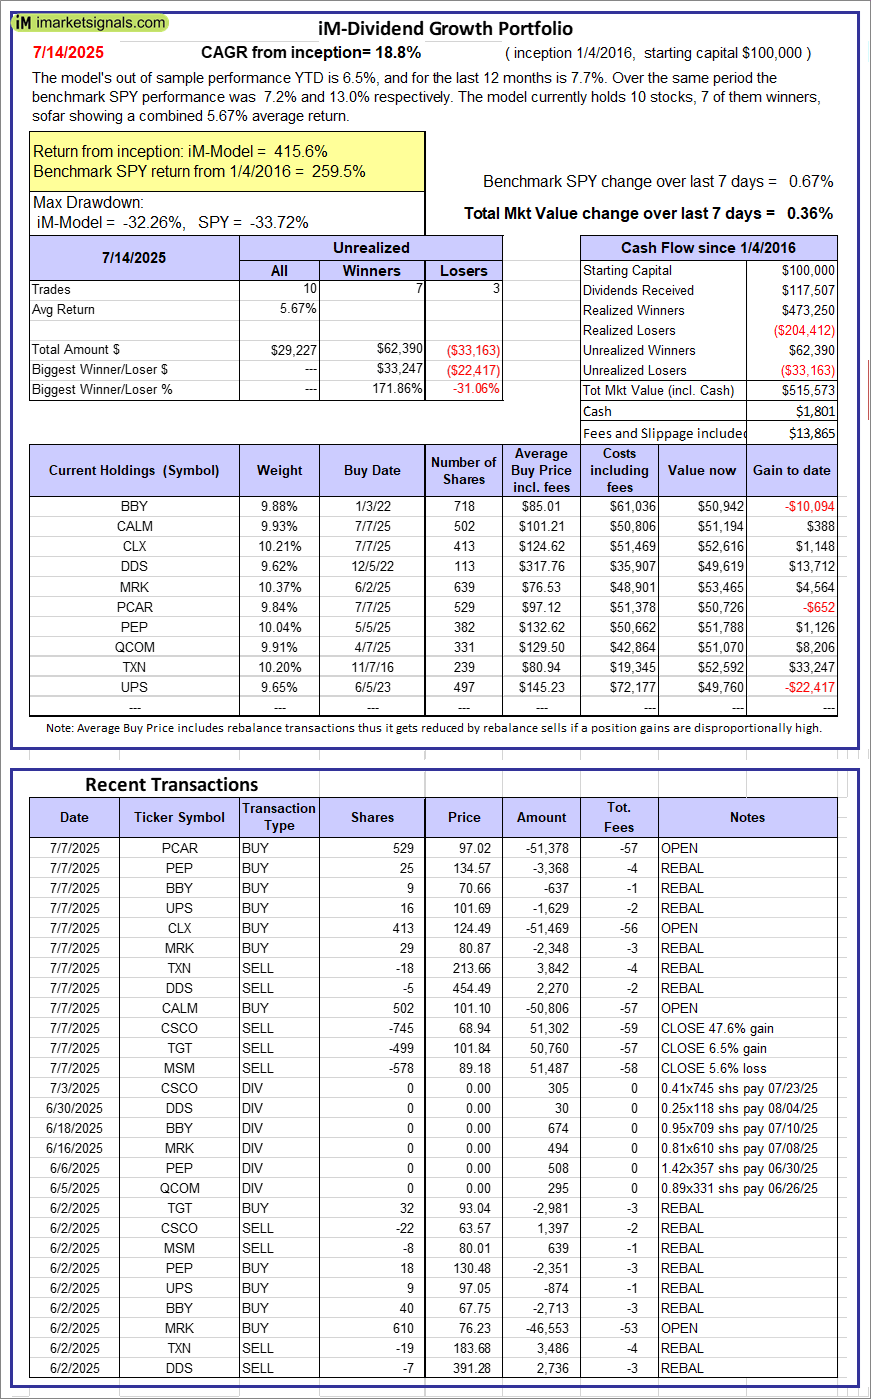 |
iM-Dividend Growth Portfolio: The model’s out of sample performance YTD is 6.5%, and for the last 12 months is 7.7%. Over the same period the benchmark SPY performance was 7.2% and 13.0% respectively. Over the previous week the market value of the iM-Dividend Growth Portfolio gained 0.36% at a time when SPY gained 0.67%. A starting capital of $100,000 at inception on 6/30/2016 would have grown to $515,573 which includes $1,801 cash and excludes $13,865 spent on fees and slippage. |
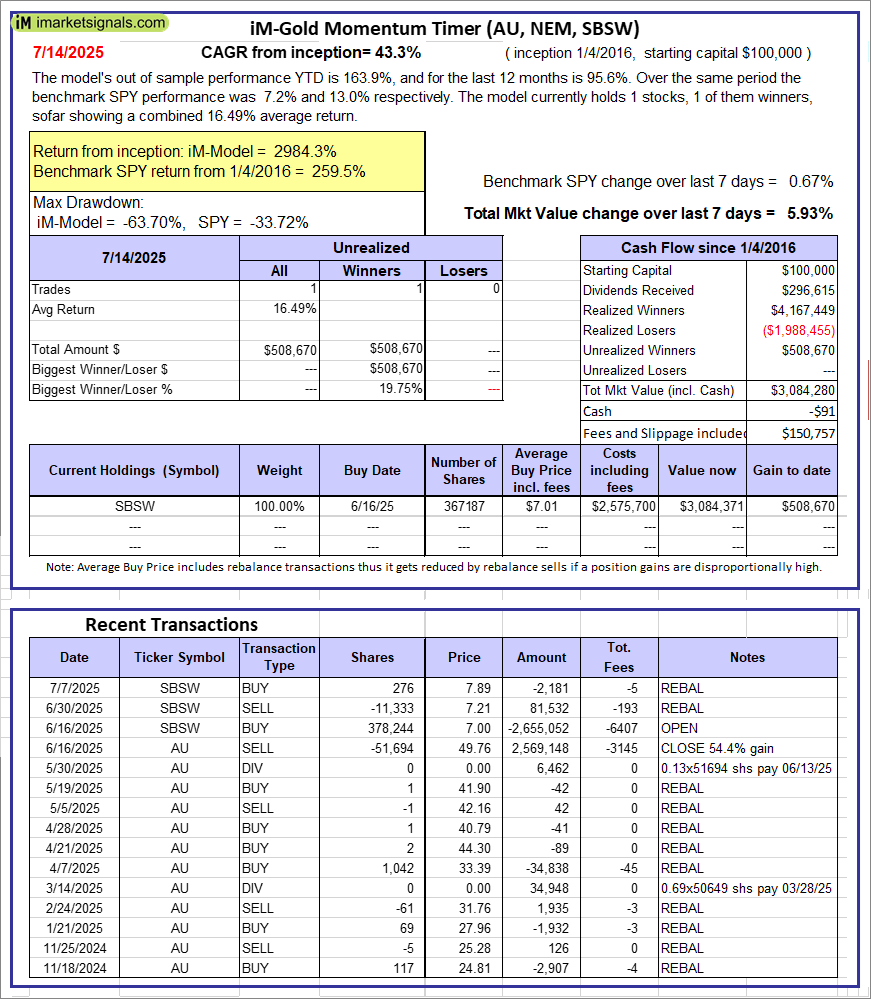 |
iM-Gold Momentum Timer (AU, NEM, SBSW): The model’s out of sample performance YTD is 163.9%, and for the last 12 months is 95.6%. Over the same period the benchmark SPY performance was 7.2% and 13.0% respectively. Over the previous week the market value of iM-Gold Momentum Timer (AU, NEM, SBSW) gained 5.93% at a time when SPY gained 0.67%. A starting capital of $100,000 at inception on 6/30/2016 would have grown to -$91 which includes $150,757 cash and excludes Gain to date spent on fees and slippage. |
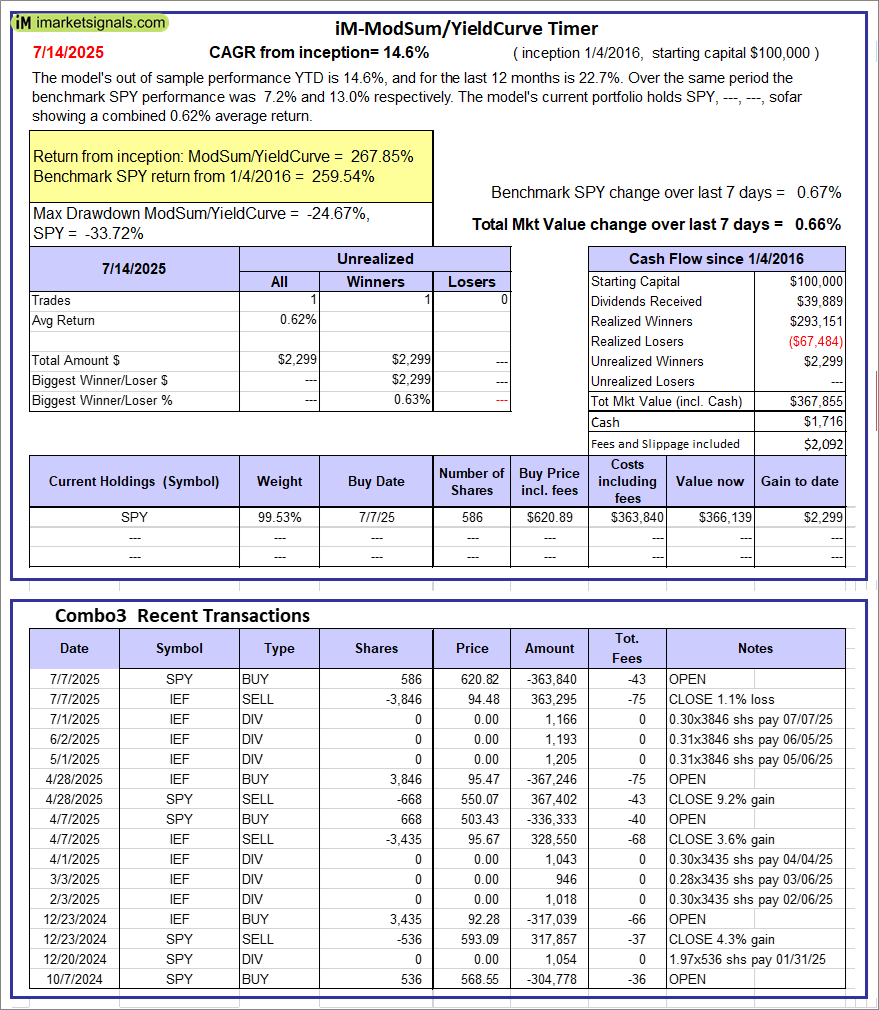 |
iM-ModSum/YieldCurve Timer: The model’s out of sample performance YTD is 14.6%, and for the last 12 months is 22.7%. Over the same period the benchmark SPY performance was 7.2% and 13.0% respectively. Over the previous week the market value of iM-PortSum/YieldCurve Timer gained 0.66% at a time when SPY gained 0.67%. A starting capital of $100,000 at inception on 1/1/2016 would have grown to $367,855 which includes $1,716 cash and excludes $2,092 spent on fees and slippage. |
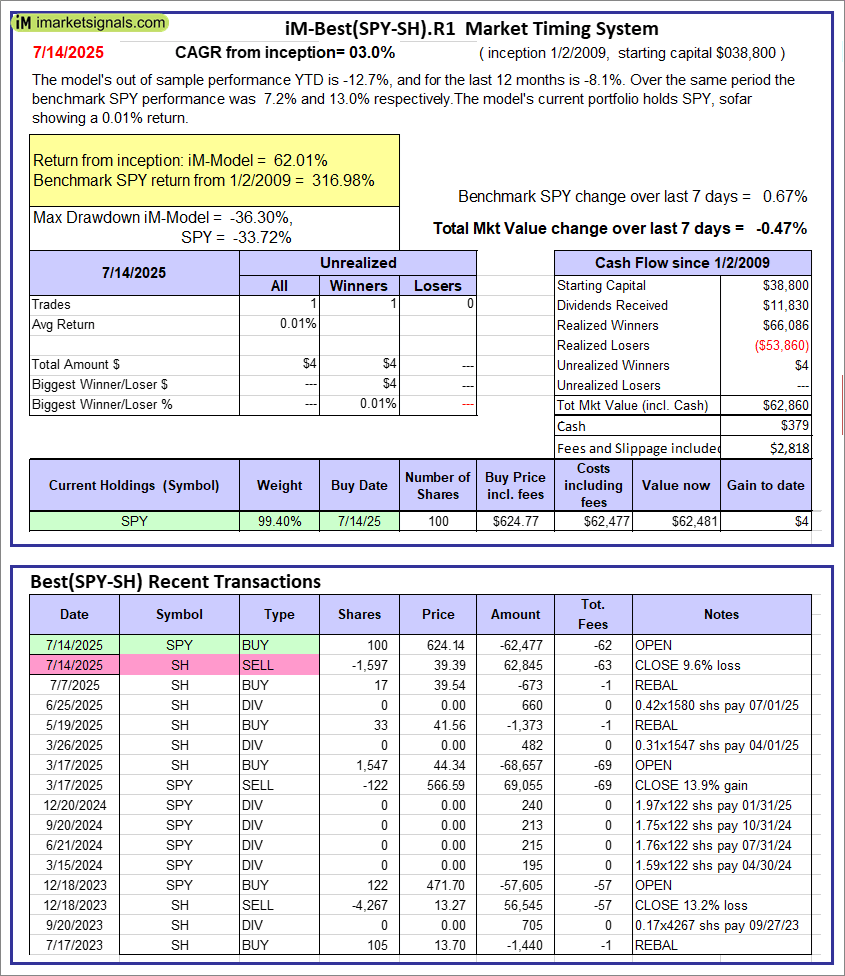 |
iM-Best(SPY-SH).R1: The model’s out of sample performance YTD is -12.7%, and for the last 12 months is -8.1%. Over the same period the benchmark SPY performance was 7.2% and 13.0% respectively. Over the previous week the market value of Best(SPY-SH) gained -0.47% at a time when SPY gained 0.67%. A starting capital of $100,000 at inception on 1/2/2009 would have grown to $62,860 which includes $379 cash and excludes $2,818 spent on fees and slippage. |
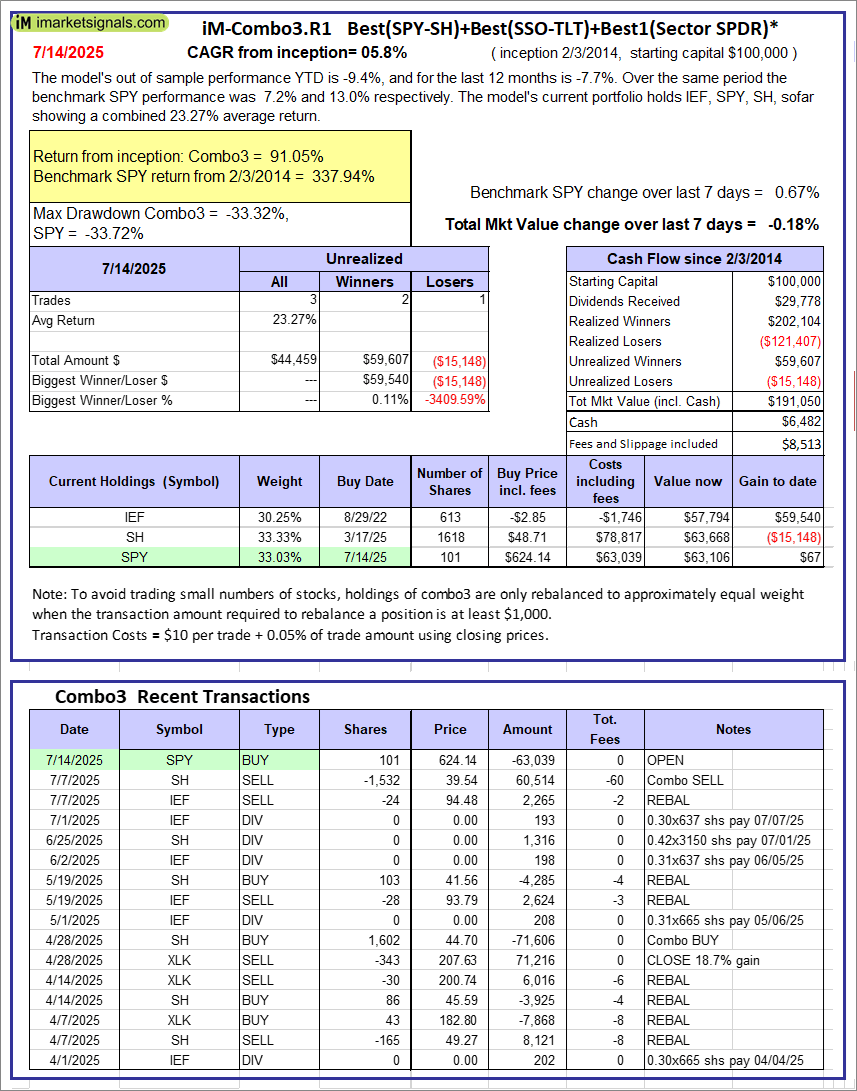 |
iM-Combo3.R1: The model’s out of sample performance YTD is -9.4%, and for the last 12 months is -7.7%. Over the same period the benchmark SPY performance was 7.2% and 13.0% respectively. Over the previous week the market value of iM-Combo3.R1 gained -0.18% at a time when SPY gained 0.67%. A starting capital of $100,000 at inception on 2/3/2014 would have grown to $191,050 which includes $6,482 cash and excludes $8,513 spent on fees and slippage. |
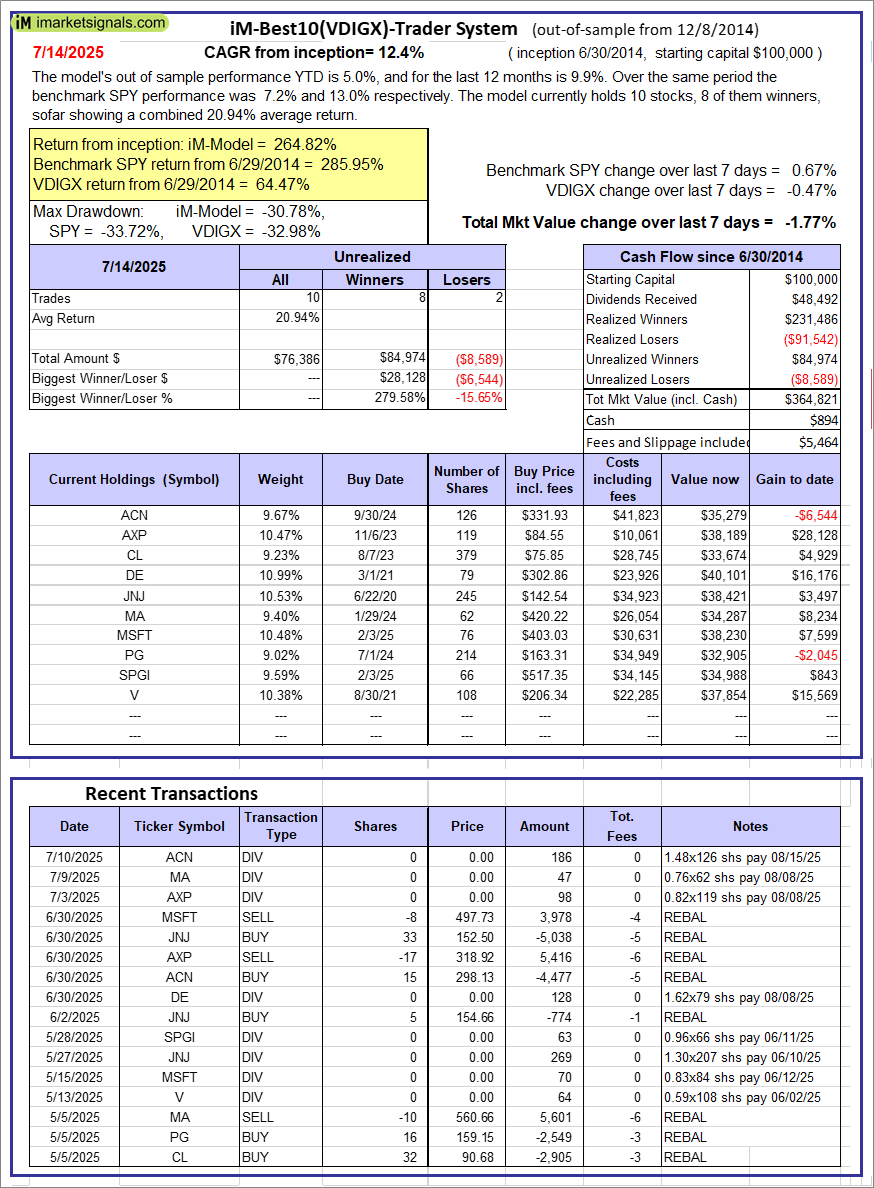 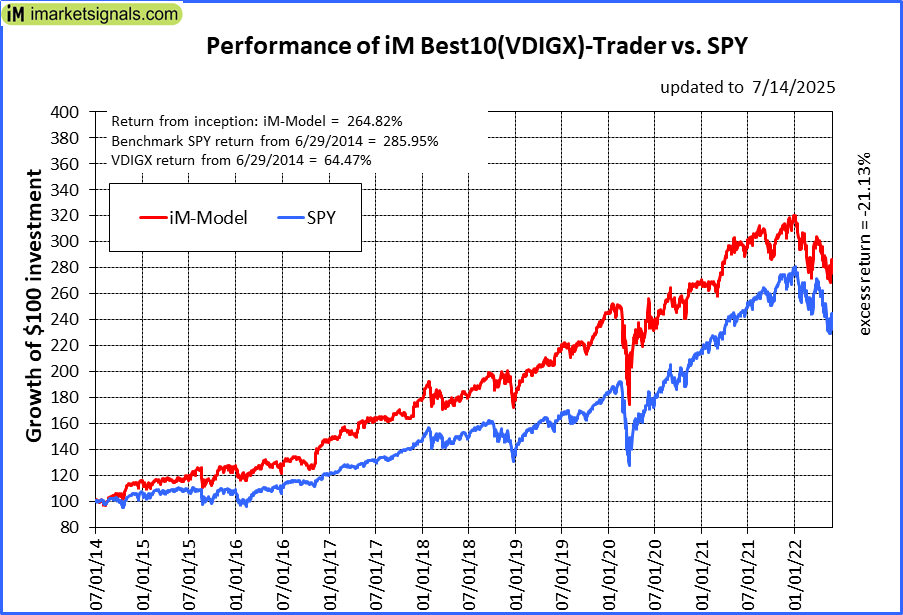 |
iM-Best10(VDIGX)-Trader: The model’s out of sample performance YTD is 5.0%, and for the last 12 months is 9.9%. Over the same period the benchmark SPY performance was 7.2% and 13.0% respectively. Since inception, on 7/1/2014, the model gained 264.82% while the benchmark SPY gained 285.95% and VDIGX gained 64.47% over the same period. Over the previous week the market value of iM-Best10(VDIGX) gained -1.77% at a time when SPY gained 0.67%. A starting capital of $100,000 at inception on 7/1/2014 would have grown to $364,821 which includes $894 cash and excludes $5,464 spent on fees and slippage. |
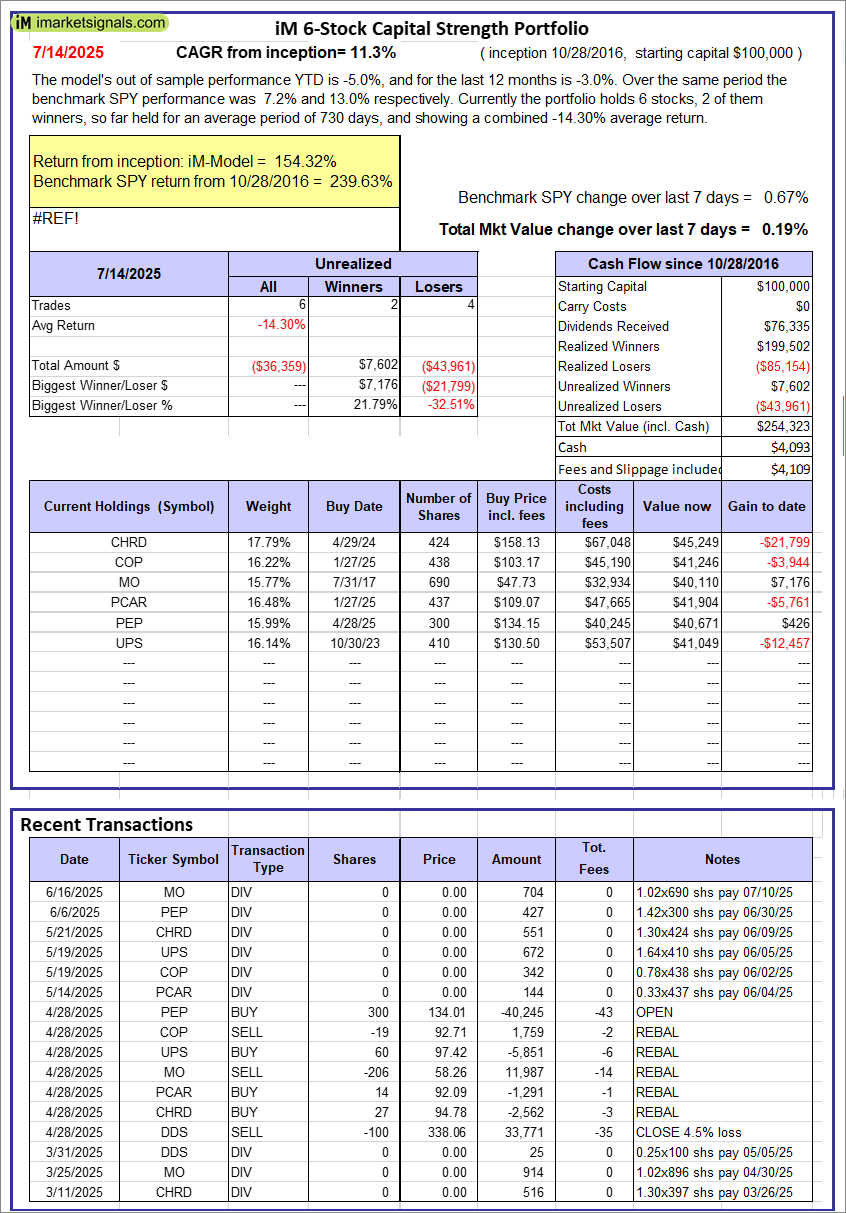 |
iM 6-Stock Capital Strength Portfolio: The model’s out of sample performance YTD is -5.0%, and for the last 12 months is -3.0%. Over the same period the benchmark SPY performance was 7.2% and 13.0% respectively. Over the previous week the market value of the iM 6-Stock Capital Strength Portfolio gained 0.19% at a time when SPY gained 0.67%. A starting capital of $100,000 at inception on 10/28/2016 would have grown to $254,323 which includes $4,093 cash and excludes $4,109 spent on fees and slippage. |
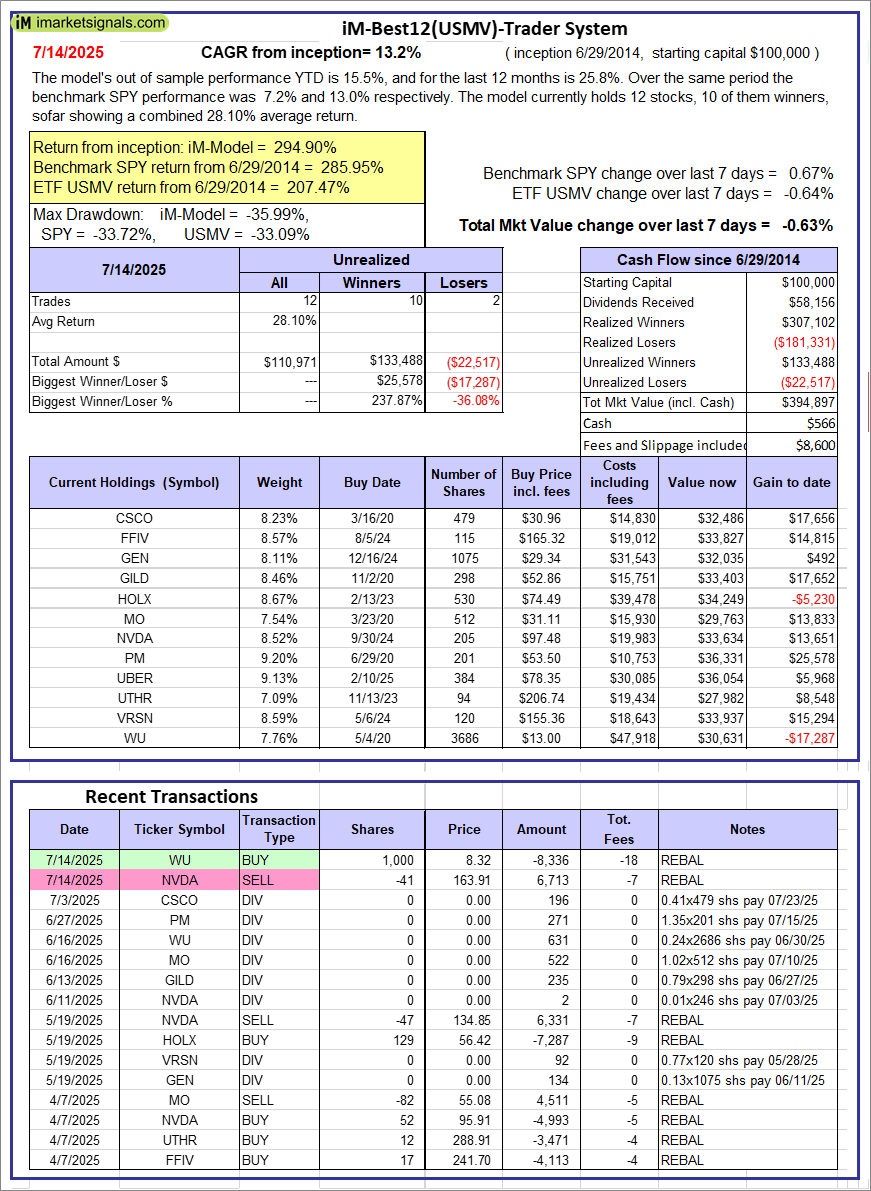 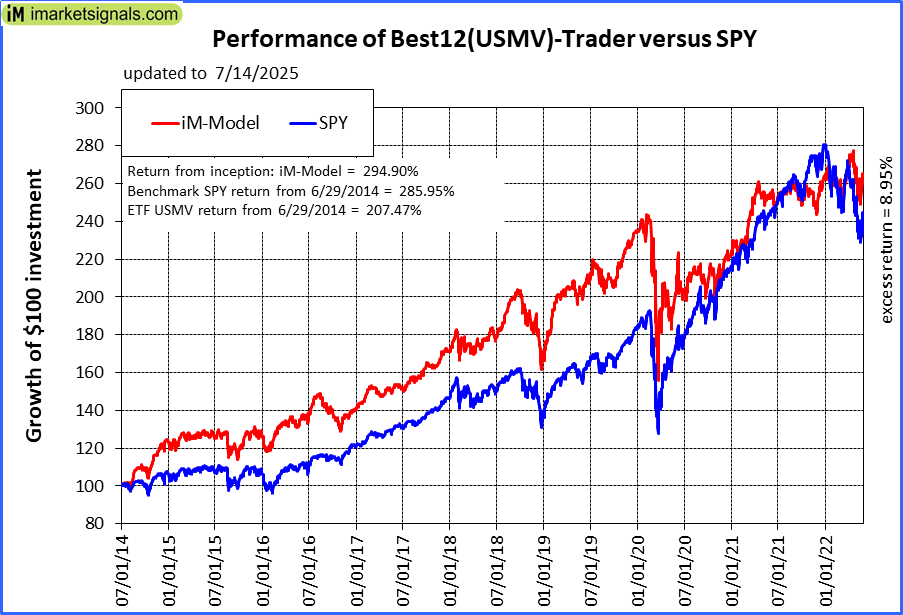 |
iM-Best12(USMV)-Trader: The model’s out of sample performance YTD is 15.5%, and for the last 12 months is 25.8%. Over the same period the benchmark SPY performance was 7.2% and 13.0% respectively. Since inception, on 6/30/2014, the model gained 294.90% while the benchmark SPY gained 285.95% and the ETF USMV gained 207.47% over the same period. Over the previous week the market value of iM-Best12(USMV)-Trader gained -0.63% at a time when SPY gained 0.67%. A starting capital of $100,000 at inception on 6/30/2014 would have grown to $394,897 which includes $566 cash and excludes $8,600 spent on fees and slippage. |
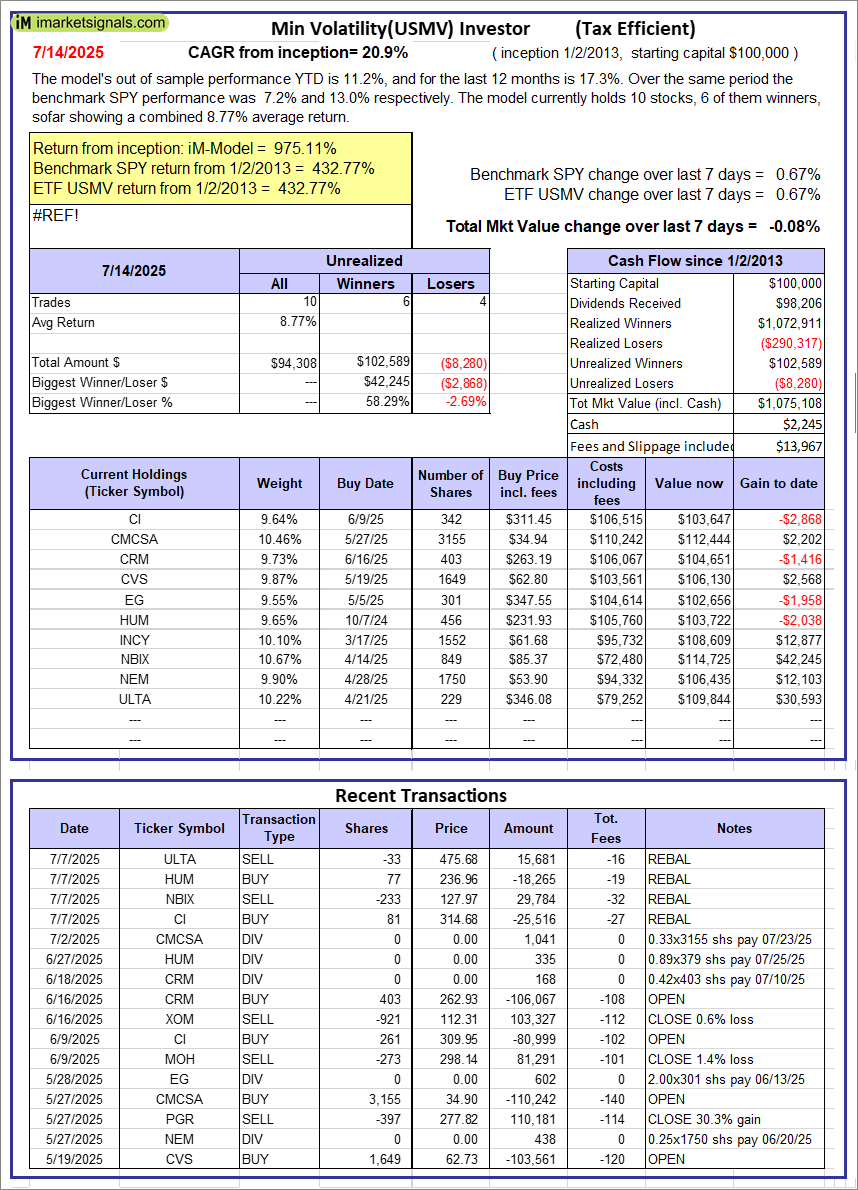 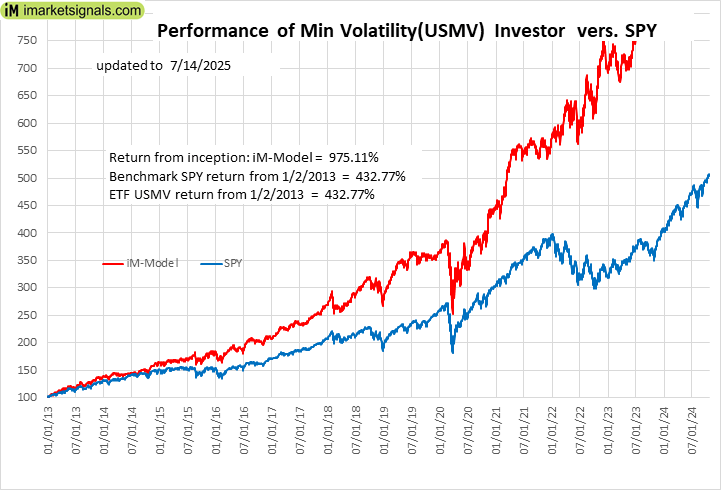 |
iM-Min Volatility(USMV) Investor (Tax Efficient): The model’s out of sample performance YTD is 11.2%, and for the last 12 months is 17.3%. Over the same period the benchmark SPY performance was 7.2% and 13.0% respectively. Since inception, on 1/3/2013, the model gained 975.11% while the benchmark SPY gained 432.77% and the ETF USMV gained 432.77% over the same period. Over the previous week the market value of iM-Best12(USMV)Q1 gained -0.08% at a time when SPY gained 0.67%. A starting capital of $100,000 at inception on 1/3/2013 would have grown to $1,075,108 which includes $2,245 cash and excludes $13,967 spent on fees and slippage. |
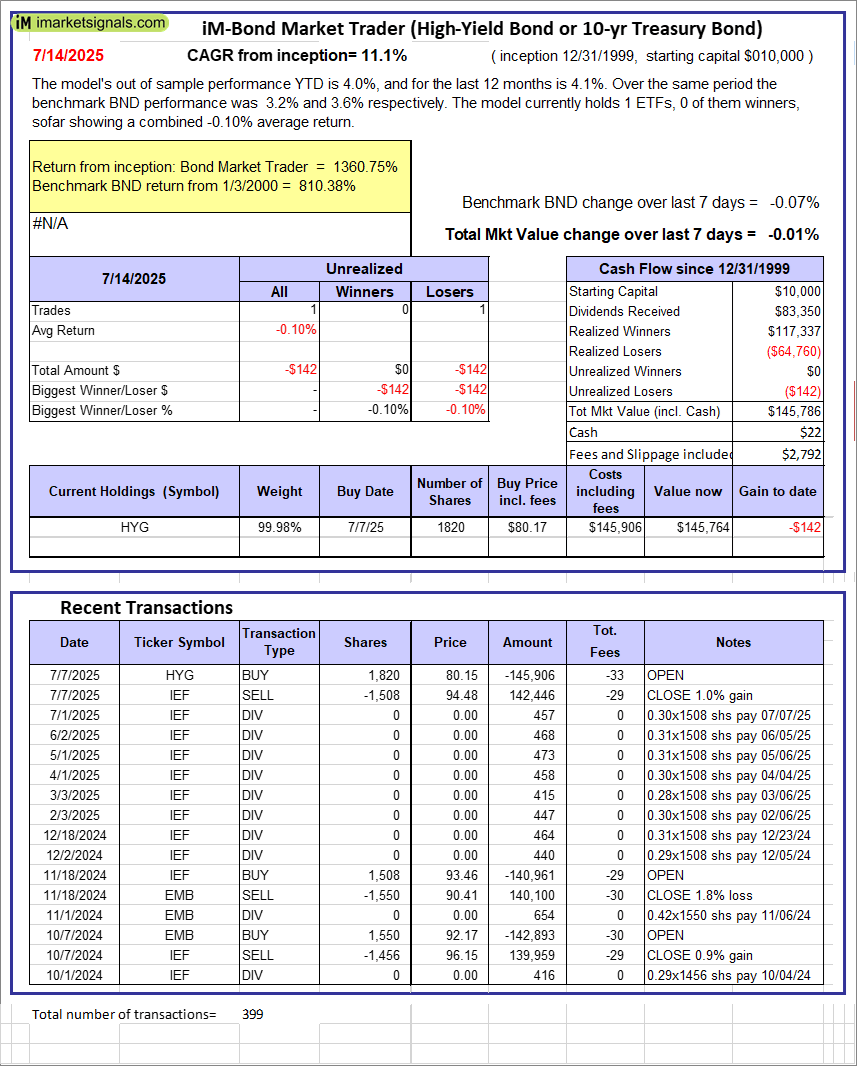 |
iM-Bond Market Trader (High-Yield Bond or 10-yr Treasury Bond): The model’s out of sample performance YTD is 4.0%, and for the last 12 months is 4.1%. Over the same period the benchmark BND performance was 3.2% and 3.6% respectively. Over the previous week the market value of the iM-Bond Market Trader (High-Yield Bond or 10-yr Treasury Bond) gained -0.01% at a time when BND gained -0.07%. A starting capital of $10,000 at inception on 1/3/2000 would have grown to $145,786 which includes $22 cash and excludes $2,792 spent on fees and slippage. |
|
|
iM-ModSum/YieldCurve Timer: The model’s out of sample performance YTD is 14.6%, and for the last 12 months is 22.7%. Over the same period the benchmark SPY performance was 7.2% and 13.0% respectively. Over the previous week the market value of iM-PortSum/YieldCurve Timer gained 0.66% at a time when SPY gained 0.67%. A starting capital of $100,000 at inception on 1/1/2016 would have grown to $367,855 which includes $1,716 cash and excludes $2,092 spent on fees and slippage. |
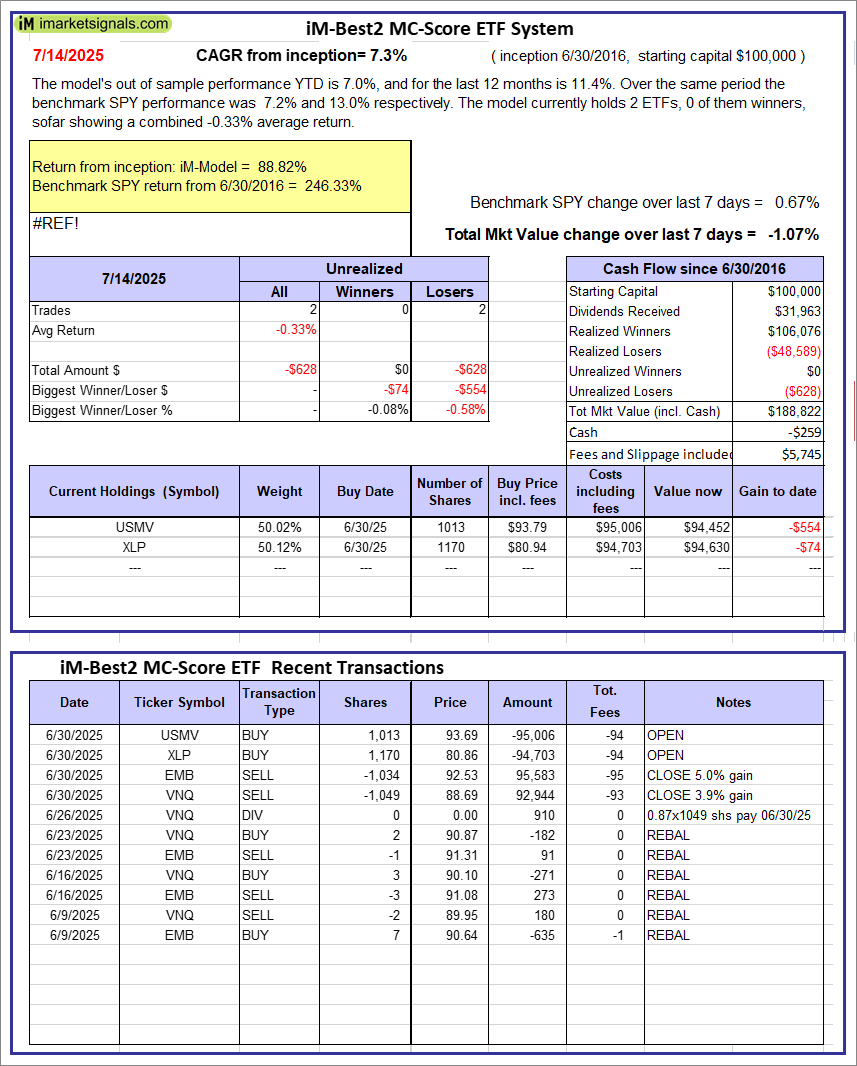 |
iM-Best2 MC-Score ETF System: The model’s out of sample performance YTD is 7.0%, and for the last 12 months is 11.4%. Over the same period the benchmark SPY performance was 7.2% and 13.0% respectively. Over the previous week the market value of the iM-Best2 MC-Score ETF System gained -1.07% at a time when SPY gained 0.67%. A starting capital of $100,000 at inception on 6/30/2016 would have grown to $188,822 which includes -$259 cash and excludes $5,745 spent on fees and slippage. |
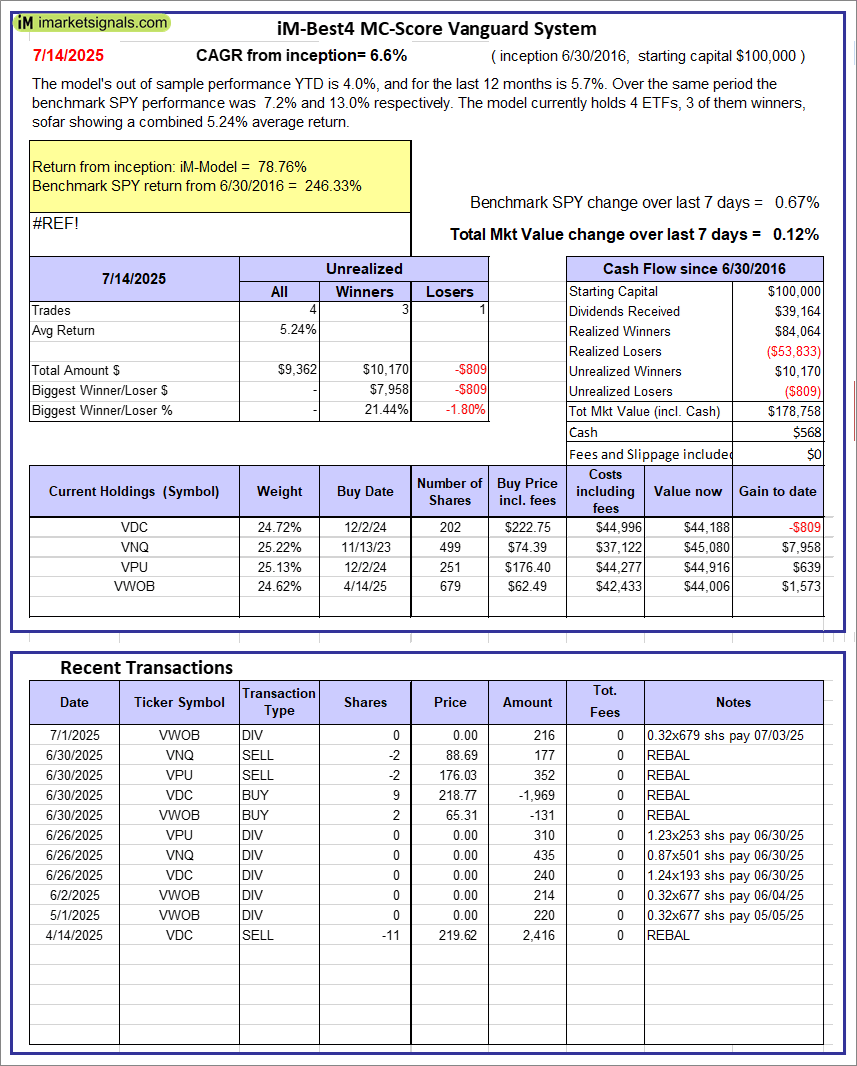 |
iM-Best4 MC-Score Vanguard System: The model’s out of sample performance YTD is 4.0%, and for the last 12 months is 5.7%. Over the same period the benchmark SPY performance was 7.2% and 13.0% respectively. Over the previous week the market value of the iM-Best4 MC-Score Vanguard System gained 0.12% at a time when SPY gained 0.67%. A starting capital of $100,000 at inception on 6/30/2016 would have grown to $178,758 which includes $568 cash and excludes $00 spent on fees and slippage. |
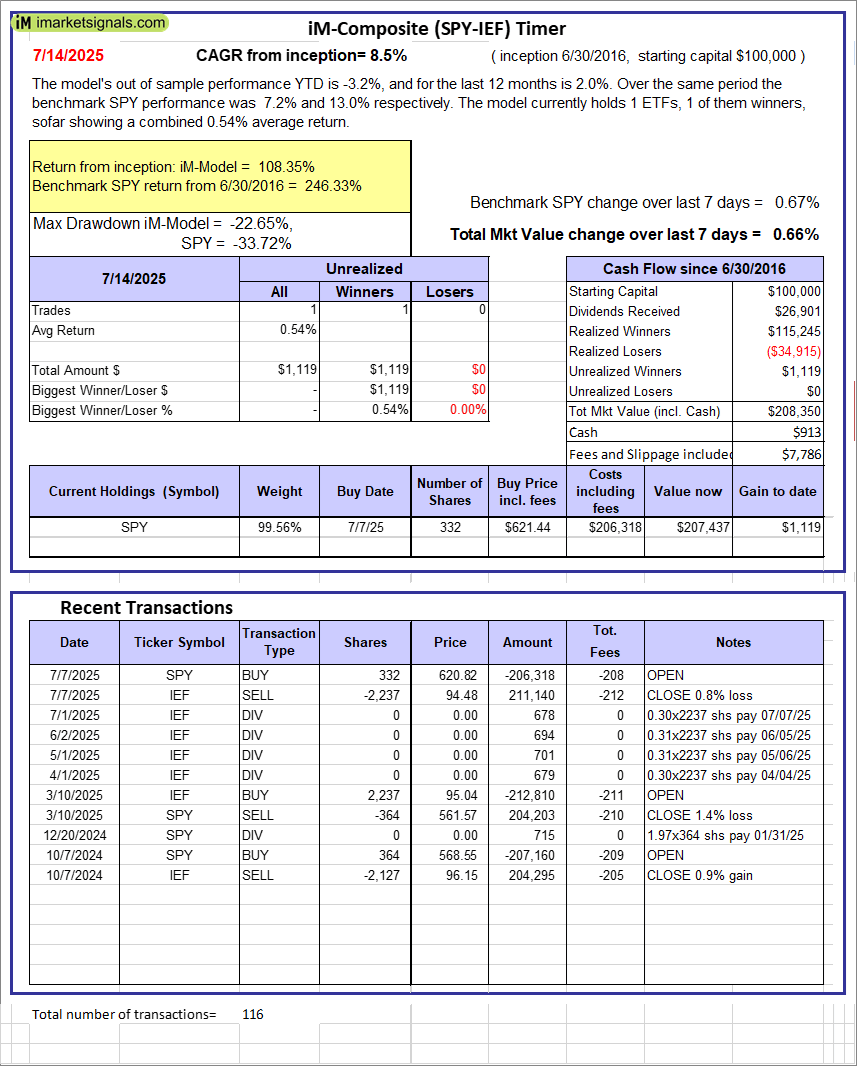 |
iM-Composite (SPY-IEF) Timer: The model’s out of sample performance YTD is -3.2%, and for the last 12 months is 2.0%. Over the same period the benchmark SPY performance was 7.2% and 13.0% respectively. Over the previous week the market value of the iM-Composite (SPY-IEF) Timer gained 0.66% at a time when SPY gained 0.67%. A starting capital of $100,000 at inception on 6/30/2016 would have grown to $208,350 which includes $913 cash and excludes $7,786 spent on fees and slippage. |
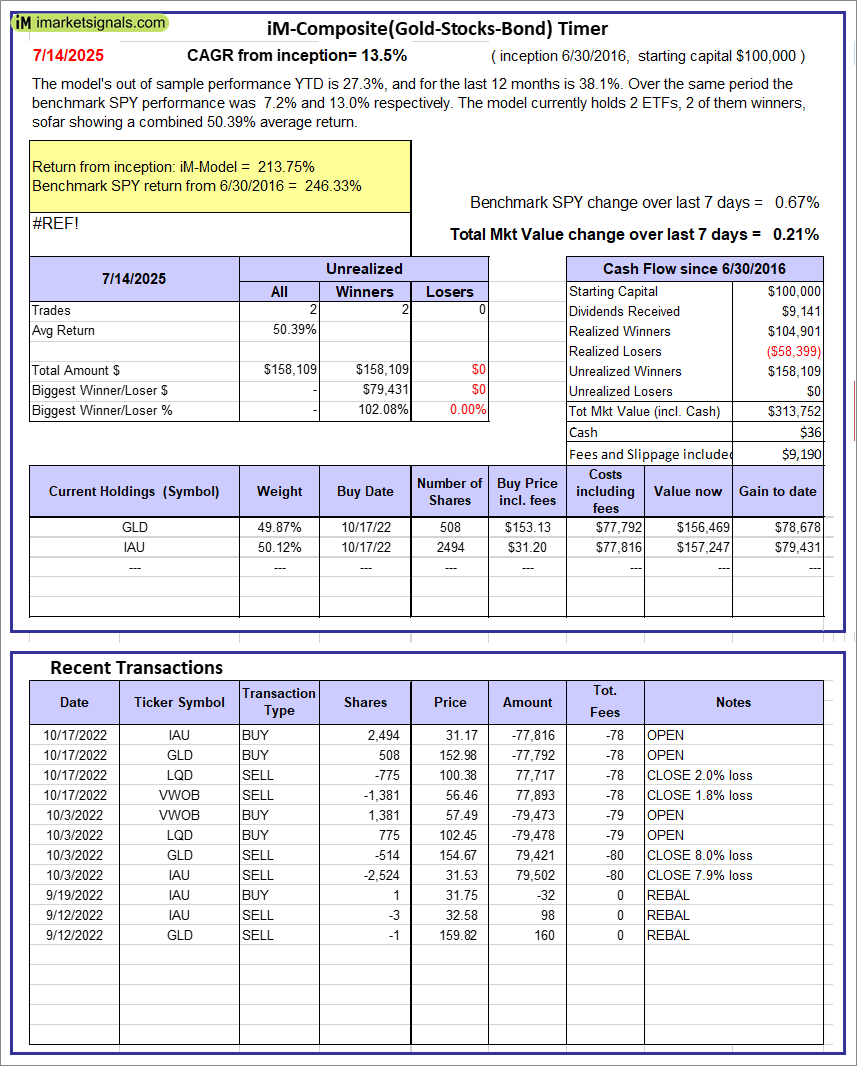 |
iM-Composite(Gold-Stocks-Bond) Timer: The model’s out of sample performance YTD is 27.3%, and for the last 12 months is 38.1%. Over the same period the benchmark SPY performance was 7.2% and 13.0% respectively. Over the previous week the market value of the iM-Composite(Gold-Stocks-Bond) Timer gained 0.21% at a time when SPY gained 0.67%. A starting capital of $100,000 at inception on 6/30/2016 would have grown to $313,752 which includes $36 cash and excludes $9,190 spent on fees and slippage. |
iM-Best Reports – 7/15/2025
Posted in pmp SPY-SH
Leave a Reply
You must be logged in to post a comment.