
  |
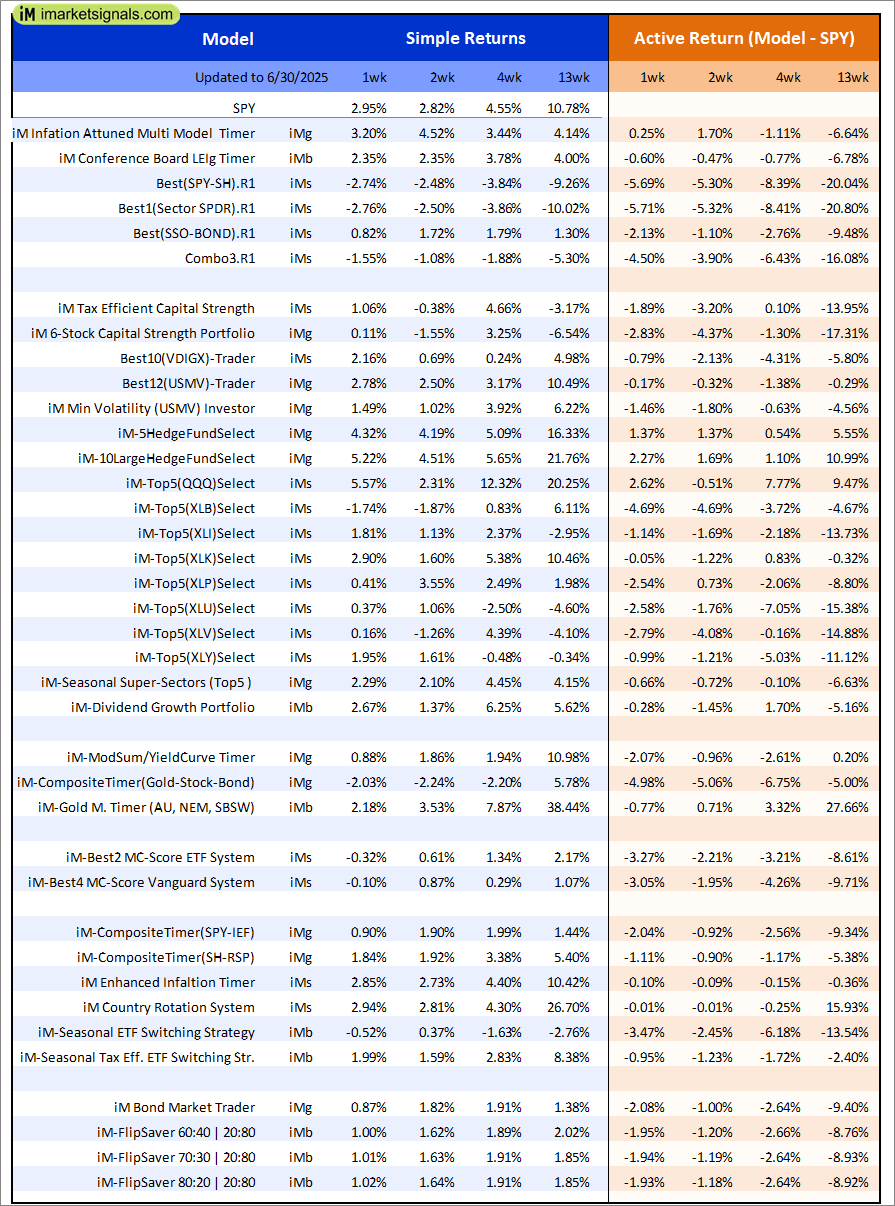
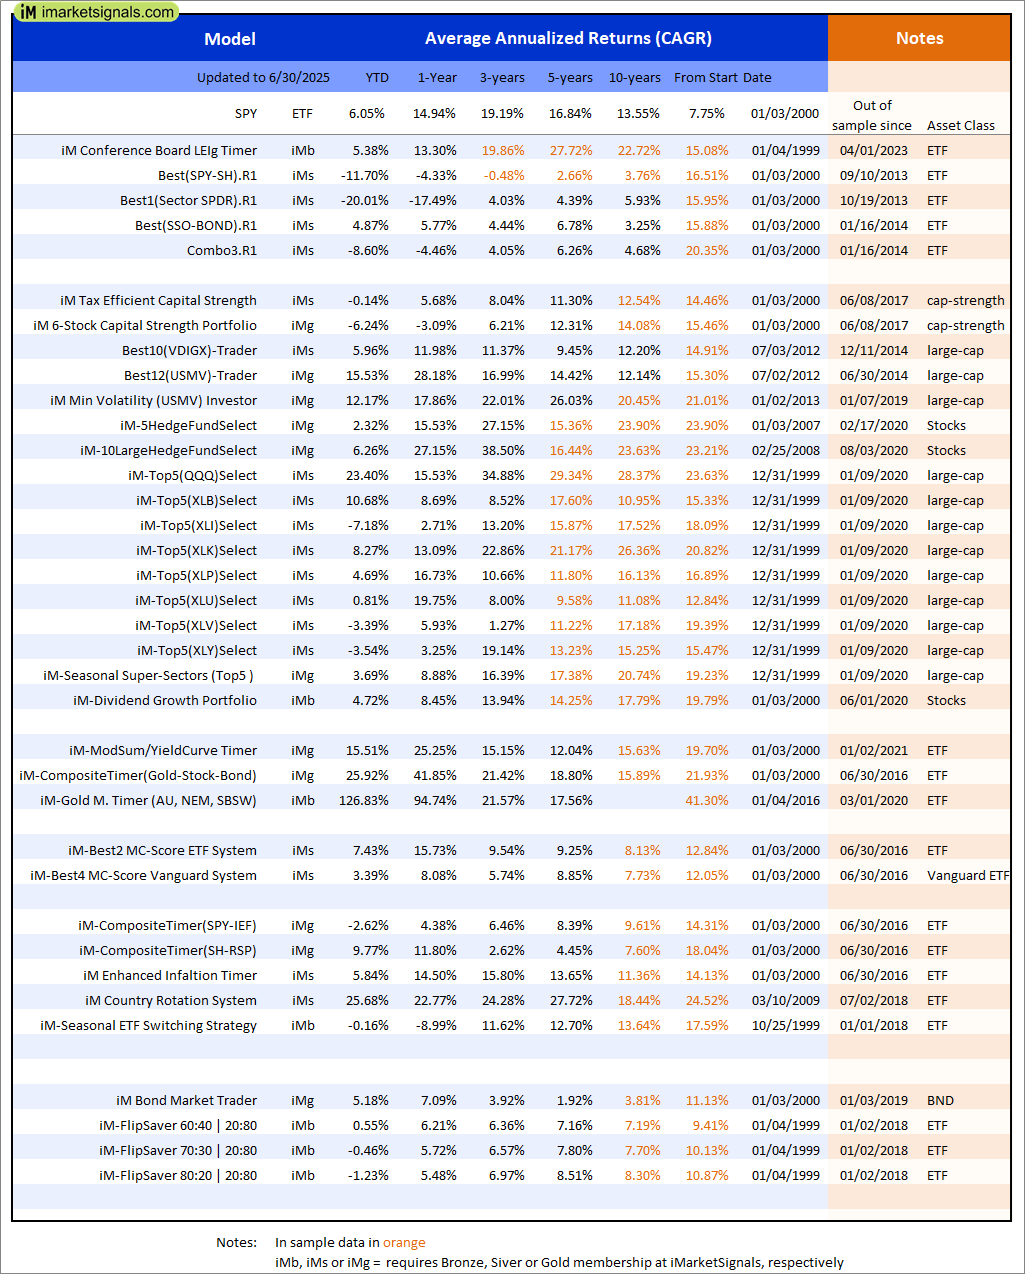
Out of sample performance summary of our models for the past 1, 2, 4 and 13 week periods. The active active return indicates how the models over- or underperformed the benchmark ETF SPY. Also the YTD, and the 1-, 3-, 5- and 10-year annualized returns are shown in the second table |
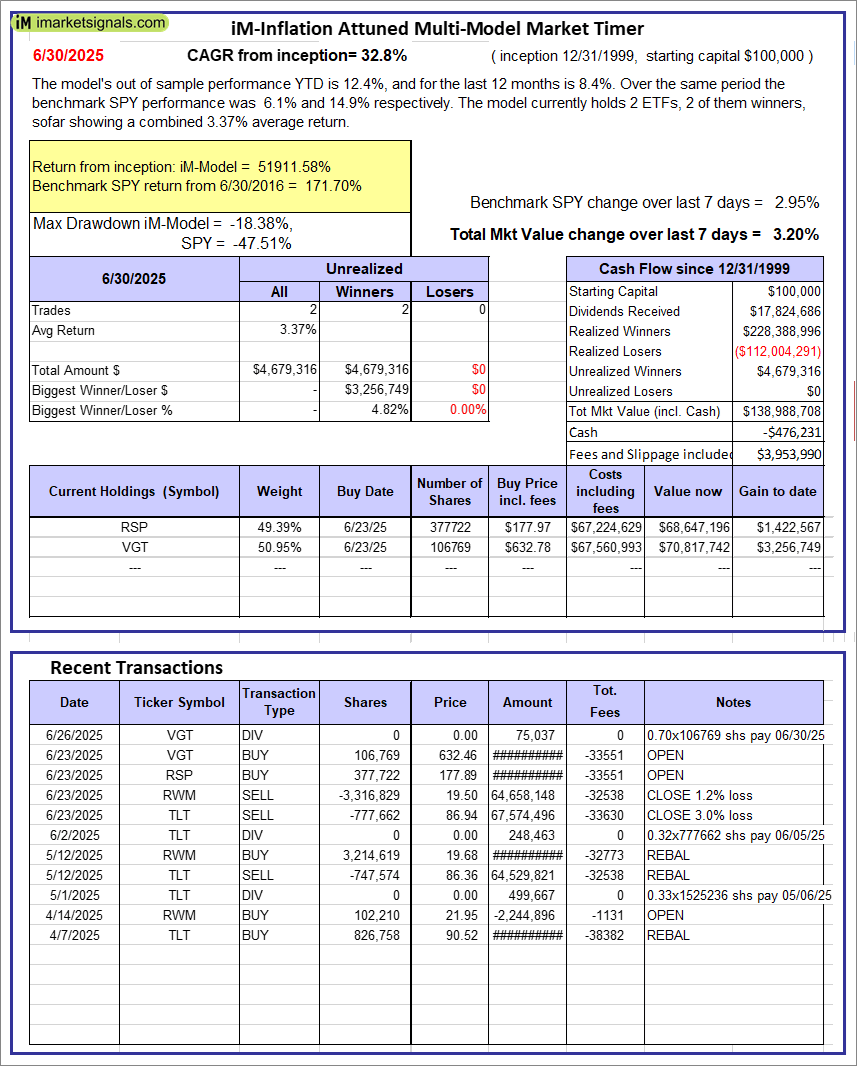 |
iM-Inflation Attuned Multi-Model Market Timer: The model’s out of sample performance YTD is 12.4%, and for the last 12 months is 8.4%. Over the same period the benchmark SPY performance was 6.1% and 14.9% respectively. Over the previous week the market value of the iM-Inflation Attuned Multi-Model Market Timer gained 3.20% at a time when SPY gained 2.95%. A starting capital of $100,000 at inception on 3/24/2017 would have grown to $138,988,708 which includes -$476,231 cash and excludes $3,953,990 spent on fees and slippage. |
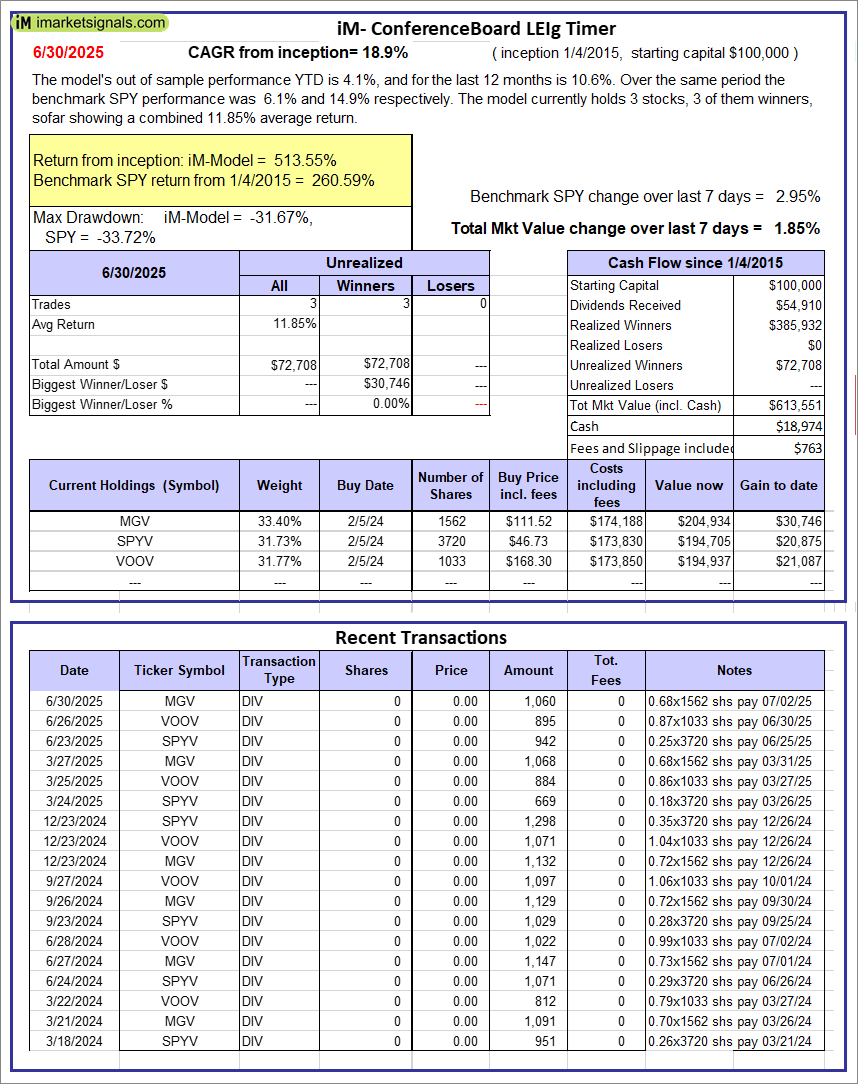 |
iM-Conference Board LEIg Timer: The model’s performance YTD is 14.3%, and for the last 12 months is 7.3%. Over the same period the benchmark SPY performance was 20.1% and 9.4% respectively. Over the previous week the market value of the iM-Conference Board LEIg Timer gained 1.85% at a time when SPY gained 2.95%. A starting capital of $100,000 at inception on 4/5/2017 would have grown to $613,551 which includes $18,974 cash and excludes $763 spent on fees and slippage. |
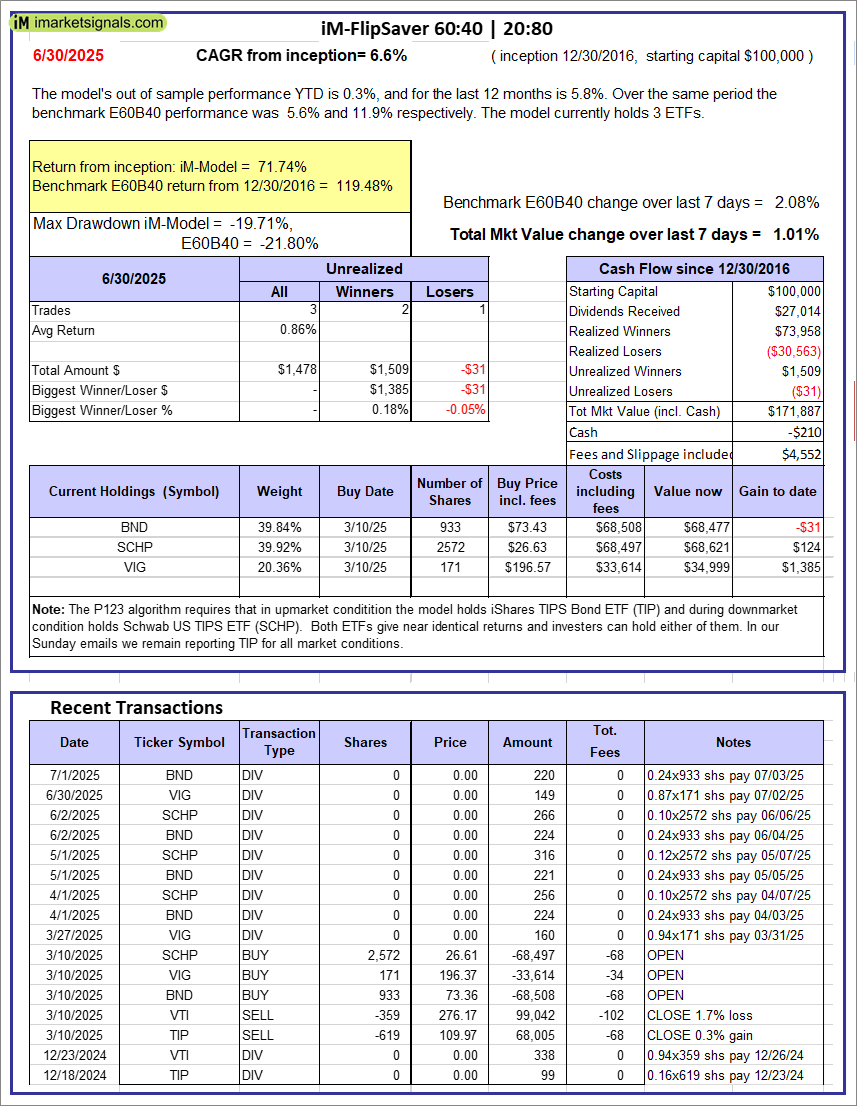 |
iM-FlipSaver 60:40 | 20:80 – 2017: The model’s out of sample performance YTD is 0.3%, and for the last 12 months is 5.8%. Over the same period the benchmark E60B40 performance was 5.6% and 11.9% respectively. Over the previous week the market value of iM-FlipSaver 80:20 | 20:80 gained 1.01% at a time when SPY gained 2.08%. A starting capital of $100,000 at inception on 7/16/2015 would have grown to $171,887 which includes -$210 cash and excludes $4,552 spent on fees and slippage. |
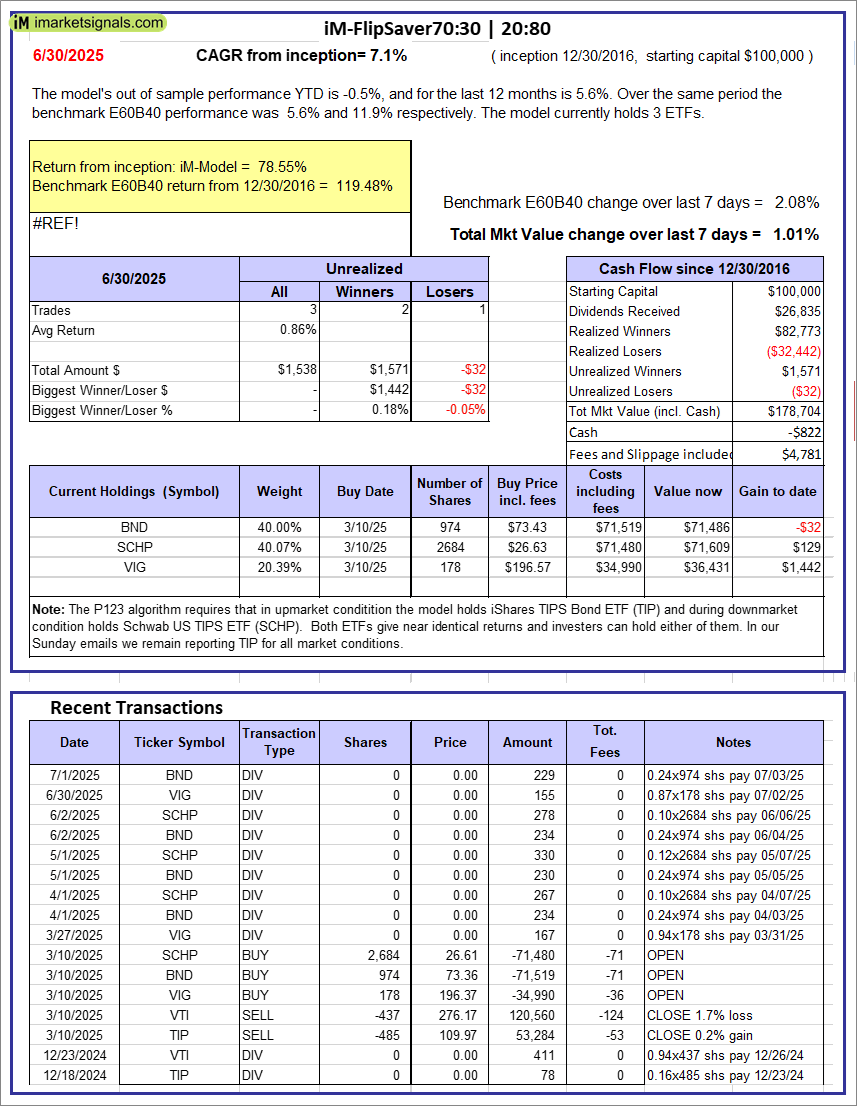 |
iM-FlipSaver 70:30 | 20:80 – 2017: The model’s out of sample performance YTD is -0.5%, and for the last 12 months is 5.6%. Over the same period the benchmark E60B40 performance was 5.6% and 11.9% respectively. Over the previous week the market value of iM-FlipSaver 70:30 | 20:80 gained 1.01% at a time when SPY gained 2.08%. A starting capital of $100,000 at inception on 7/15/2015 would have grown to $178,704 which includes -$822 cash and excludes $4,781 spent on fees and slippage. |
 |
iM-FlipSaver 80:20 | 20:80 – 2017: The model’s out of sample performance YTD is -1.2%, and for the last 12 months is 5.4%. Over the same period the benchmark E60B40 performance was 5.6% and 11.9% respectively. Over the previous week the market value of iM-FlipSaver 80:20 | 20:80 gained 1.02% at a time when SPY gained 2.08%. A starting capital of $100,000 at inception on 1/2/2017 would have grown to $185,413 which includes -$1,417 cash and excludes $5,001 spent on fees and slippage. |
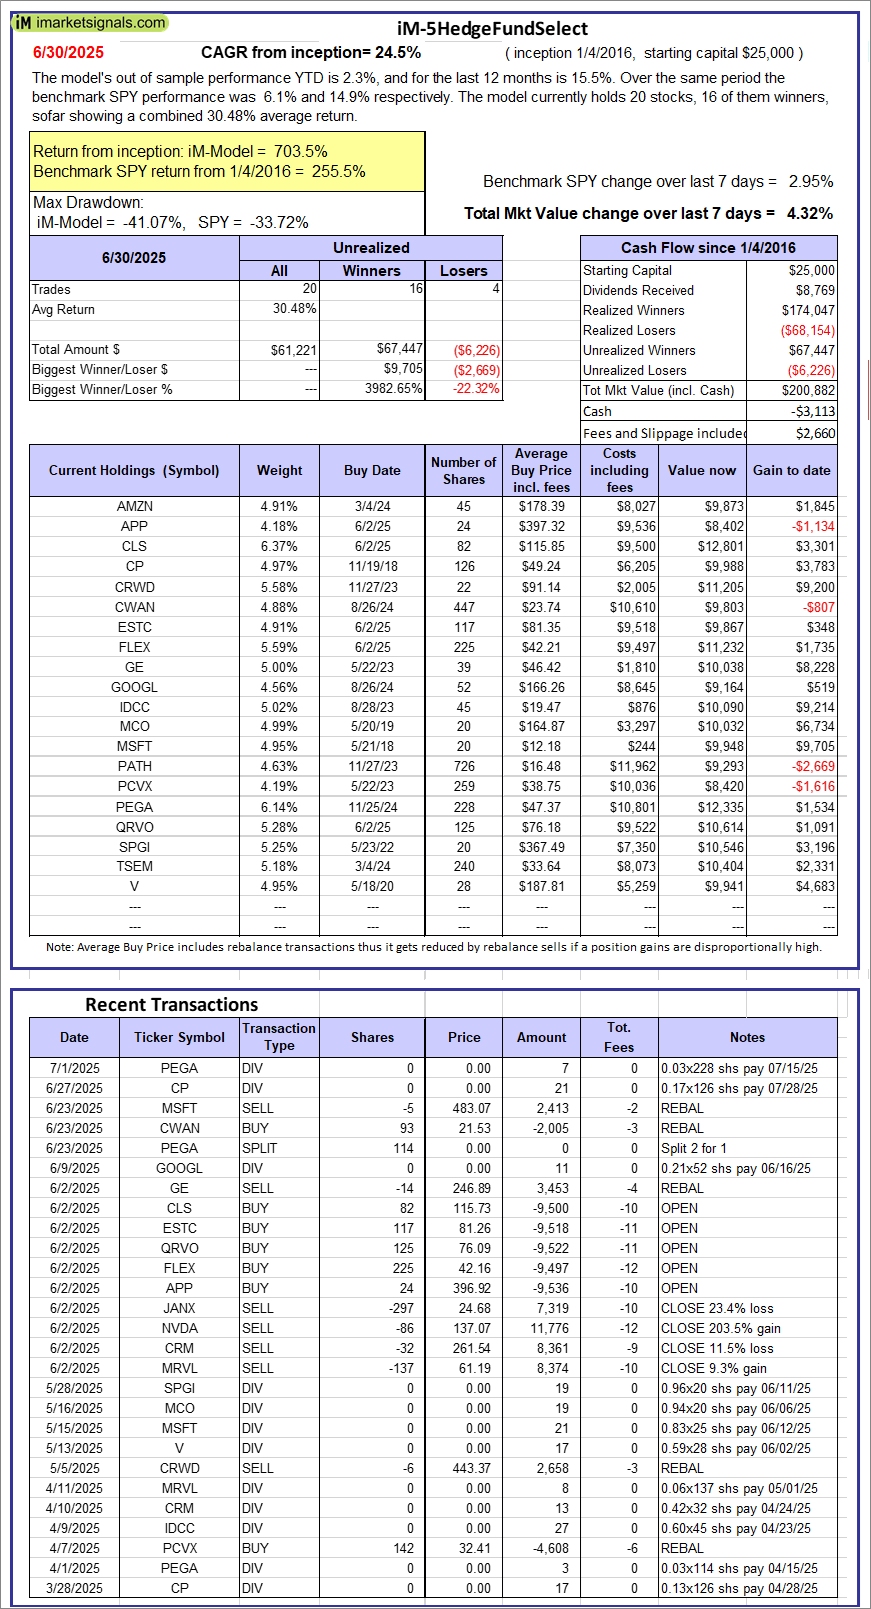 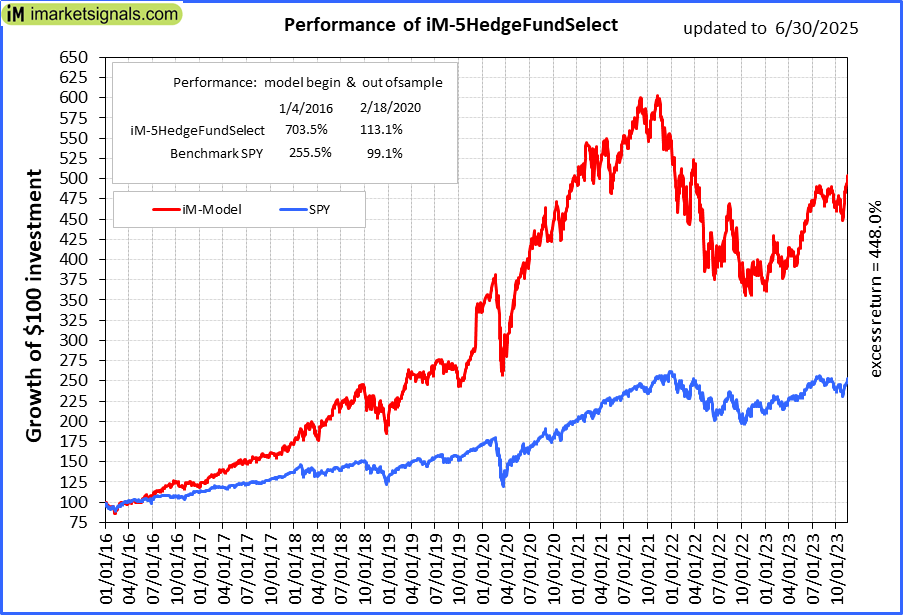 |
iM-5HedgeFundSelect: Since inception, on 1/5/2016, the model gained 703.53% while the benchmark SPY gained 255.54% over the same period. Over the previous week the market value of iM-5HedgeFundSelect gained 4.32% at a time when SPY gained 2.95%. A starting capital of $25,000 at inception on 1/5/2016 would have grown to $200,882 which includes -$3,113 cash and excludes $2,660 spent on fees and slippage. |
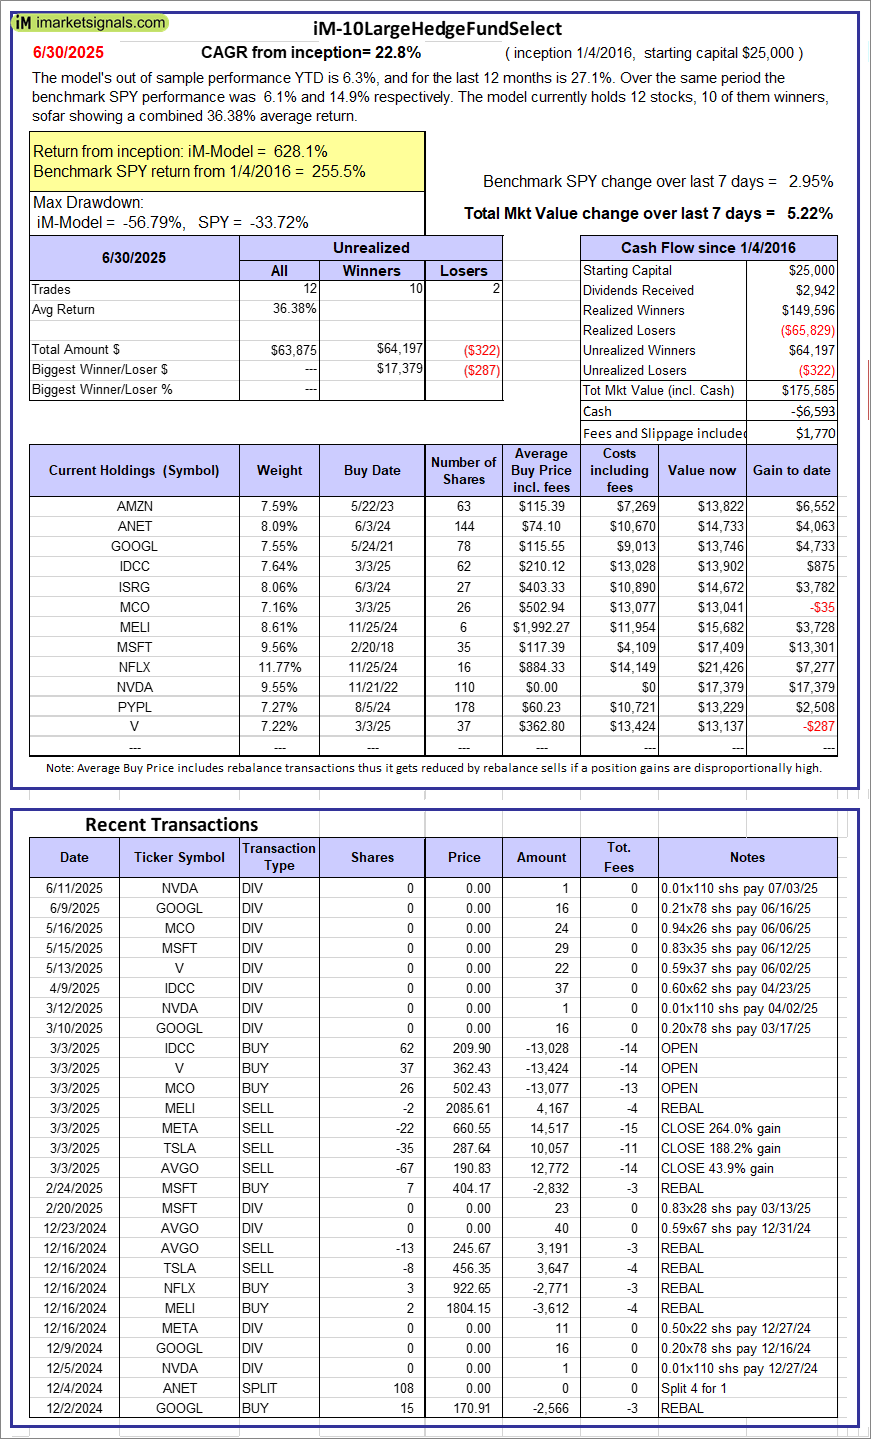 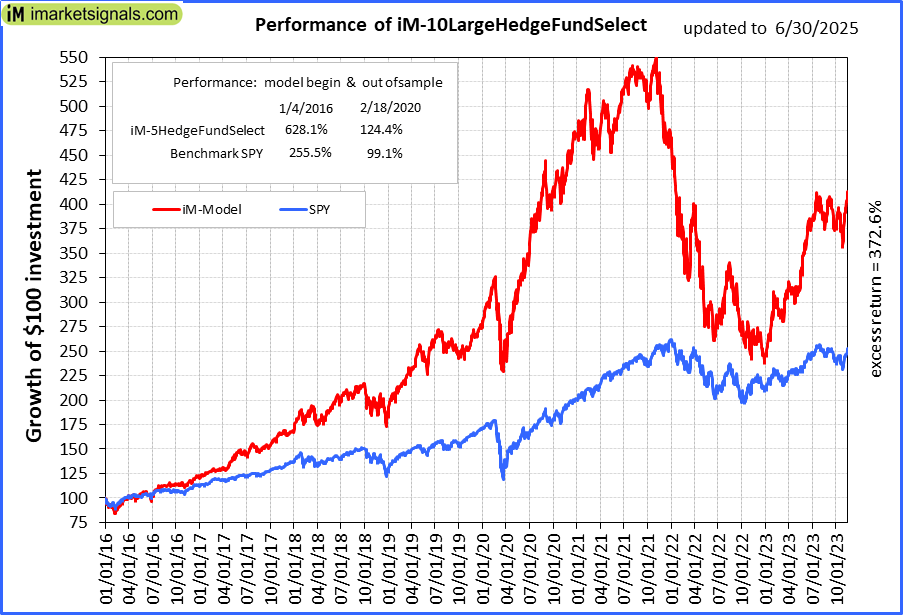 |
iM-10LargeHedgeFundSelect: Since inception, on 1/5/2016, the model gained 628.13% while the benchmark SPY gained 255.54% over the same period. Over the previous week the market value of iM-10LargeHedgeFundSelect gained 5.22% at a time when SPY gained 2.95%. A starting capital of $25,000 at inception on 1/5/2016 would have grown to $175,585 which includes -$6,593 cash and excludes $1,770 spent on fees and slippage. |
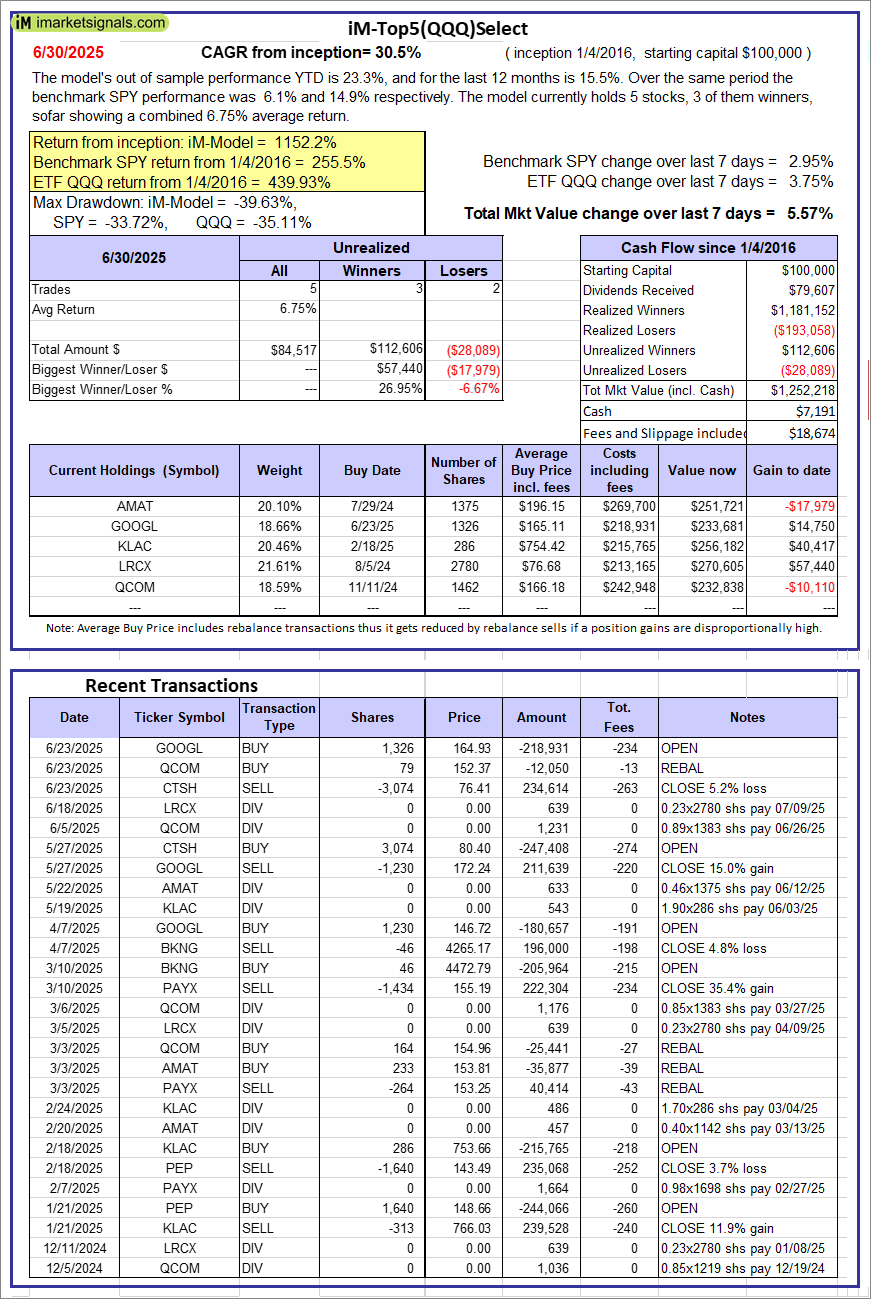 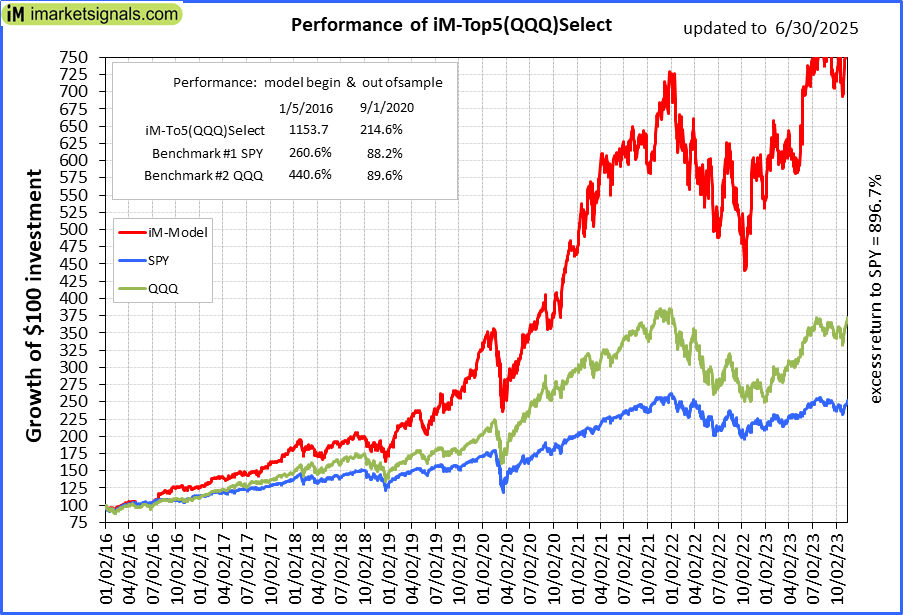 |
iM-Top5(QQQ)Select: Since inception, on 1/5/2016, the model gained 1152.22% while the benchmark SPY gained 255.54% over the same period. Over the previous week the market value of iM-Top5(QQQ)Select gained 5.57% at a time when SPY gained 2.95%. A starting capital of $100,000 at inception on 1/5/2016 would have grown to $1,252,218 which includes $7,191 cash and excludes $18,674 spent on fees and slippage. |
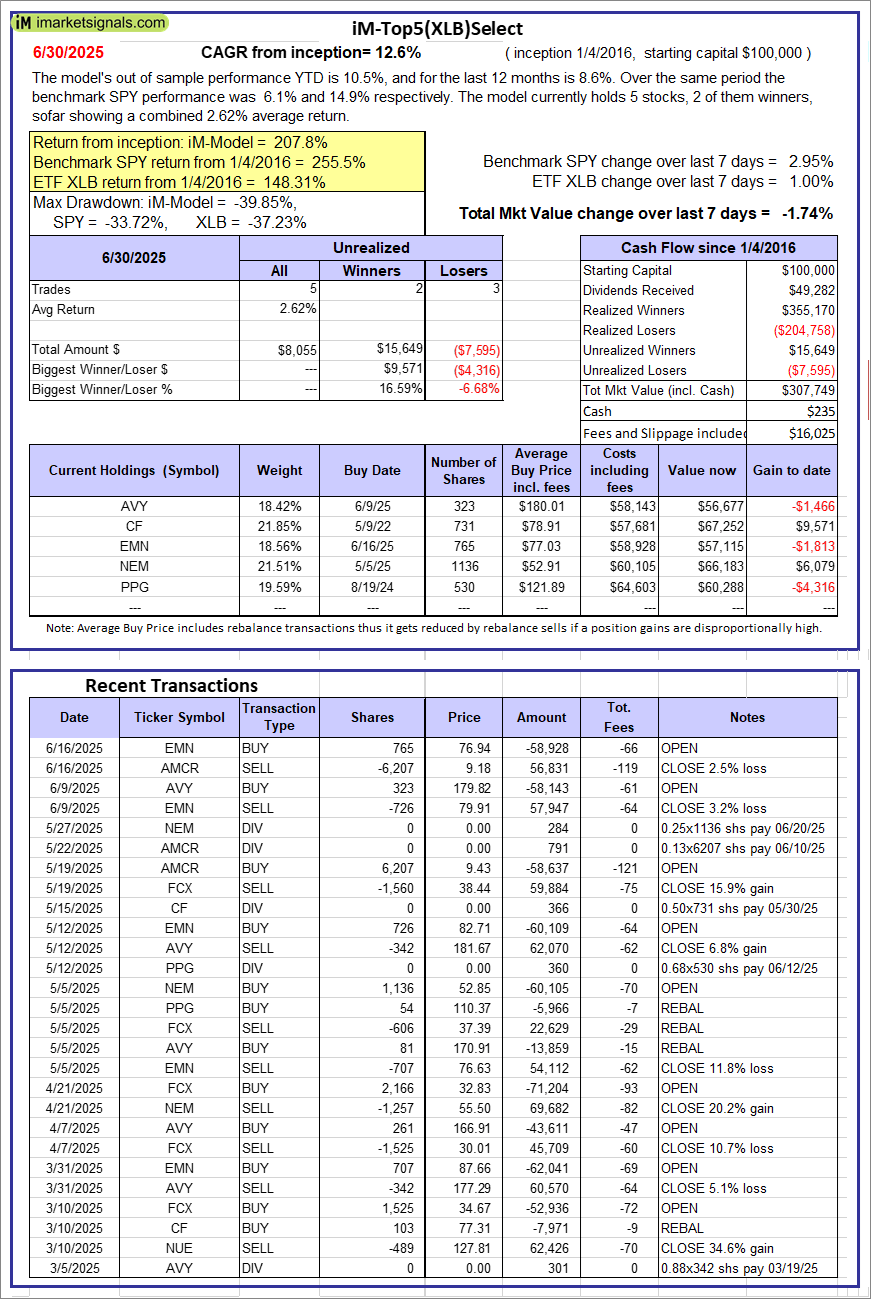 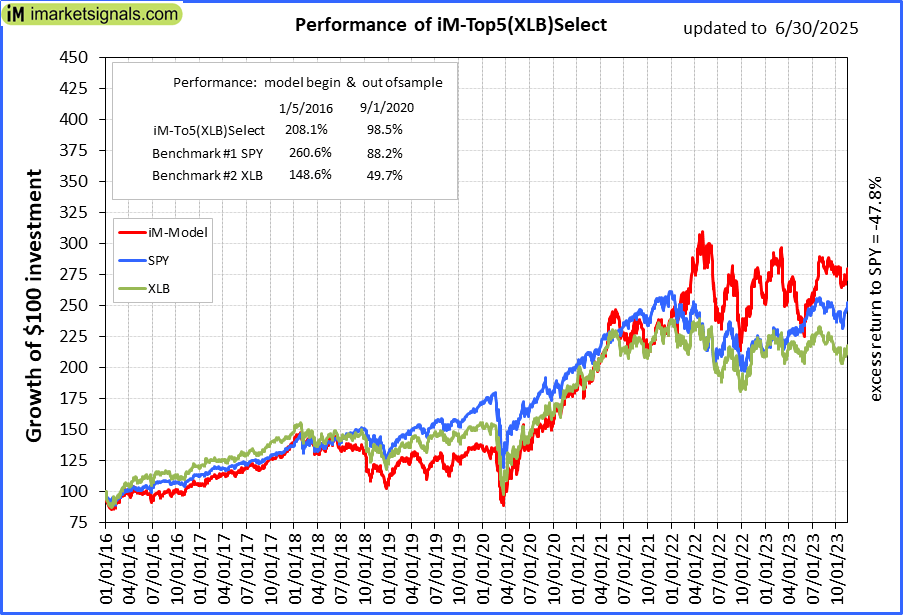 |
iM-Top5(XLB)Select: Since inception, on 1/5/2016, the model gained 207.75% while the benchmark SPY gained 255.54% over the same period. Over the previous week the market value of iM-Top5(XLB)Select gained -1.74% at a time when SPY gained 2.95%. A starting capital of $100,000 at inception on 1/5/2016 would have grown to $307,749 which includes $235 cash and excludes $16,025 spent on fees and slippage. |
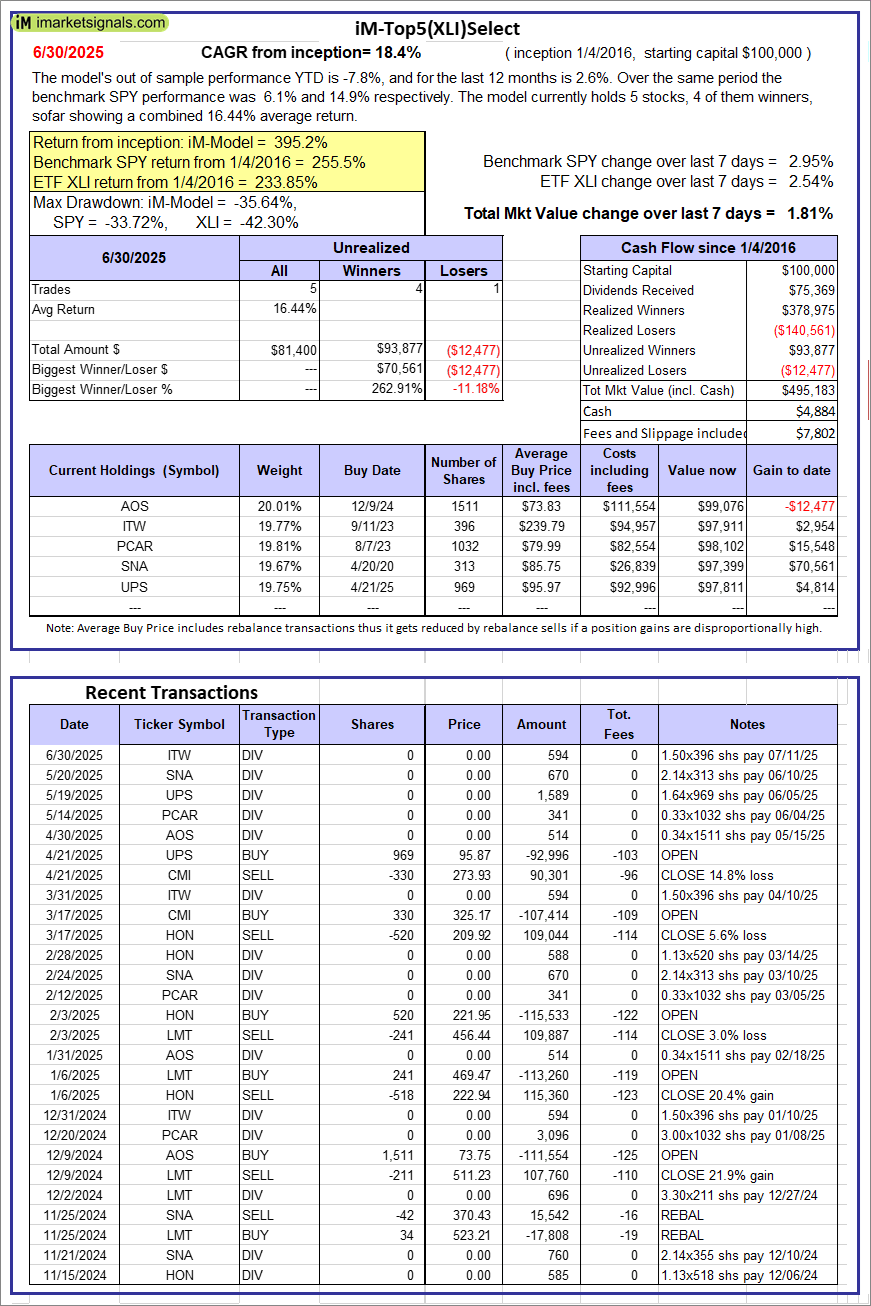 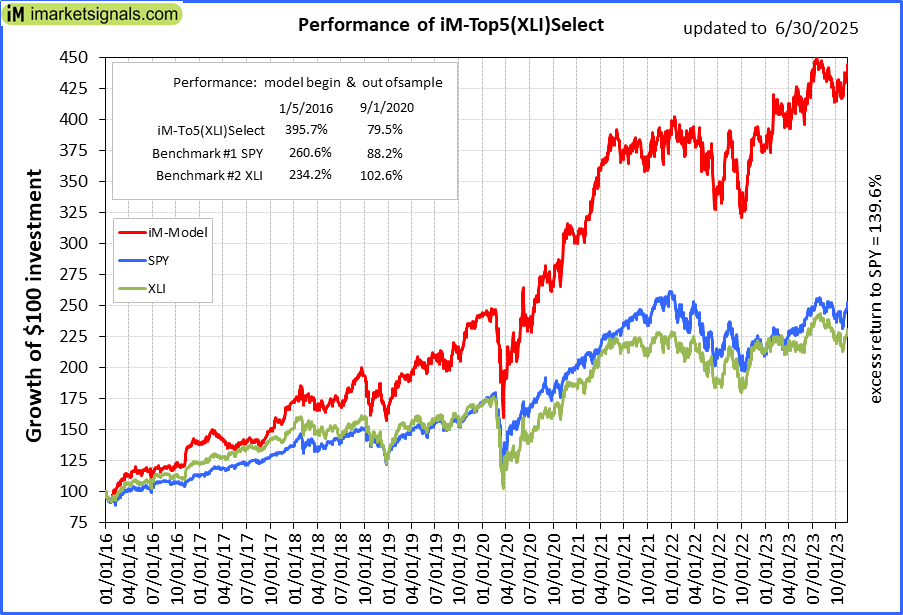 |
iM-Top5(XLI)Select: Since inception, on 1/5/2016, the model gained 395.18% while the benchmark SPY gained 255.54% over the same period. Over the previous week the market value of iM-Top5(XLI)Select gained 1.81% at a time when SPY gained 2.95%. A starting capital of $100,000 at inception on 1/5/2016 would have grown to $495,183 which includes $4,884 cash and excludes $7,802 spent on fees and slippage. |
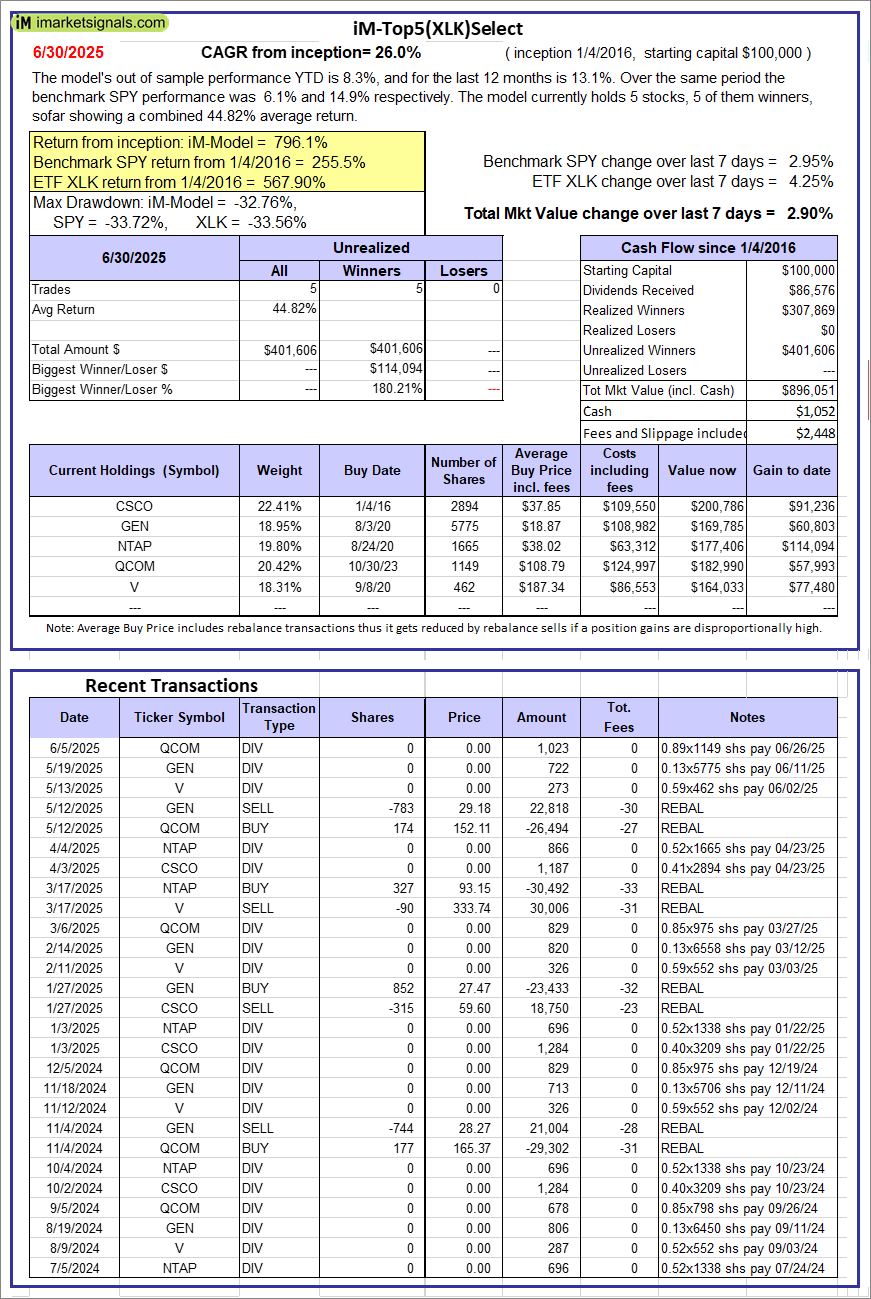 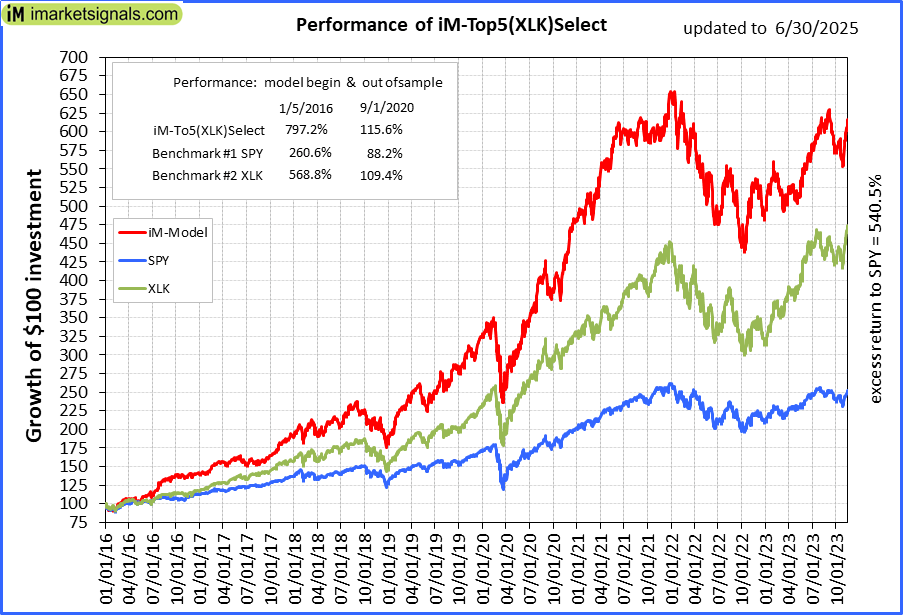 |
iM-Top5(XLK)Select: Since inception, on 1/5/2016, the model gained 796.05% while the benchmark SPY gained 255.54% over the same period. Over the previous week the market value of iM-Top5(XLK)Select gained 2.90% at a time when SPY gained 2.95%. A starting capital of $100,000 at inception on 1/5/2016 would have grown to $896,051 which includes $1,052 cash and excludes $2,448 spent on fees and slippage. |
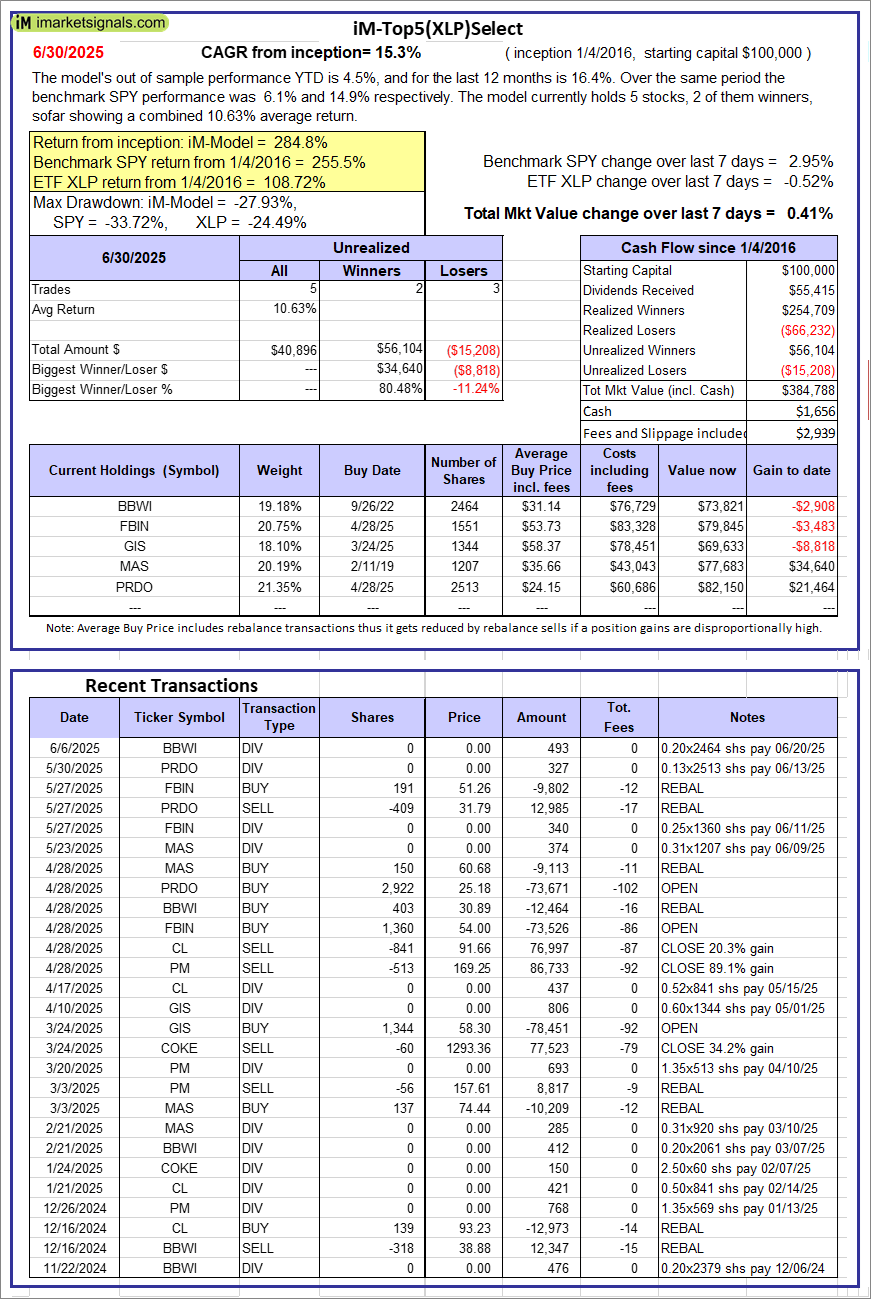 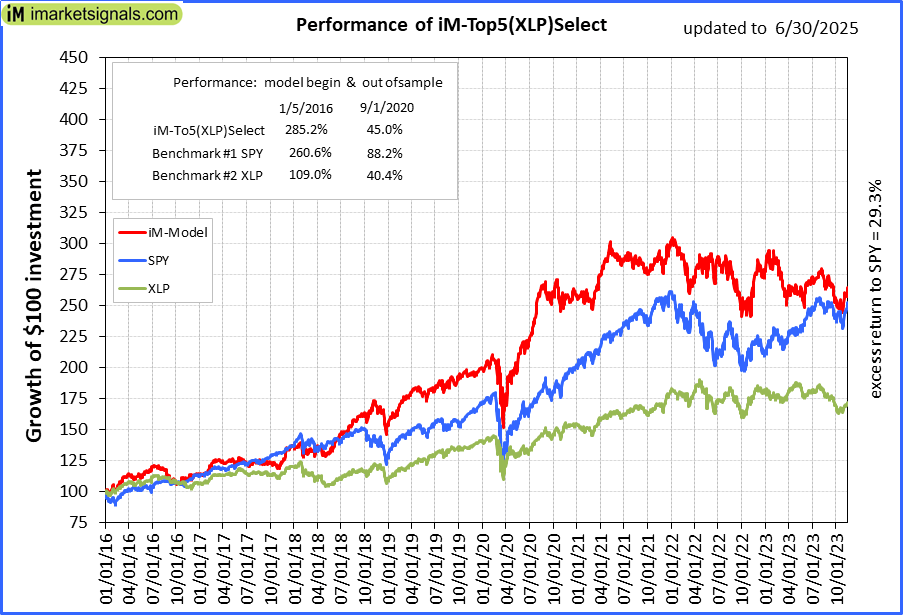 |
iM-Top5(XLP)Select: Since inception, on 1/5/2016, the model gained 284.79% while the benchmark SPY gained 255.54% over the same period. Over the previous week the market value of iM-Top5(XLP)Select gained 0.41% at a time when SPY gained 2.95%. A starting capital of $100,000 at inception on 1/5/2016 would have grown to $384,788 which includes $1,656 cash and excludes $2,939 spent on fees and slippage. |
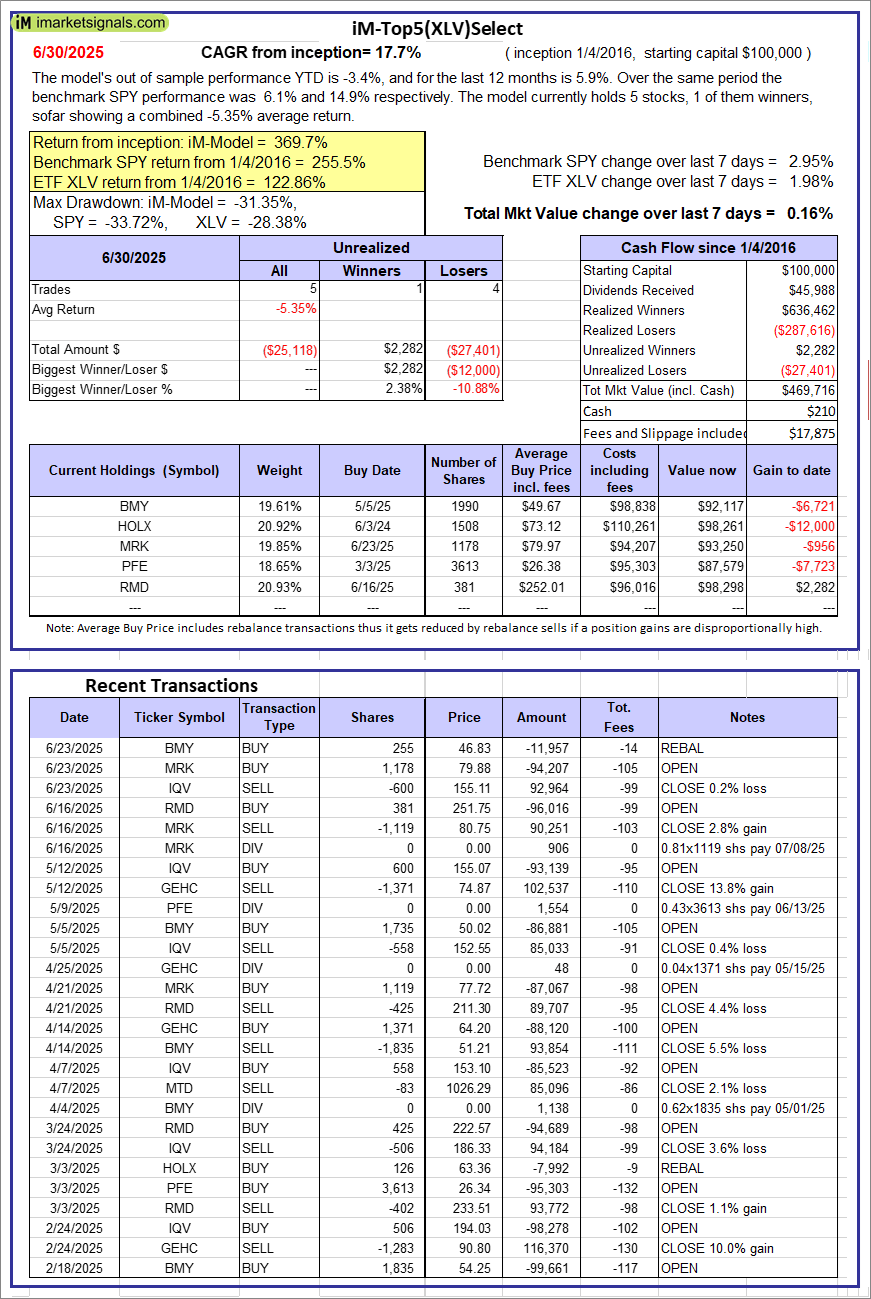 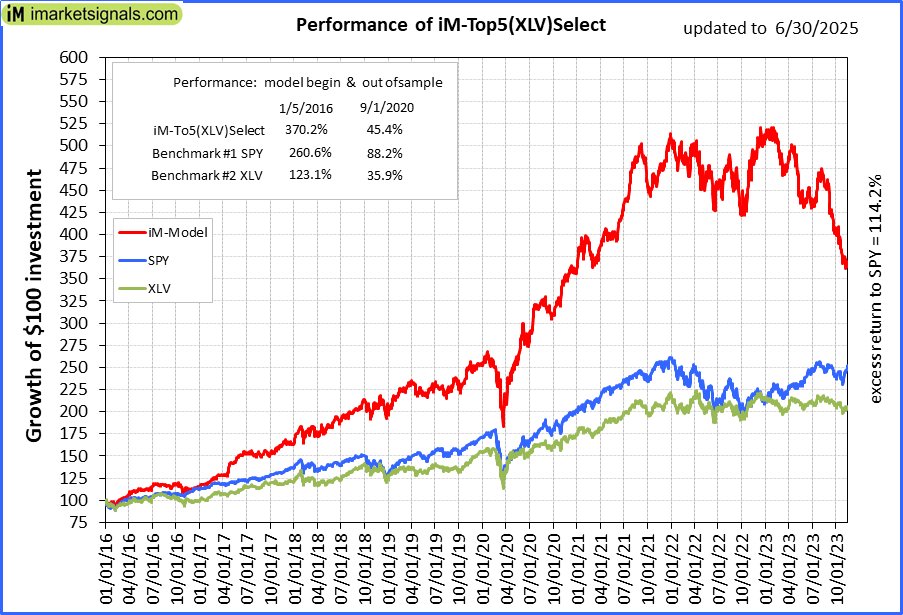 |
iM-Top5(XLV)Select: Since inception, on 1/5/2016, the model gained 369.72% while the benchmark SPY gained 255.54% over the same period. Over the previous week the market value of iM-Top5(XLV)Select gained 0.16% at a time when SPY gained 2.95%. A starting capital of $100,000 at inception on 1/5/2016 would have grown to $469,716 which includes $210 cash and excludes $17,875 spent on fees and slippage. |
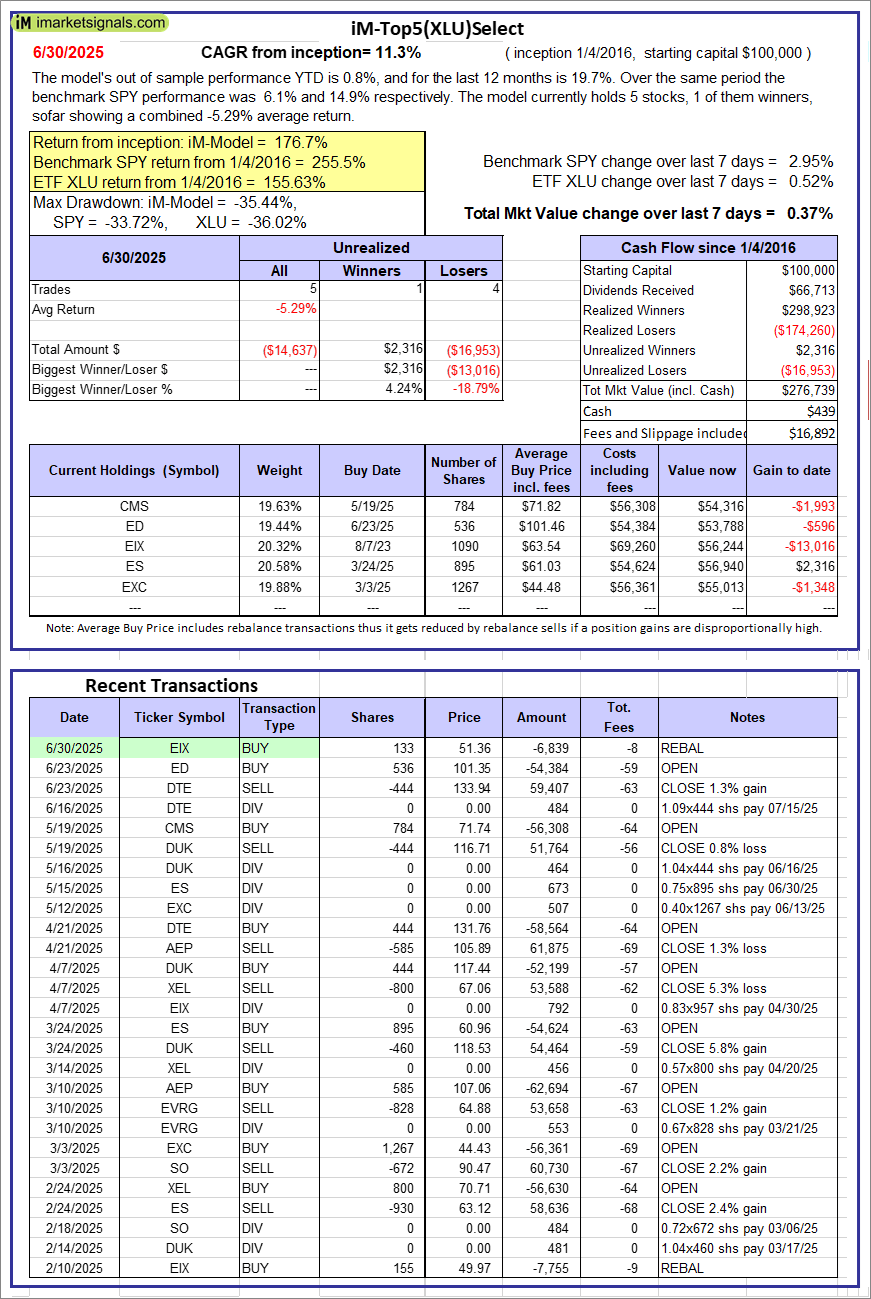 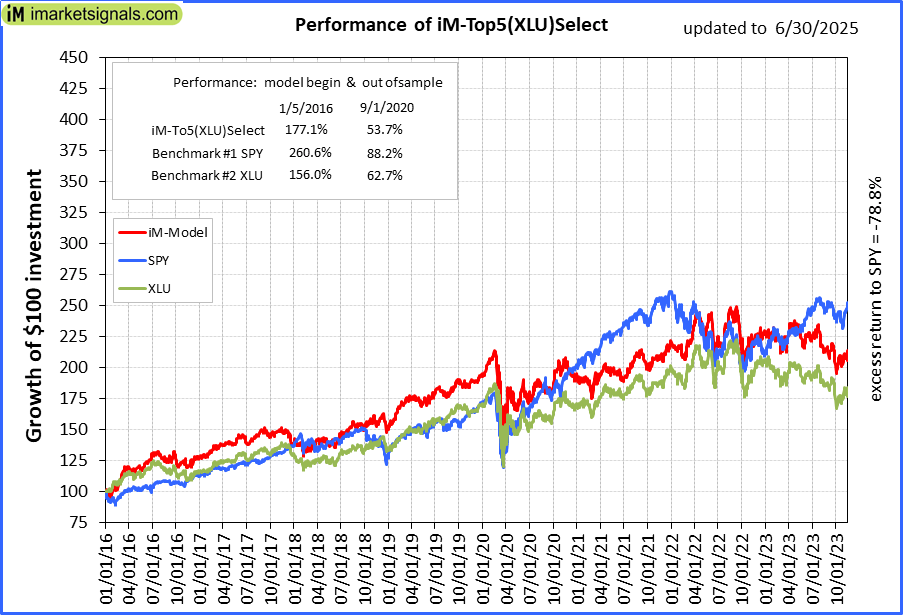 |
iM-Top5(XLU)Select: Since inception, on 1/5/2016, the model gained 176.74% while the benchmark SPY gained 255.54% over the same period. Over the previous week the market value of iM-Top5(XLU)Select gained 0.37% at a time when SPY gained 2.95%. A starting capital of $100,000 at inception on 1/5/2016 would have grown to $276,739 which includes $439 cash and excludes $16,892 spent on fees and slippage. |
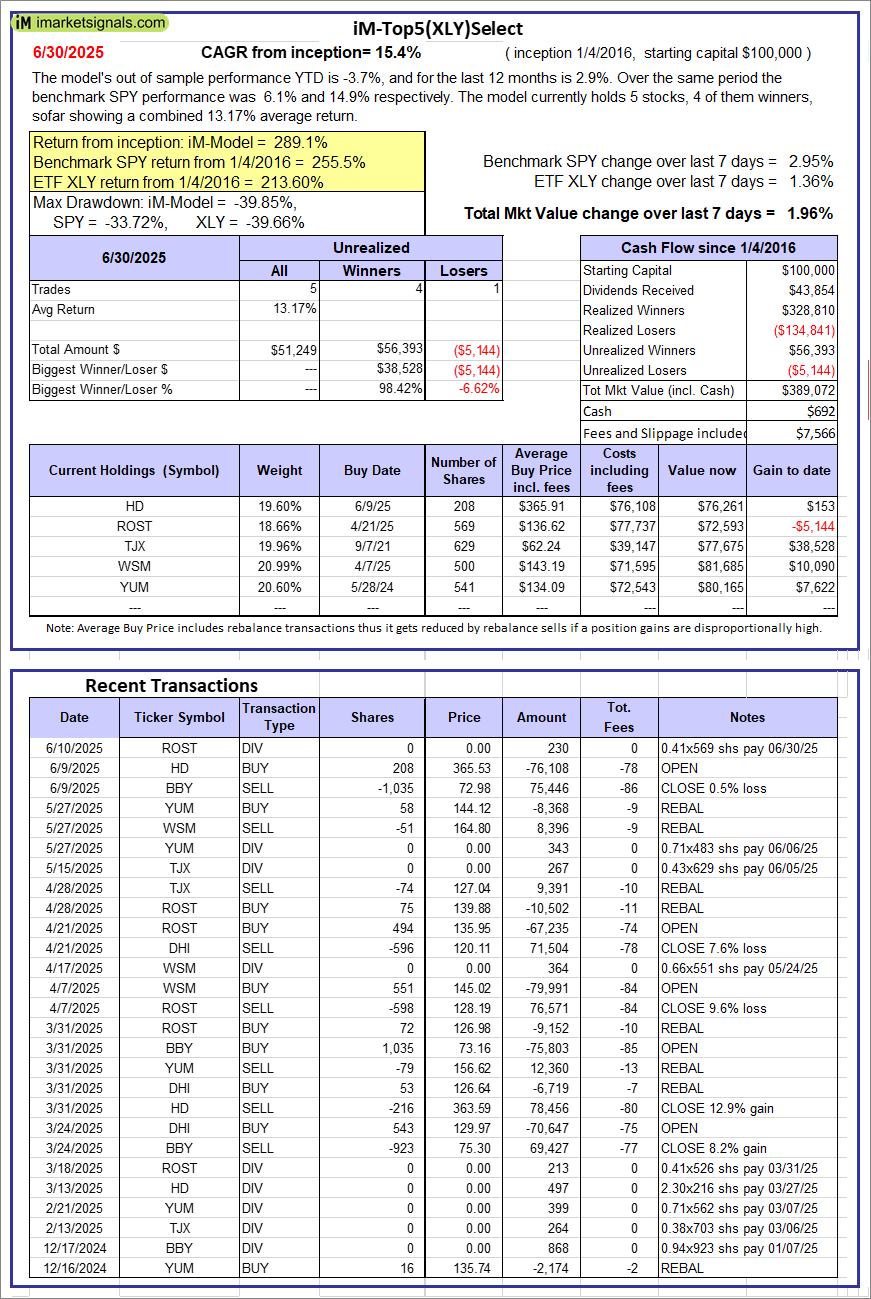 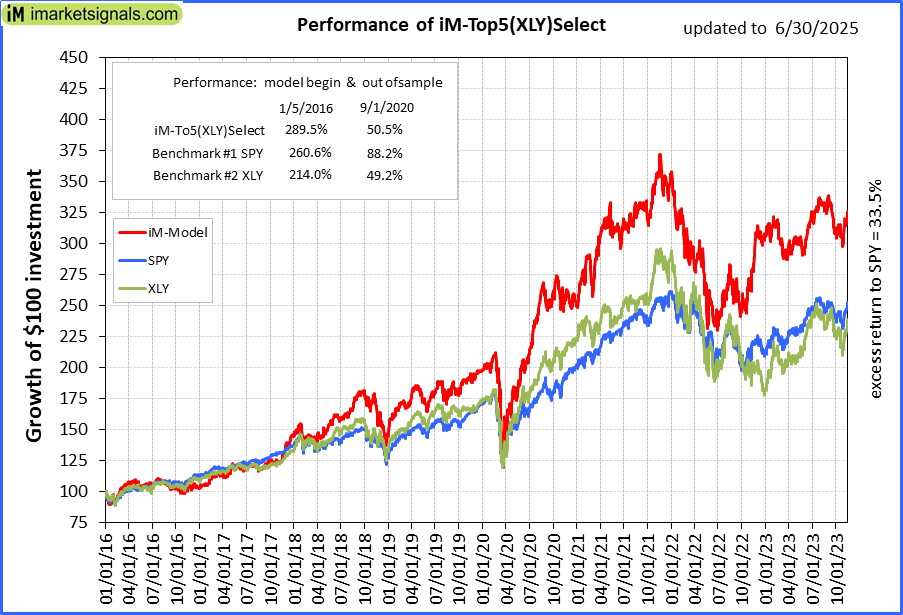 |
iM-Top5(XLY)Select: Since inception, on 1/5/2016, the model gained 289.07% while the benchmark SPY gained 255.54% over the same period. Over the previous week the market value of iM-Top5(XLY)Select gained 1.96% at a time when SPY gained 2.95%. A starting capital of $100,000 at inception on 1/5/2016 would have grown to $389,072 which includes $692 cash and excludes $7,566 spent on fees and slippage. |
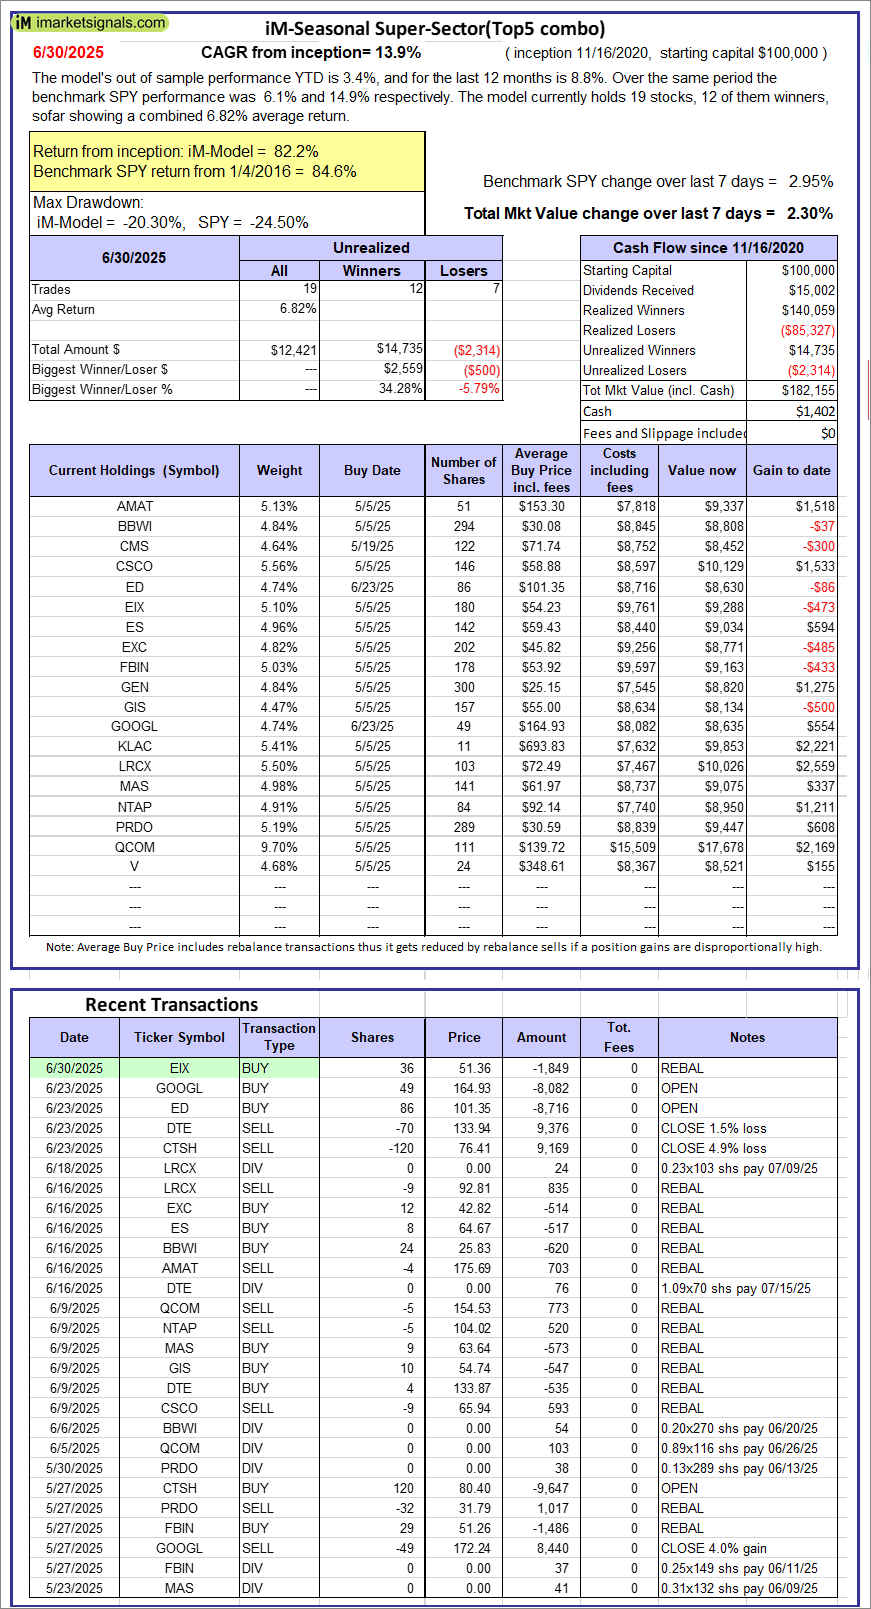 |
iM-Seasonal Super-Sectors (Top5 combo) : Since inception, on 11/17/2020, the model gained 82.15% while the benchmark SPY gained 84.56% over the same period. Over the previous week the market value of iM-Seasonal Super-Sectors (Top5 combo) gained 2.30% at a time when SPY gained 2.95%. A starting capital of $100,000 at inception on 11/17/2020 would have grown to $182,155 which includes $1,402 cash and excludes $00 spent on fees and slippage. |
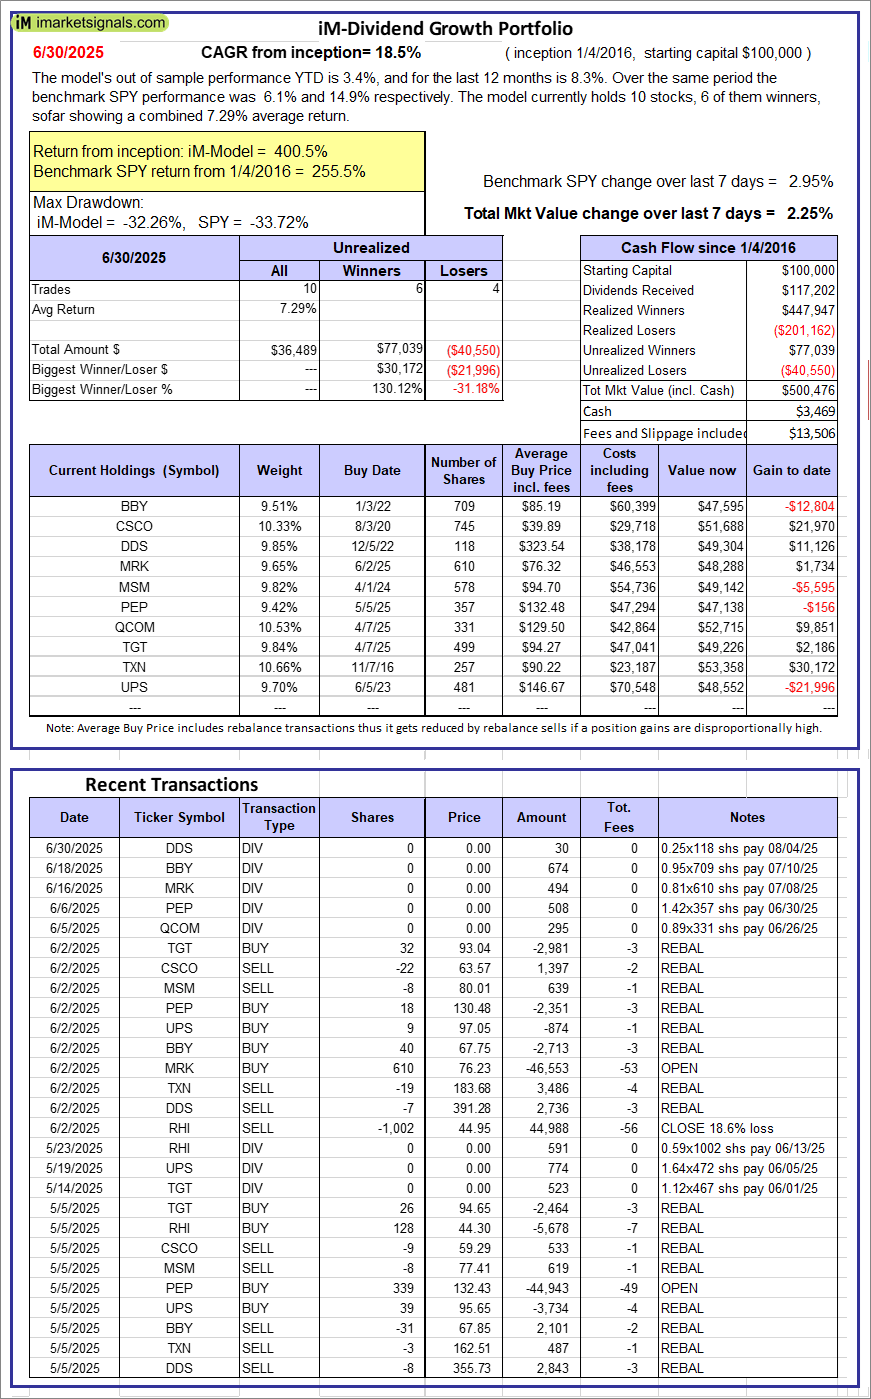 |
iM-Dividend Growth Portfolio: The model’s out of sample performance YTD is 3.4%, and for the last 12 months is 8.3%. Over the same period the benchmark SPY performance was 6.1% and 14.9% respectively. Over the previous week the market value of the iM-Dividend Growth Portfolio gained 2.25% at a time when SPY gained 2.95%. A starting capital of $100,000 at inception on 6/30/2016 would have grown to $500,476 which includes $3,469 cash and excludes $13,506 spent on fees and slippage. |
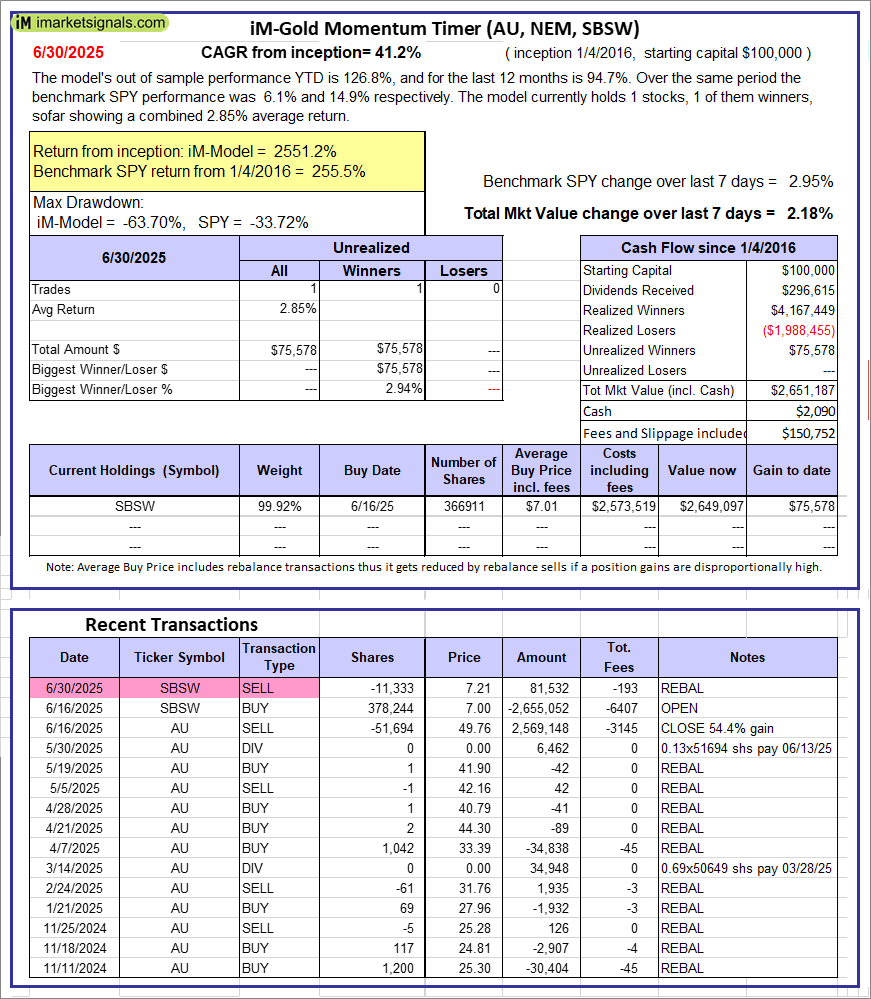 |
iM-Gold Momentum Timer (AU, NEM, SBSW): The model’s out of sample performance YTD is 126.8%, and for the last 12 months is 94.7%. Over the same period the benchmark SPY performance was 6.1% and 14.9% respectively. Over the previous week the market value of iM-Gold Momentum Timer (AU, NEM, SBSW) gained 2.18% at a time when SPY gained 2.95%. A starting capital of $100,000 at inception on 6/30/2016 would have grown to $2,090 which includes $150,752 cash and excludes Gain to date spent on fees and slippage. |
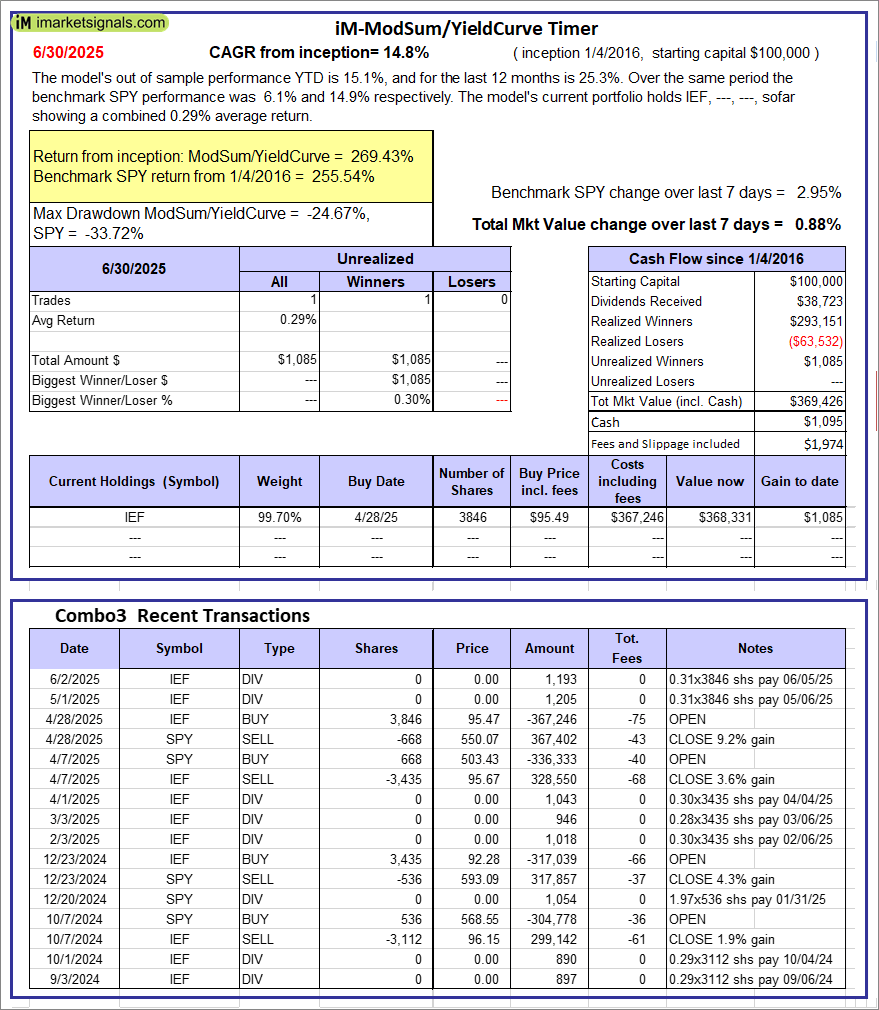 |
iM-ModSum/YieldCurve Timer: The model’s out of sample performance YTD is 15.1%, and for the last 12 months is 25.3%. Over the same period the benchmark SPY performance was 6.1% and 14.9% respectively. Over the previous week the market value of iM-PortSum/YieldCurve Timer gained 0.88% at a time when SPY gained 2.95%. A starting capital of $100,000 at inception on 1/1/2016 would have grown to $369,426 which includes $1,095 cash and excludes $1,974 spent on fees and slippage. |
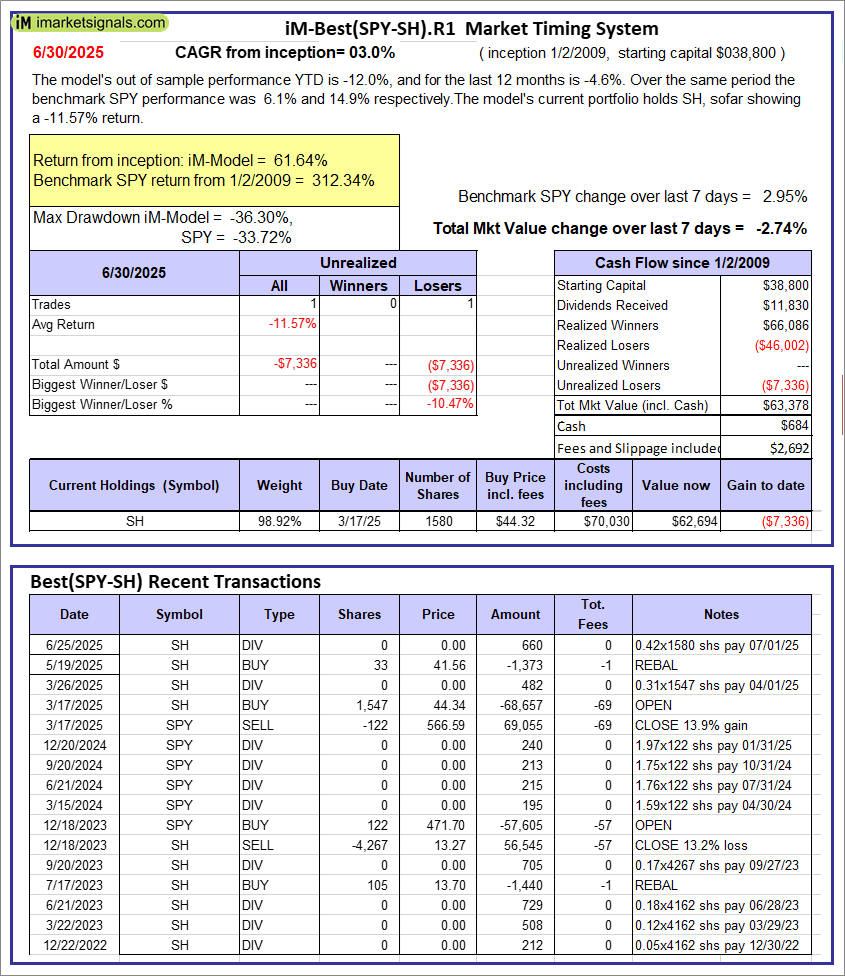 |
iM-Best(SPY-SH).R1: The model’s out of sample performance YTD is -12.0%, and for the last 12 months is -4.6%. Over the same period the benchmark SPY performance was 6.1% and 14.9% respectively. Over the previous week the market value of Best(SPY-SH) gained -2.74% at a time when SPY gained 2.95%. A starting capital of $100,000 at inception on 1/2/2009 would have grown to $63,378 which includes $684 cash and excludes $2,692 spent on fees and slippage. |
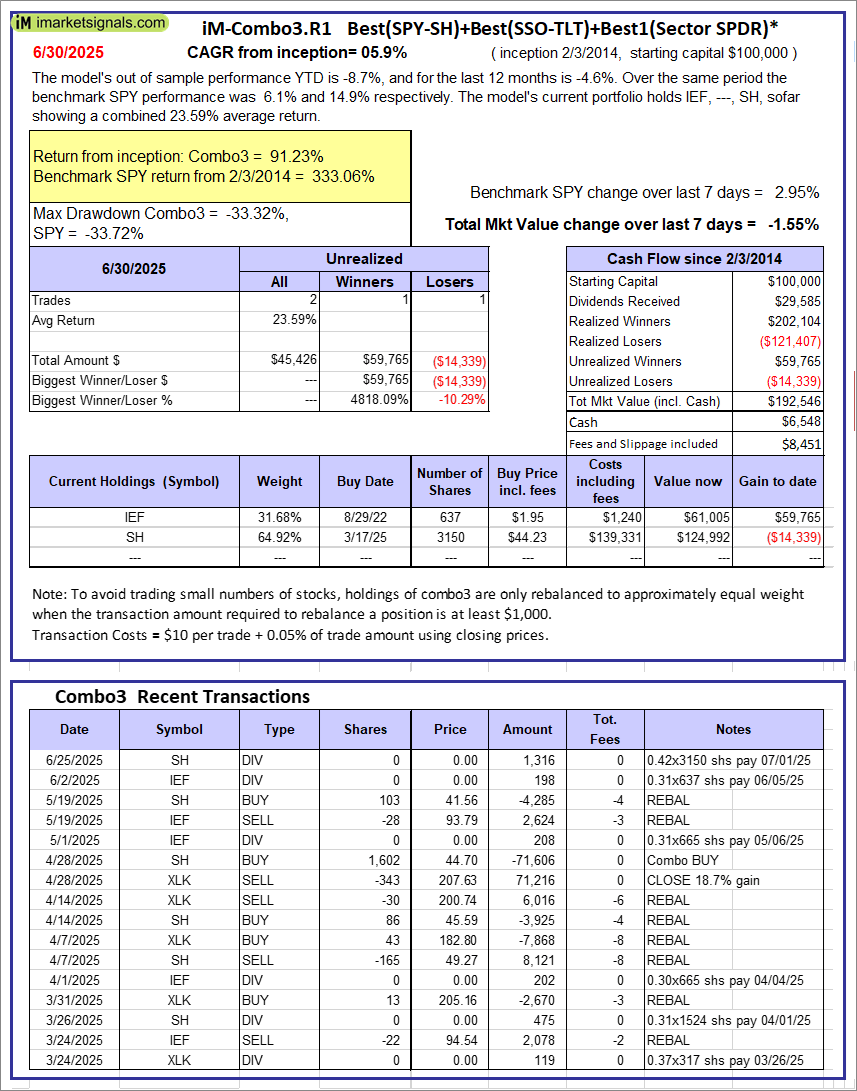 |
iM-Combo3.R1: The model’s out of sample performance YTD is -8.7%, and for the last 12 months is -4.6%. Over the same period the benchmark SPY performance was 6.1% and 14.9% respectively. Over the previous week the market value of iM-Combo3.R1 gained -1.55% at a time when SPY gained 2.95%. A starting capital of $100,000 at inception on 2/3/2014 would have grown to $192,546 which includes $6,548 cash and excludes $8,451 spent on fees and slippage. |
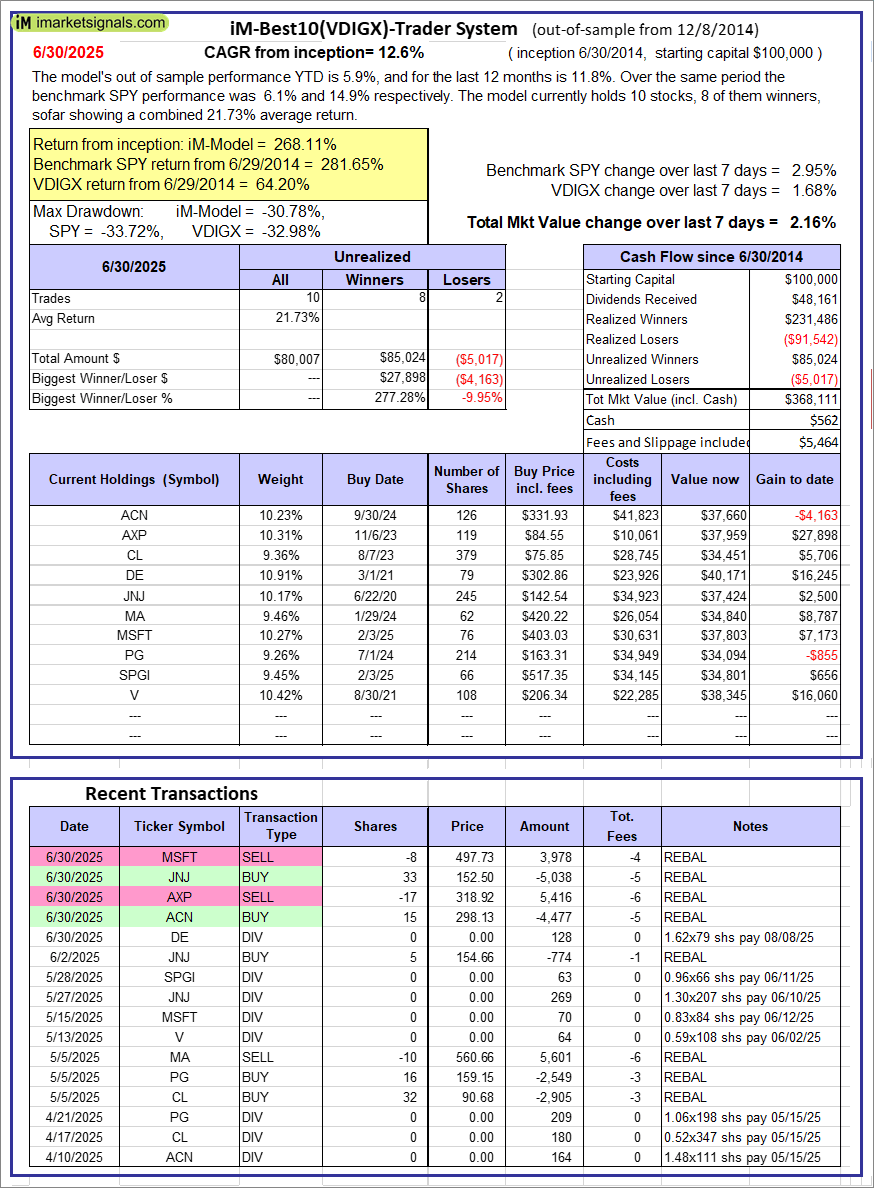 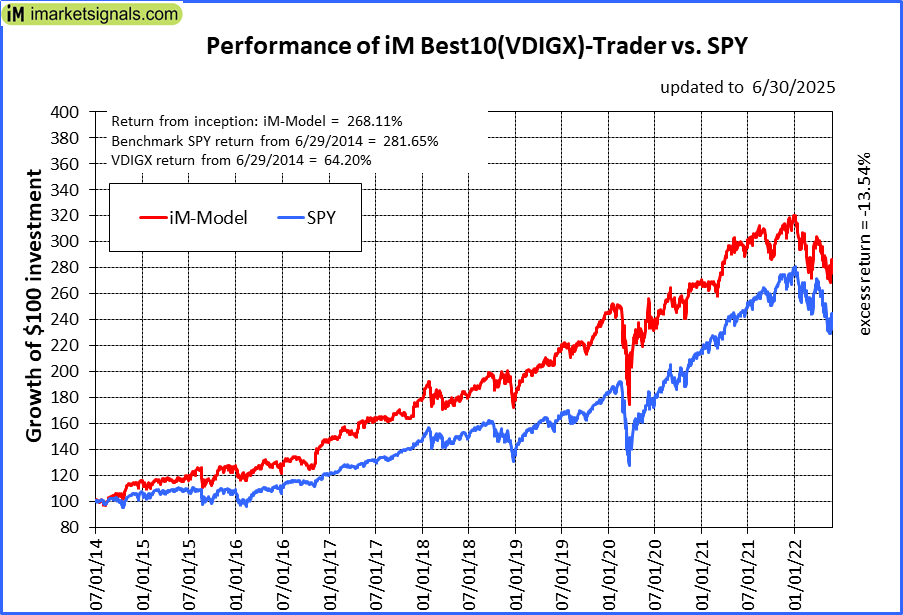 |
iM-Best10(VDIGX)-Trader: The model’s out of sample performance YTD is 5.9%, and for the last 12 months is 11.8%. Over the same period the benchmark SPY performance was 6.1% and 14.9% respectively. Since inception, on 7/1/2014, the model gained 268.11% while the benchmark SPY gained 281.65% and VDIGX gained 64.20% over the same period. Over the previous week the market value of iM-Best10(VDIGX) gained 2.16% at a time when SPY gained 2.95%. A starting capital of $100,000 at inception on 7/1/2014 would have grown to $368,111 which includes $562 cash and excludes $5,464 spent on fees and slippage. |
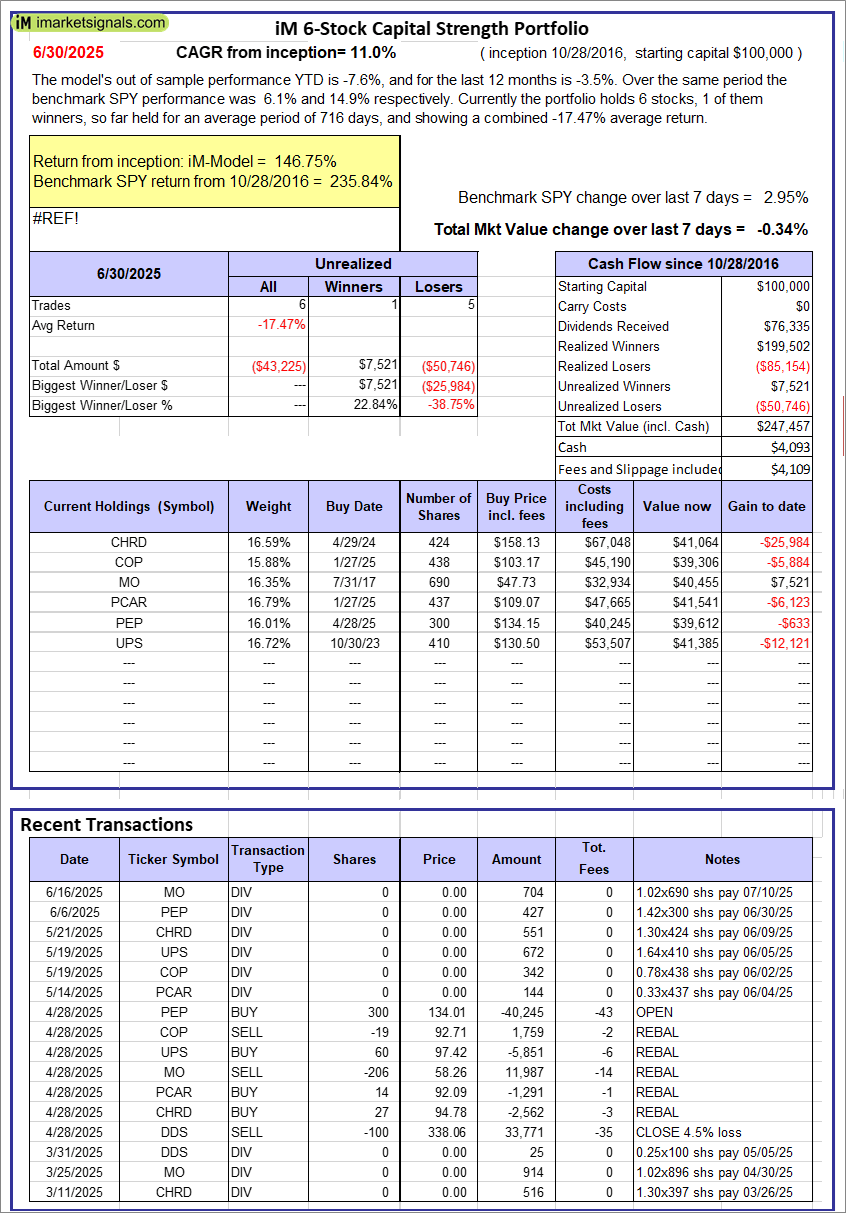 |
iM 6-Stock Capital Strength Portfolio: The model’s out of sample performance YTD is -7.6%, and for the last 12 months is -3.5%. Over the same period the benchmark SPY performance was 6.1% and 14.9% respectively. Over the previous week the market value of the iM 6-Stock Capital Strength Portfolio gained -0.34% at a time when SPY gained 2.95%. A starting capital of $100,000 at inception on 10/28/2016 would have grown to $247,457 which includes $4,093 cash and excludes $4,109 spent on fees and slippage. |
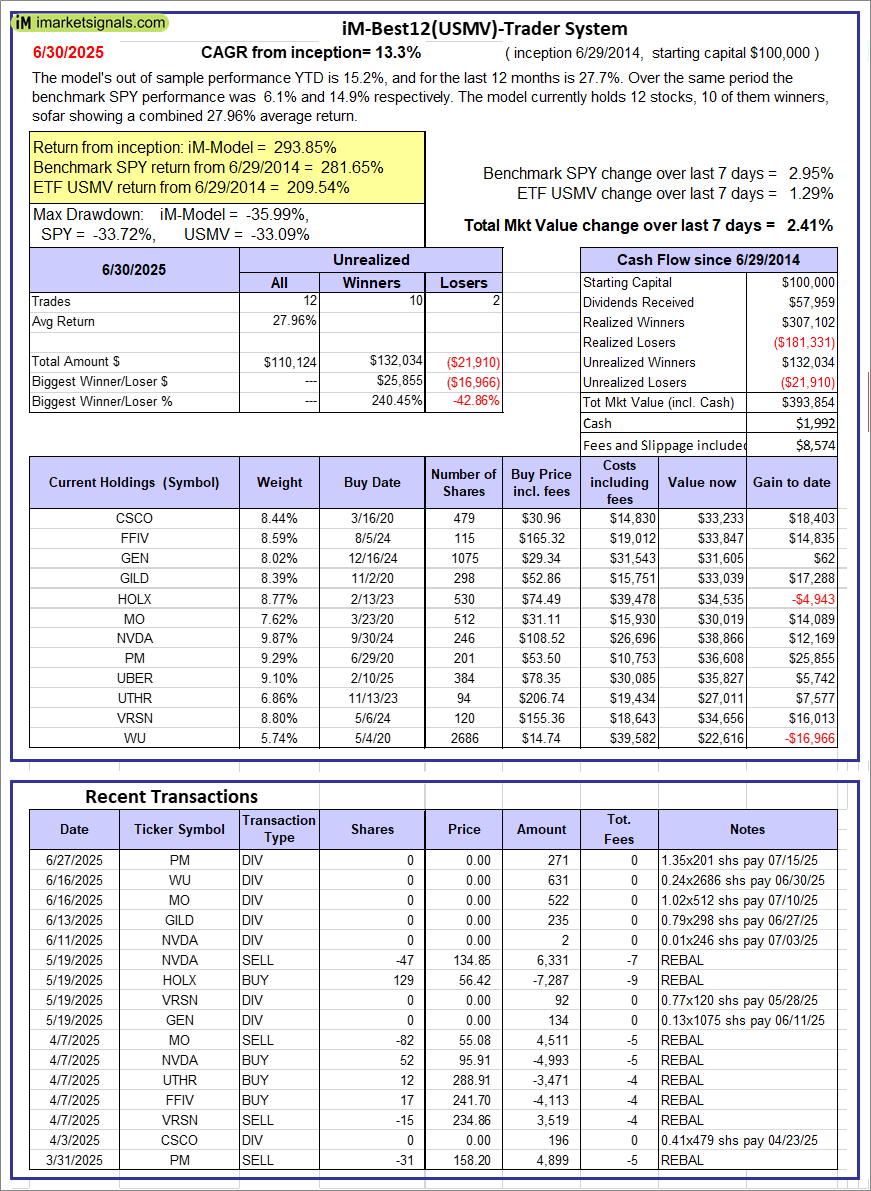 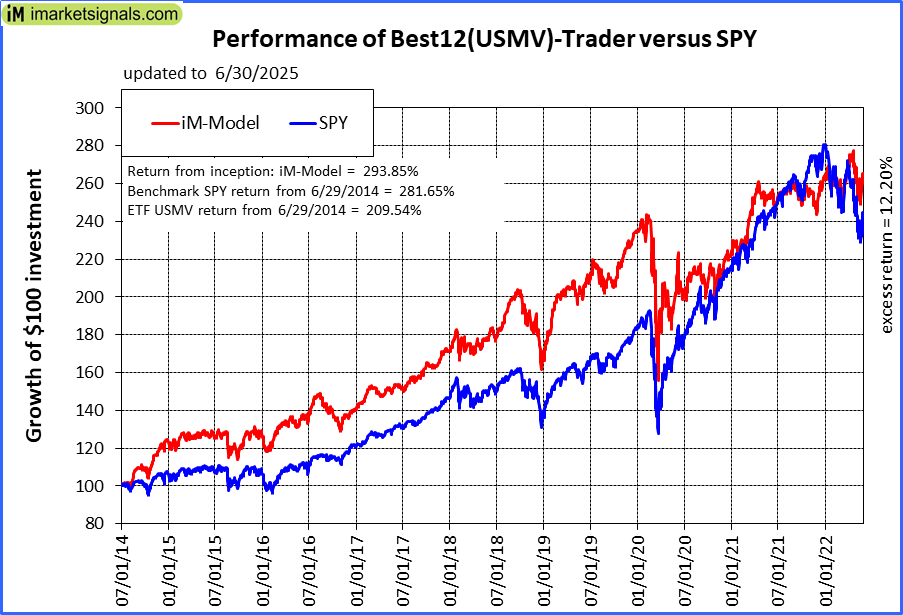 |
iM-Best12(USMV)-Trader: The model’s out of sample performance YTD is 15.2%, and for the last 12 months is 27.7%. Over the same period the benchmark SPY performance was 6.1% and 14.9% respectively. Since inception, on 6/30/2014, the model gained 293.85% while the benchmark SPY gained 281.65% and the ETF USMV gained 209.54% over the same period. Over the previous week the market value of iM-Best12(USMV)-Trader gained 2.41% at a time when SPY gained 2.95%. A starting capital of $100,000 at inception on 6/30/2014 would have grown to $393,854 which includes $1,992 cash and excludes $8,574 spent on fees and slippage. |
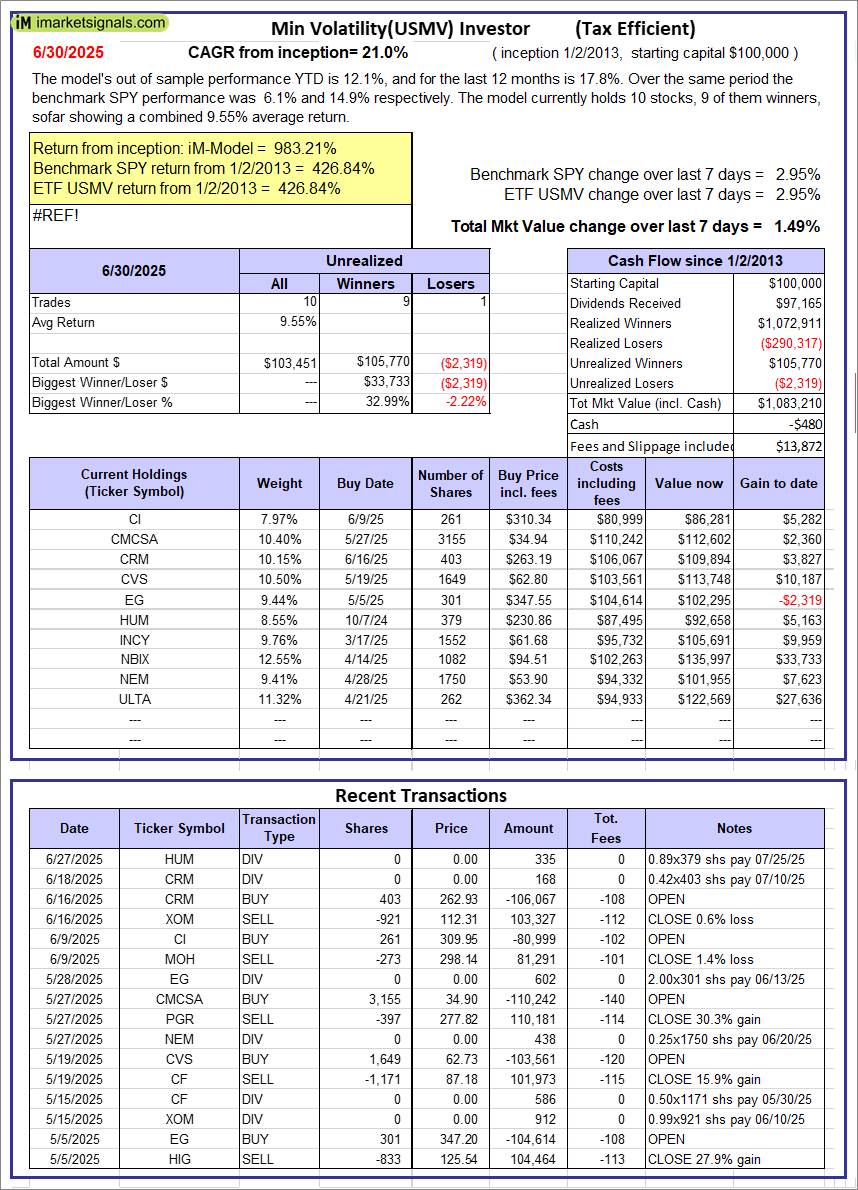 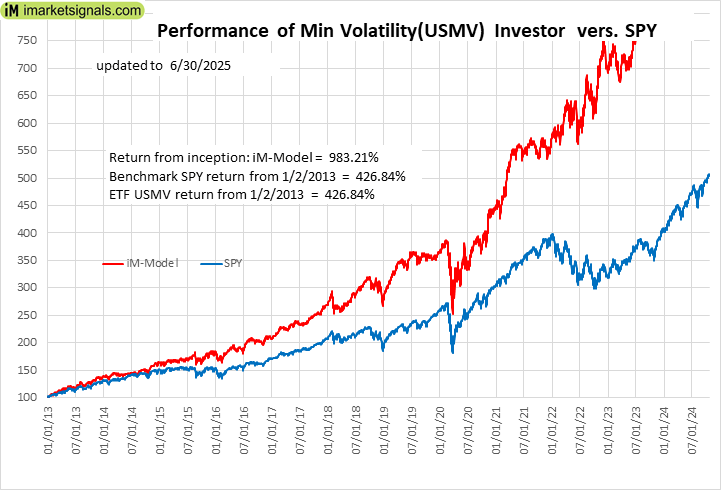 |
iM-Min Volatility(USMV) Investor (Tax Efficient): The model’s out of sample performance YTD is 12.1%, and for the last 12 months is 17.8%. Over the same period the benchmark SPY performance was 6.1% and 14.9% respectively. Since inception, on 1/3/2013, the model gained 983.21% while the benchmark SPY gained 426.84% and the ETF USMV gained 426.84% over the same period. Over the previous week the market value of iM-Best12(USMV)Q1 gained 1.49% at a time when SPY gained 2.95%. A starting capital of $100,000 at inception on 1/3/2013 would have grown to $1,083,210 which includes -$480 cash and excludes $13,872 spent on fees and slippage. |
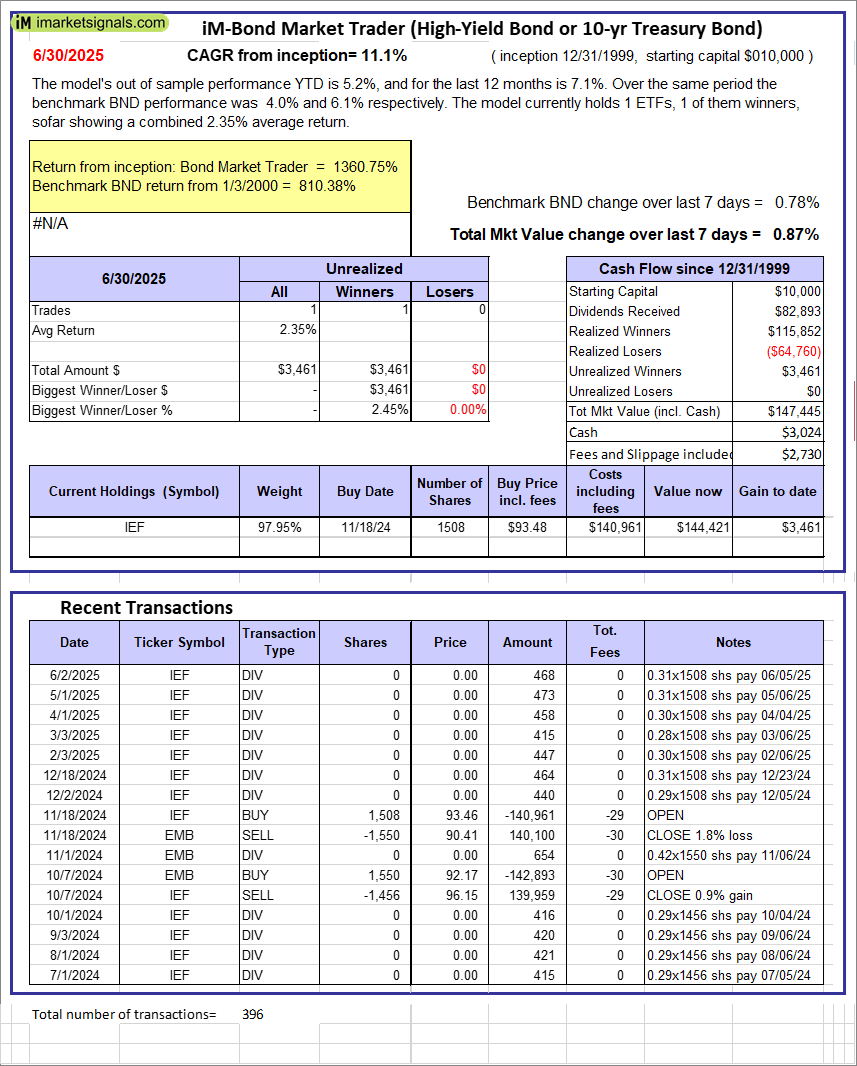 |
iM-Bond Market Trader (High-Yield Bond or 10-yr Treasury Bond): The model’s out of sample performance YTD is 5.2%, and for the last 12 months is 7.1%. Over the same period the benchmark BND performance was 4.0% and 6.1% respectively. Over the previous week the market value of the iM-Bond Market Trader (High-Yield Bond or 10-yr Treasury Bond) gained 0.87% at a time when BND gained 0.78%. A starting capital of $10,000 at inception on 1/3/2000 would have grown to $147,445 which includes $3,024 cash and excludes $2,730 spent on fees and slippage. |
|
|
iM-ModSum/YieldCurve Timer: The model’s out of sample performance YTD is 15.1%, and for the last 12 months is 25.3%. Over the same period the benchmark SPY performance was 6.1% and 14.9% respectively. Over the previous week the market value of iM-PortSum/YieldCurve Timer gained 0.88% at a time when SPY gained 2.95%. A starting capital of $100,000 at inception on 1/1/2016 would have grown to $369,426 which includes $1,095 cash and excludes $1,974 spent on fees and slippage. |
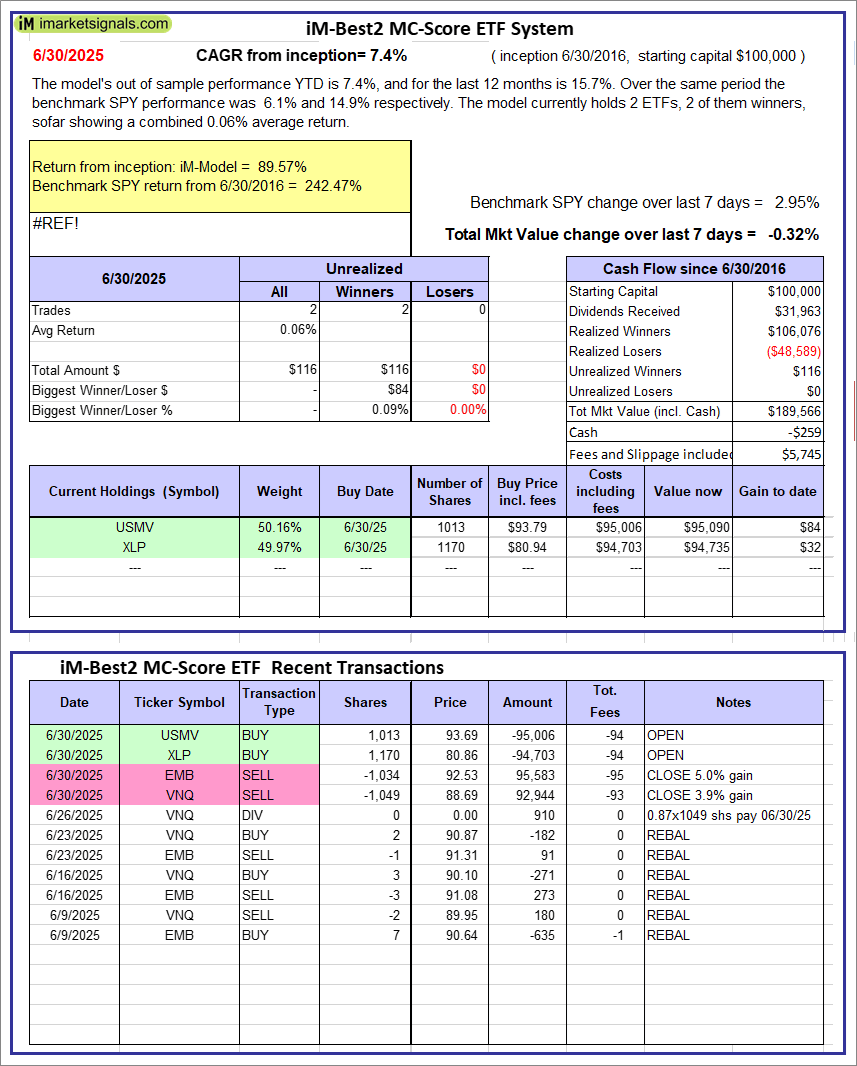 |
iM-Best2 MC-Score ETF System: The model’s out of sample performance YTD is 7.4%, and for the last 12 months is 15.7%. Over the same period the benchmark SPY performance was 6.1% and 14.9% respectively. Over the previous week the market value of the iM-Best2 MC-Score ETF System gained -0.32% at a time when SPY gained 2.95%. A starting capital of $100,000 at inception on 6/30/2016 would have grown to $189,566 which includes -$259 cash and excludes $5,745 spent on fees and slippage. |
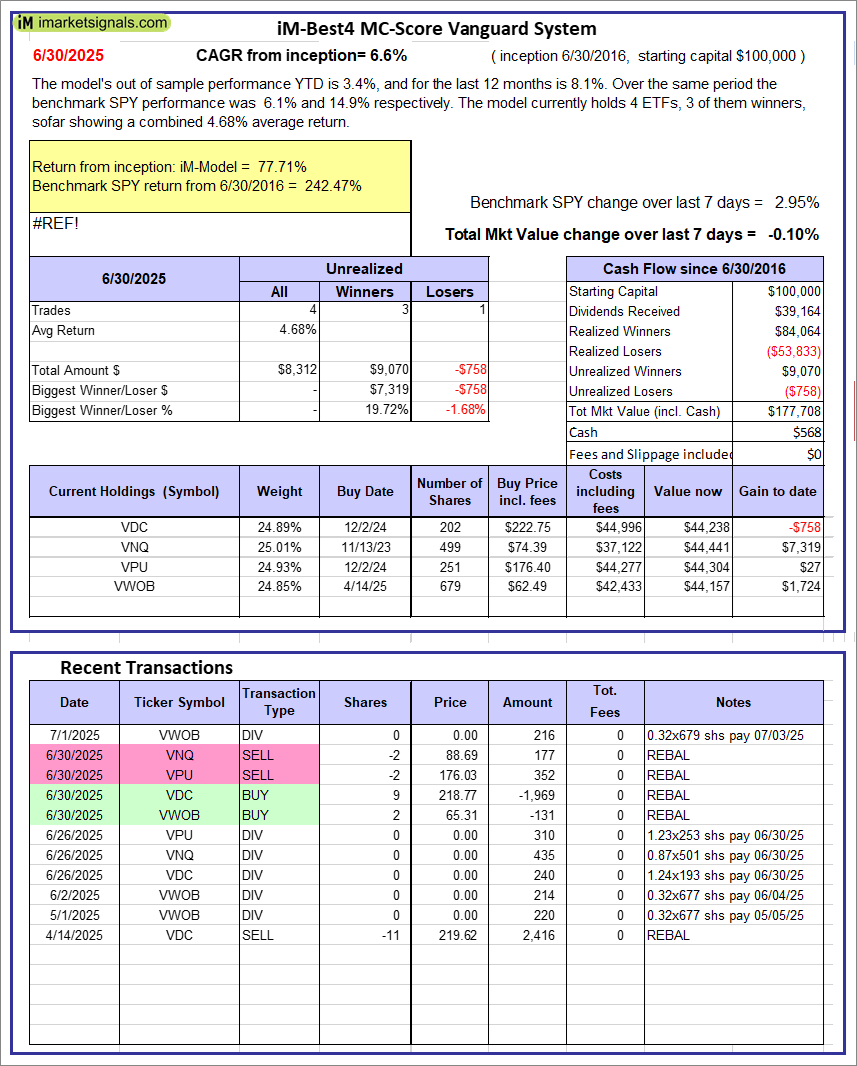 |
iM-Best4 MC-Score Vanguard System: The model’s out of sample performance YTD is 3.4%, and for the last 12 months is 8.1%. Over the same period the benchmark SPY performance was 6.1% and 14.9% respectively. Over the previous week the market value of the iM-Best4 MC-Score Vanguard System gained -0.10% at a time when SPY gained 2.95%. A starting capital of $100,000 at inception on 6/30/2016 would have grown to $177,708 which includes $568 cash and excludes $00 spent on fees and slippage. |
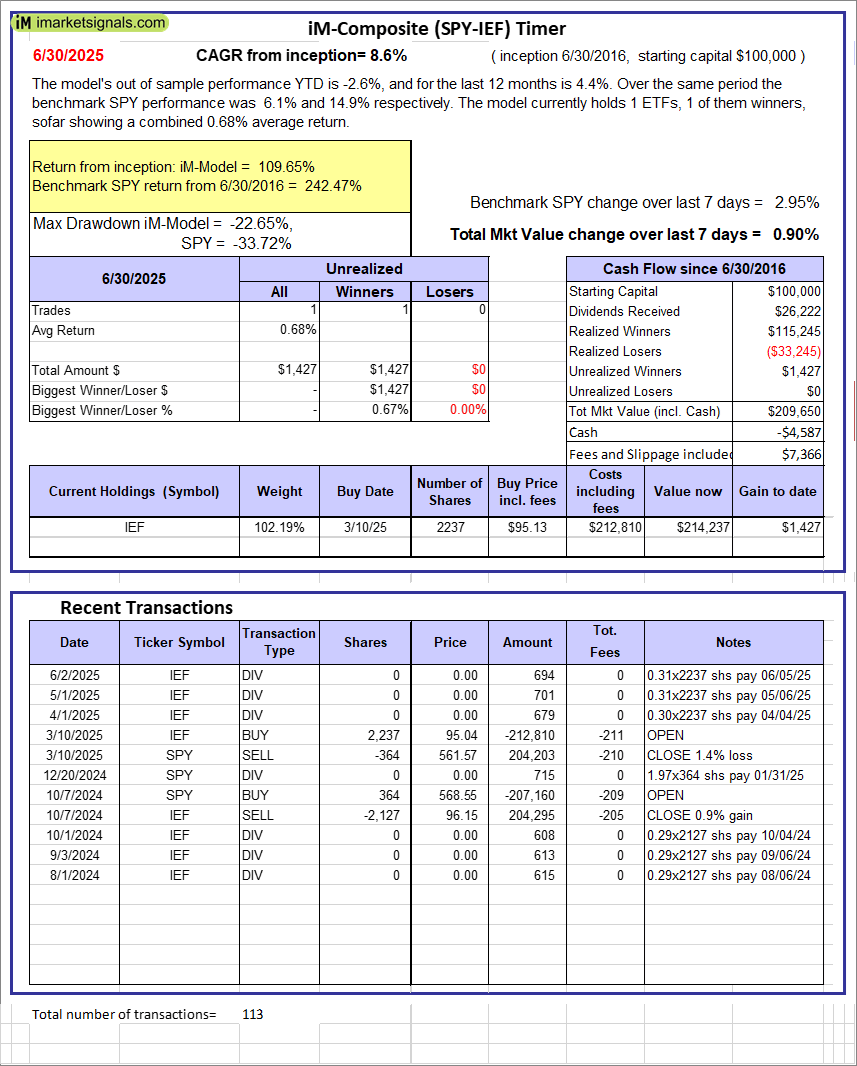 |
iM-Composite (SPY-IEF) Timer: The model’s out of sample performance YTD is -2.6%, and for the last 12 months is 4.4%. Over the same period the benchmark SPY performance was 6.1% and 14.9% respectively. Over the previous week the market value of the iM-Composite (SPY-IEF) Timer gained 0.90% at a time when SPY gained 2.95%. A starting capital of $100,000 at inception on 6/30/2016 would have grown to $209,650 which includes -$4,587 cash and excludes $7,366 spent on fees and slippage. |
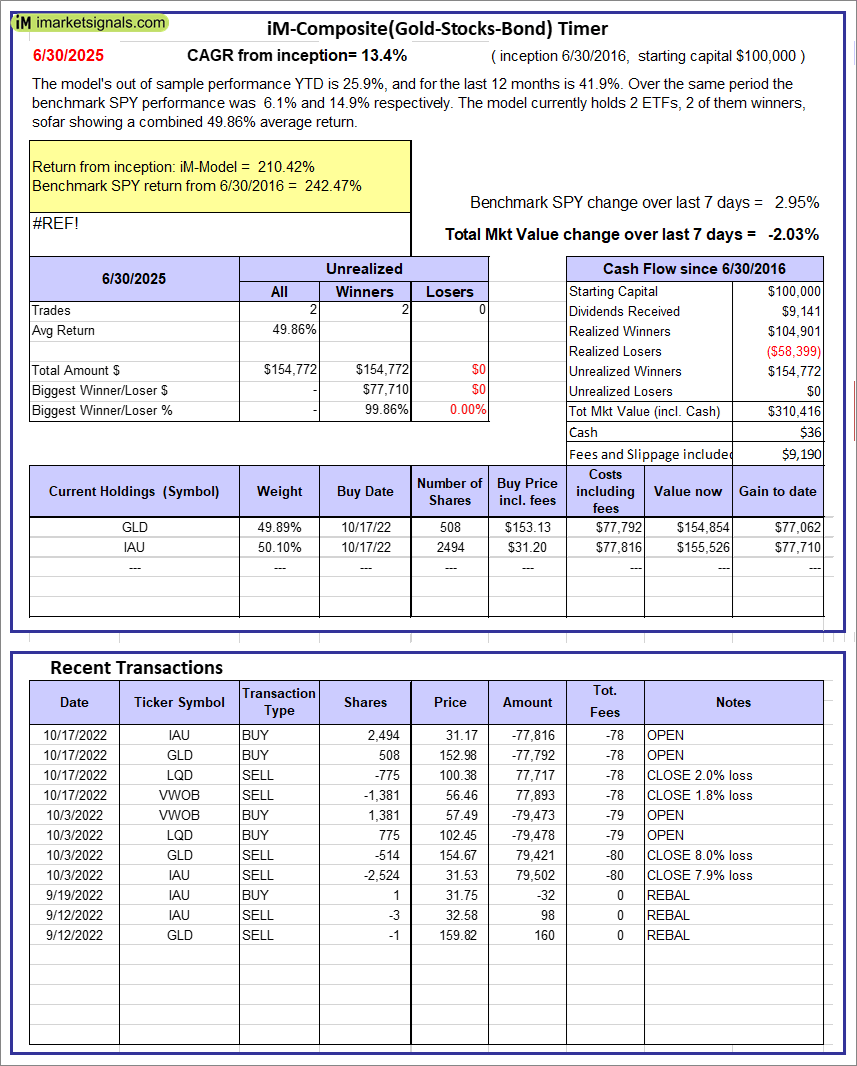 |
iM-Composite(Gold-Stocks-Bond) Timer: The model’s out of sample performance YTD is 25.9%, and for the last 12 months is 41.9%. Over the same period the benchmark SPY performance was 6.1% and 14.9% respectively. Over the previous week the market value of the iM-Composite(Gold-Stocks-Bond) Timer gained -2.03% at a time when SPY gained 2.95%. A starting capital of $100,000 at inception on 6/30/2016 would have grown to $310,416 which includes $36 cash and excludes $9,190 spent on fees and slippage. |
iM-Best Reports – 7/1/2025
Posted in pmp SPY-SH
Leave a Reply
You must be logged in to post a comment.