
  |
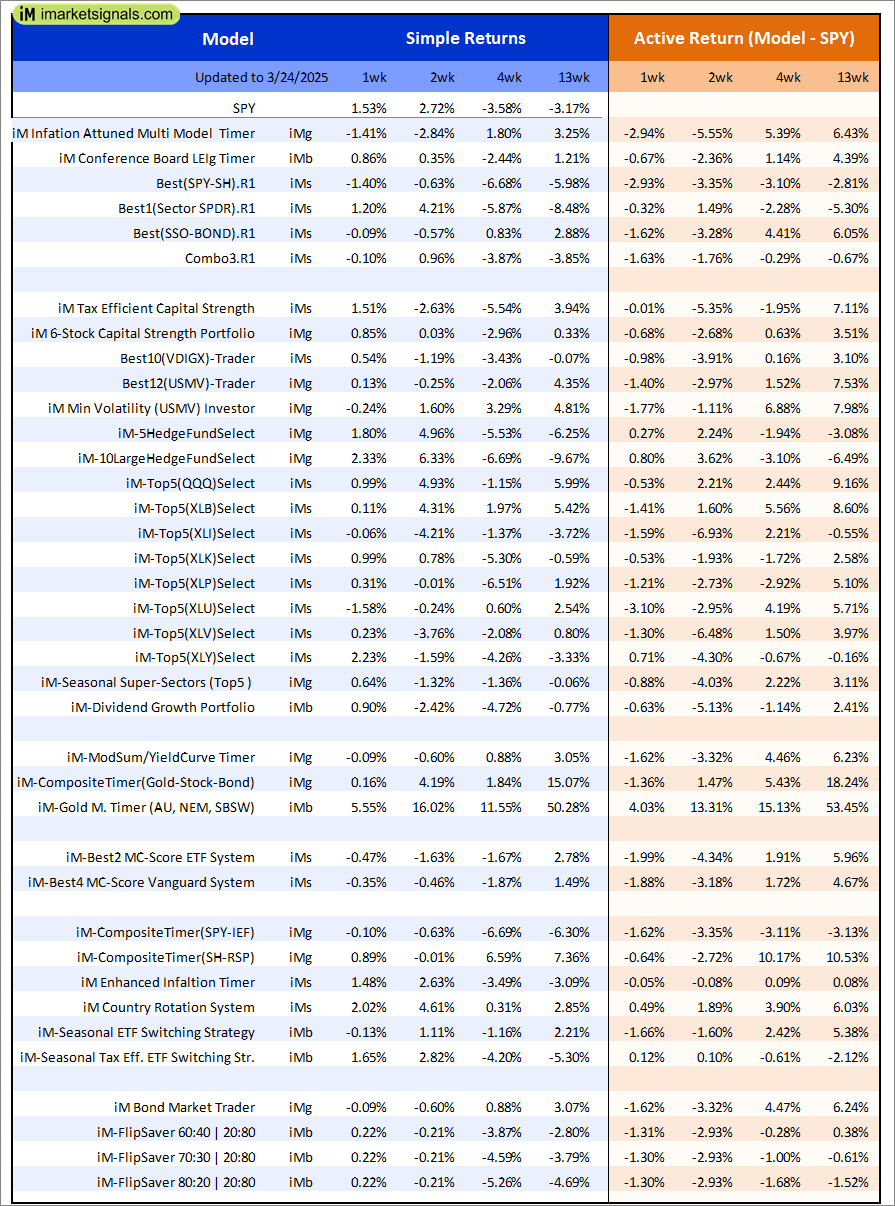
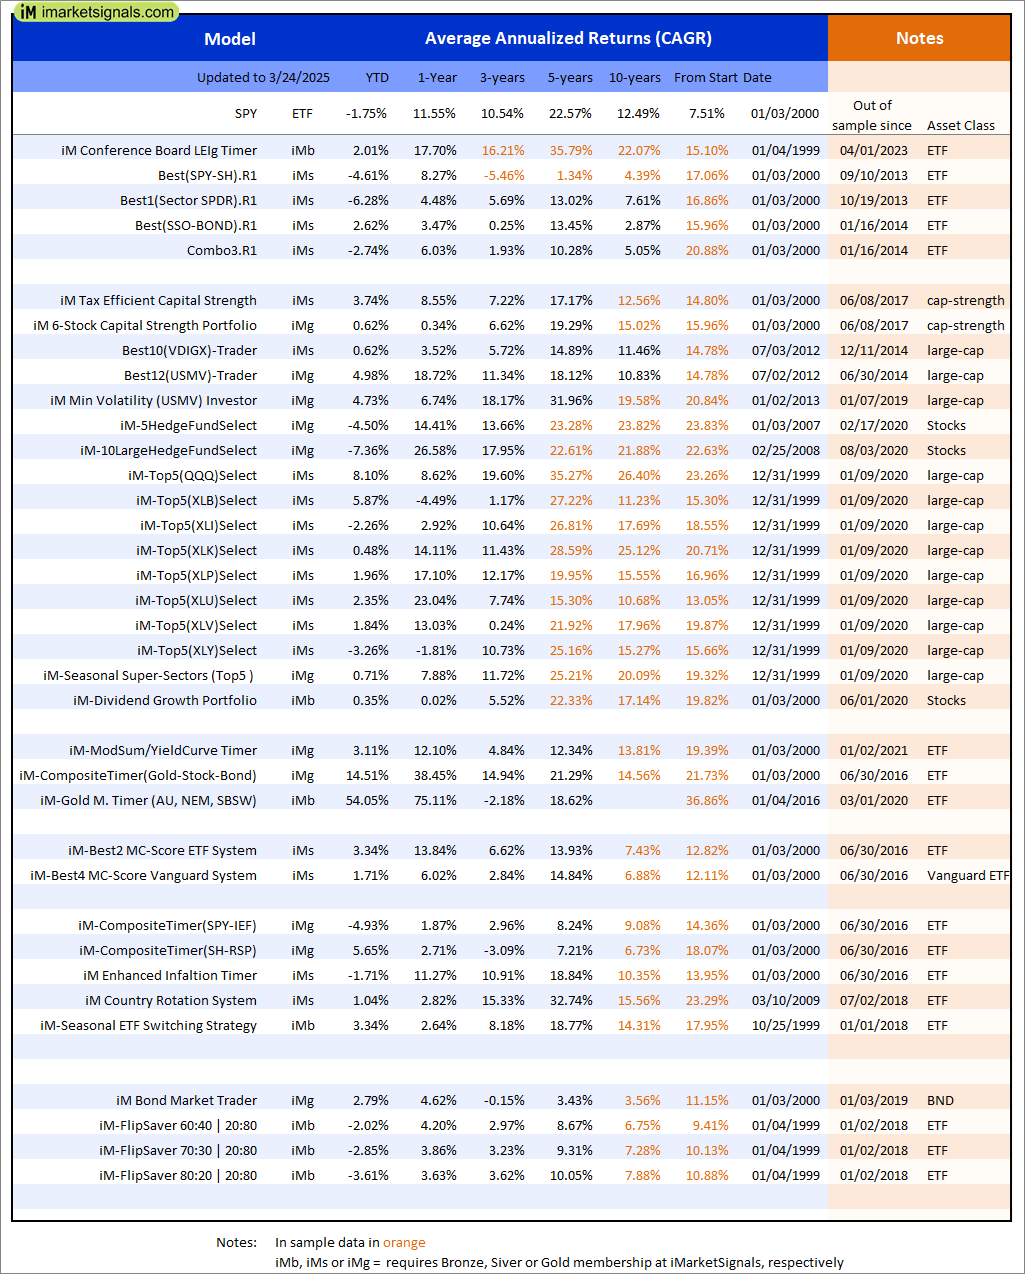
Out of sample performance summary of our models for the past 1, 2, 4 and 13 week periods. The active active return indicates how the models over- or underperformed the benchmark ETF SPY. Also the YTD, and the 1-, 3-, 5- and 10-year annualized returns are shown in the second table |
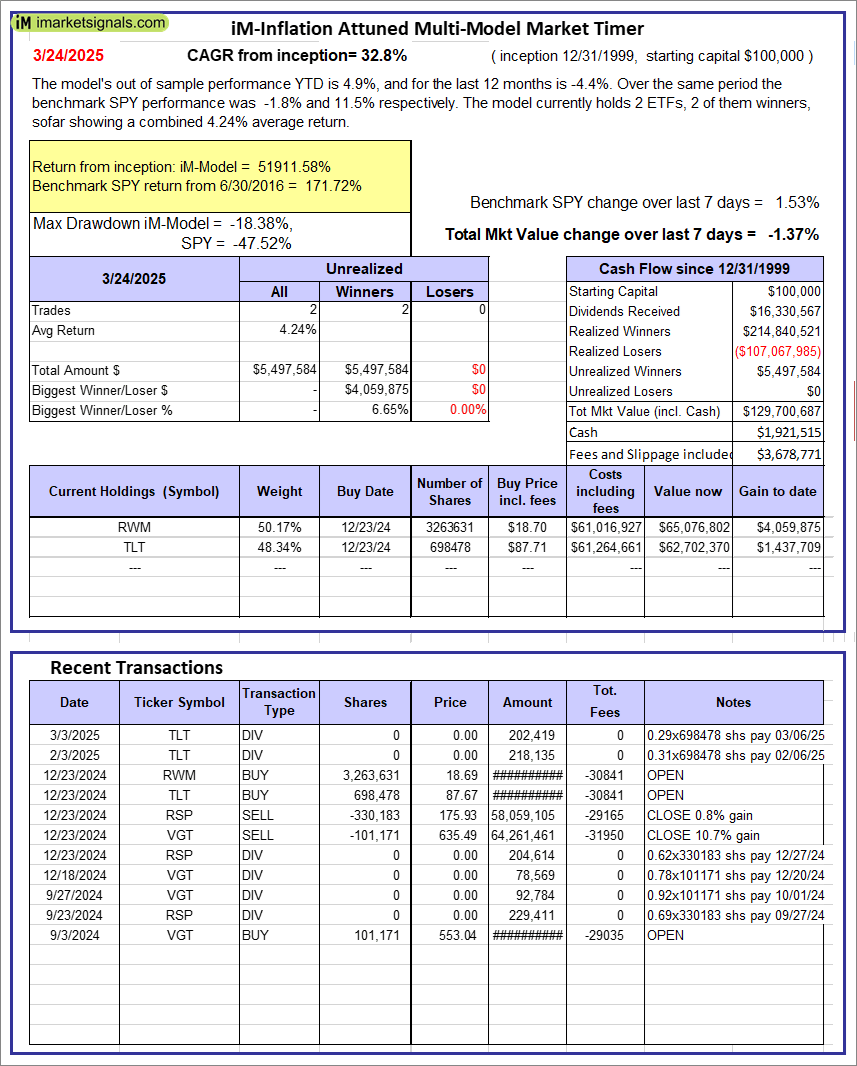 |
iM-Inflation Attuned Multi-Model Market Timer: The model’s out of sample performance YTD is 4.9%, and for the last 12 months is -4.4%. Over the same period the benchmark SPY performance was -1.8% and 11.5% respectively. Over the previous week the market value of the iM-Inflation Attuned Multi-Model Market Timer gained -1.37% at a time when SPY gained 1.53%. A starting capital of $100,000 at inception on 3/24/2017 would have grown to $129,700,687 which includes $1,921,515 cash and excludes $3,678,771 spent on fees and slippage. |
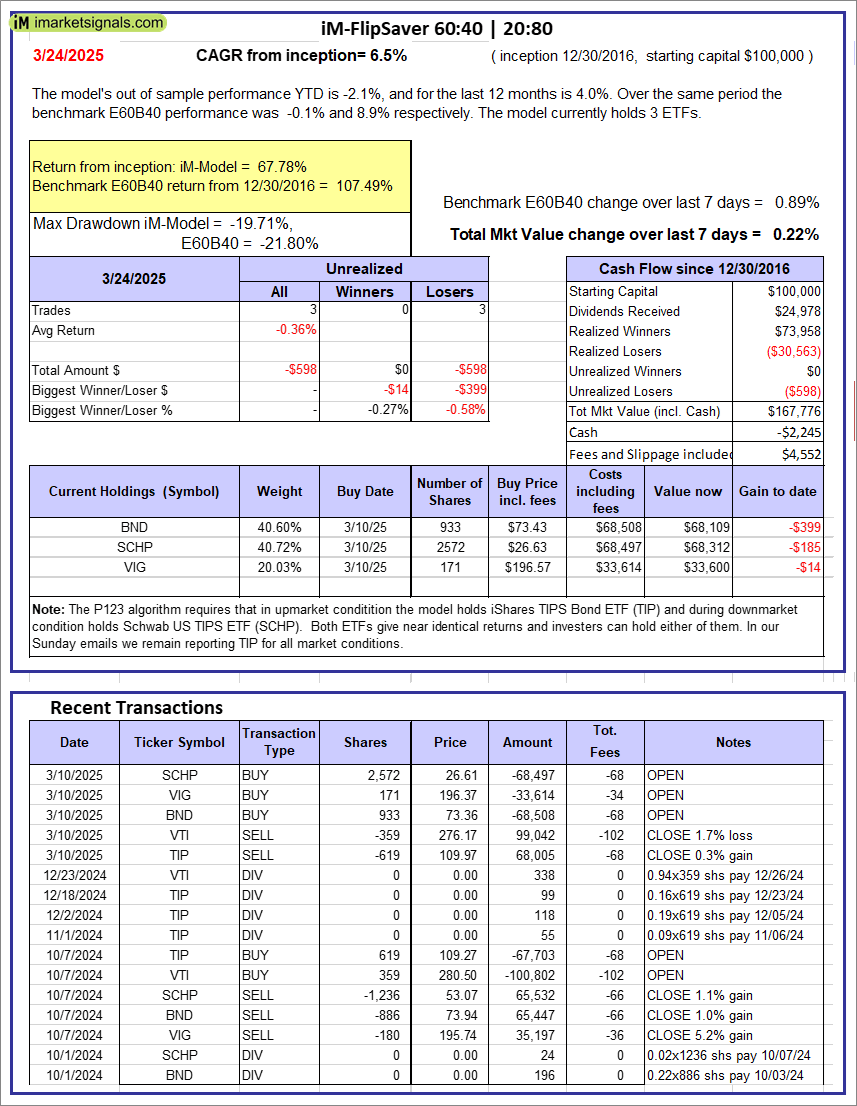 |
iM-FlipSaver 60:40 | 20:80 – 2017: The model’s out of sample performance YTD is -2.1%, and for the last 12 months is 4.0%. Over the same period the benchmark E60B40 performance was -0.1% and 8.9% respectively. Over the previous week the market value of iM-FlipSaver 80:20 | 20:80 gained 0.22% at a time when SPY gained 0.89%. A starting capital of $100,000 at inception on 7/16/2015 would have grown to $167,776 which includes -$2,245 cash and excludes $4,552 spent on fees and slippage. |
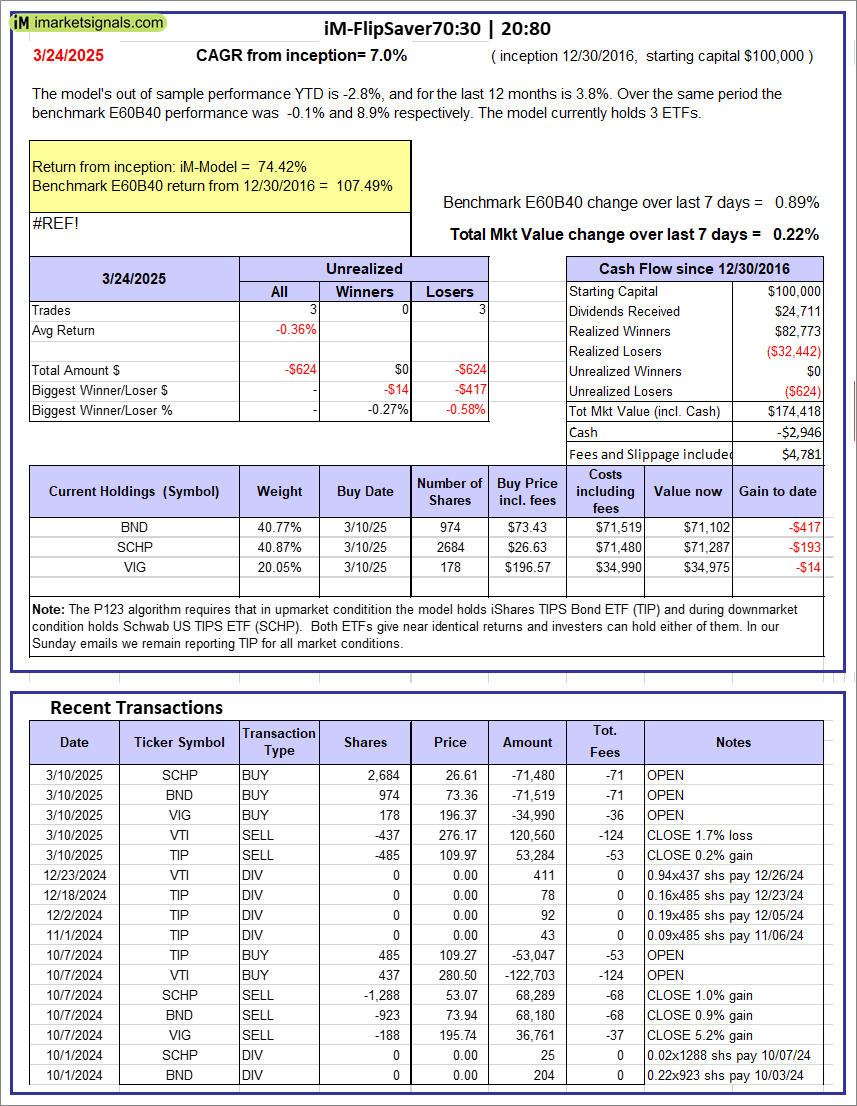 |
iM-FlipSaver 70:30 | 20:80 – 2017: The model’s out of sample performance YTD is -2.8%, and for the last 12 months is 3.8%. Over the same period the benchmark E60B40 performance was -0.1% and 8.9% respectively. Over the previous week the market value of iM-FlipSaver 70:30 | 20:80 gained 0.22% at a time when SPY gained 0.89%. A starting capital of $100,000 at inception on 7/15/2015 would have grown to $174,418 which includes -$2,946 cash and excludes $4,781 spent on fees and slippage. |
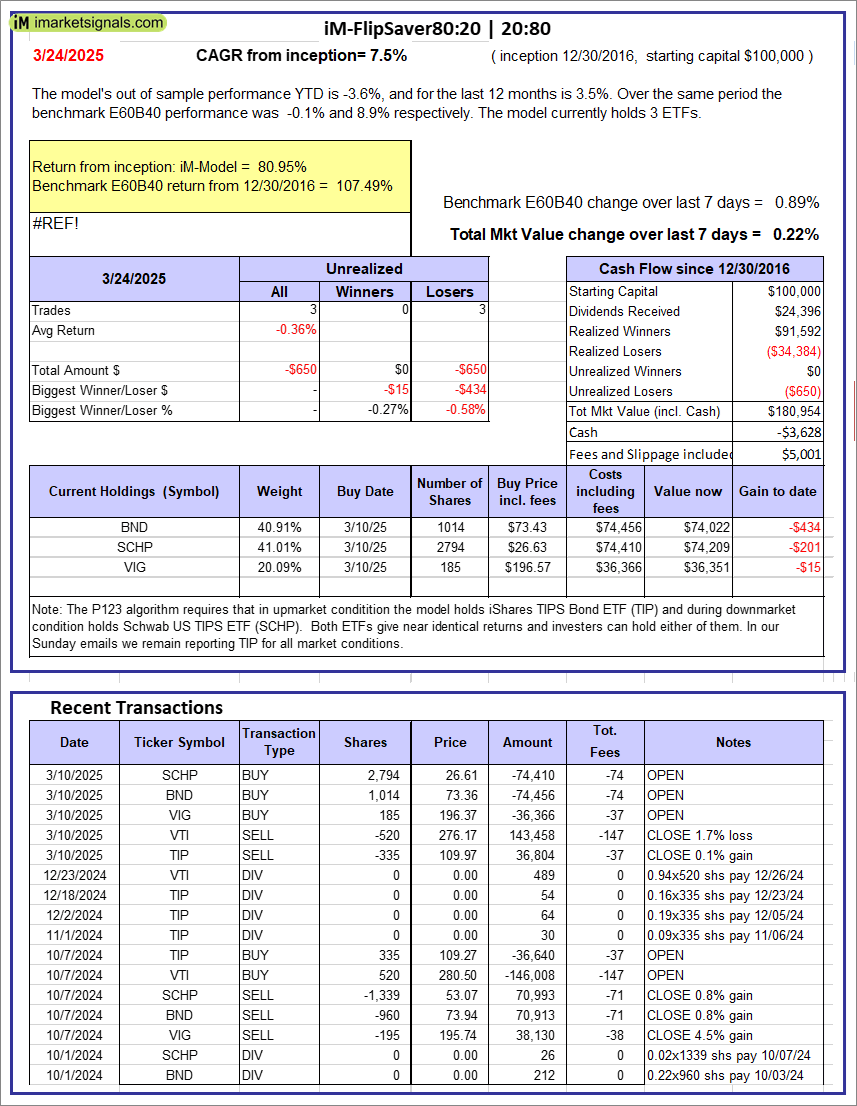 |
iM-FlipSaver 80:20 | 20:80 – 2017: The model’s out of sample performance YTD is -3.6%, and for the last 12 months is 3.5%. Over the same period the benchmark E60B40 performance was -0.1% and 8.9% respectively. Over the previous week the market value of iM-FlipSaver 80:20 | 20:80 gained 0.22% at a time when SPY gained 0.89%. A starting capital of $100,000 at inception on 1/2/2017 would have grown to $180,954 which includes -$3,628 cash and excludes $5,001 spent on fees and slippage. |
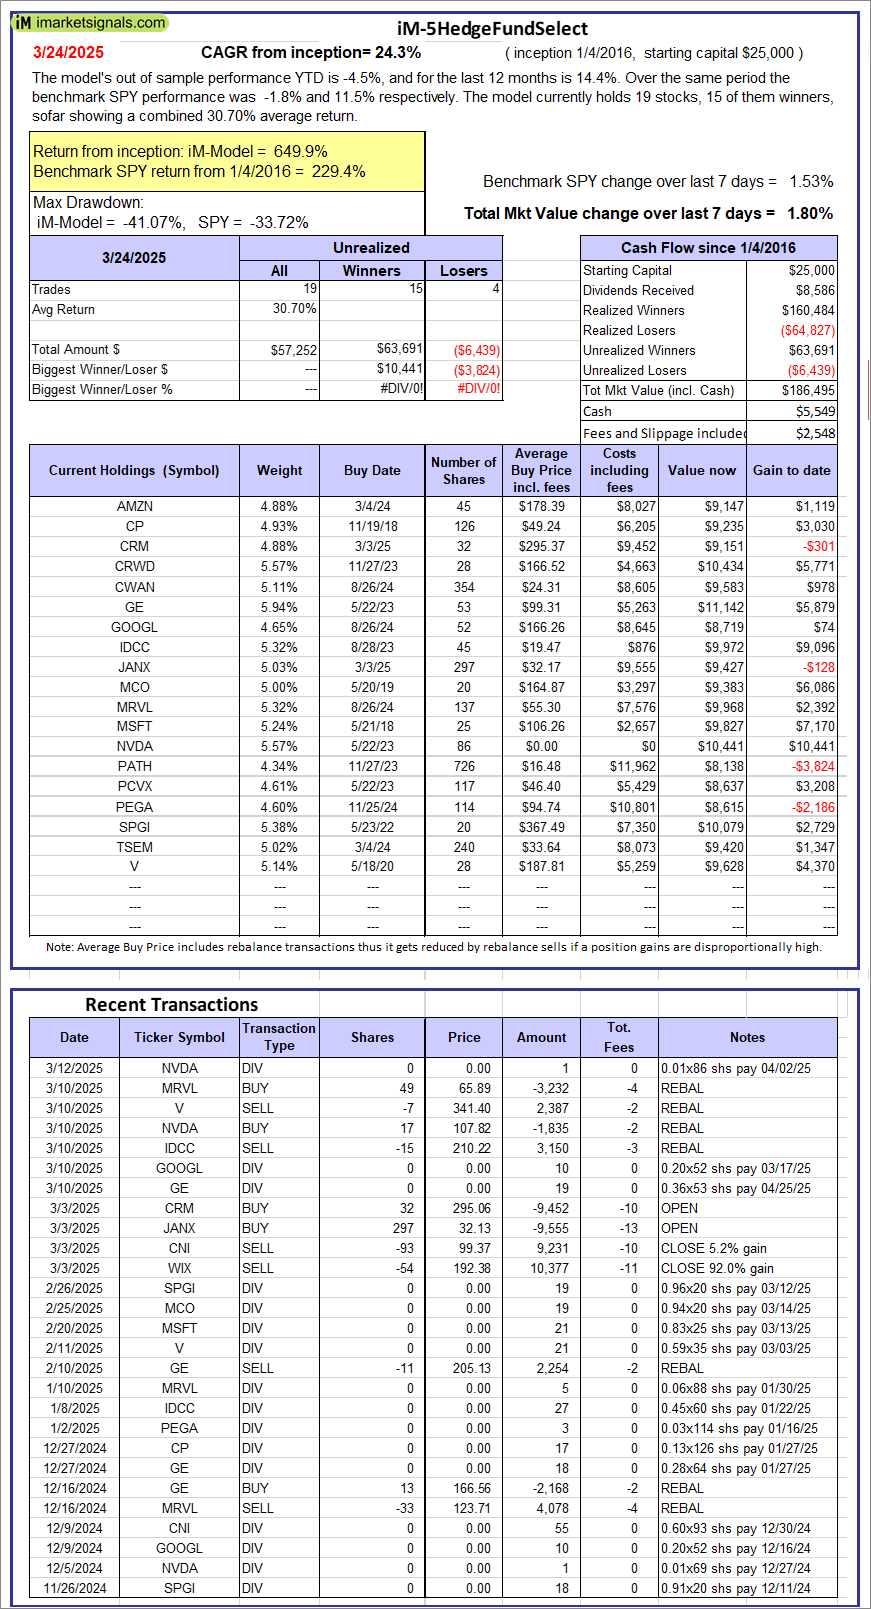 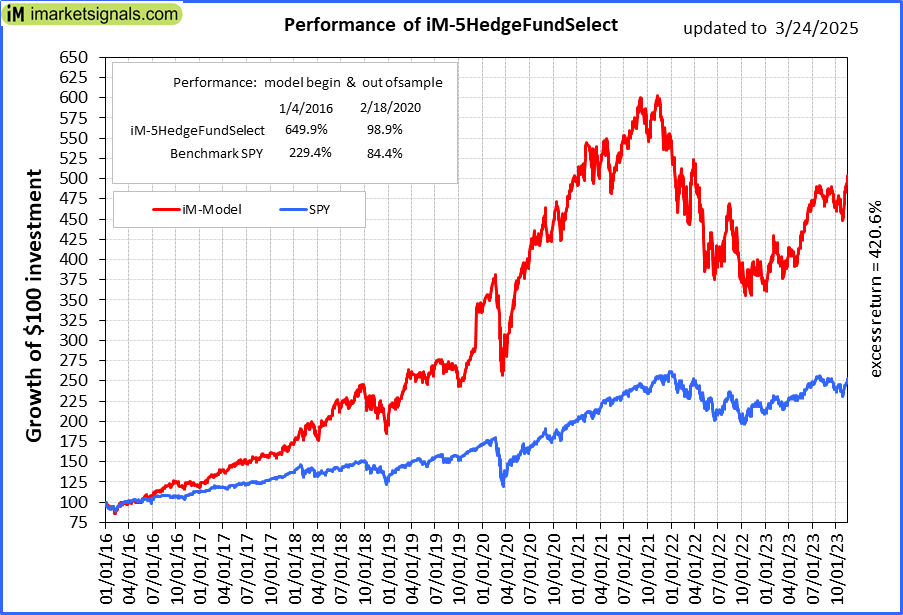 |
iM-5HedgeFundSelect: Since inception, on 1/5/2016, the model gained 649.94% while the benchmark SPY gained 229.38% over the same period. Over the previous week the market value of iM-5HedgeFundSelect gained 1.80% at a time when SPY gained 1.53%. A starting capital of $25,000 at inception on 1/5/2016 would have grown to $186,495 which includes $5,549 cash and excludes $2,548 spent on fees and slippage. |
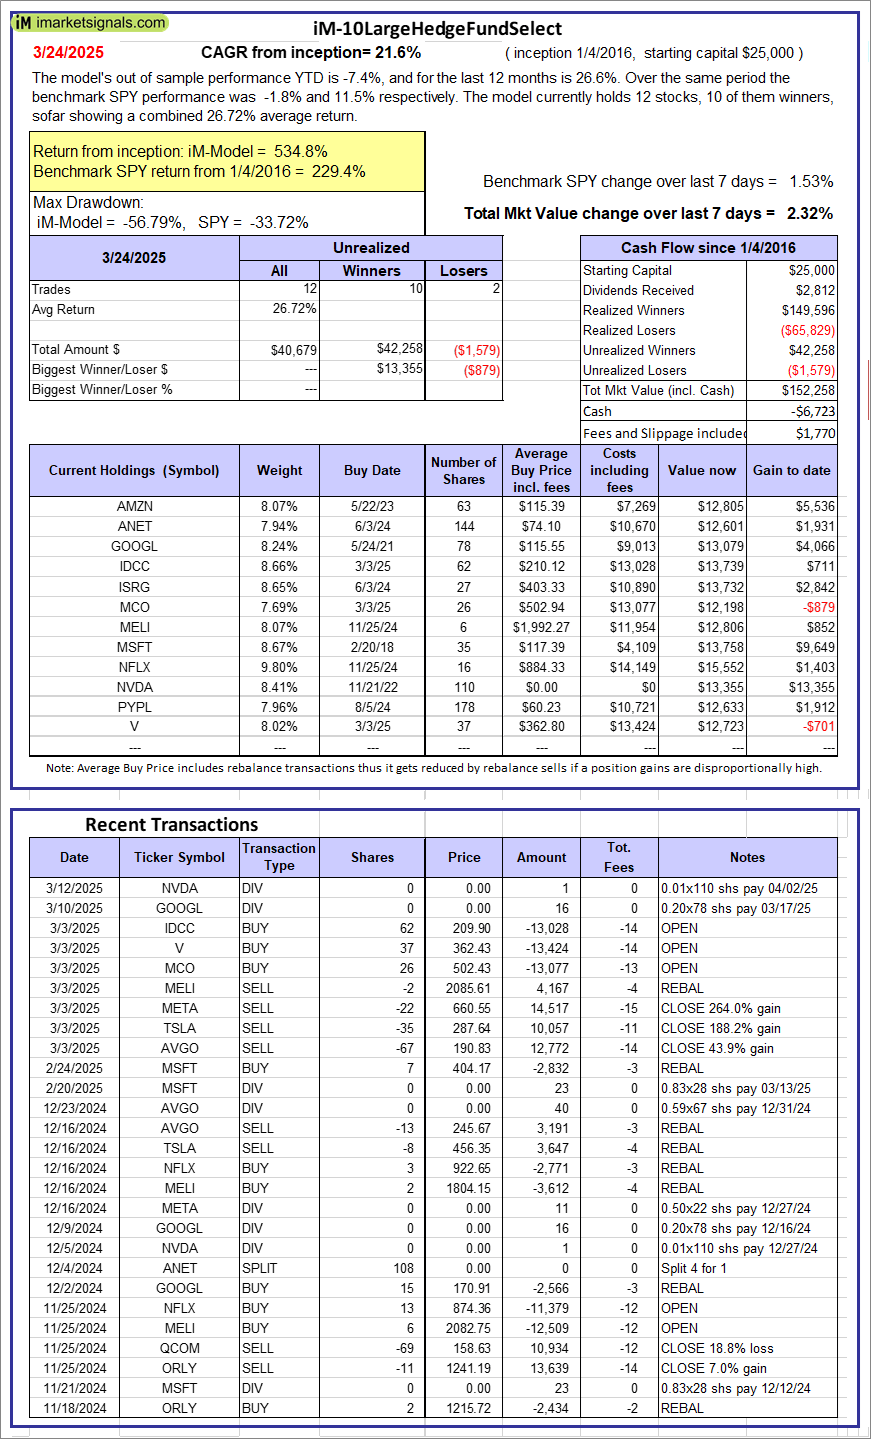 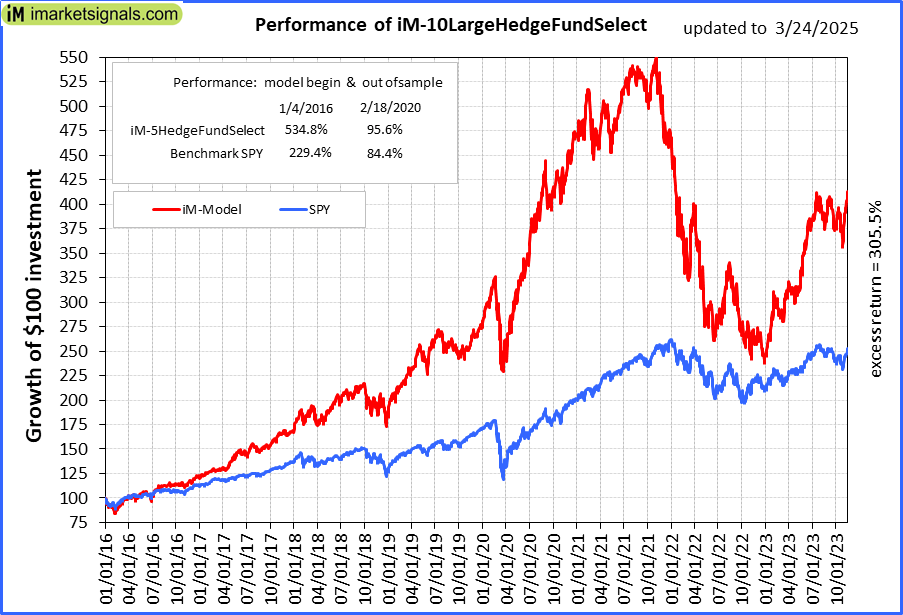 |
iM-10LargeHedgeFundSelect: Since inception, on 1/5/2016, the model gained 534.83% while the benchmark SPY gained 229.38% over the same period. Over the previous week the market value of iM-10LargeHedgeFundSelect gained 2.32% at a time when SPY gained 1.53%. A starting capital of $25,000 at inception on 1/5/2016 would have grown to $152,258 which includes -$6,723 cash and excludes $1,770 spent on fees and slippage. |
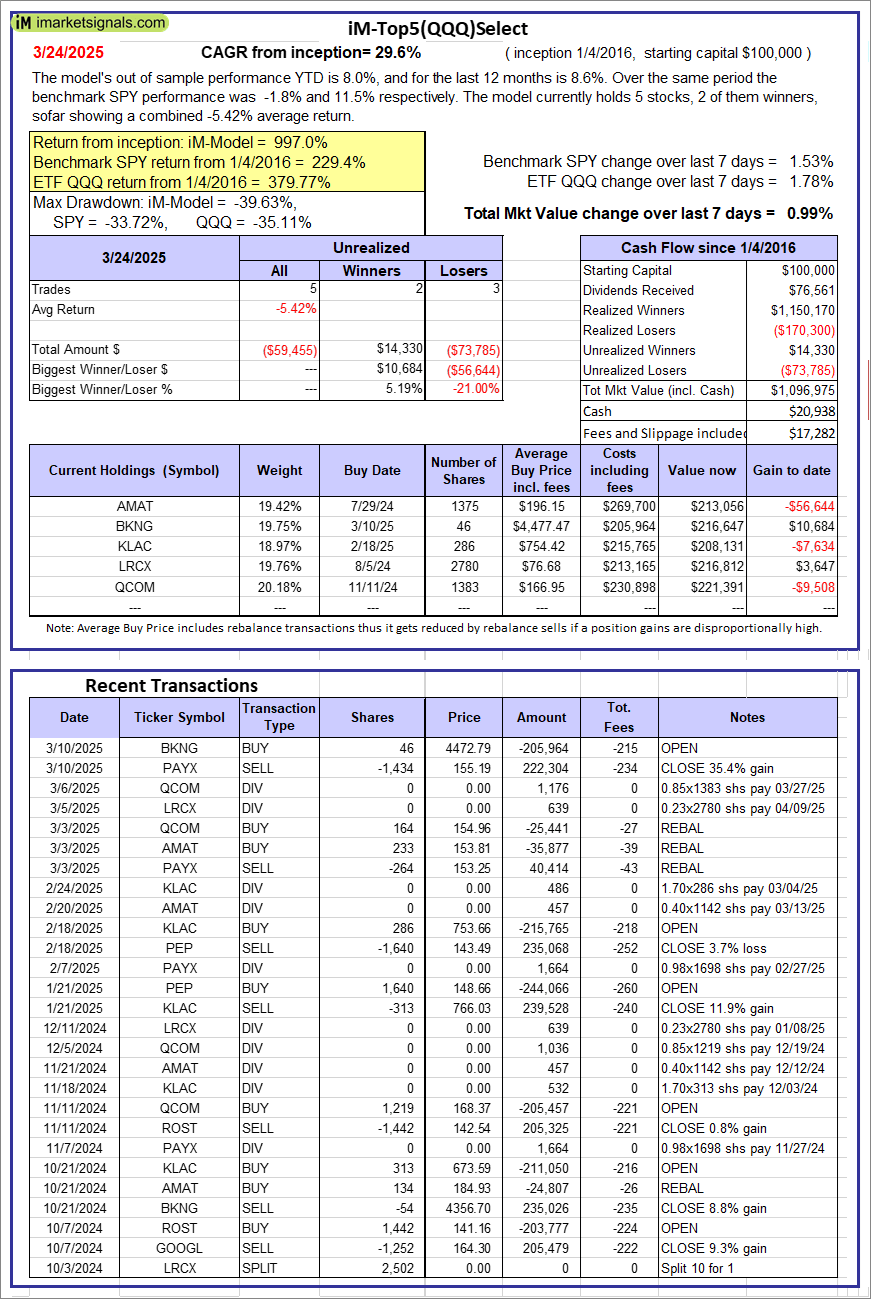 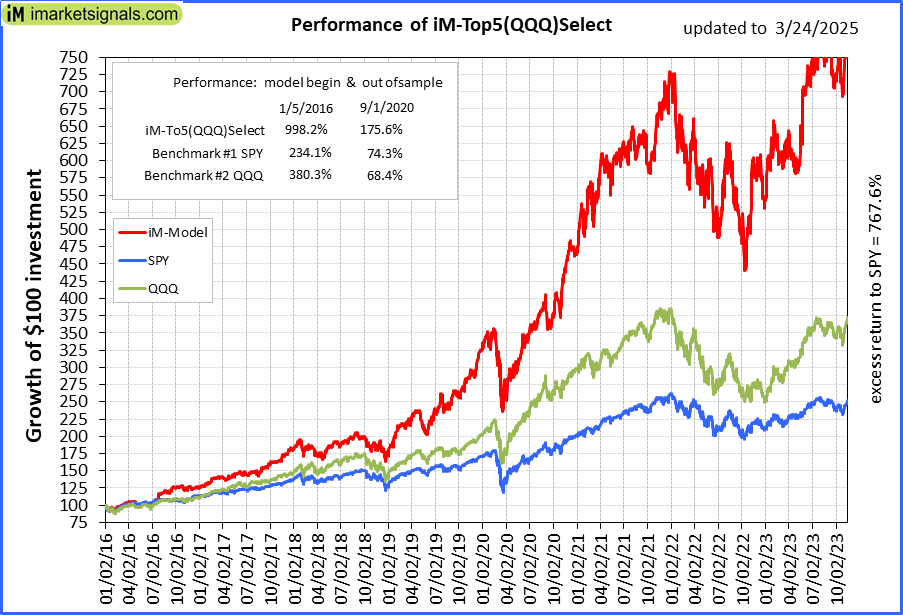 |
iM-Top5(QQQ)Select: Since inception, on 1/5/2016, the model gained 996.98% while the benchmark SPY gained 229.38% over the same period. Over the previous week the market value of iM-Top5(QQQ)Select gained 0.99% at a time when SPY gained 1.53%. A starting capital of $100,000 at inception on 1/5/2016 would have grown to $1,096,975 which includes $20,938 cash and excludes $17,282 spent on fees and slippage. |
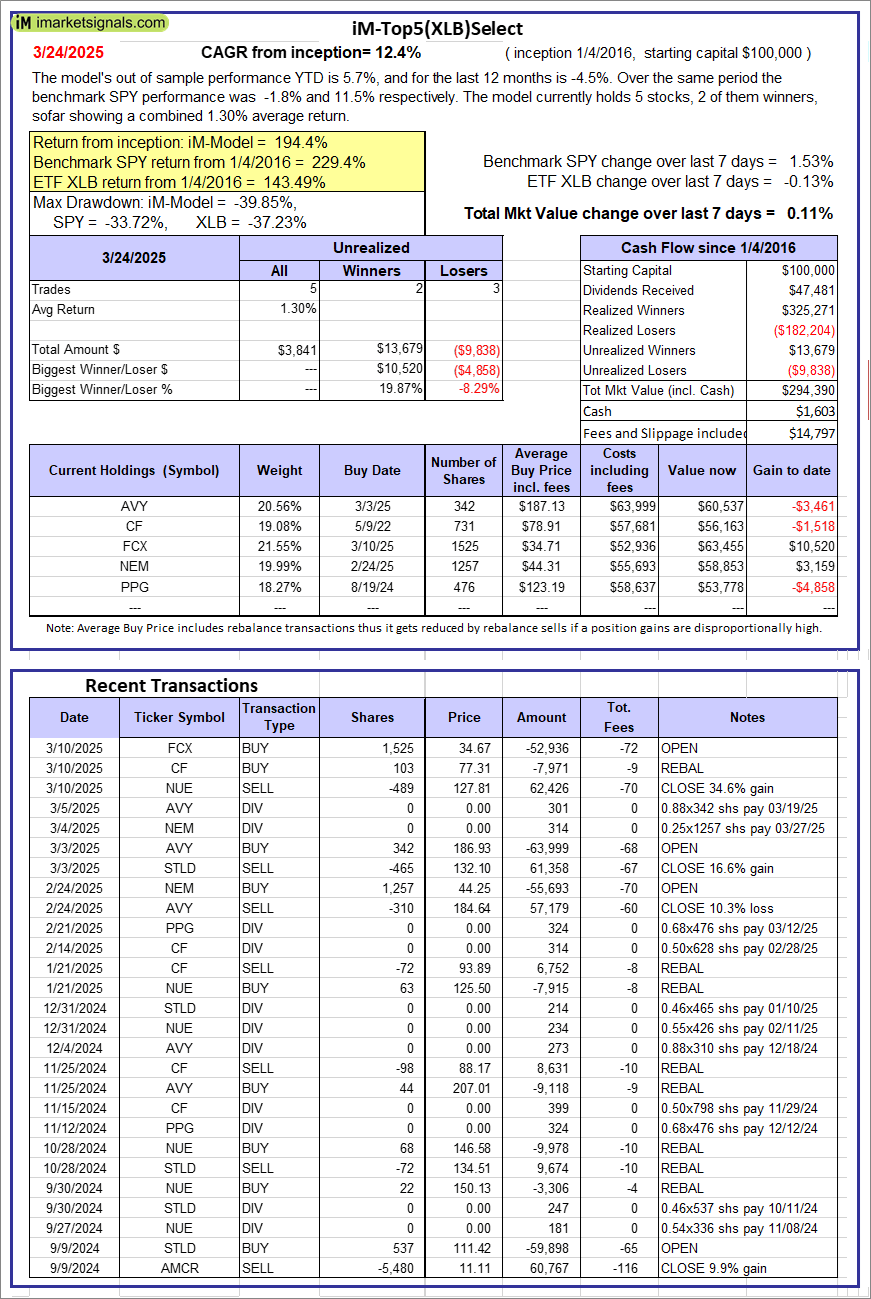 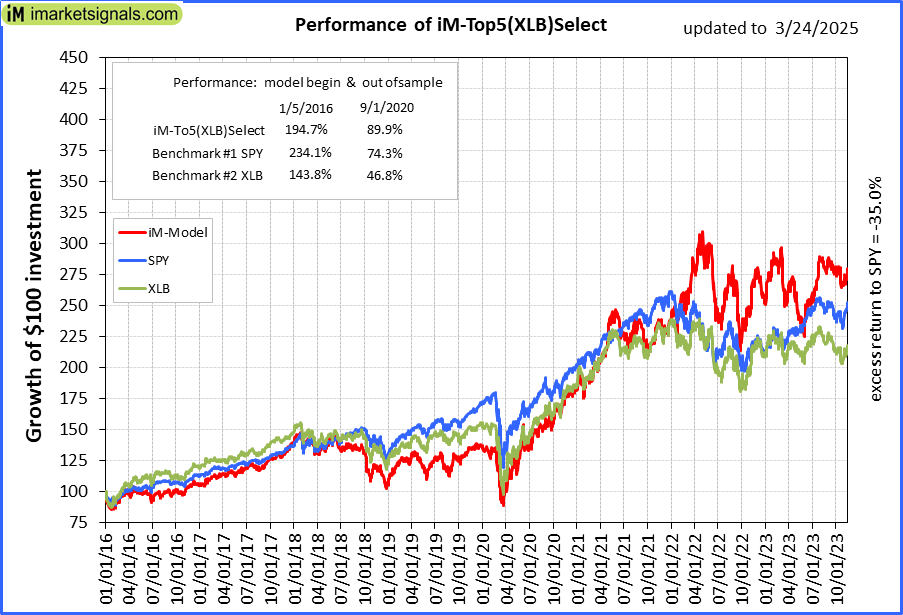 |
iM-Top5(XLB)Select: Since inception, on 1/5/2016, the model gained 194.39% while the benchmark SPY gained 229.38% over the same period. Over the previous week the market value of iM-Top5(XLB)Select gained 0.11% at a time when SPY gained 1.53%. A starting capital of $100,000 at inception on 1/5/2016 would have grown to $294,390 which includes $1,603 cash and excludes $14,797 spent on fees and slippage. |
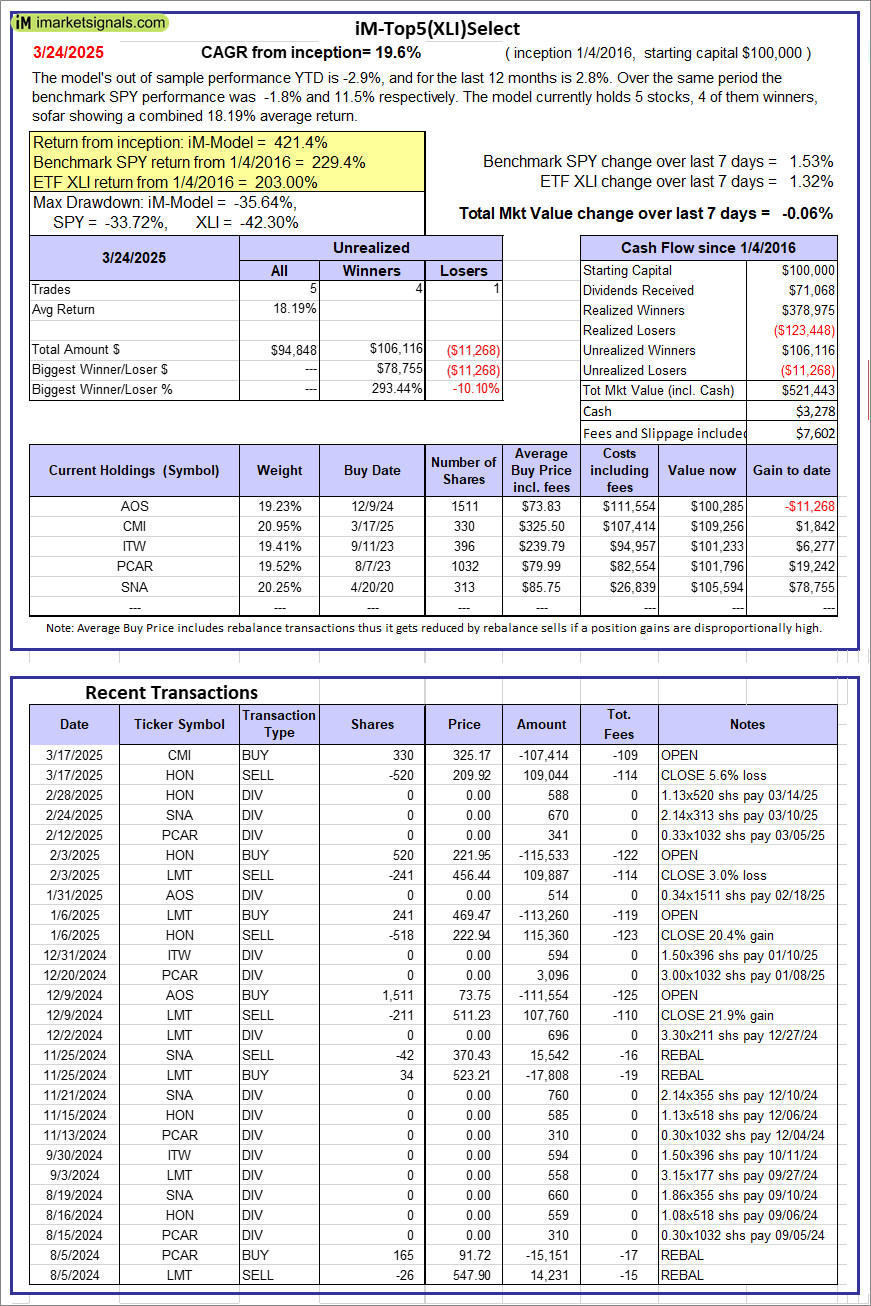 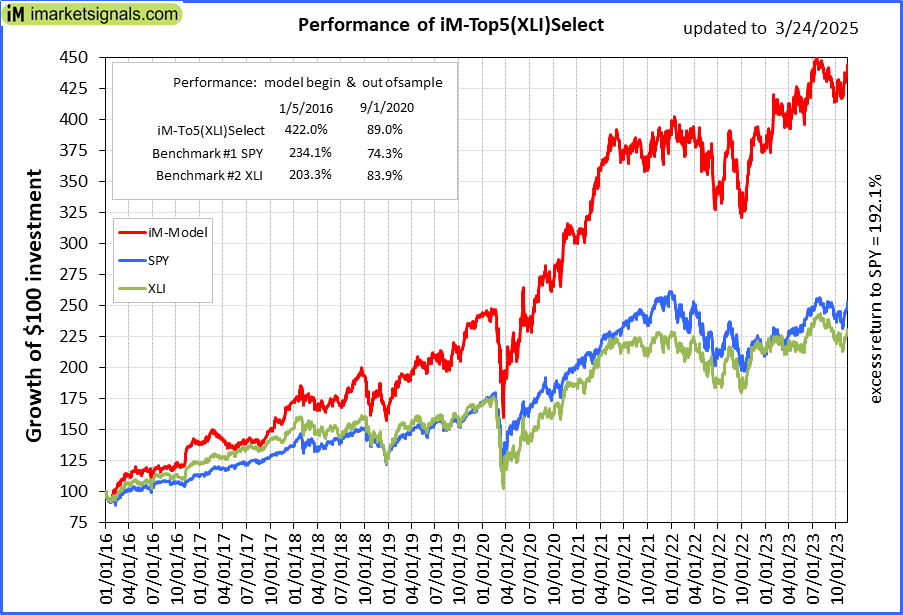 |
iM-Top5(XLI)Select: Since inception, on 1/5/2016, the model gained 421.44% while the benchmark SPY gained 229.38% over the same period. Over the previous week the market value of iM-Top5(XLI)Select gained -0.06% at a time when SPY gained 1.53%. A starting capital of $100,000 at inception on 1/5/2016 would have grown to $521,443 which includes $3,278 cash and excludes $7,602 spent on fees and slippage. |
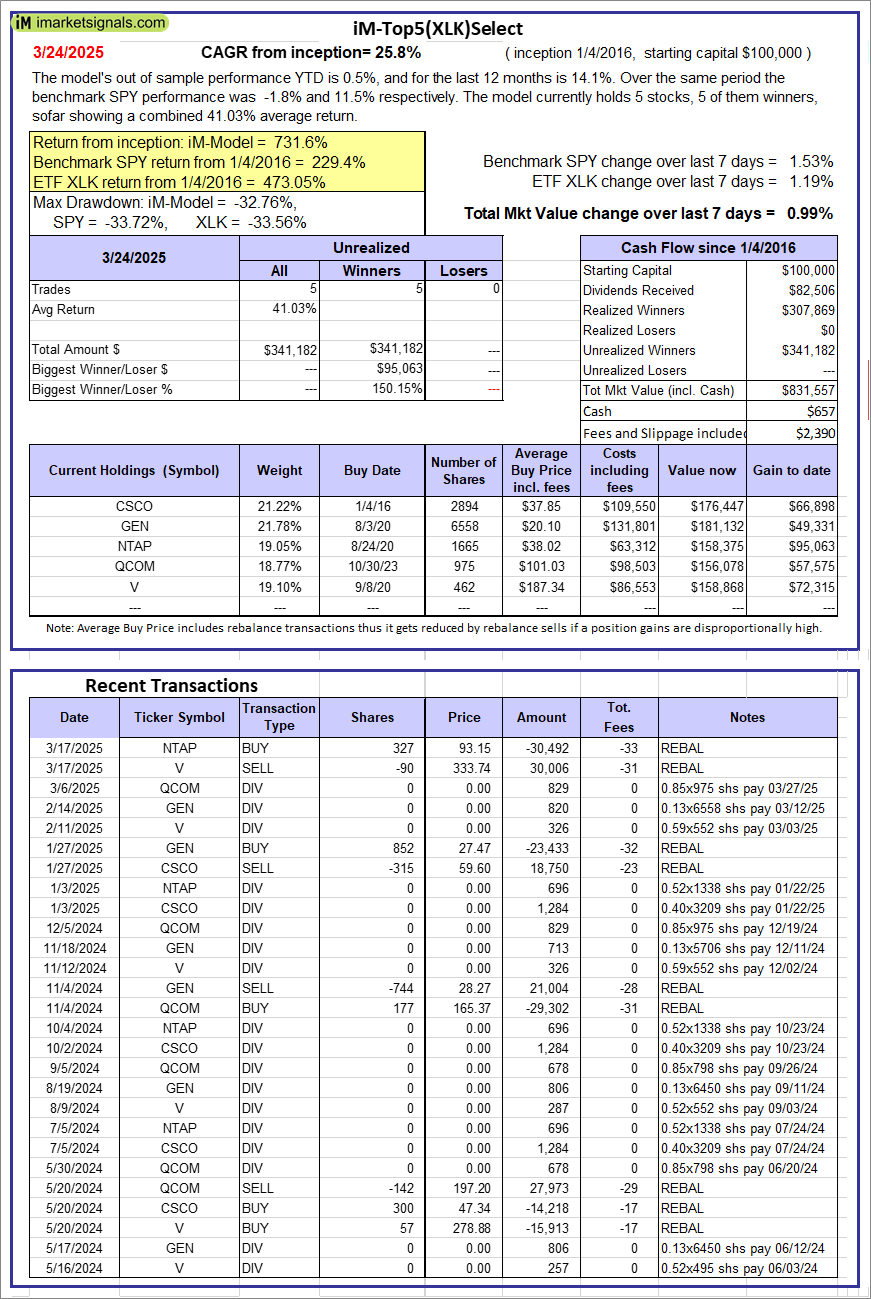  |
iM-Top5(XLK)Select: Since inception, on 1/5/2016, the model gained 731.56% while the benchmark SPY gained 229.38% over the same period. Over the previous week the market value of iM-Top5(XLK)Select gained 0.99% at a time when SPY gained 1.53%. A starting capital of $100,000 at inception on 1/5/2016 would have grown to $831,557 which includes $657 cash and excludes $2,390 spent on fees and slippage. |
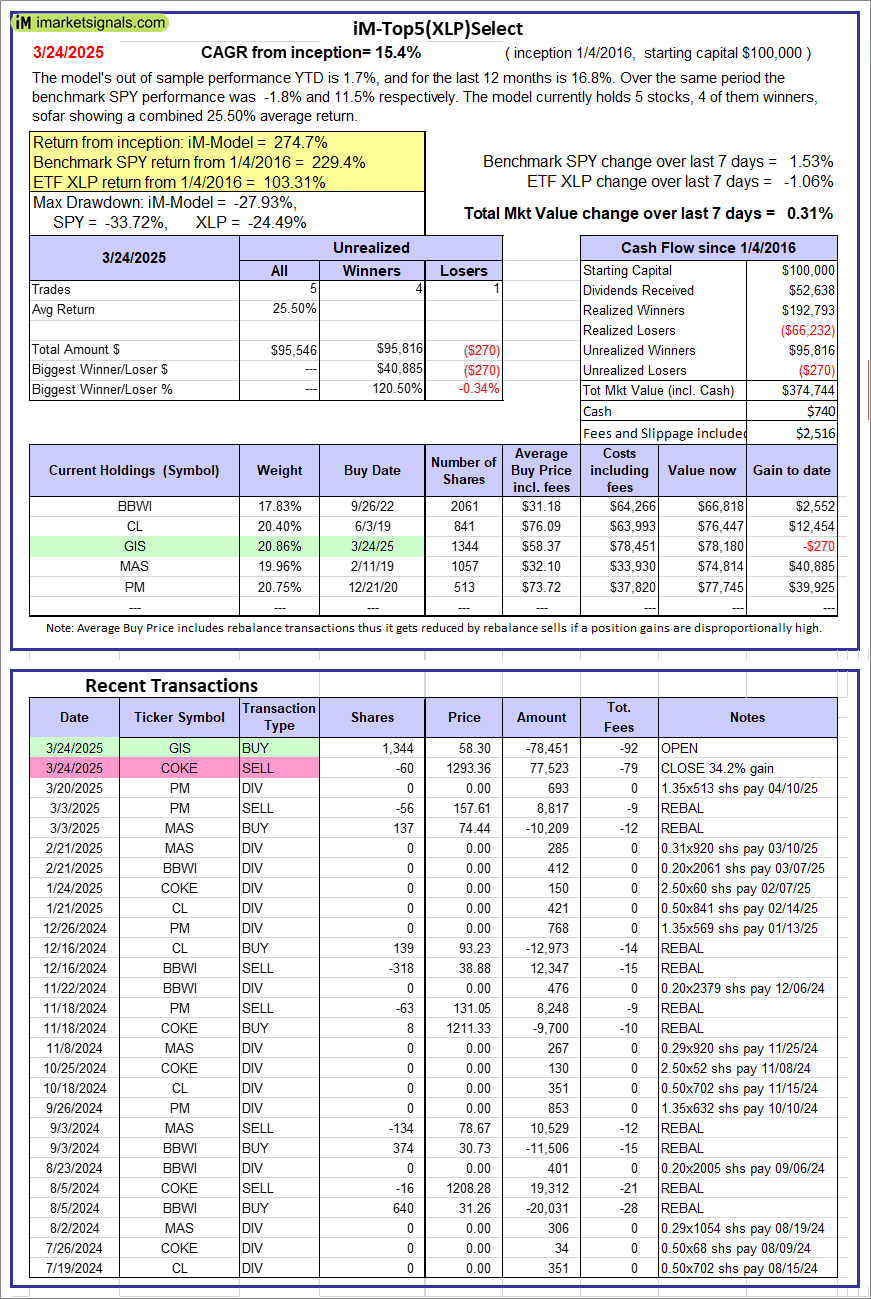 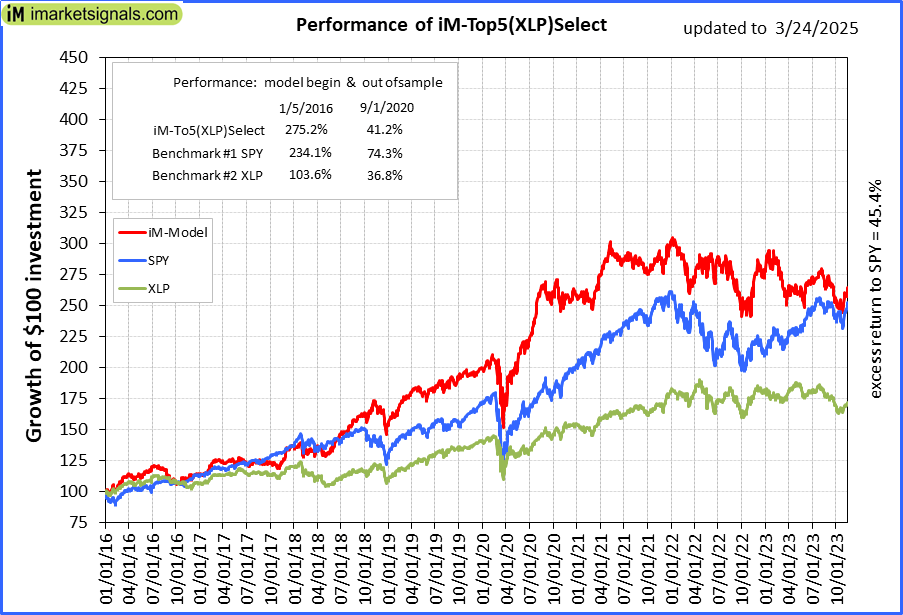 |
iM-Top5(XLP)Select: Since inception, on 1/5/2016, the model gained 274.74% while the benchmark SPY gained 229.38% over the same period. Over the previous week the market value of iM-Top5(XLP)Select gained 0.31% at a time when SPY gained 1.53%. A starting capital of $100,000 at inception on 1/5/2016 would have grown to $374,744 which includes $740 cash and excludes $2,516 spent on fees and slippage. |
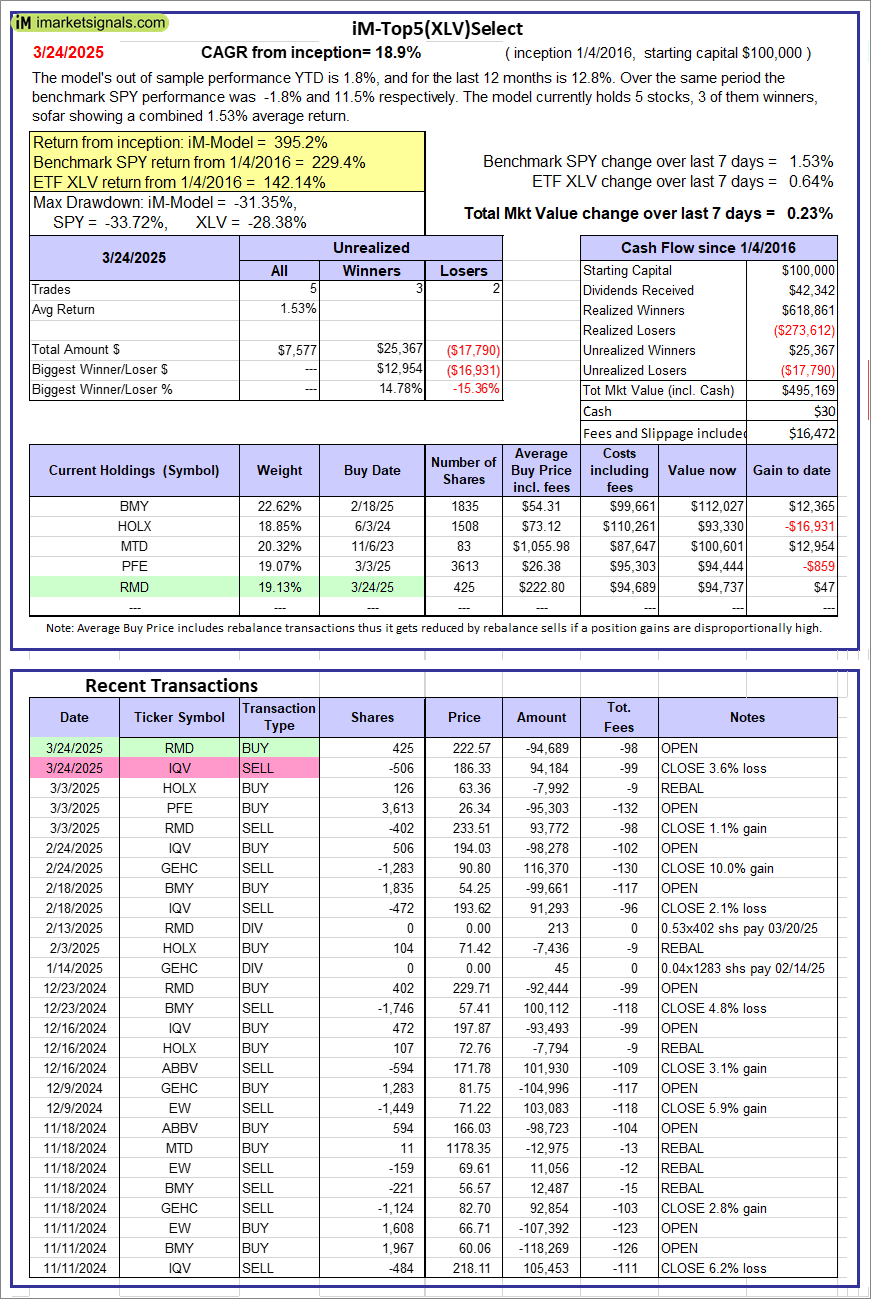 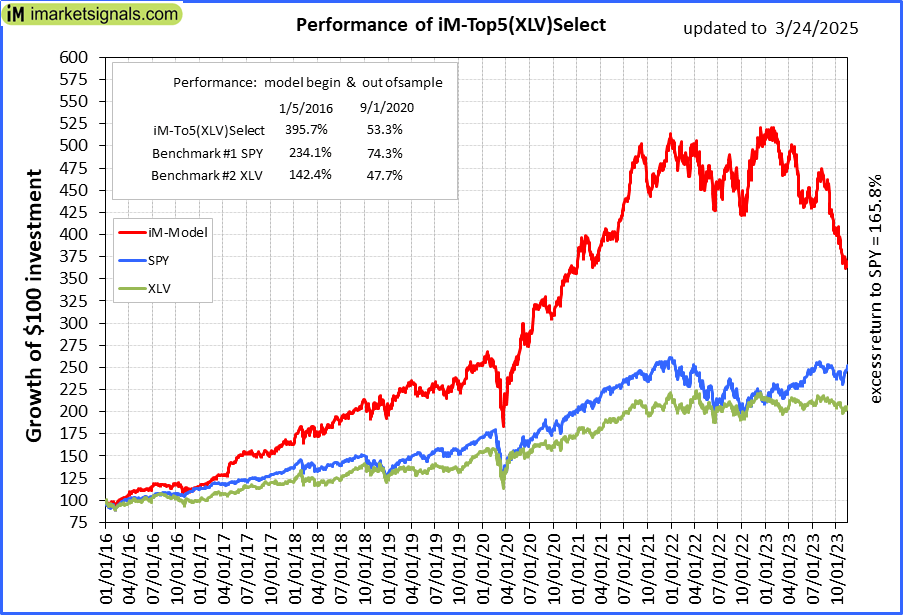 |
iM-Top5(XLV)Select: Since inception, on 1/5/2016, the model gained 395.17% while the benchmark SPY gained 229.38% over the same period. Over the previous week the market value of iM-Top5(XLV)Select gained 0.23% at a time when SPY gained 1.53%. A starting capital of $100,000 at inception on 1/5/2016 would have grown to $495,169 which includes $30 cash and excludes $16,472 spent on fees and slippage. |
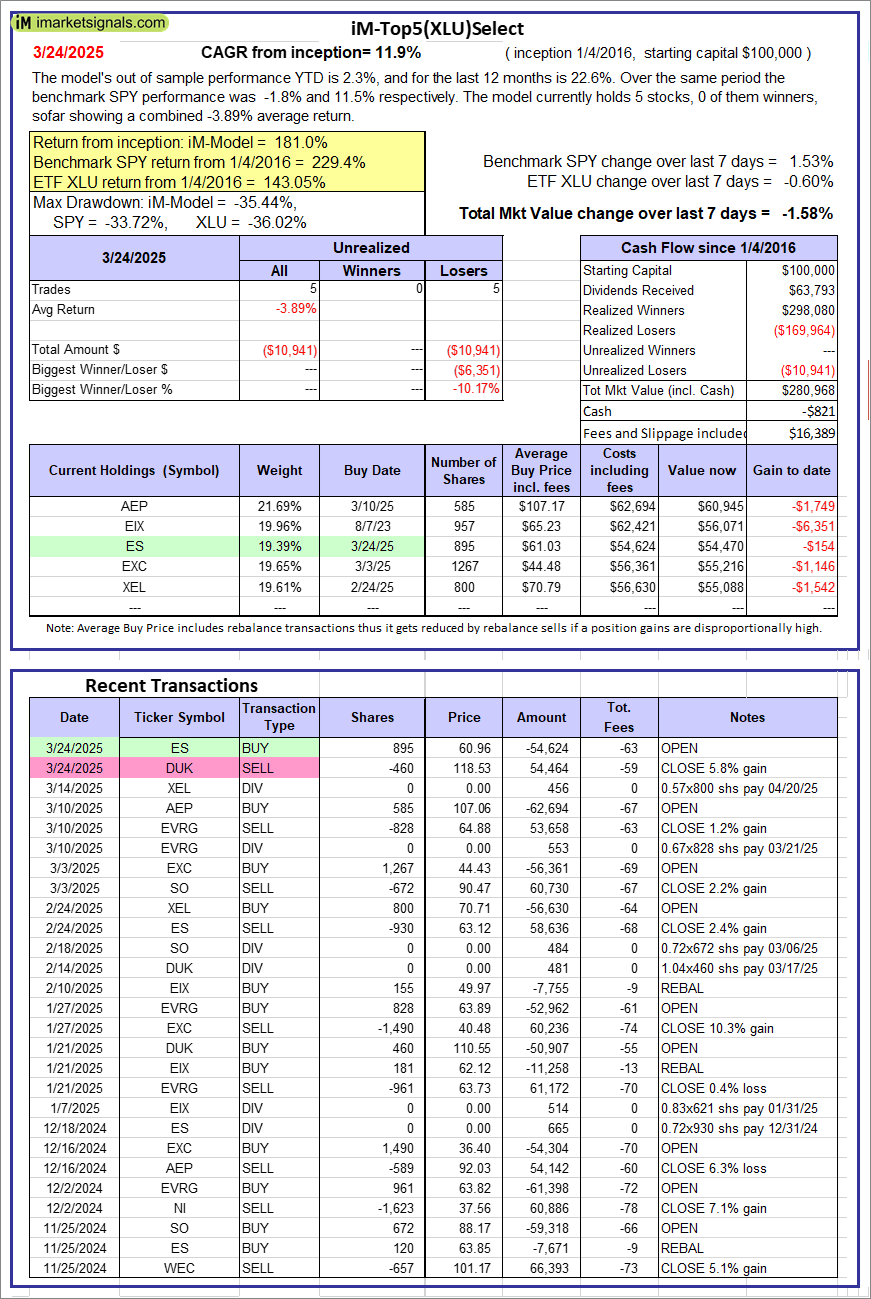 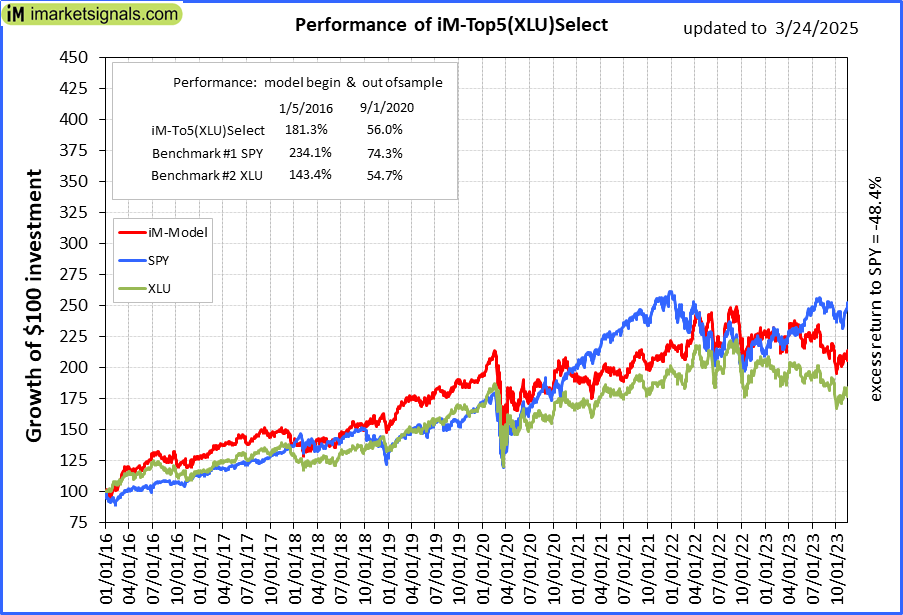 |
iM-Top5(XLU)Select: Since inception, on 1/5/2016, the model gained 180.97% while the benchmark SPY gained 229.38% over the same period. Over the previous week the market value of iM-Top5(XLU)Select gained -1.58% at a time when SPY gained 1.53%. A starting capital of $100,000 at inception on 1/5/2016 would have grown to $280,968 which includes -$821 cash and excludes $16,389 spent on fees and slippage. |
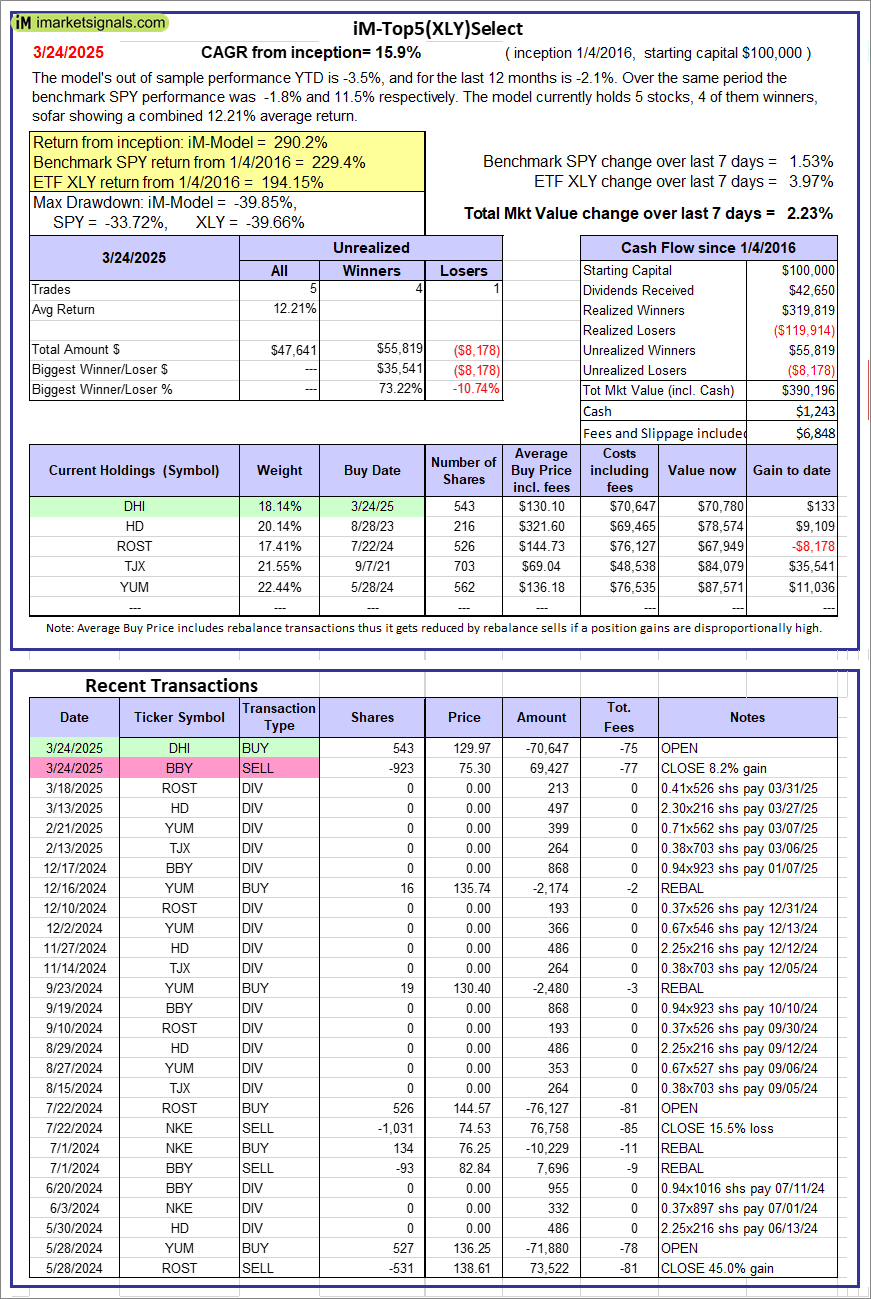 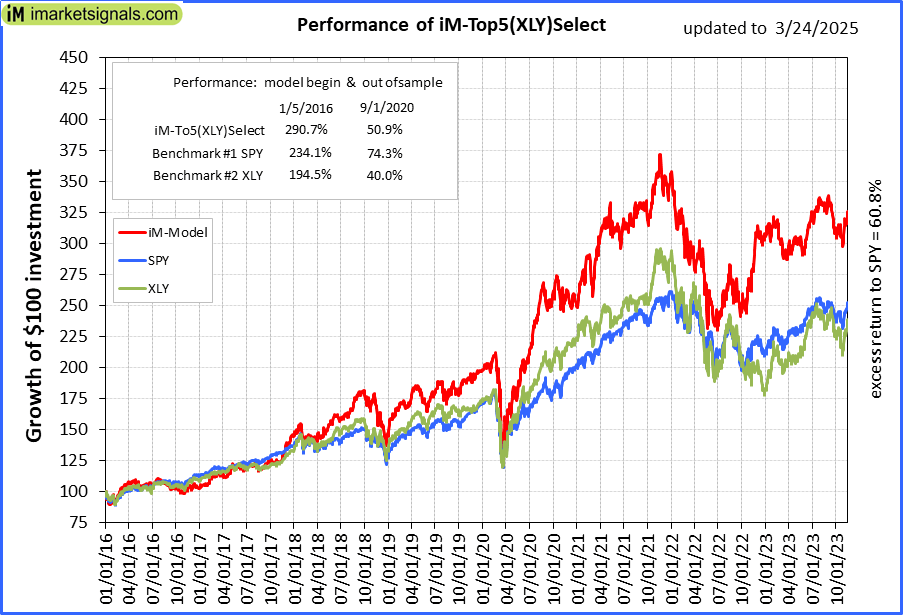 |
iM-Top5(XLY)Select: Since inception, on 1/5/2016, the model gained 290.20% while the benchmark SPY gained 229.38% over the same period. Over the previous week the market value of iM-Top5(XLY)Select gained 2.23% at a time when SPY gained 1.53%. A starting capital of $100,000 at inception on 1/5/2016 would have grown to $390,196 which includes $1,243 cash and excludes $6,848 spent on fees and slippage. |
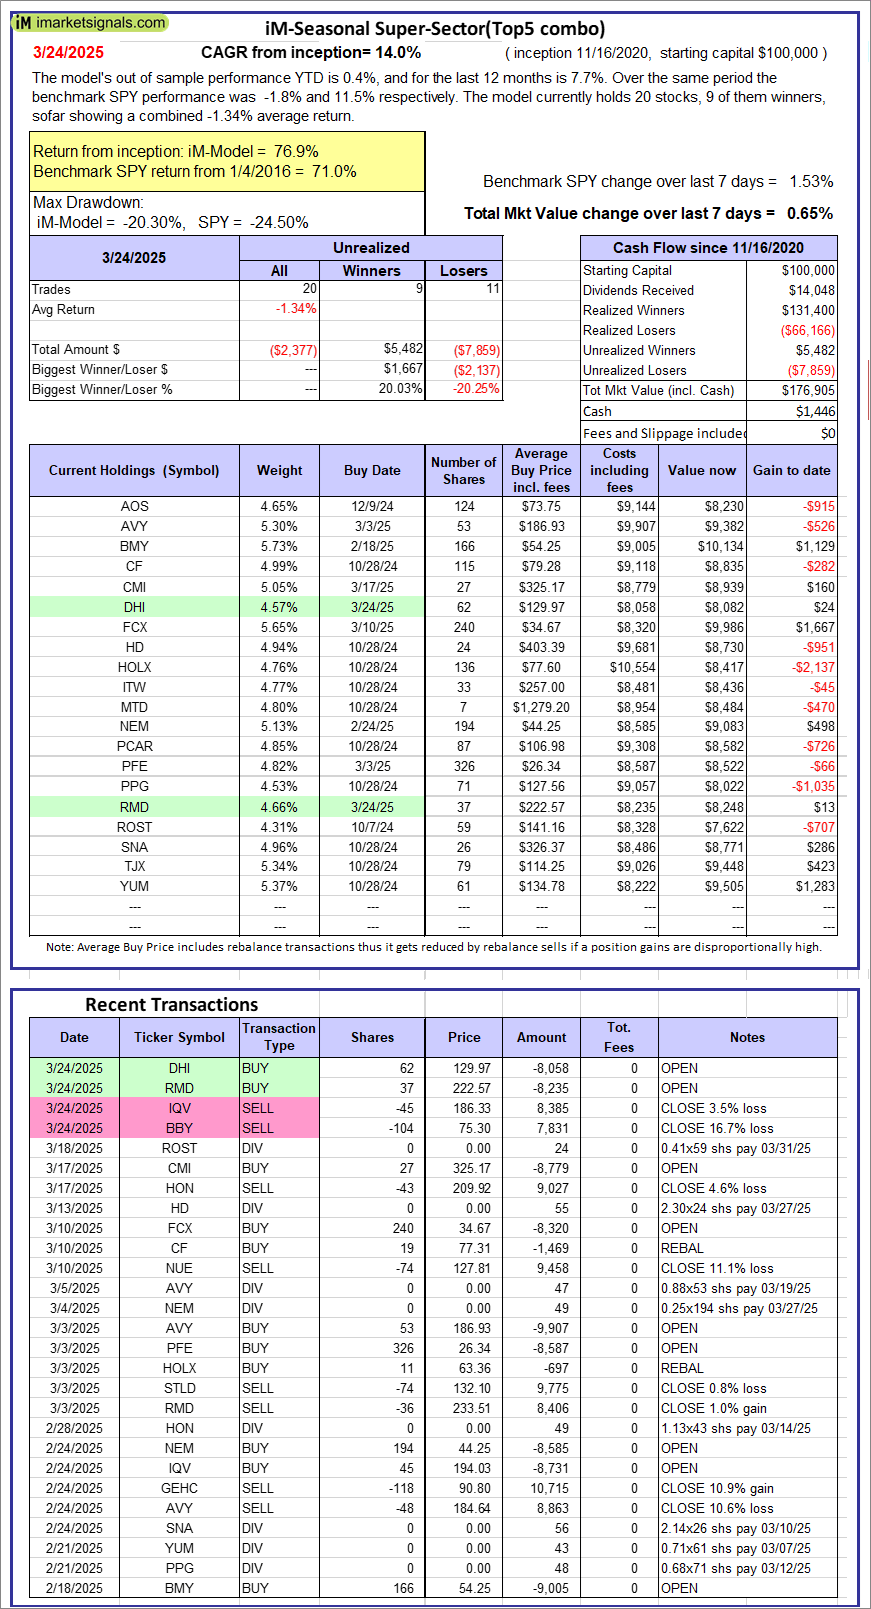 |
iM-Seasonal Super-Sectors (Top5 combo) : Since inception, on 11/17/2020, the model gained 76.90% while the benchmark SPY gained 70.98% over the same period. Over the previous week the market value of iM-Seasonal Super-Sectors (Top5 combo) gained 0.65% at a time when SPY gained 1.53%. A starting capital of $100,000 at inception on 11/17/2020 would have grown to $176,905 which includes $1,446 cash and excludes $00 spent on fees and slippage. |
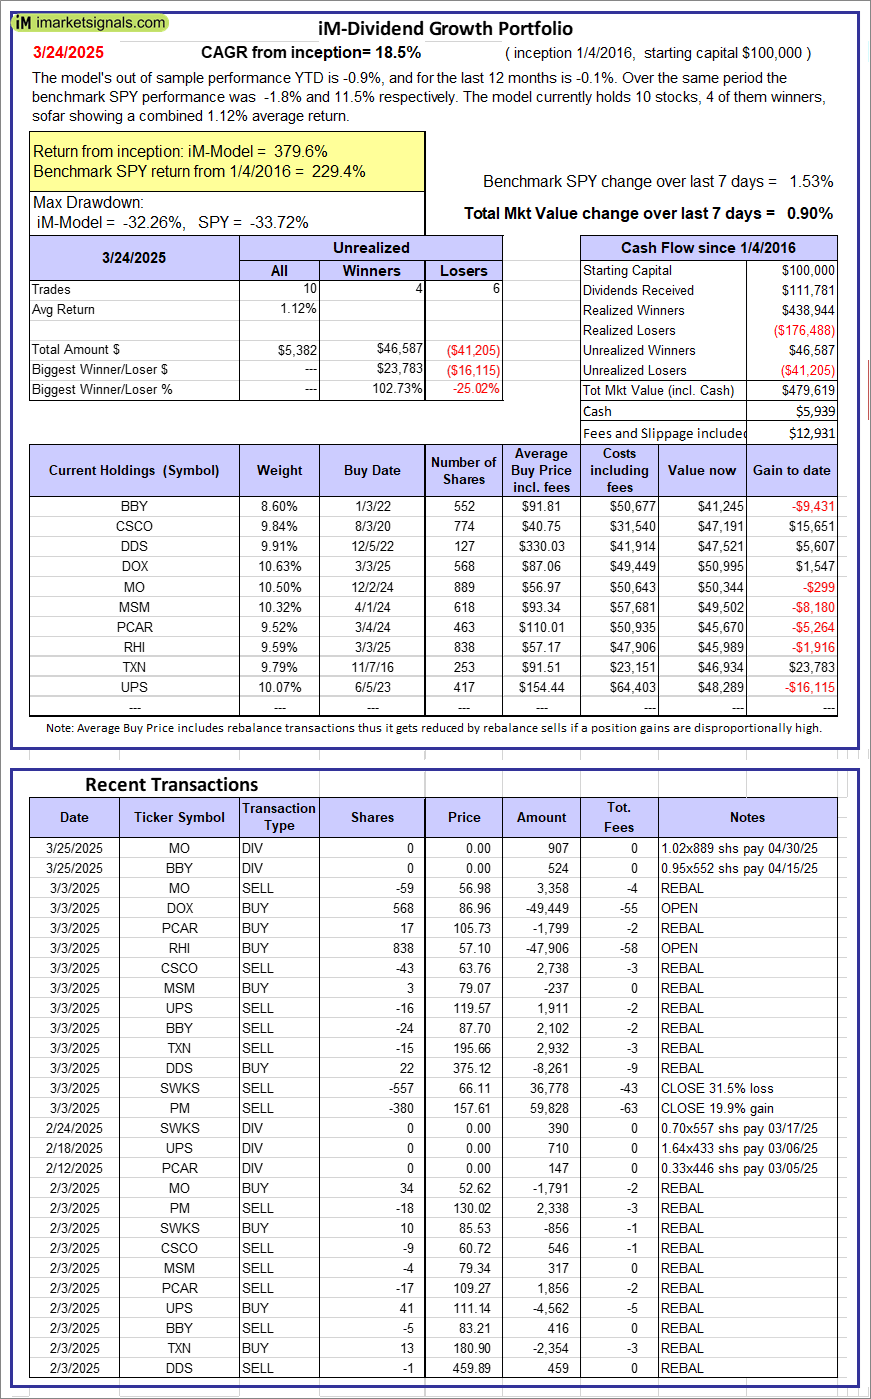 |
iM-Dividend Growth Portfolio: The model’s out of sample performance YTD is -0.9%, and for the last 12 months is -0.1%. Over the same period the benchmark SPY performance was -1.8% and 11.5% respectively. Over the previous week the market value of the iM-Dividend Growth Portfolio gained 0.90% at a time when SPY gained 1.53%. A starting capital of $100,000 at inception on 6/30/2016 would have grown to $479,619 which includes $5,939 cash and excludes $12,931 spent on fees and slippage. |
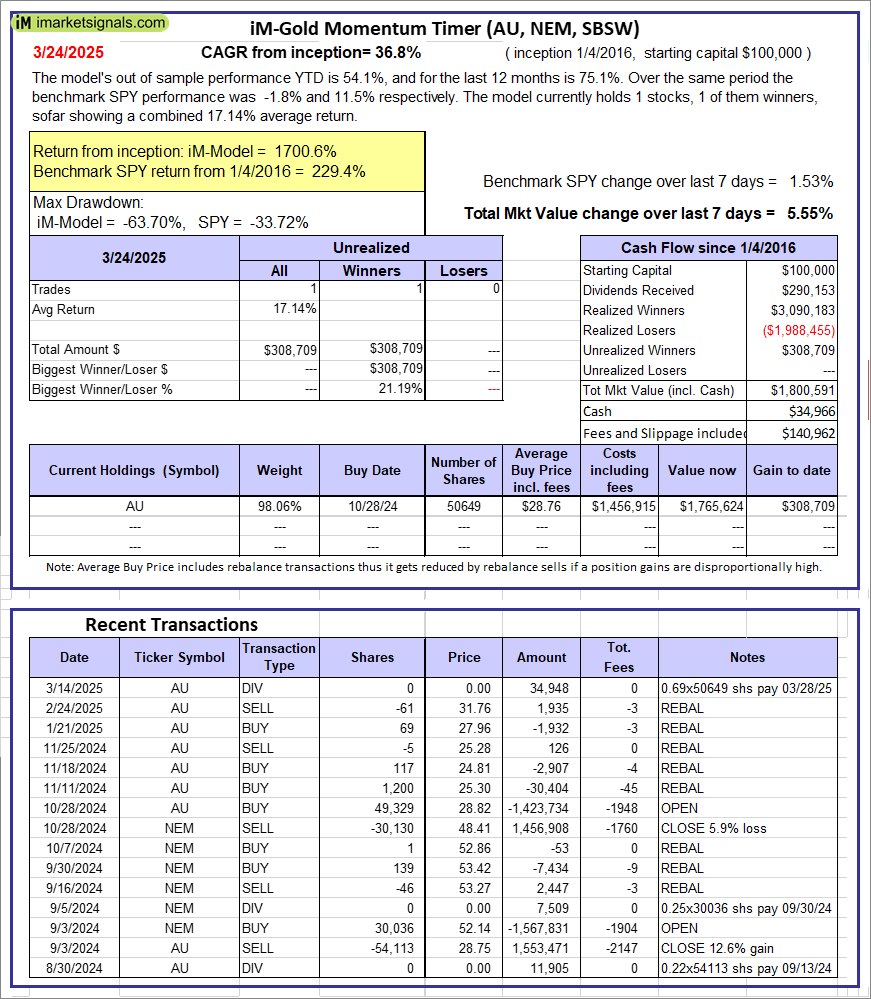 |
iM-Gold Momentum Timer (AU, NEM, SBSW): The model’s out of sample performance YTD is 54.1%, and for the last 12 months is 75.1%. Over the same period the benchmark SPY performance was -1.8% and 11.5% respectively. Over the previous week the market value of iM-Gold Momentum Timer (AU, NEM, SBSW) gained 5.55% at a time when SPY gained 1.53%. A starting capital of $100,000 at inception on 6/30/2016 would have grown to $34,966 which includes $140,962 cash and excludes Gain to date spent on fees and slippage. |
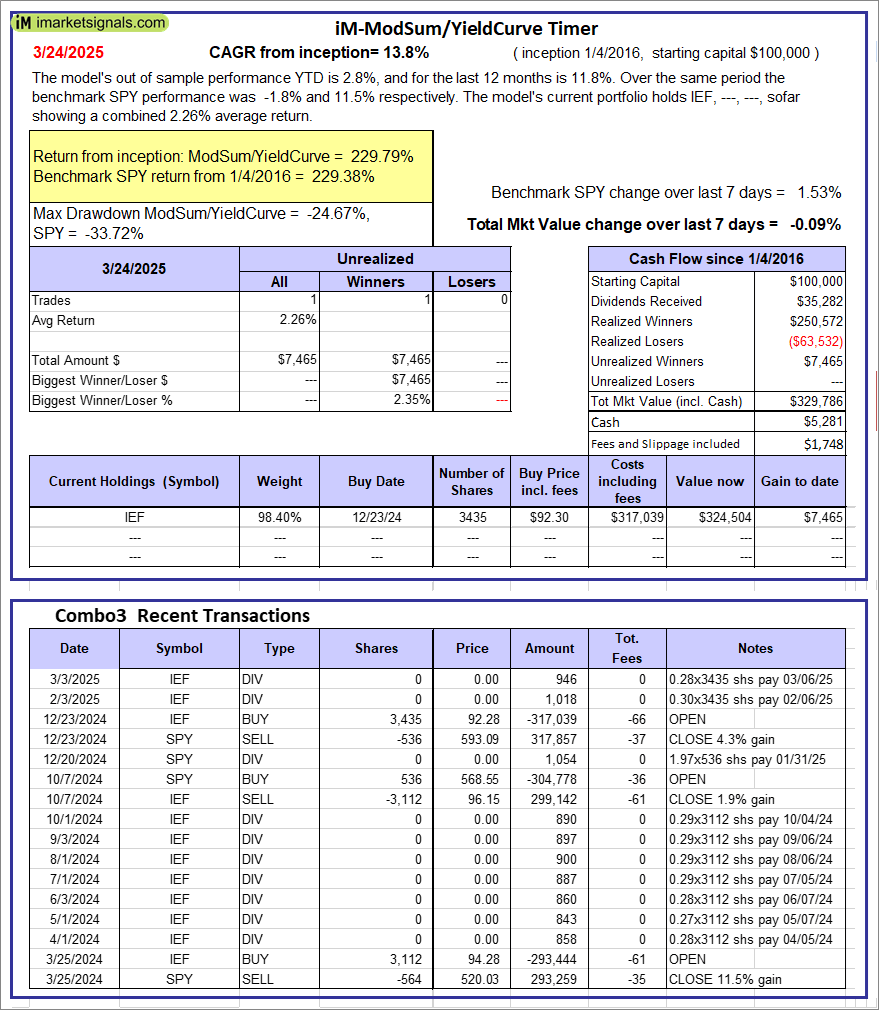 |
iM-ModSum/YieldCurve Timer: The model’s out of sample performance YTD is 2.8%, and for the last 12 months is 11.8%. Over the same period the benchmark SPY performance was -1.8% and 11.5% respectively. Over the previous week the market value of iM-PortSum/YieldCurve Timer gained -0.09% at a time when SPY gained 1.53%. A starting capital of $100,000 at inception on 1/1/2016 would have grown to $329,786 which includes $5,281 cash and excludes $1,748 spent on fees and slippage. |
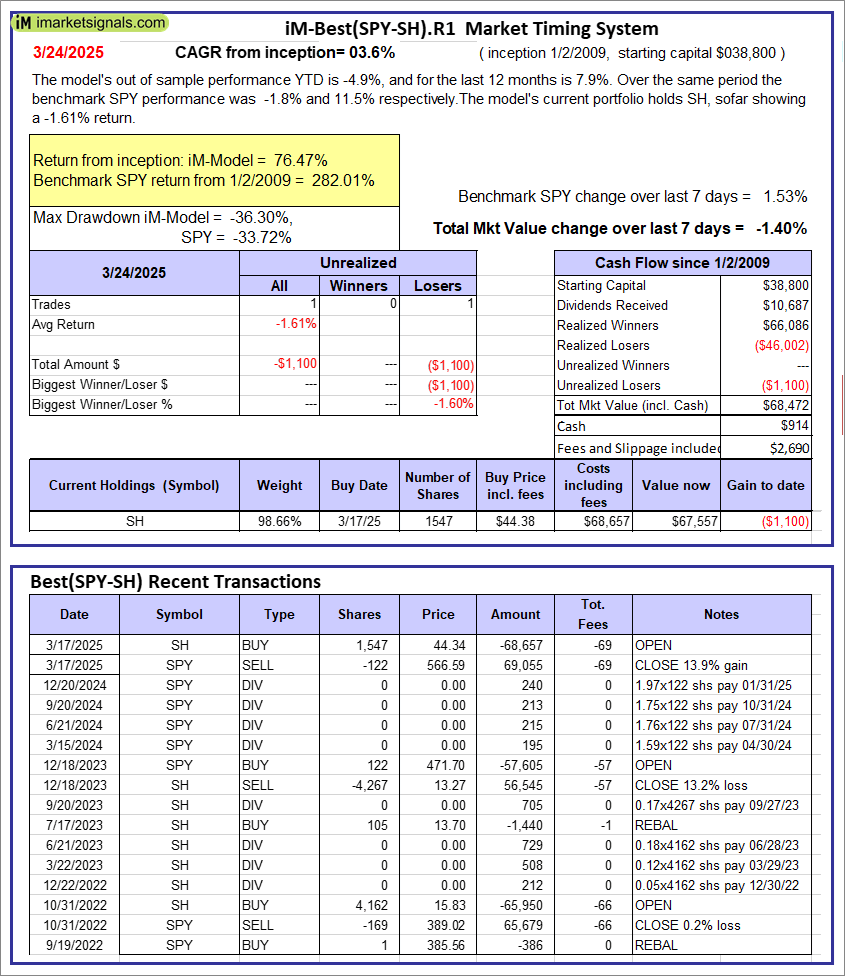 |
iM-Best(SPY-SH).R1: The model’s out of sample performance YTD is -4.9%, and for the last 12 months is 7.9%. Over the same period the benchmark SPY performance was -1.8% and 11.5% respectively. Over the previous week the market value of Best(SPY-SH) gained -1.40% at a time when SPY gained 1.53%. A starting capital of $100,000 at inception on 1/2/2009 would have grown to $68,472 which includes $914 cash and excludes $2,690 spent on fees and slippage. |
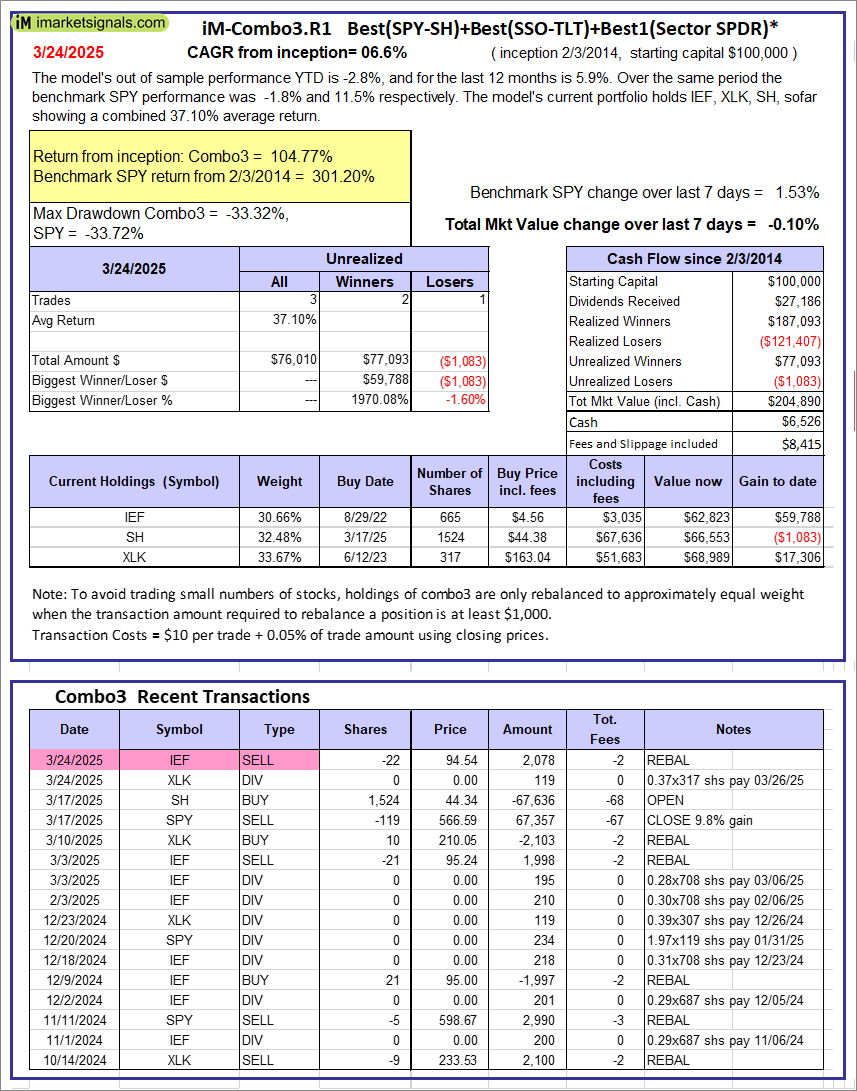 |
iM-Combo3.R1: The model’s out of sample performance YTD is -2.8%, and for the last 12 months is 5.9%. Over the same period the benchmark SPY performance was -1.8% and 11.5% respectively. Over the previous week the market value of iM-Combo3.R1 gained -0.10% at a time when SPY gained 1.53%. A starting capital of $100,000 at inception on 2/3/2014 would have grown to $204,890 which includes $6,526 cash and excludes $8,415 spent on fees and slippage. |
 |
iM-Combo5: The model’s out of sample performance YTD is 2.0%, and for the last 12 months is -17.5%. Over the same period the benchmark SPY performance was 8.7% and -3.8% respectively. Over the previous week the market value of iM-Combo5 gained -1.07% at a time when SPY gained 1.06%. A starting capital of $100,000 at inception on 2/22/2016 would have grown to $156,429 which includes $869 cash and excludes $0 spent on fees and slippage. |
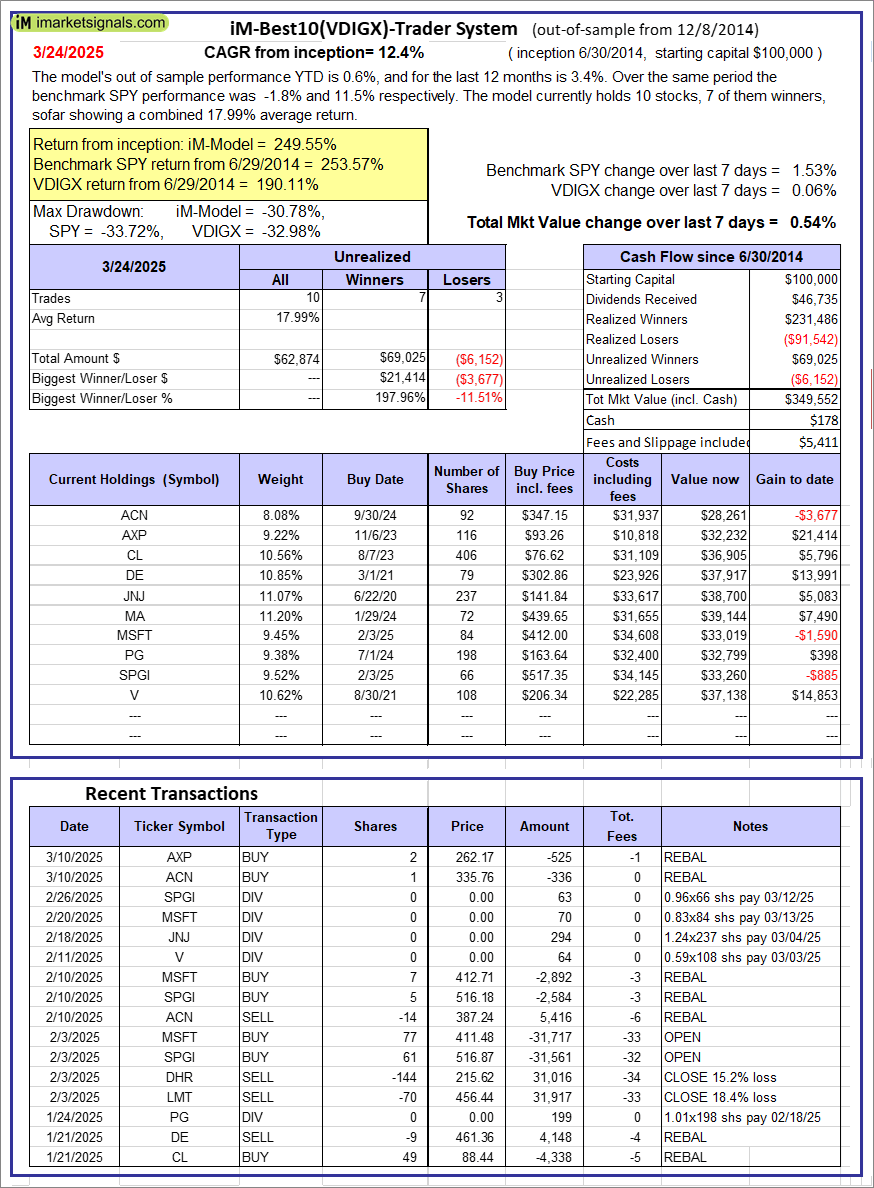 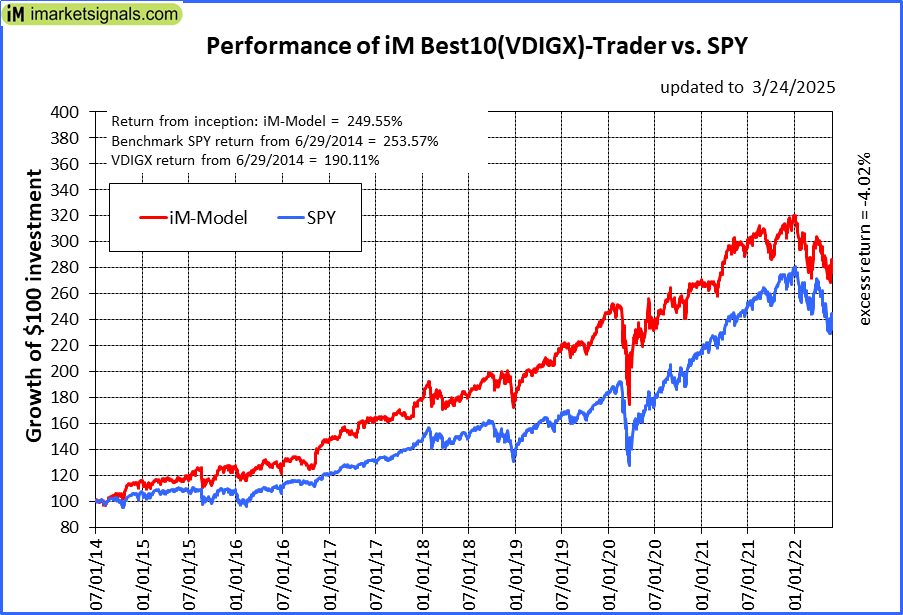 |
iM-Best10(VDIGX)-Trader: The model’s out of sample performance YTD is 0.6%, and for the last 12 months is 3.4%. Over the same period the benchmark SPY performance was -1.8% and 11.5% respectively. Since inception, on 7/1/2014, the model gained 249.55% while the benchmark SPY gained 253.57% and VDIGX gained 190.11% over the same period. Over the previous week the market value of iM-Best10(VDIGX) gained 0.54% at a time when SPY gained 1.53%. A starting capital of $100,000 at inception on 7/1/2014 would have grown to $349,552 which includes $178 cash and excludes $5,411 spent on fees and slippage. |
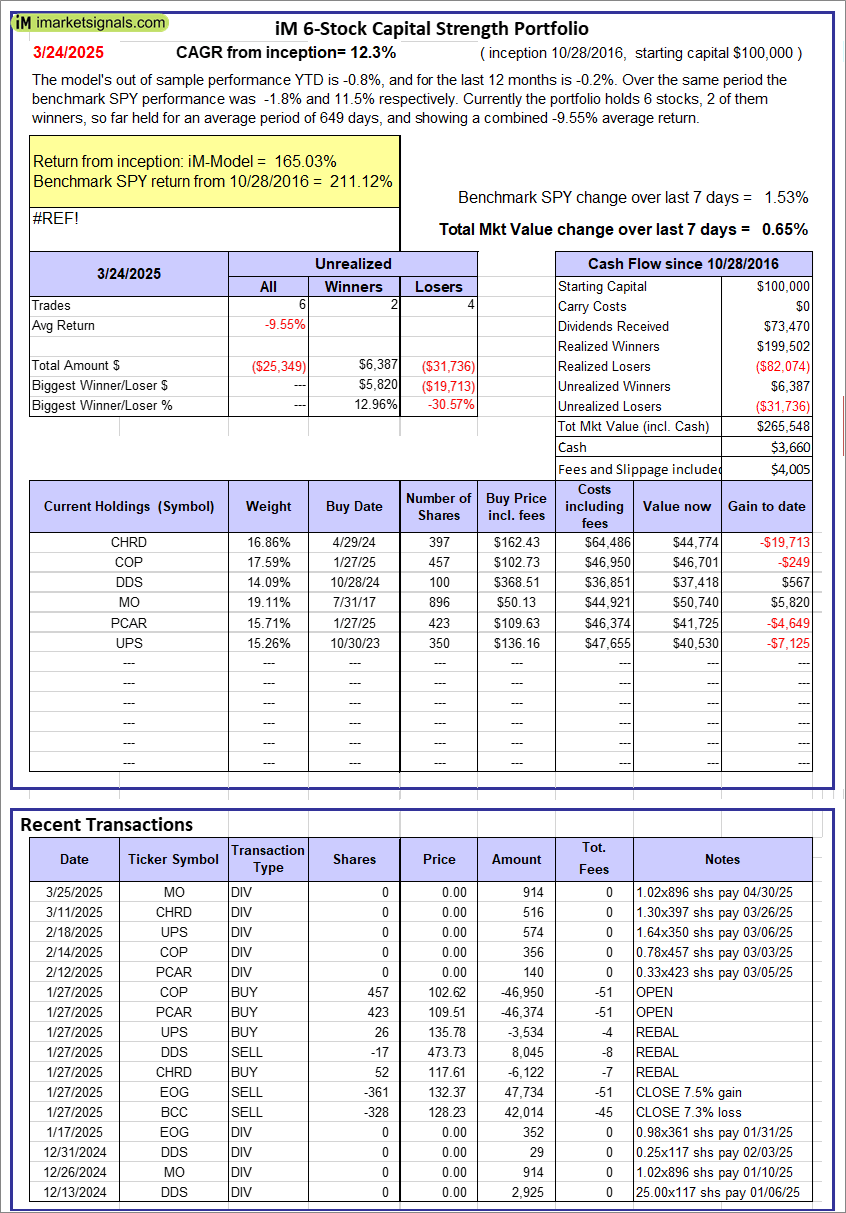 |
iM 6-Stock Capital Strength Portfolio: The model’s out of sample performance YTD is -0.8%, and for the last 12 months is -0.2%. Over the same period the benchmark SPY performance was -1.8% and 11.5% respectively. Over the previous week the market value of the iM 6-Stock Capital Strength Portfolio gained 0.65% at a time when SPY gained 1.53%. A starting capital of $100,000 at inception on 10/28/2016 would have grown to $265,548 which includes $3,660 cash and excludes $4,005 spent on fees and slippage. |
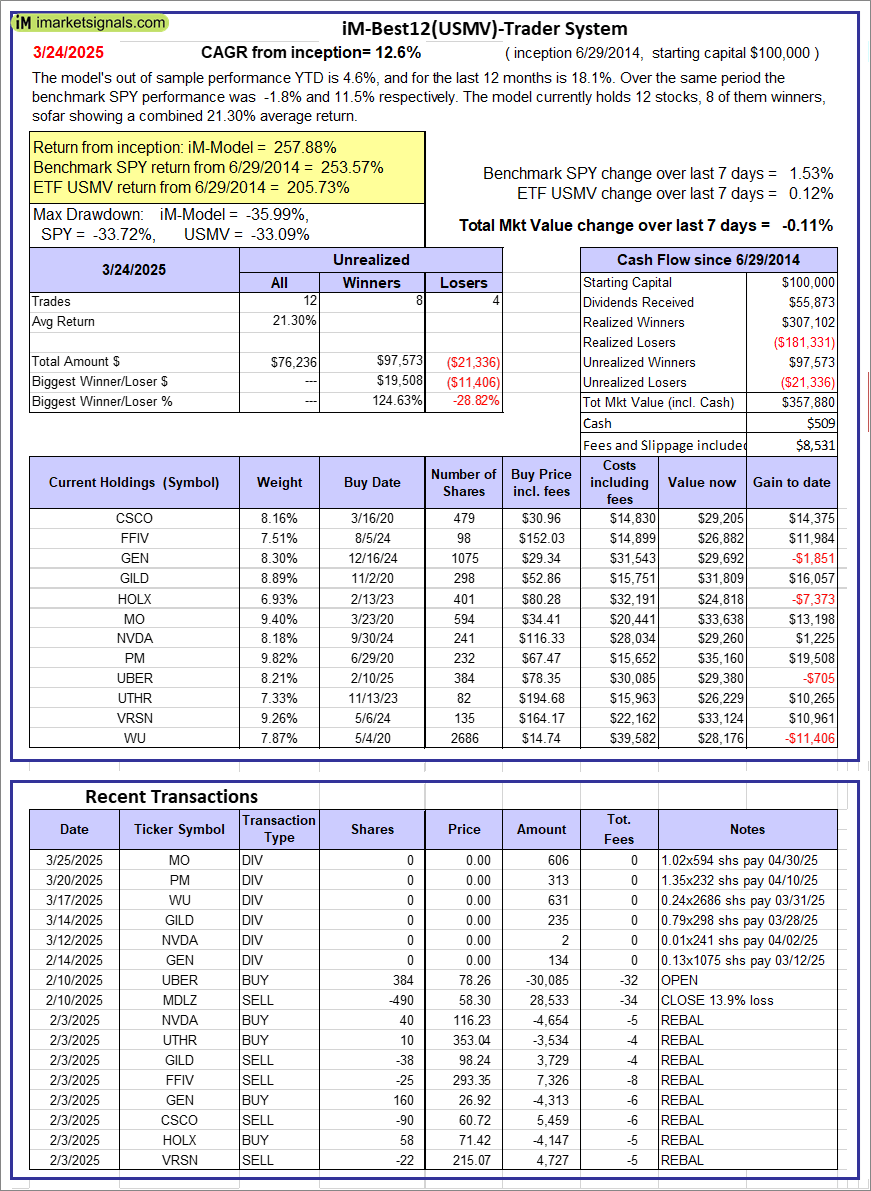 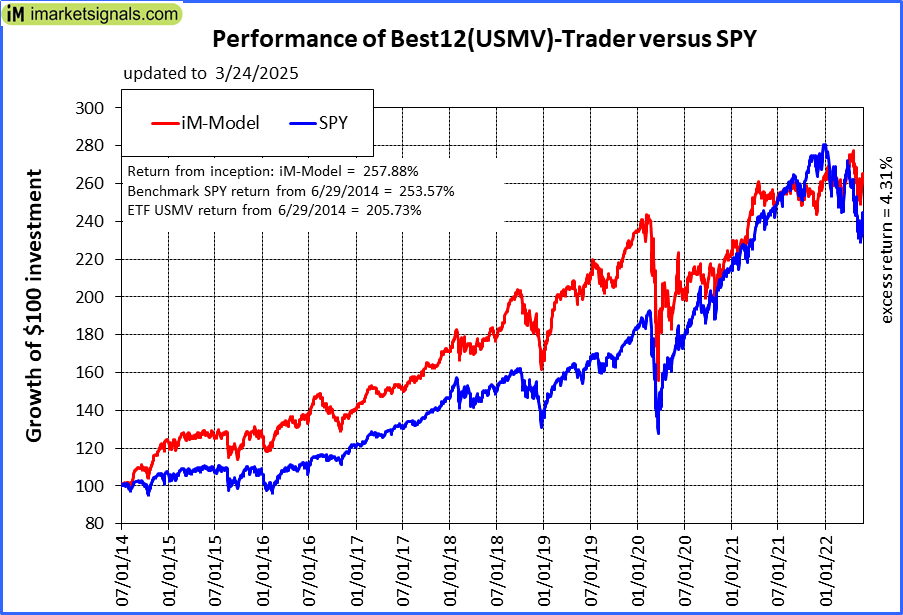 |
iM-Best12(USMV)-Trader: The model’s out of sample performance YTD is 4.6%, and for the last 12 months is 18.1%. Over the same period the benchmark SPY performance was -1.8% and 11.5% respectively. Since inception, on 6/30/2014, the model gained 257.88% while the benchmark SPY gained 253.57% and the ETF USMV gained 205.73% over the same period. Over the previous week the market value of iM-Best12(USMV)-Trader gained -0.11% at a time when SPY gained 1.53%. A starting capital of $100,000 at inception on 6/30/2014 would have grown to $357,880 which includes $509 cash and excludes $8,531 spent on fees and slippage. |
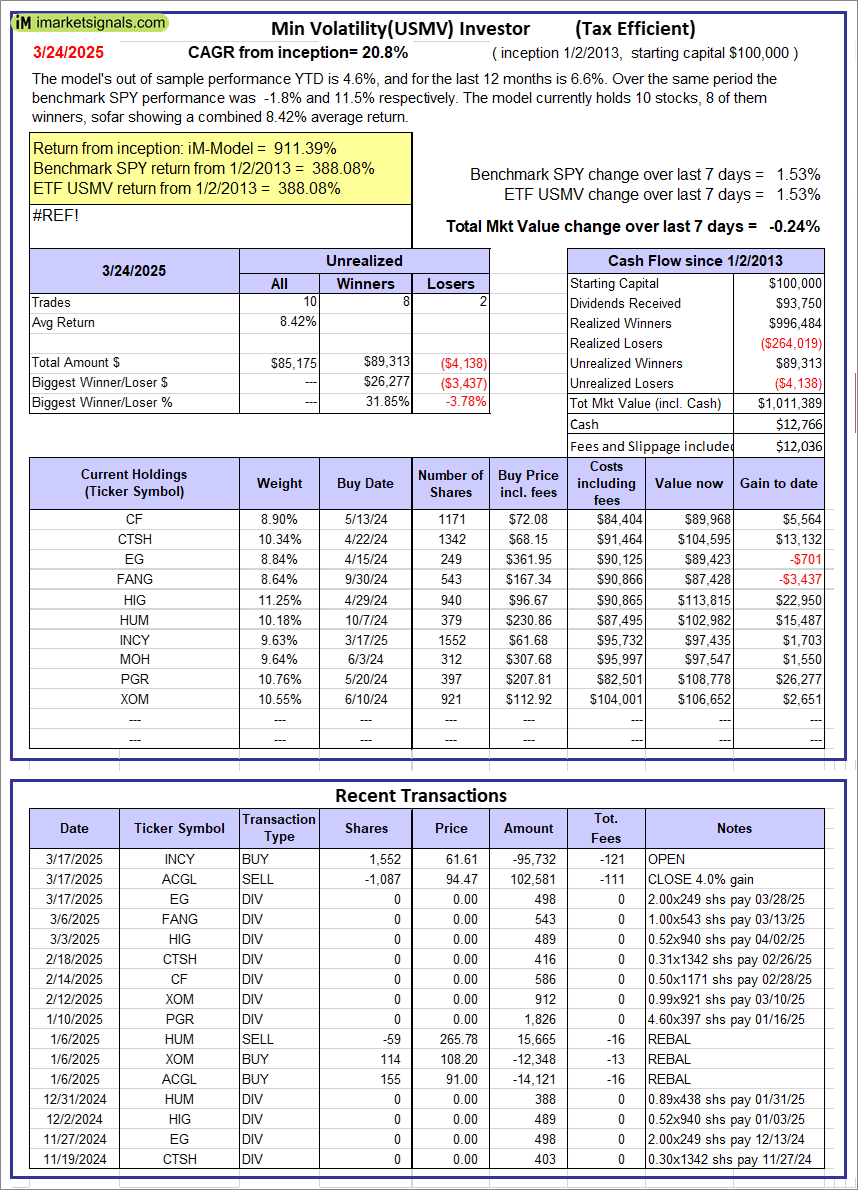 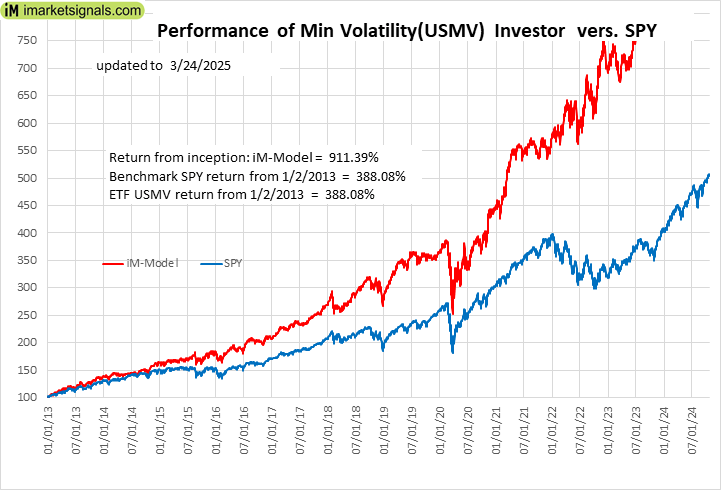 |
iM-Min Volatility(USMV) Investor (Tax Efficient): The model’s out of sample performance YTD is 4.6%, and for the last 12 months is 6.6%. Over the same period the benchmark SPY performance was -1.8% and 11.5% respectively. Since inception, on 1/3/2013, the model gained 911.39% while the benchmark SPY gained 388.08% and the ETF USMV gained 388.08% over the same period. Over the previous week the market value of iM-Best12(USMV)Q1 gained -0.24% at a time when SPY gained 1.53%. A starting capital of $100,000 at inception on 1/3/2013 would have grown to $1,011,389 which includes $12,766 cash and excludes $12,036 spent on fees and slippage. |
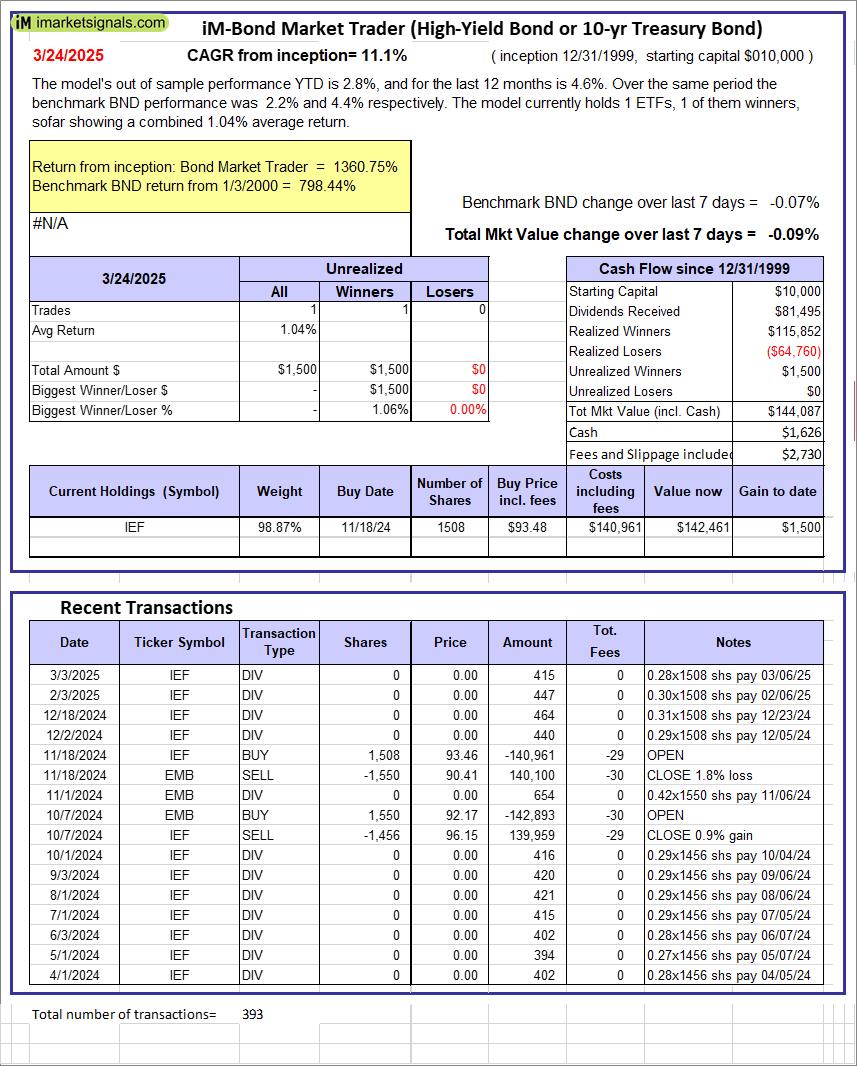 |
iM-Bond Market Trader (High-Yield Bond or 10-yr Treasury Bond): The model’s out of sample performance YTD is 2.8%, and for the last 12 months is 4.6%. Over the same period the benchmark BND performance was 2.2% and 4.4% respectively. Over the previous week the market value of the iM-Bond Market Trader (High-Yield Bond or 10-yr Treasury Bond) gained -0.09% at a time when BND gained -0.07%. A starting capital of $10,000 at inception on 1/3/2000 would have grown to $144,087 which includes $1,626 cash and excludes $2,730 spent on fees and slippage. |
|
|
iM-ModSum/YieldCurve Timer: The model’s out of sample performance YTD is 2.8%, and for the last 12 months is 11.8%. Over the same period the benchmark SPY performance was -1.8% and 11.5% respectively. Over the previous week the market value of iM-PortSum/YieldCurve Timer gained -0.09% at a time when SPY gained 1.53%. A starting capital of $100,000 at inception on 1/1/2016 would have grown to $329,786 which includes $5,281 cash and excludes $1,748 spent on fees and slippage. |
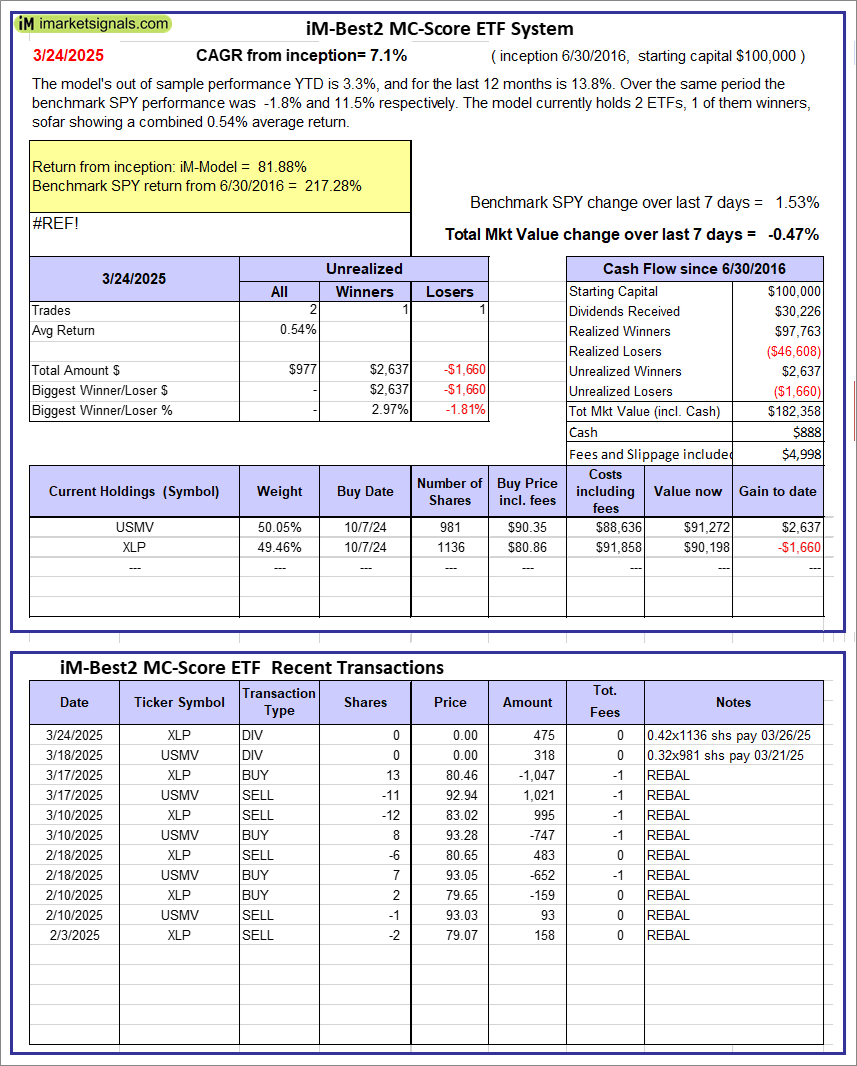 |
iM-Best2 MC-Score ETF System: The model’s out of sample performance YTD is 3.3%, and for the last 12 months is 13.8%. Over the same period the benchmark SPY performance was -1.8% and 11.5% respectively. Over the previous week the market value of the iM-Best2 MC-Score ETF System gained -0.47% at a time when SPY gained 1.53%. A starting capital of $100,000 at inception on 6/30/2016 would have grown to $182,358 which includes $888 cash and excludes $4,998 spent on fees and slippage. |
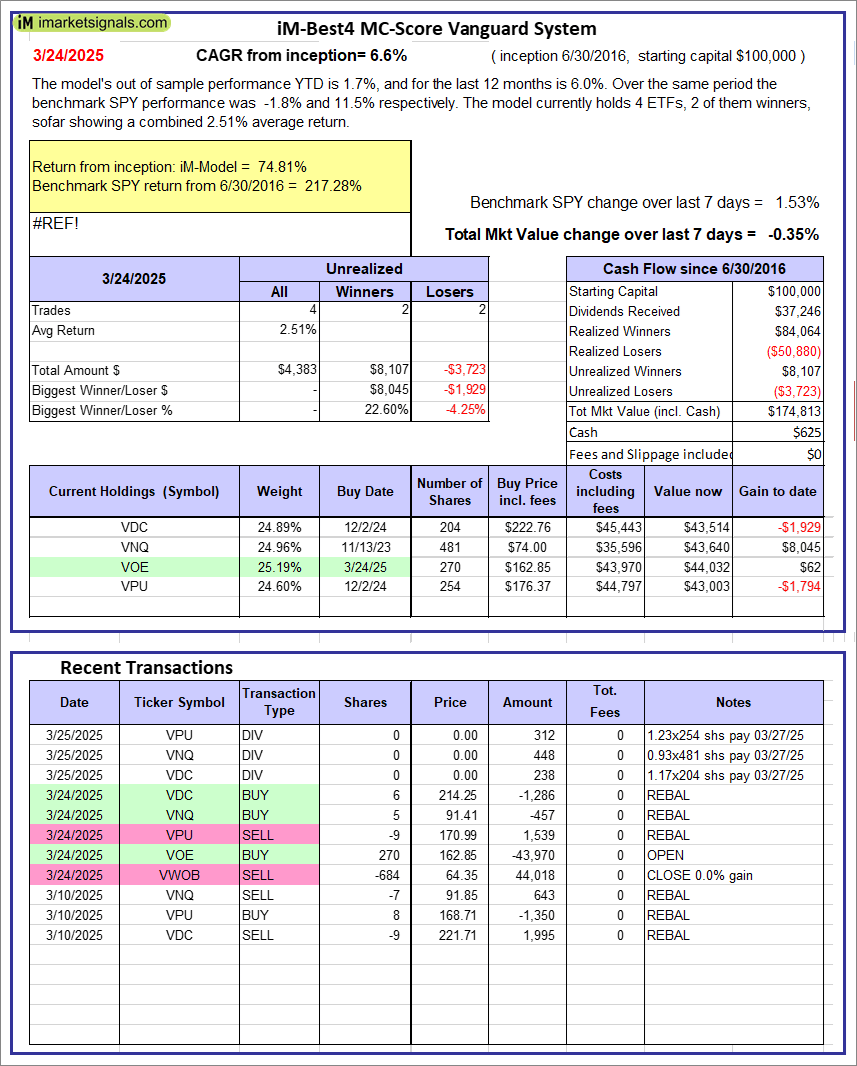 |
iM-Best4 MC-Score Vanguard System: The model’s out of sample performance YTD is 1.7%, and for the last 12 months is 6.0%. Over the same period the benchmark SPY performance was -1.8% and 11.5% respectively. Over the previous week the market value of the iM-Best4 MC-Score Vanguard System gained -0.35% at a time when SPY gained 1.53%. A starting capital of $100,000 at inception on 6/30/2016 would have grown to $174,813 which includes $625 cash and excludes $00 spent on fees and slippage. |
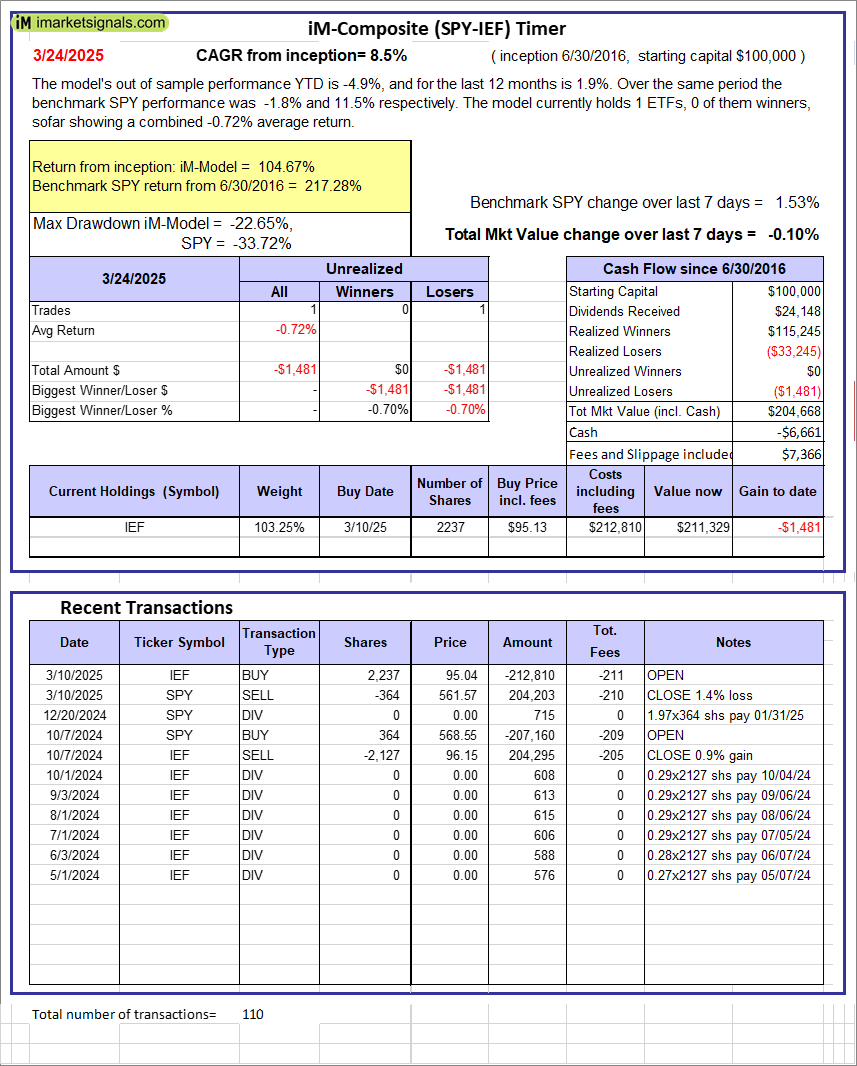 |
iM-Composite (SPY-IEF) Timer: The model’s out of sample performance YTD is -4.9%, and for the last 12 months is 1.9%. Over the same period the benchmark SPY performance was -1.8% and 11.5% respectively. Over the previous week the market value of the iM-Composite (SPY-IEF) Timer gained -0.10% at a time when SPY gained 1.53%. A starting capital of $100,000 at inception on 6/30/2016 would have grown to $204,668 which includes -$6,661 cash and excludes $7,366 spent on fees and slippage. |
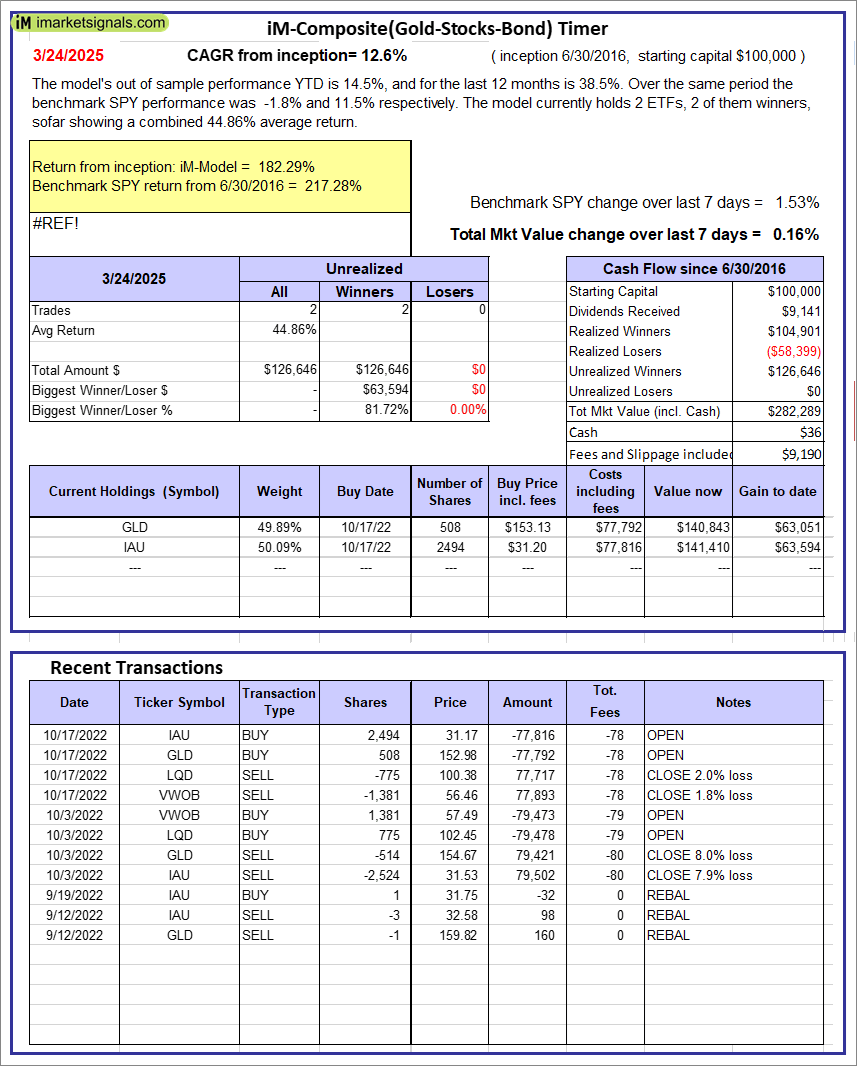 |
iM-Composite(Gold-Stocks-Bond) Timer: The model’s out of sample performance YTD is 14.5%, and for the last 12 months is 38.5%. Over the same period the benchmark SPY performance was -1.8% and 11.5% respectively. Over the previous week the market value of the iM-Composite(Gold-Stocks-Bond) Timer gained 0.16% at a time when SPY gained 1.53%. A starting capital of $100,000 at inception on 6/30/2016 would have grown to $282,289 which includes $36 cash and excludes $9,190 spent on fees and slippage. |
iM-Best Reports – 3/25/2025
Posted in pmp SPY-SH
Leave a Reply
You must be logged in to post a comment.