
  |
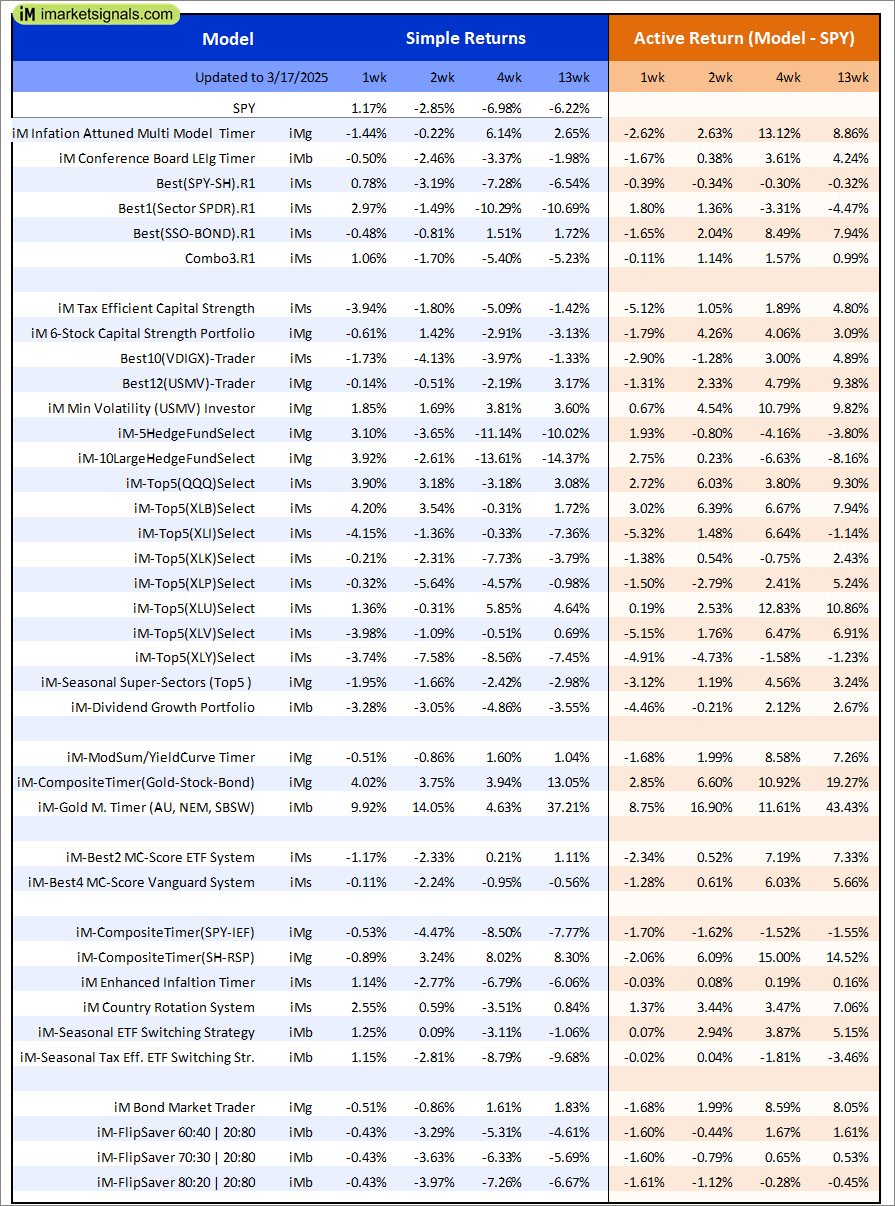
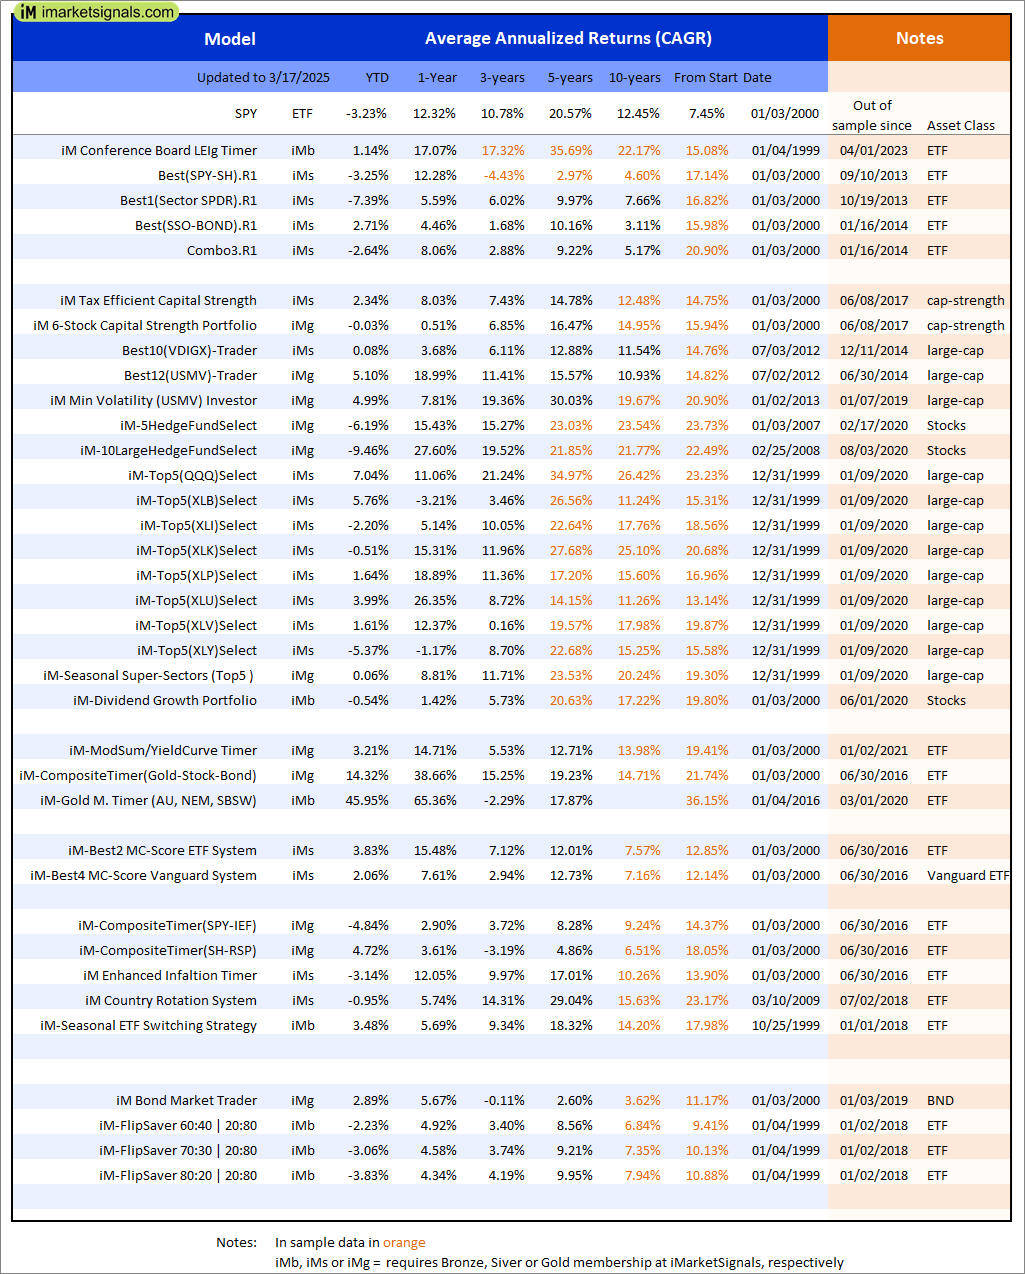
Out of sample performance summary of our models for the past 1, 2, 4 and 13 week periods. The active active return indicates how the models over- or underperformed the benchmark ETF SPY. Also the YTD, and the 1-, 3-, 5- and 10-year annualized returns are shown in the second table |
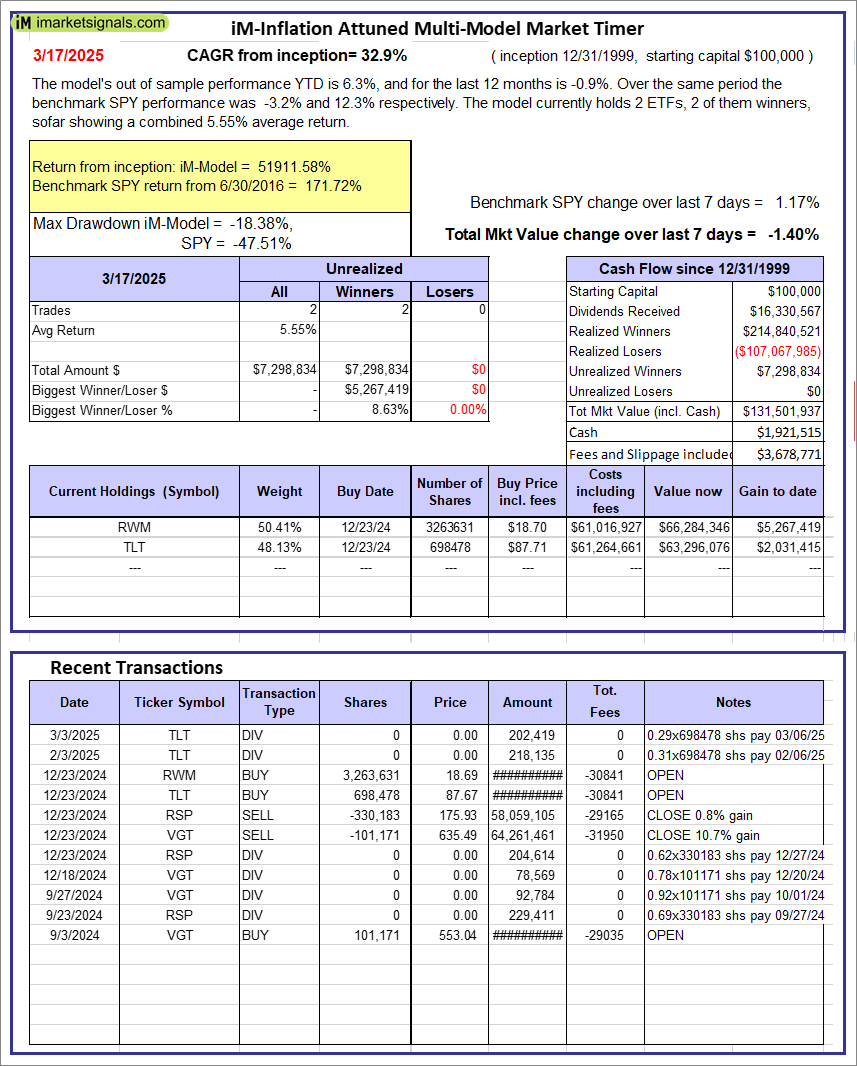 |
iM-Inflation Attuned Multi-Model Market Timer: The model’s out of sample performance YTD is 6.3%, and for the last 12 months is -0.9%. Over the same period the benchmark SPY performance was -3.2% and 12.3% respectively. Over the previous week the market value of the iM-Inflation Attuned Multi-Model Market Timer gained -1.40% at a time when SPY gained 1.17%. A starting capital of $100,000 at inception on 3/24/2017 would have grown to $131,501,937 which includes $1,921,515 cash and excludes $3,678,771 spent on fees and slippage. |
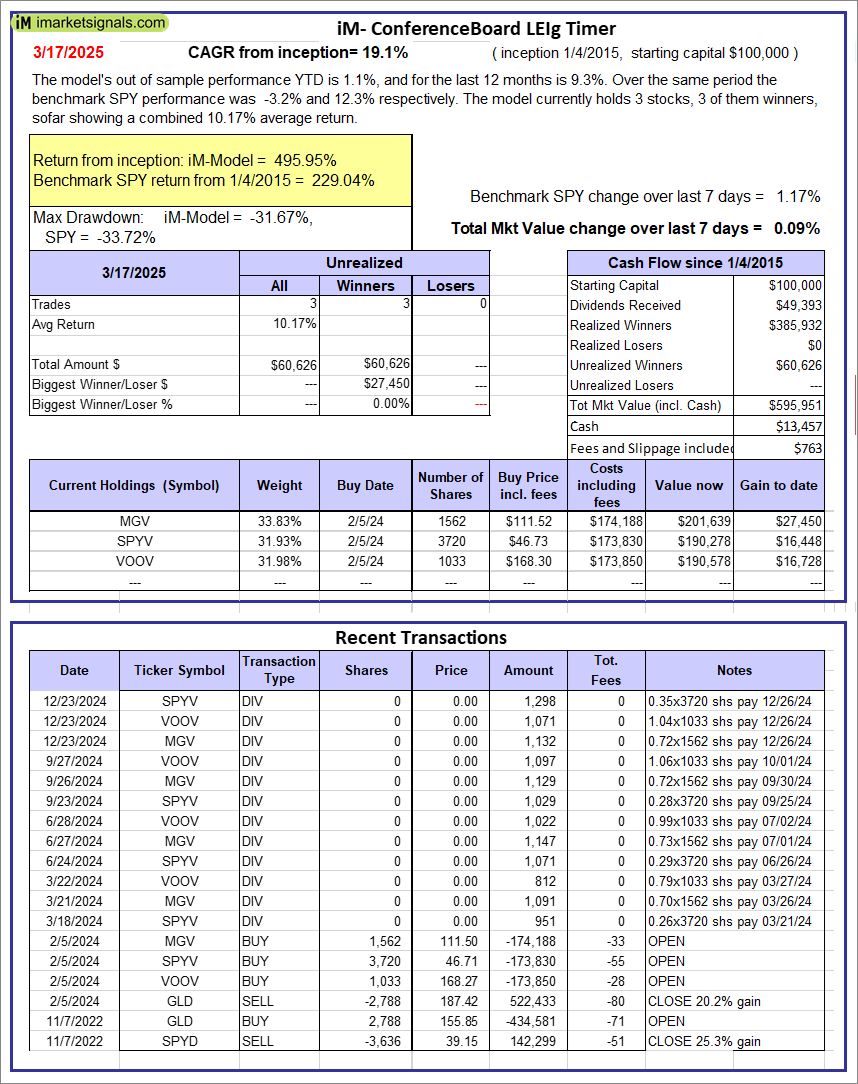 |
iM-Conference Board LEIg Timer: The model’s performance YTD is 14.3%, and for the last 12 months is 7.3%. Over the same period the benchmark SPY performance was 20.1% and 9.4% respectively. Over the previous week the market value of the iM-Conference Board LEIg Timer gained 0.09% at a time when SPY gained 1.17%. A starting capital of $100,000 at inception on 4/5/2017 would have grown to $595,951 which includes $13,457 cash and excludes $763 spent on fees and slippage. |
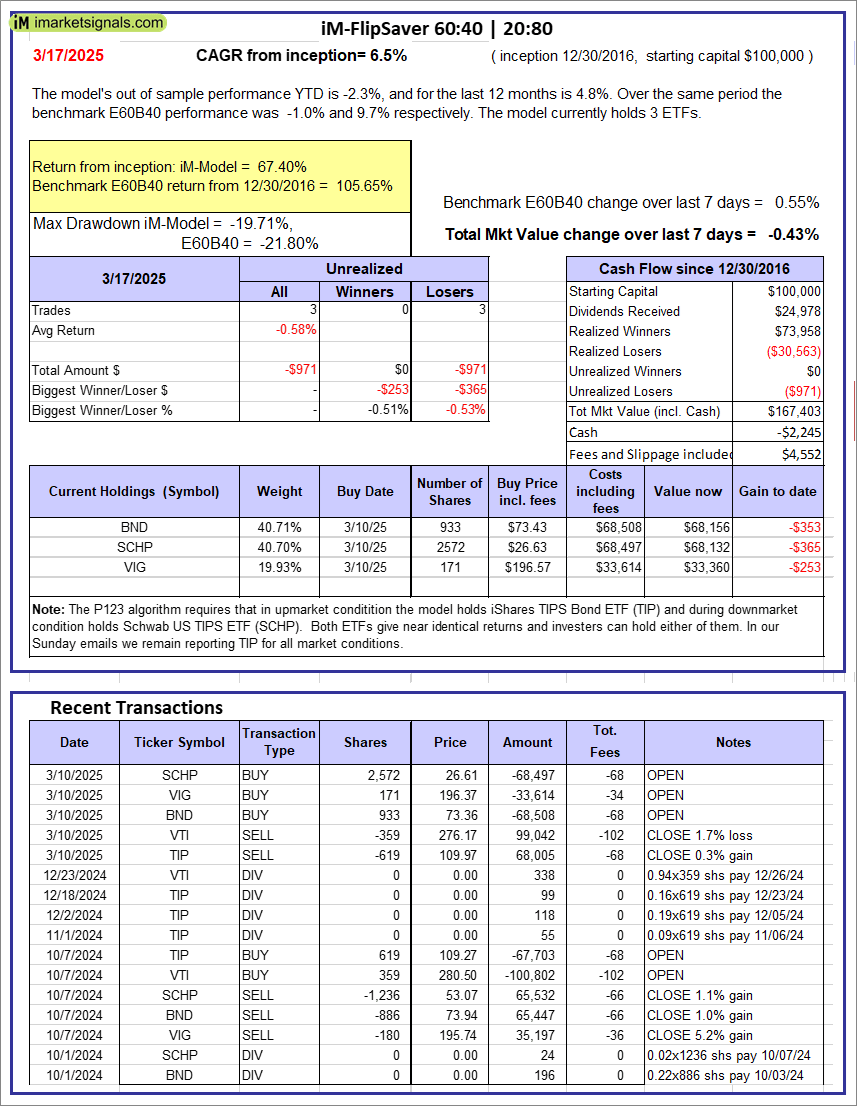 |
iM-FlipSaver 60:40 | 20:80 – 2017: The model’s out of sample performance YTD is -2.3%, and for the last 12 months is 4.8%. Over the same period the benchmark E60B40 performance was -1.0% and 9.7% respectively. Over the previous week the market value of iM-FlipSaver 80:20 | 20:80 gained -0.43% at a time when SPY gained 0.55%. A starting capital of $100,000 at inception on 7/16/2015 would have grown to $167,403 which includes -$2,245 cash and excludes $4,552 spent on fees and slippage. |
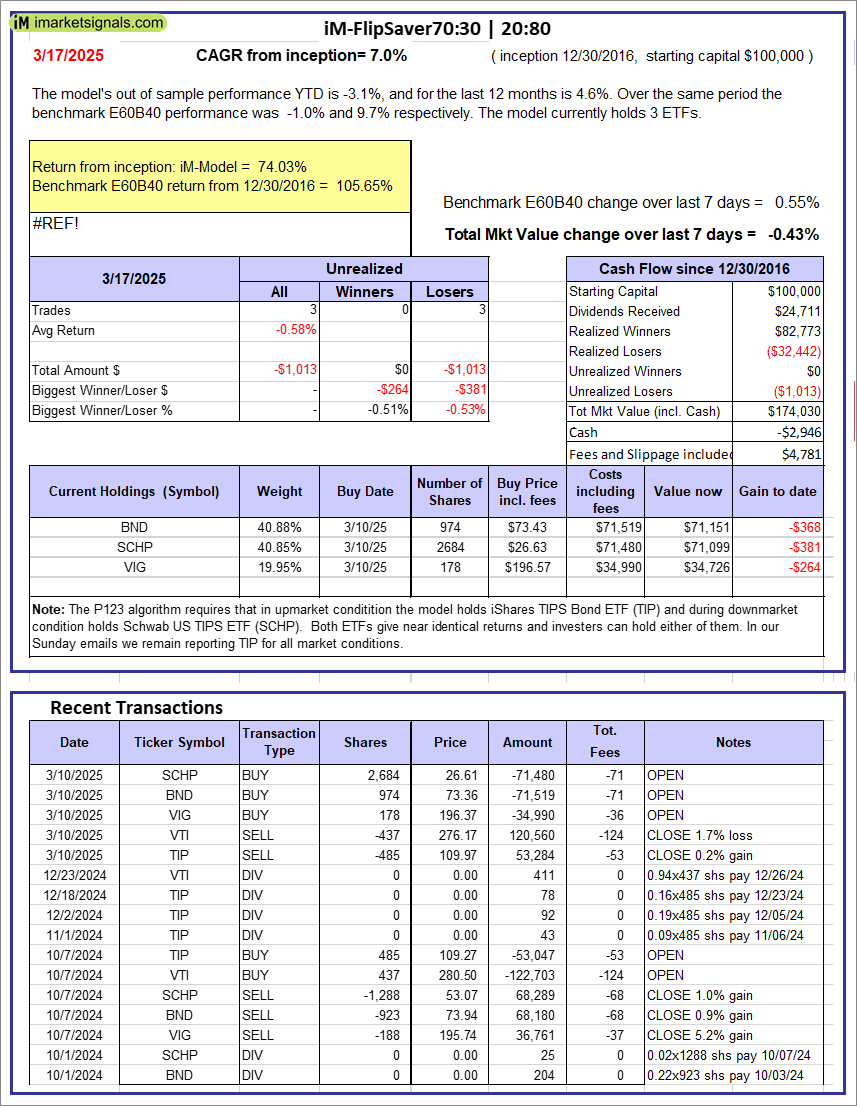 |
iM-FlipSaver 70:30 | 20:80 – 2017: The model’s out of sample performance YTD is -3.1%, and for the last 12 months is 4.6%. Over the same period the benchmark E60B40 performance was -1.0% and 9.7% respectively. Over the previous week the market value of iM-FlipSaver 70:30 | 20:80 gained -0.43% at a time when SPY gained 0.55%. A starting capital of $100,000 at inception on 7/15/2015 would have grown to $174,030 which includes -$2,946 cash and excludes $4,781 spent on fees and slippage. |
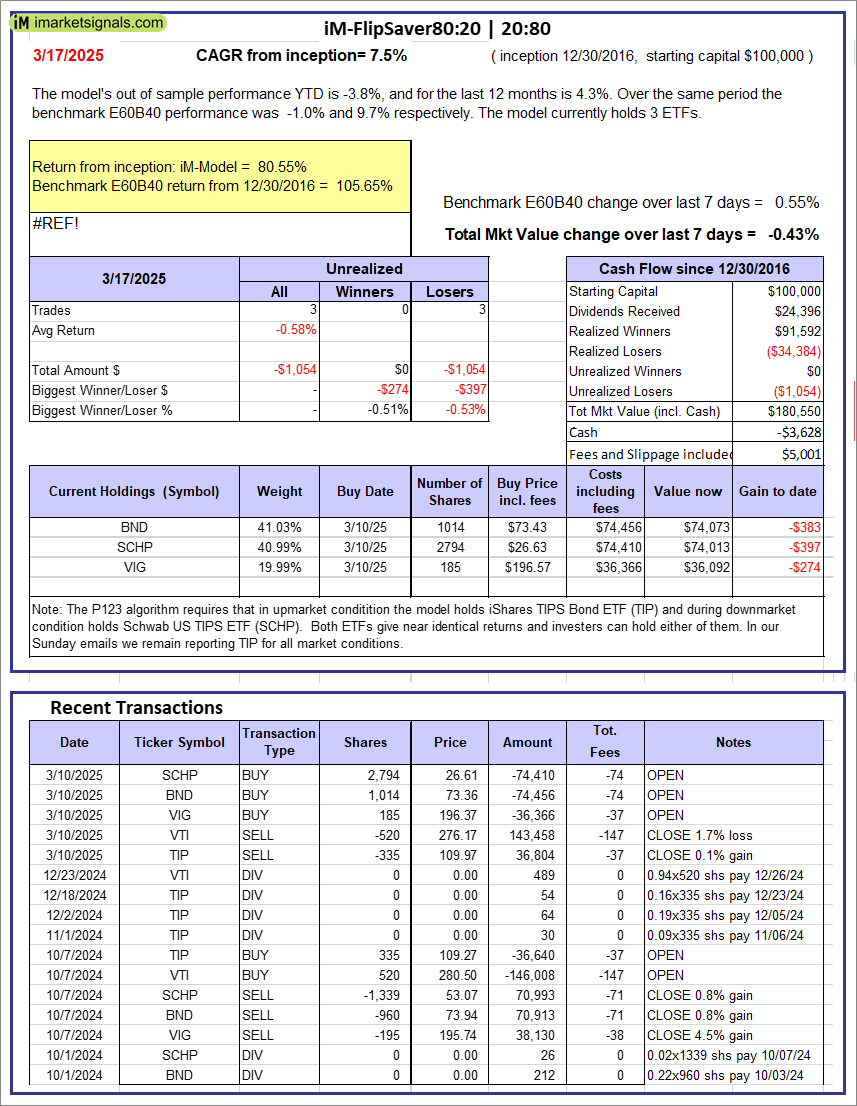 |
iM-FlipSaver 80:20 | 20:80 – 2017: The model’s out of sample performance YTD is -3.8%, and for the last 12 months is 4.3%. Over the same period the benchmark E60B40 performance was -1.0% and 9.7% respectively. Over the previous week the market value of iM-FlipSaver 80:20 | 20:80 gained -0.43% at a time when SPY gained 0.55%. A starting capital of $100,000 at inception on 1/2/2017 would have grown to $180,550 which includes -$3,628 cash and excludes $5,001 spent on fees and slippage. |
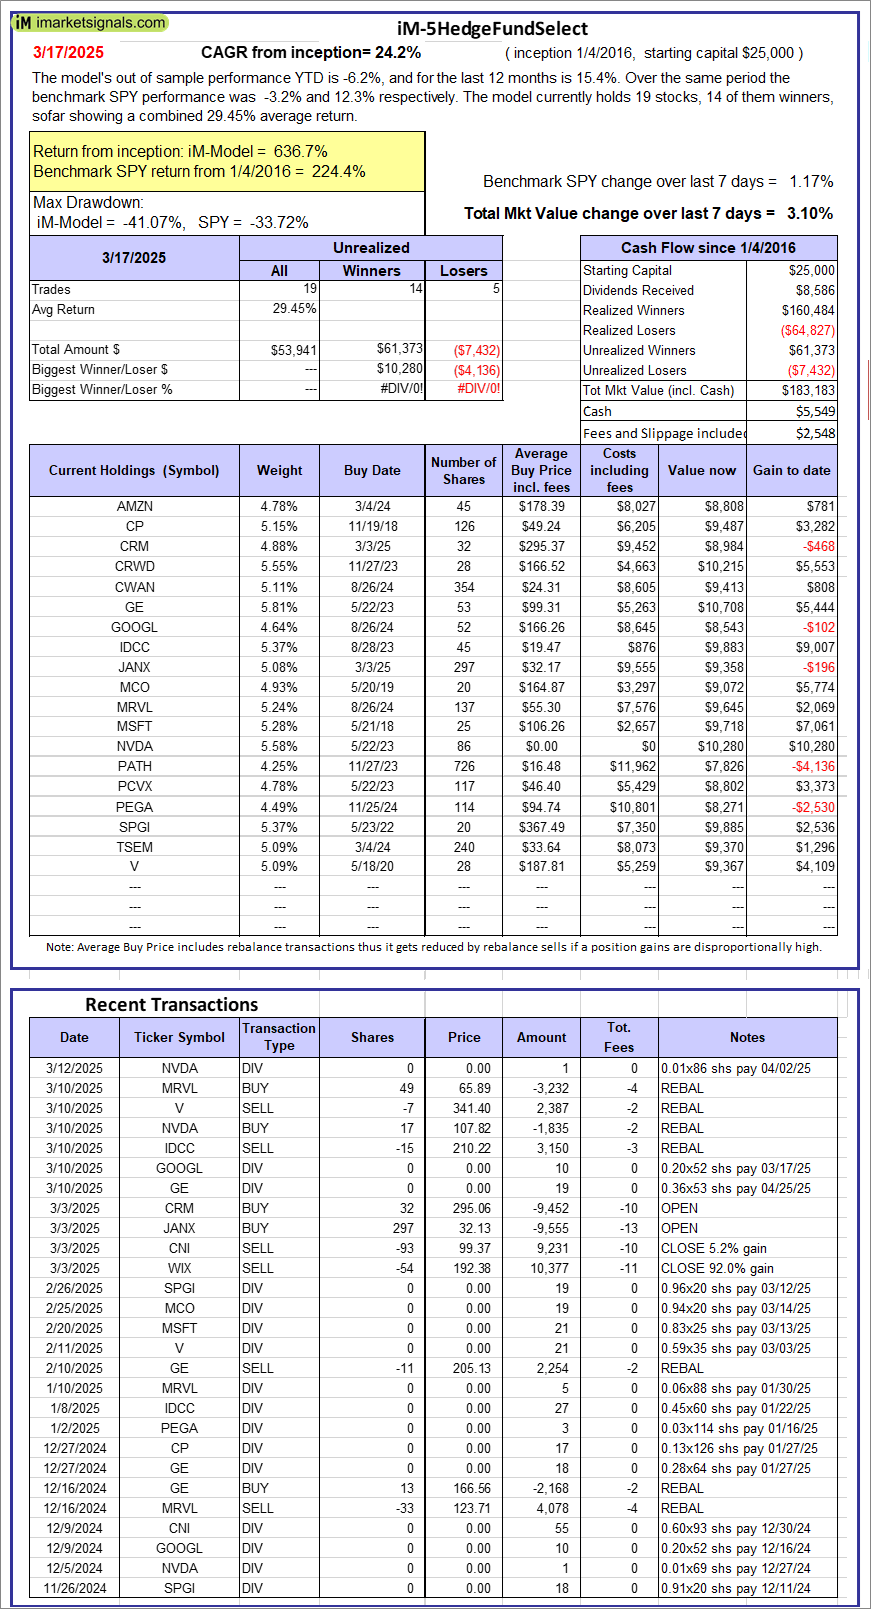 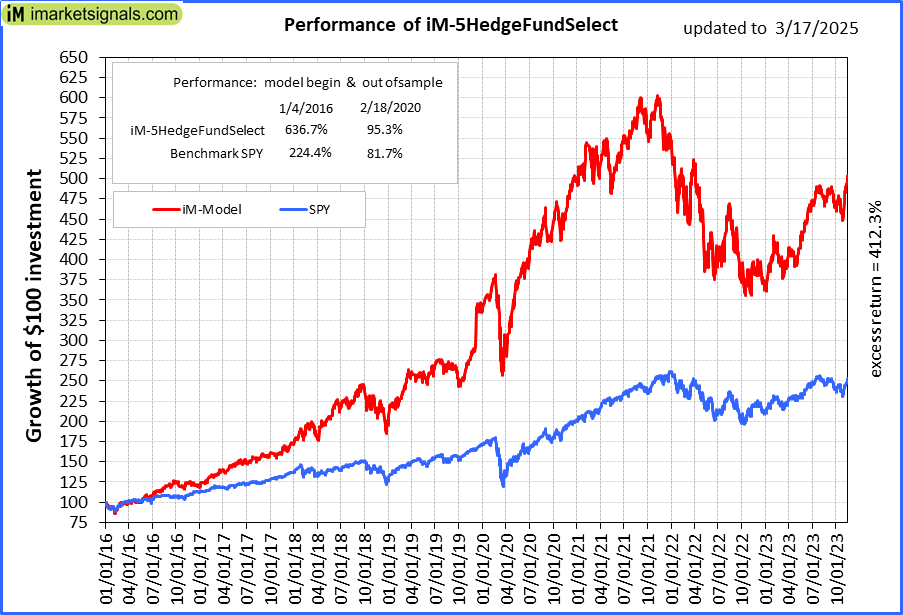 |
iM-5HedgeFundSelect: Since inception, on 1/5/2016, the model gained 636.69% while the benchmark SPY gained 224.43% over the same period. Over the previous week the market value of iM-5HedgeFundSelect gained 3.10% at a time when SPY gained 1.17%. A starting capital of $25,000 at inception on 1/5/2016 would have grown to $183,183 which includes $5,549 cash and excludes $2,548 spent on fees and slippage. |
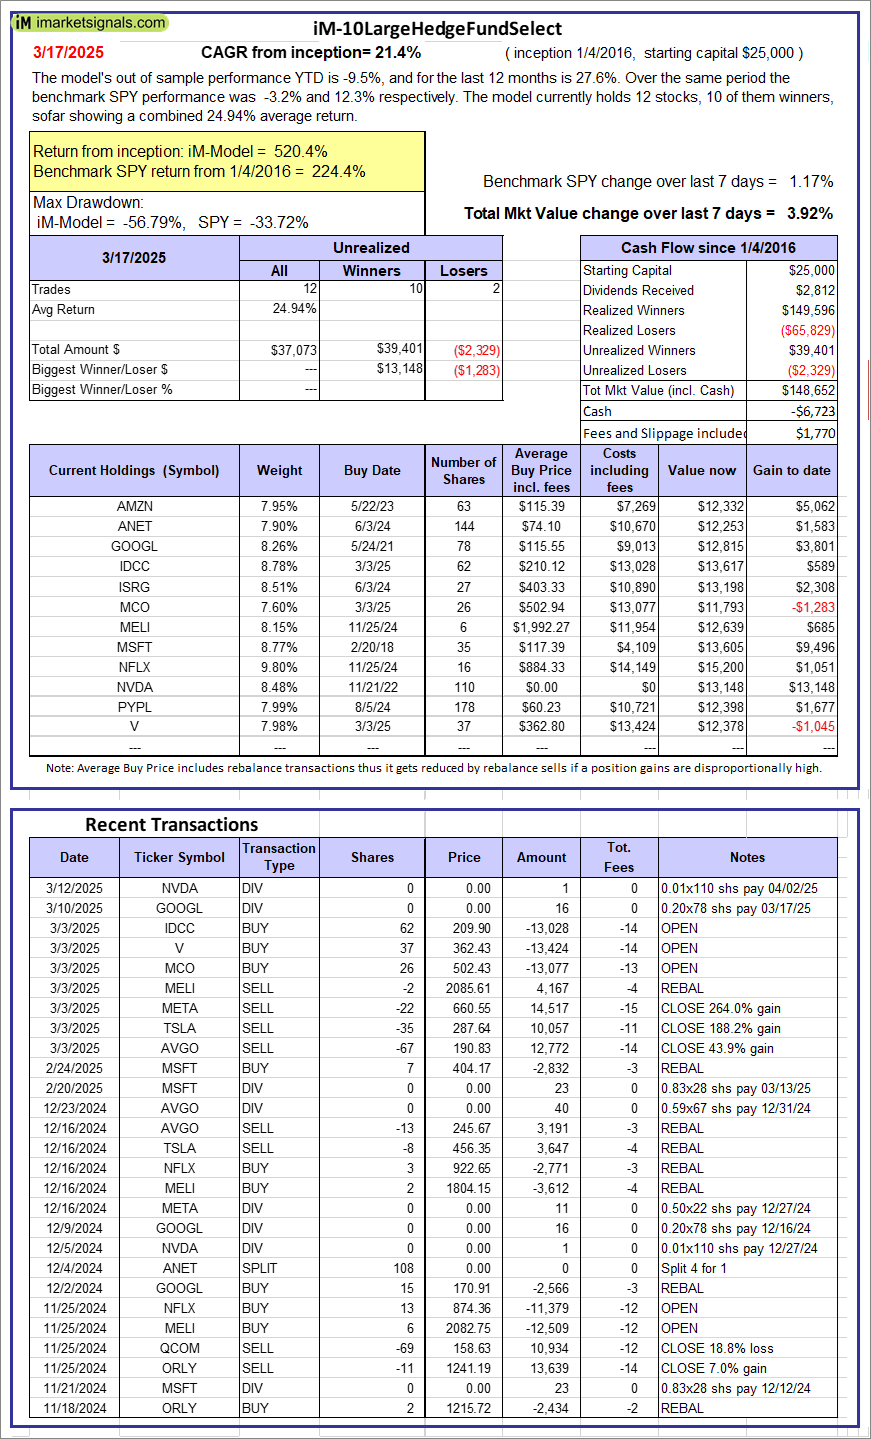 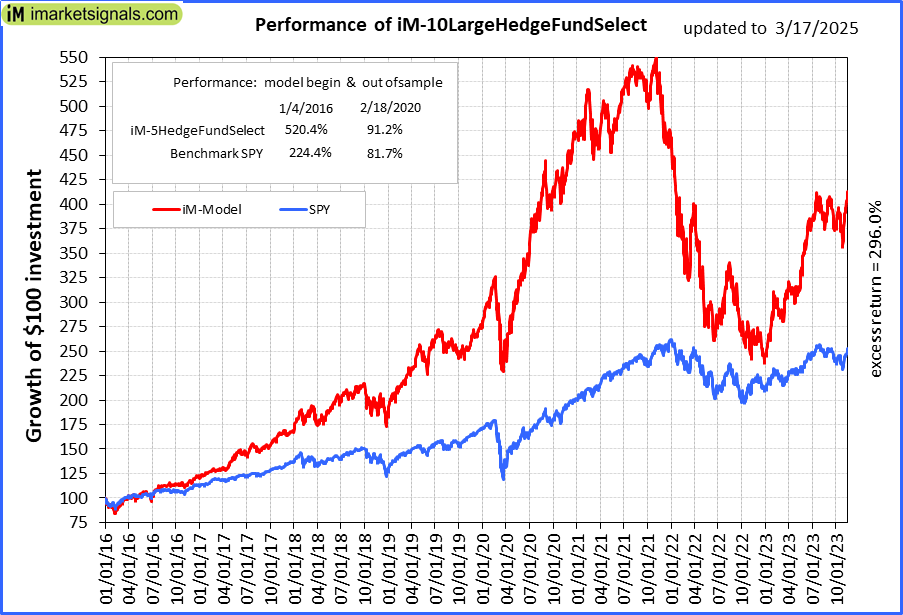 |
iM-10LargeHedgeFundSelect: Since inception, on 1/5/2016, the model gained 520.40% while the benchmark SPY gained 224.43% over the same period. Over the previous week the market value of iM-10LargeHedgeFundSelect gained 3.92% at a time when SPY gained 1.17%. A starting capital of $25,000 at inception on 1/5/2016 would have grown to $148,652 which includes -$6,723 cash and excludes $1,770 spent on fees and slippage. |
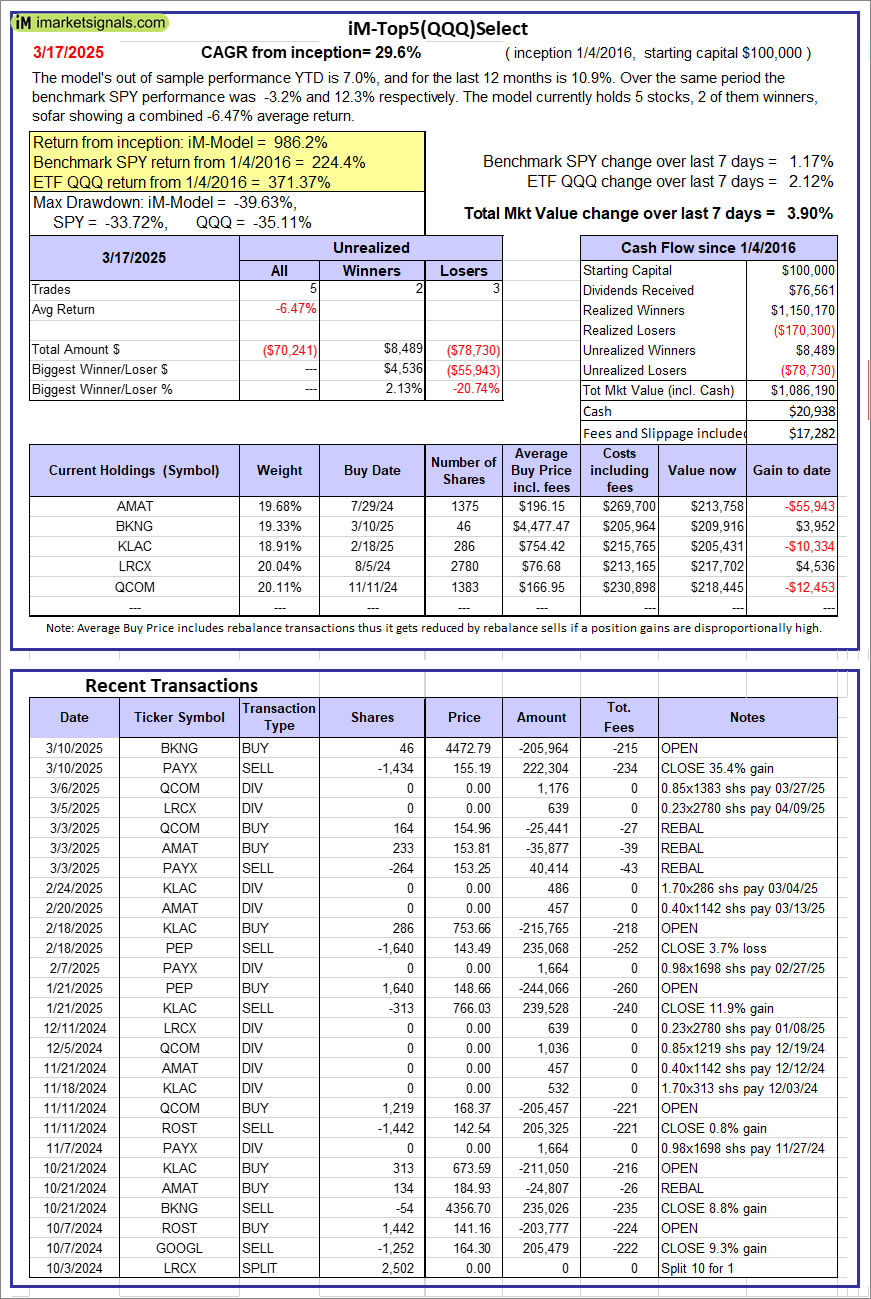 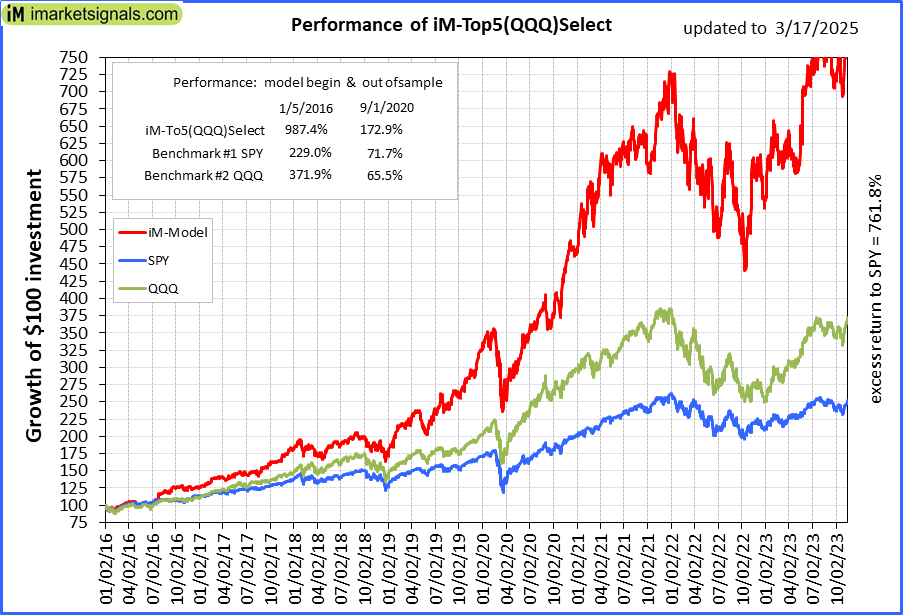 |
iM-Top5(QQQ)Select: Since inception, on 1/5/2016, the model gained 986.19% while the benchmark SPY gained 224.43% over the same period. Over the previous week the market value of iM-Top5(QQQ)Select gained 3.90% at a time when SPY gained 1.17%. A starting capital of $100,000 at inception on 1/5/2016 would have grown to $1,086,190 which includes $20,938 cash and excludes $17,282 spent on fees and slippage. |
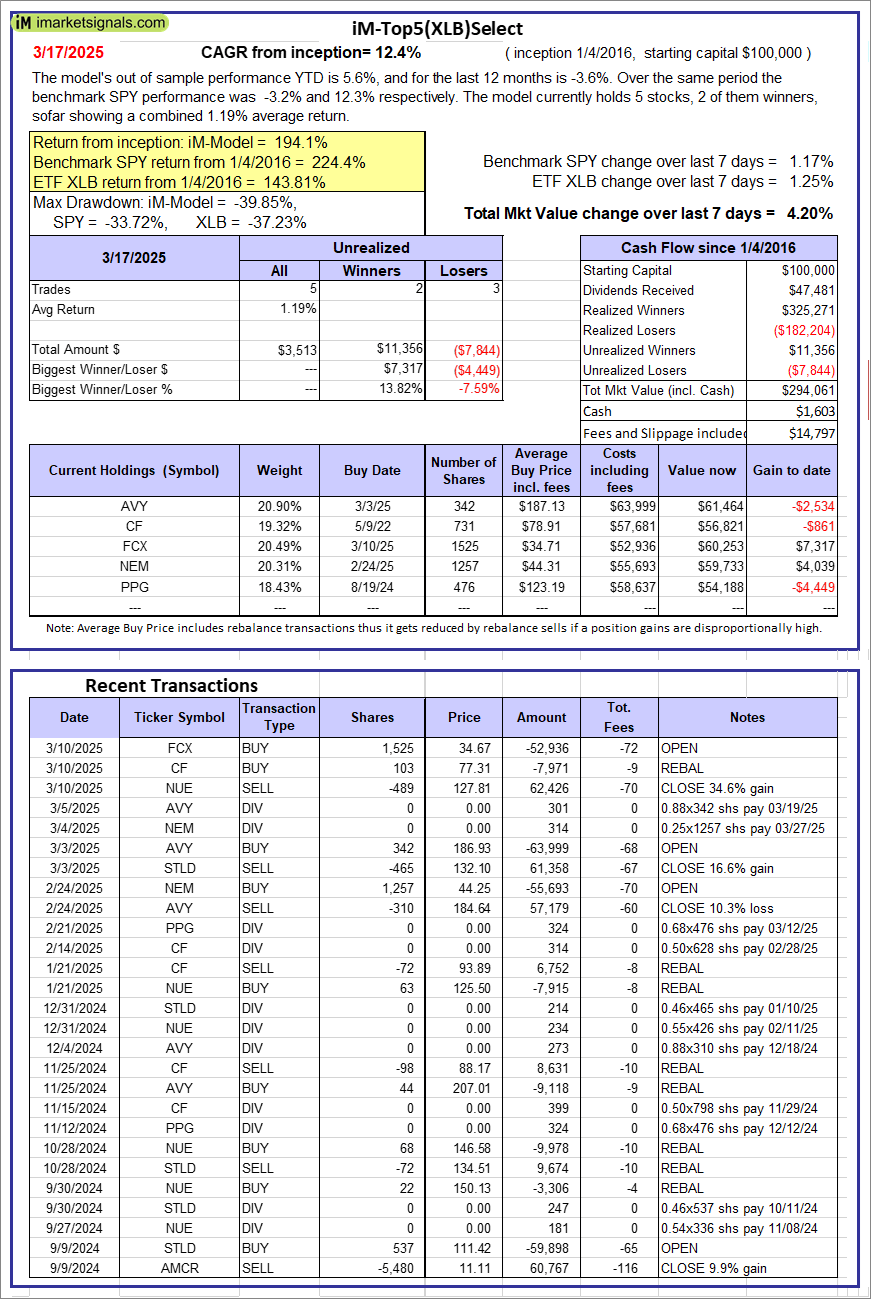 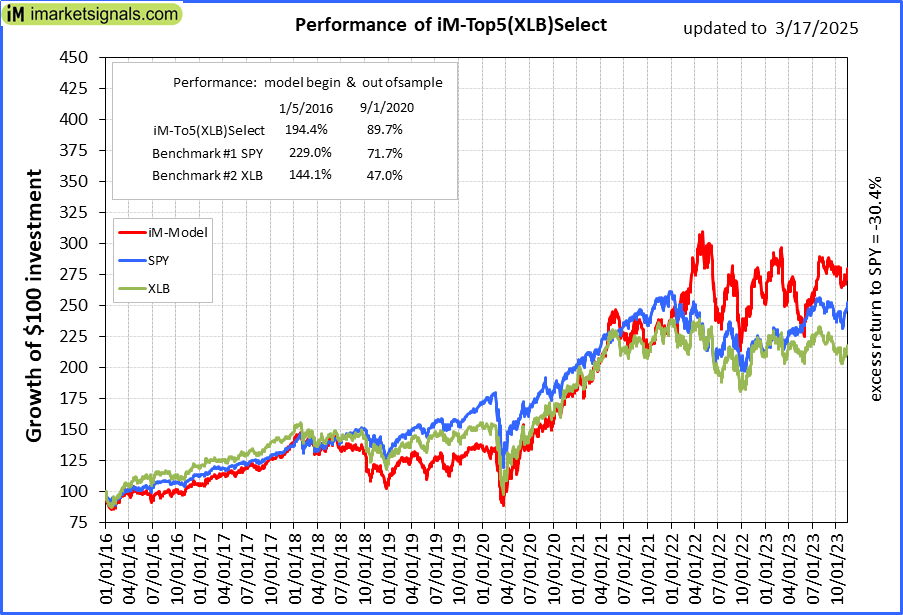 |
iM-Top5(XLB)Select: Since inception, on 1/5/2016, the model gained 194.06% while the benchmark SPY gained 224.43% over the same period. Over the previous week the market value of iM-Top5(XLB)Select gained 4.20% at a time when SPY gained 1.17%. A starting capital of $100,000 at inception on 1/5/2016 would have grown to $294,061 which includes $1,603 cash and excludes $14,797 spent on fees and slippage. |
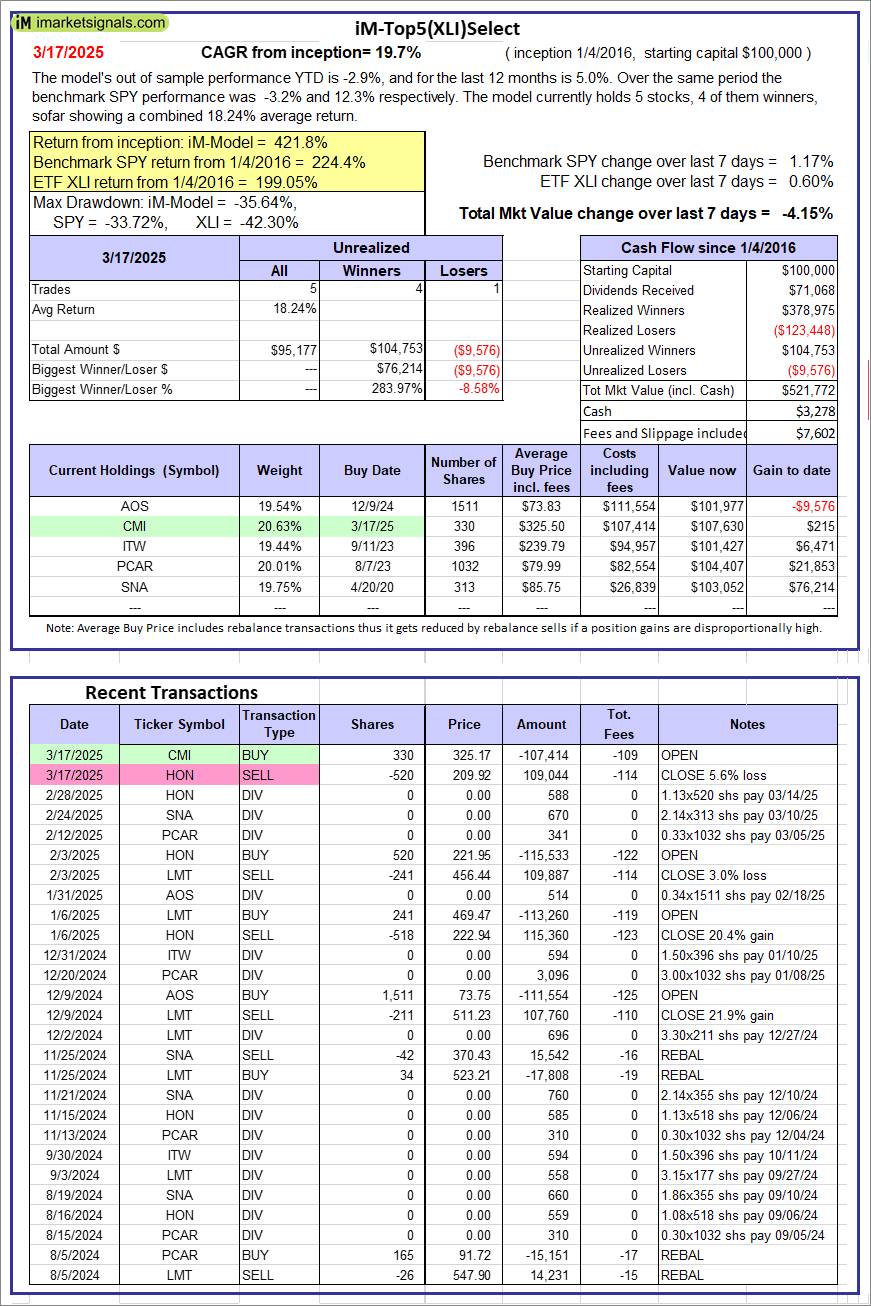 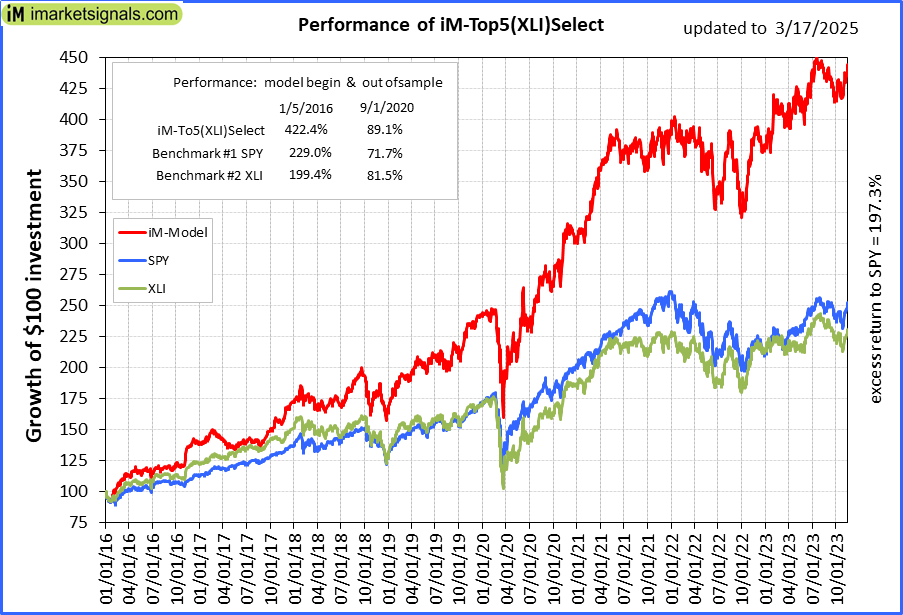 |
iM-Top5(XLI)Select: Since inception, on 1/5/2016, the model gained 421.77% while the benchmark SPY gained 224.43% over the same period. Over the previous week the market value of iM-Top5(XLI)Select gained -4.15% at a time when SPY gained 1.17%. A starting capital of $100,000 at inception on 1/5/2016 would have grown to $521,772 which includes $3,278 cash and excludes $7,602 spent on fees and slippage. |
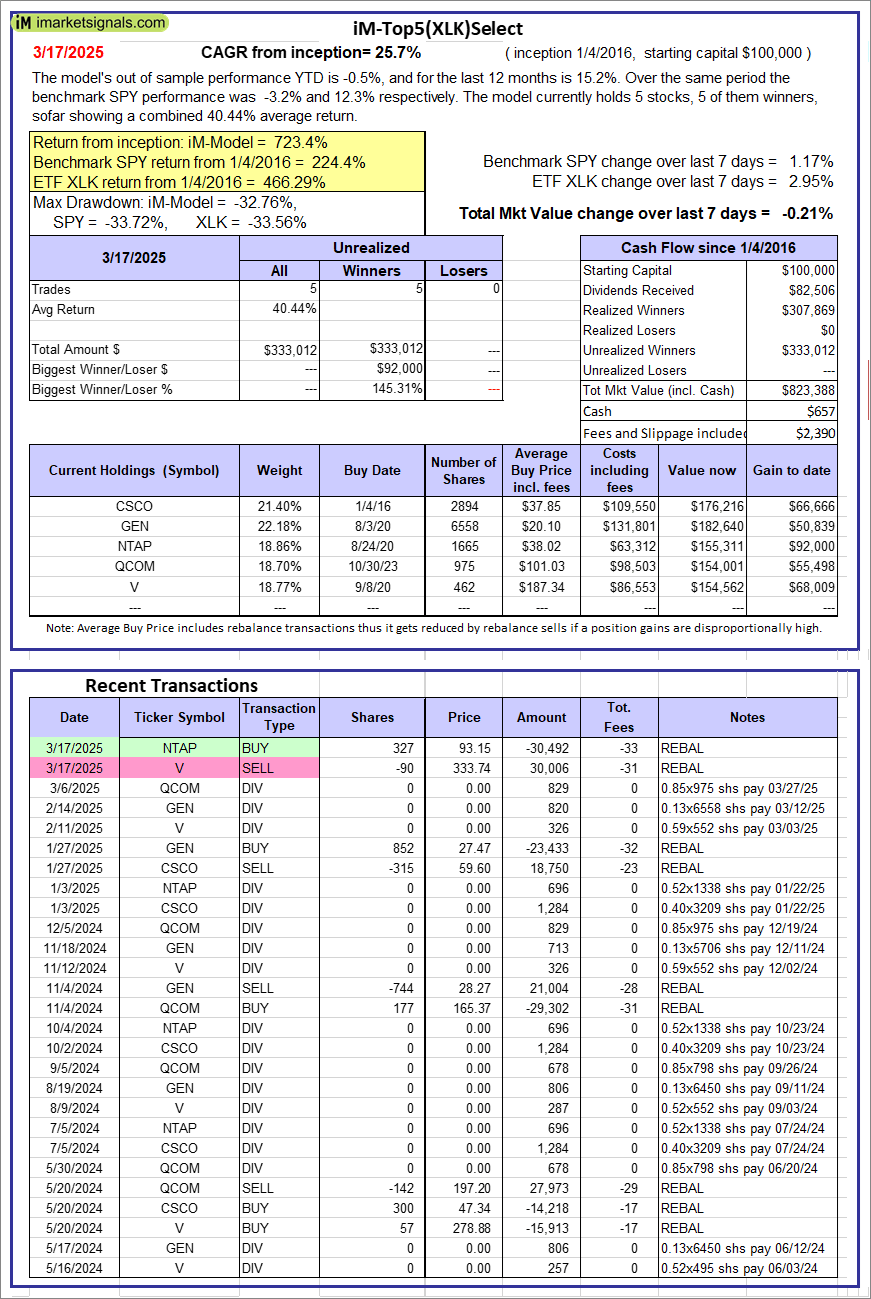 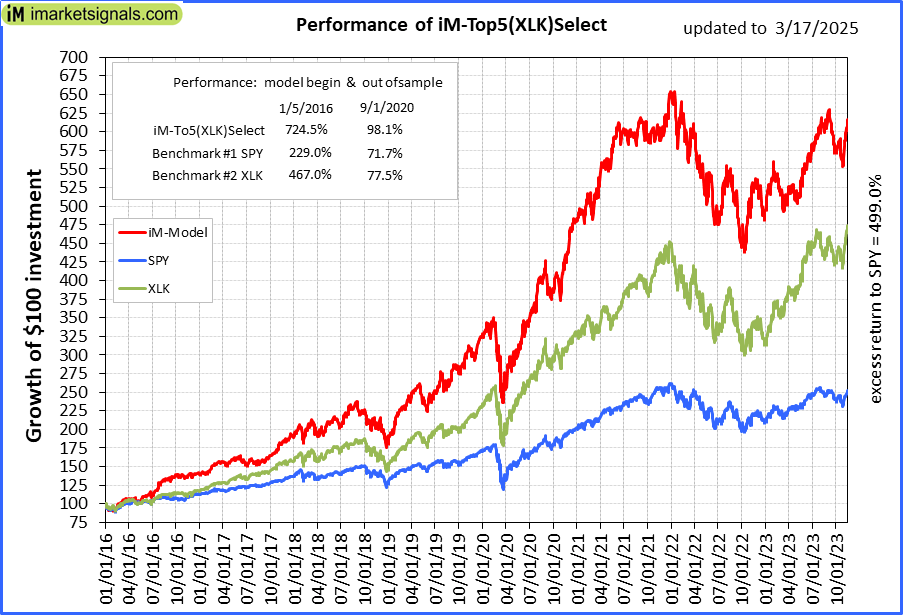 |
iM-Top5(XLK)Select: Since inception, on 1/5/2016, the model gained 723.39% while the benchmark SPY gained 224.43% over the same period. Over the previous week the market value of iM-Top5(XLK)Select gained -0.21% at a time when SPY gained 1.17%. A starting capital of $100,000 at inception on 1/5/2016 would have grown to $823,388 which includes $657 cash and excludes $2,390 spent on fees and slippage. |
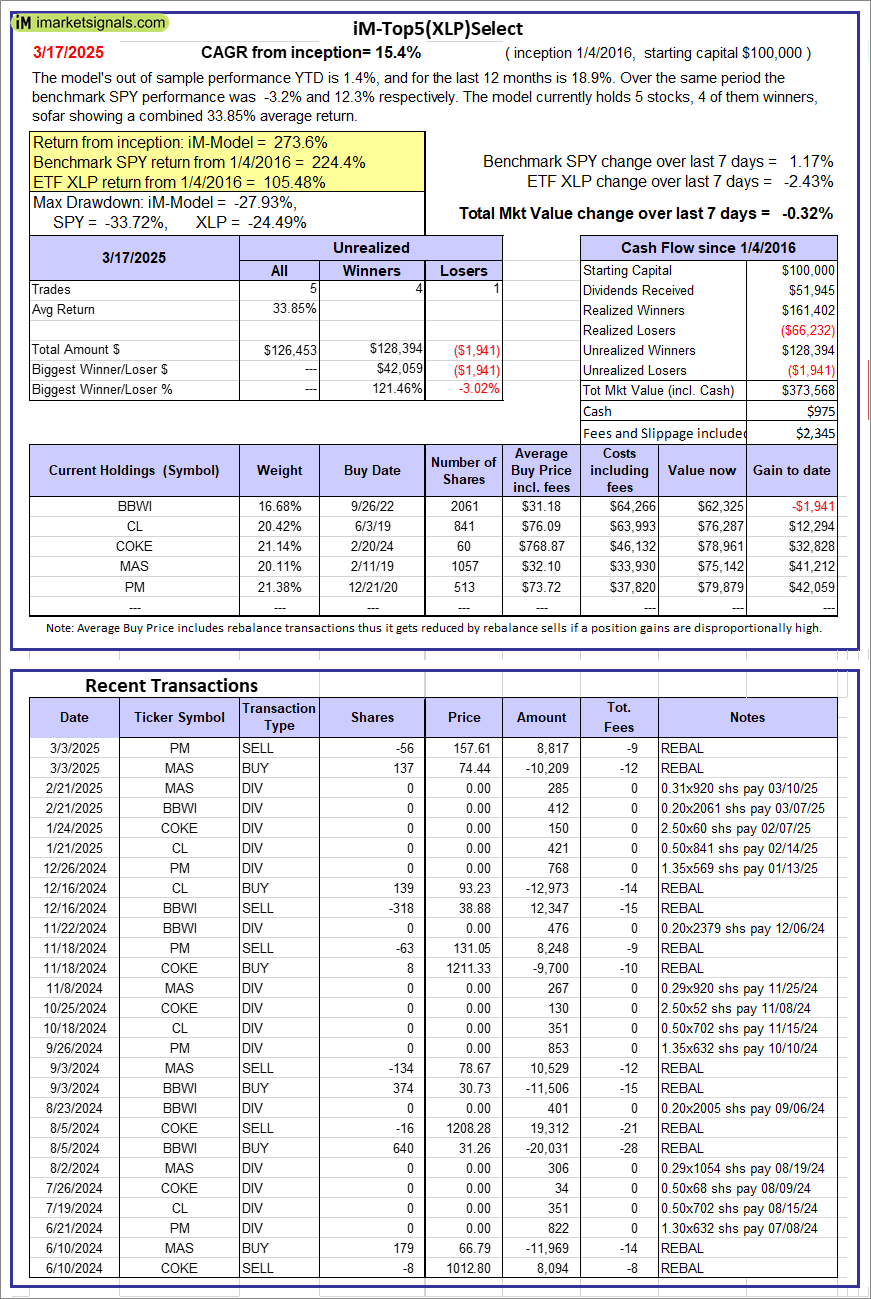 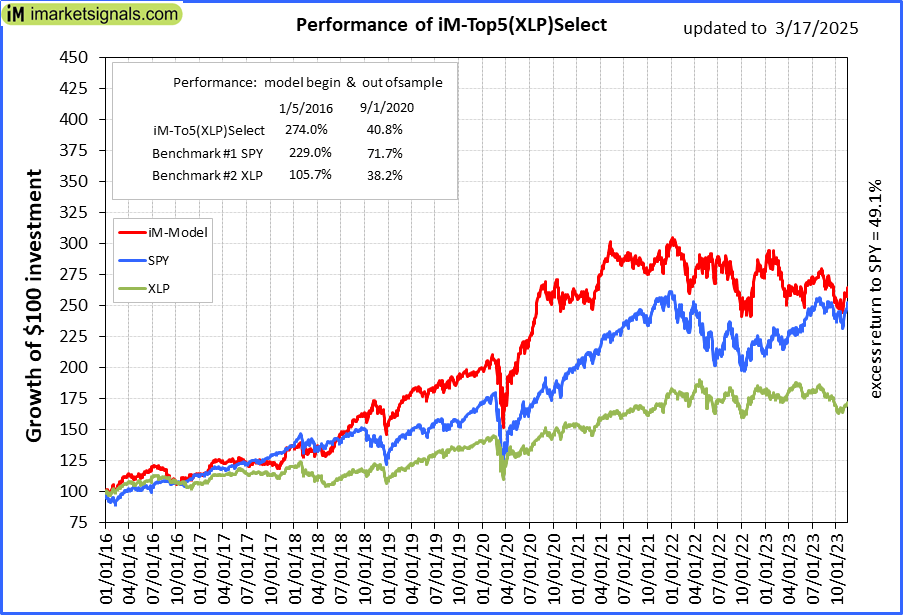 |
iM-Top5(XLP)Select: Since inception, on 1/5/2016, the model gained 273.57% while the benchmark SPY gained 224.43% over the same period. Over the previous week the market value of iM-Top5(XLP)Select gained -0.32% at a time when SPY gained 1.17%. A starting capital of $100,000 at inception on 1/5/2016 would have grown to $373,568 which includes $975 cash and excludes $2,345 spent on fees and slippage. |
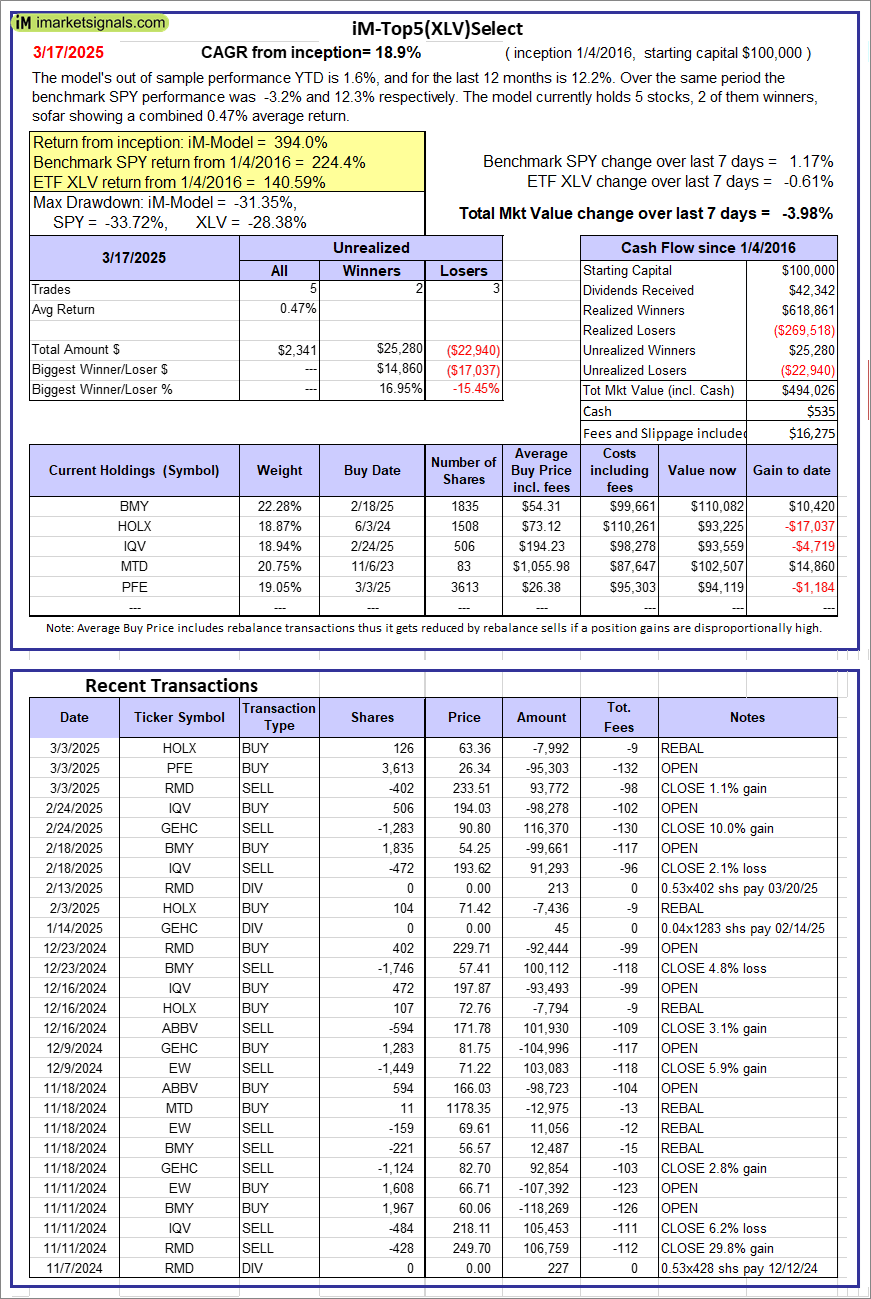 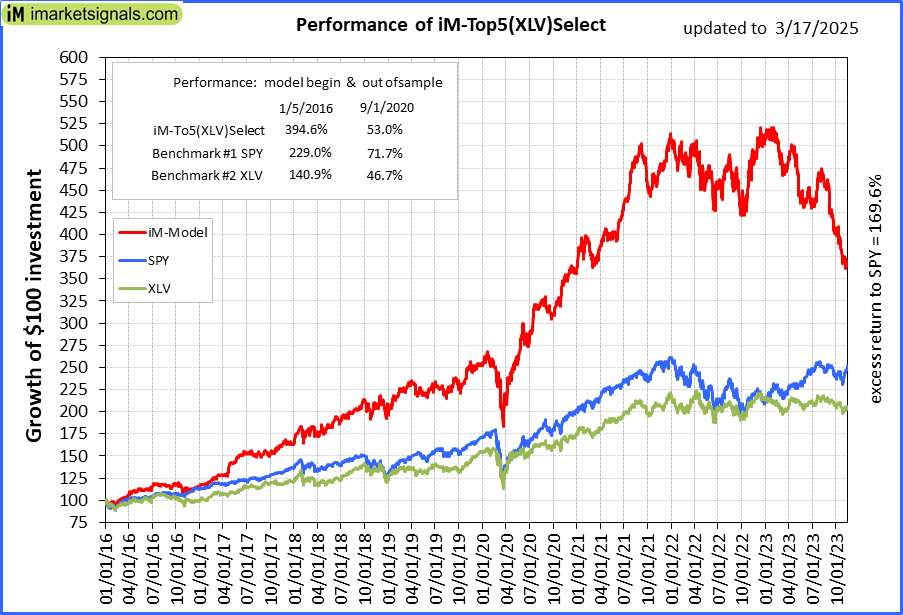 |
iM-Top5(XLV)Select: Since inception, on 1/5/2016, the model gained 394.03% while the benchmark SPY gained 224.43% over the same period. Over the previous week the market value of iM-Top5(XLV)Select gained -3.98% at a time when SPY gained 1.17%. A starting capital of $100,000 at inception on 1/5/2016 would have grown to $494,026 which includes $535 cash and excludes $16,275 spent on fees and slippage. |
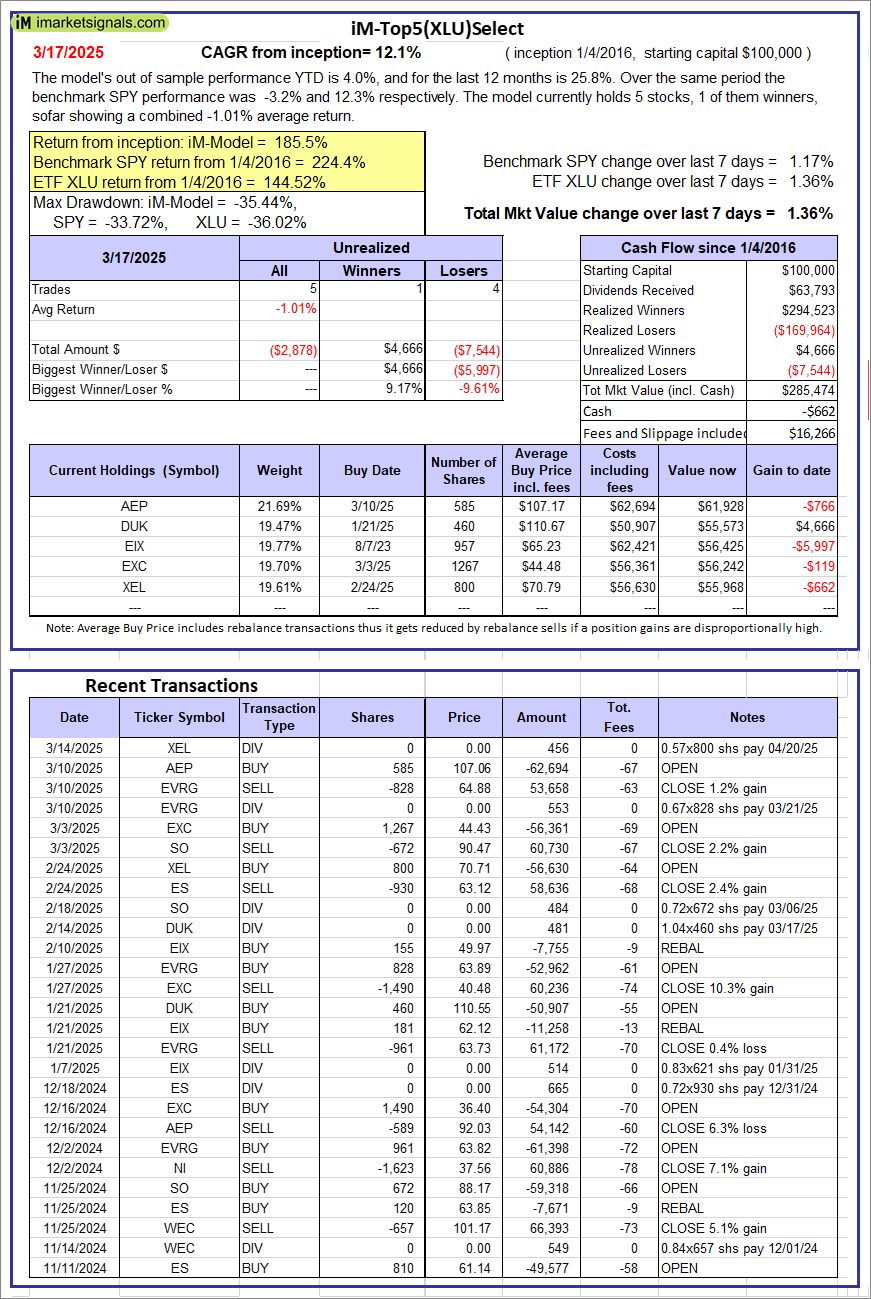 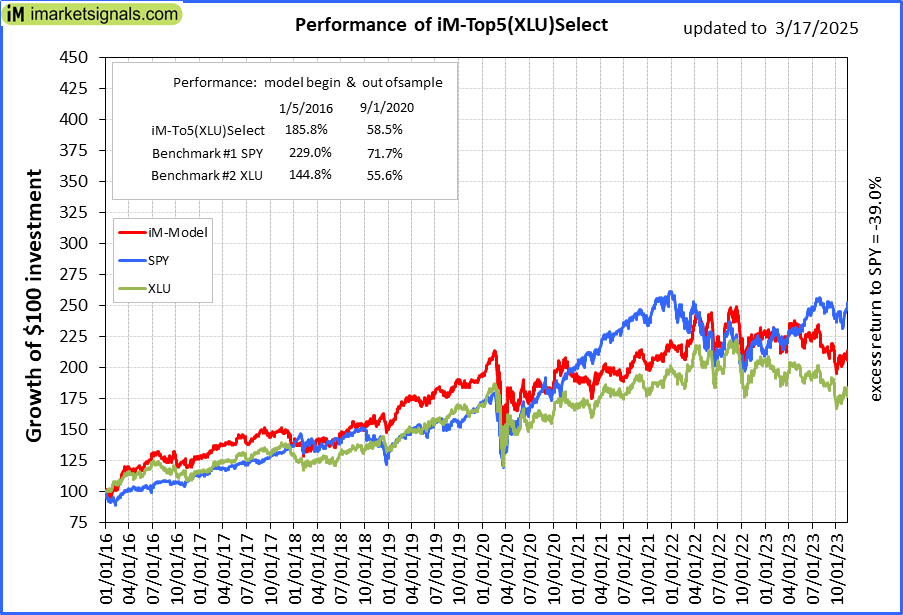 |
iM-Top5(XLU)Select: Since inception, on 1/5/2016, the model gained 185.47% while the benchmark SPY gained 224.43% over the same period. Over the previous week the market value of iM-Top5(XLU)Select gained 1.36% at a time when SPY gained 1.17%. A starting capital of $100,000 at inception on 1/5/2016 would have grown to $285,474 which includes -$662 cash and excludes $16,266 spent on fees and slippage. |
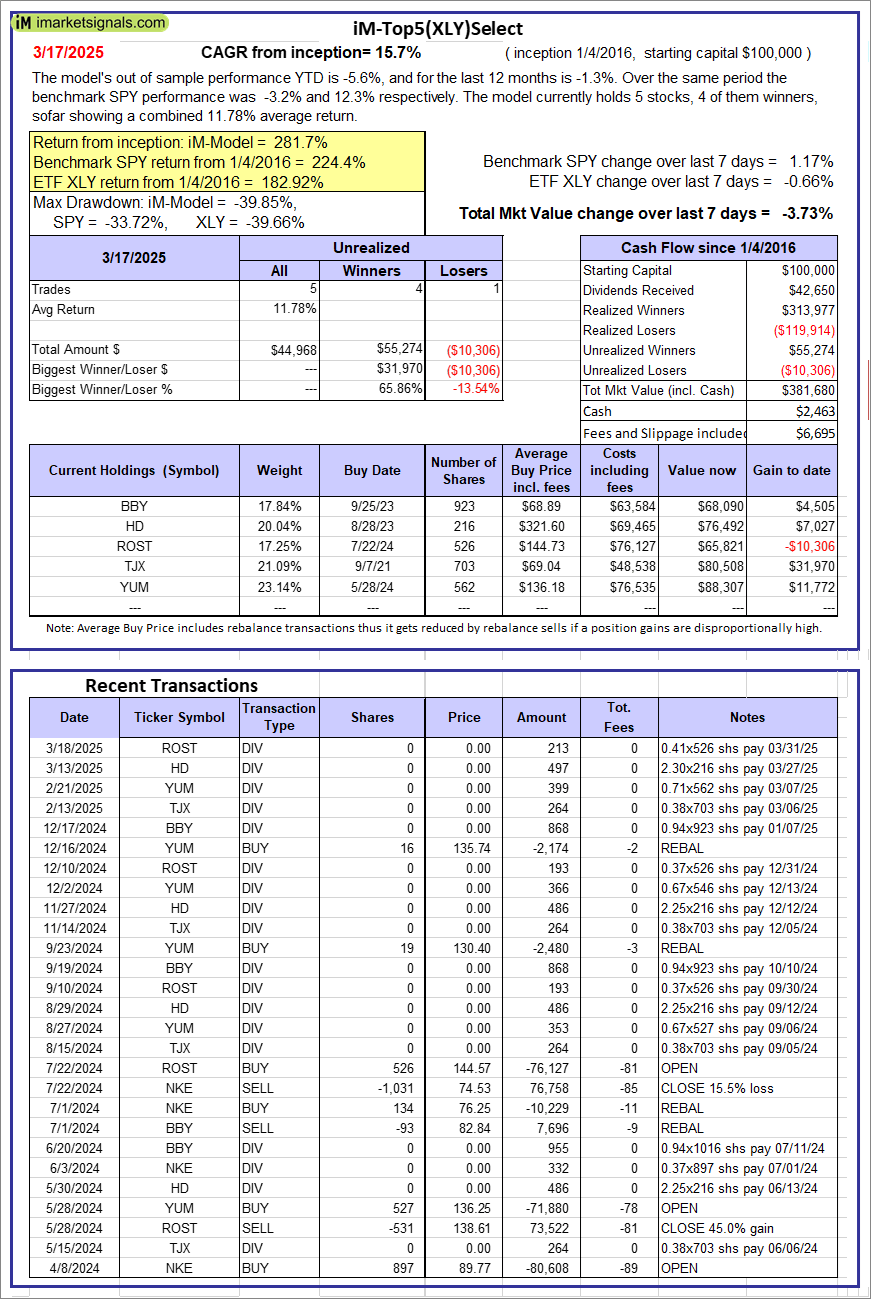 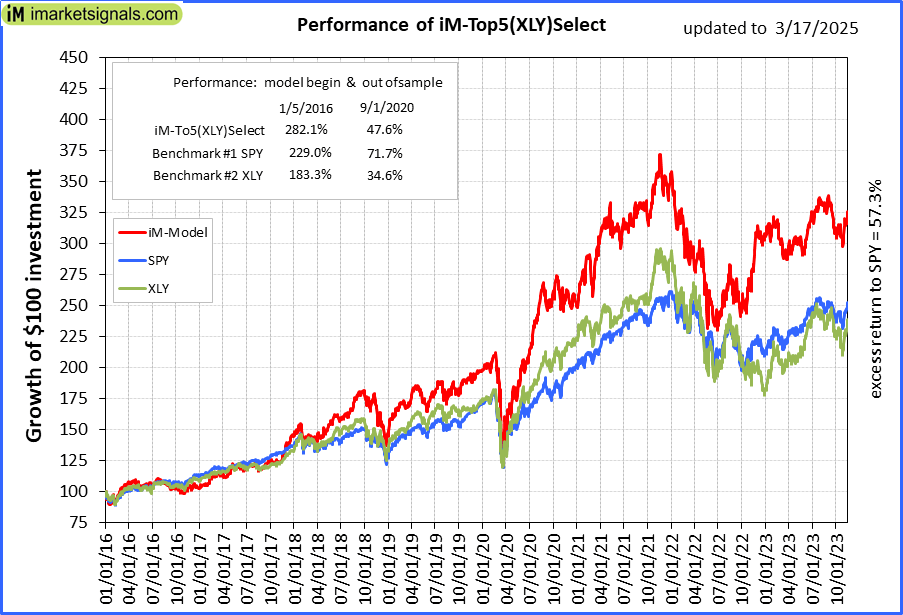 |
iM-Top5(XLY)Select: Since inception, on 1/5/2016, the model gained 281.68% while the benchmark SPY gained 224.43% over the same period. Over the previous week the market value of iM-Top5(XLY)Select gained -3.73% at a time when SPY gained 1.17%. A starting capital of $100,000 at inception on 1/5/2016 would have grown to $381,680 which includes $2,463 cash and excludes $6,695 spent on fees and slippage. |
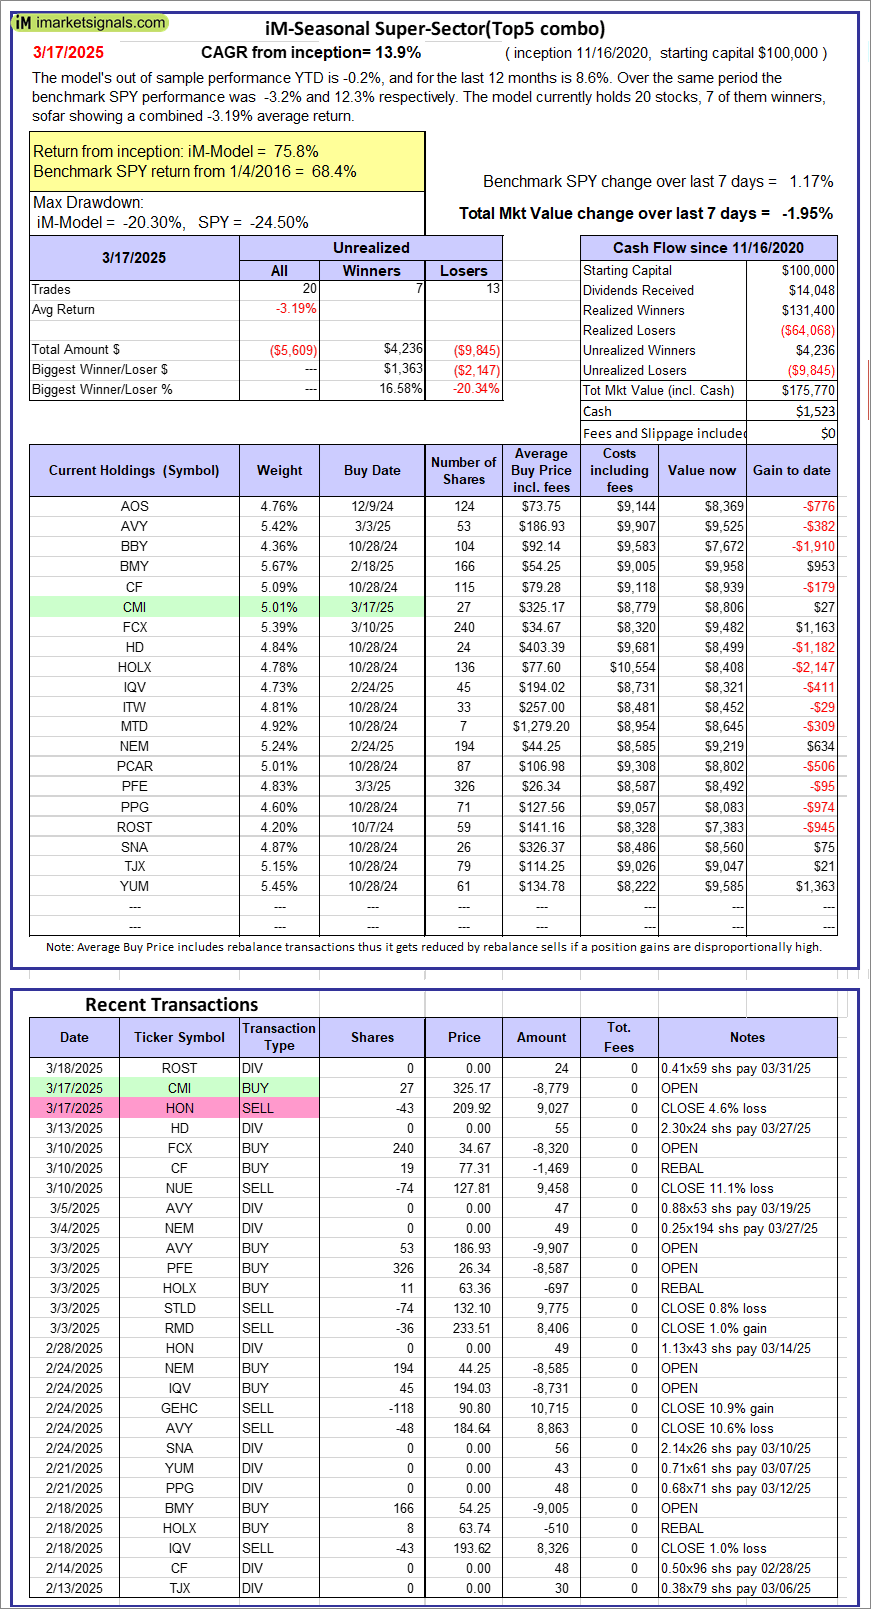 |
iM-Seasonal Super-Sectors (Top5 combo) : Since inception, on 11/17/2020, the model gained 75.77% while the benchmark SPY gained 68.41% over the same period. Over the previous week the market value of iM-Seasonal Super-Sectors (Top5 combo) gained -1.95% at a time when SPY gained 1.17%. A starting capital of $100,000 at inception on 11/17/2020 would have grown to $175,770 which includes $1,523 cash and excludes $00 spent on fees and slippage. |
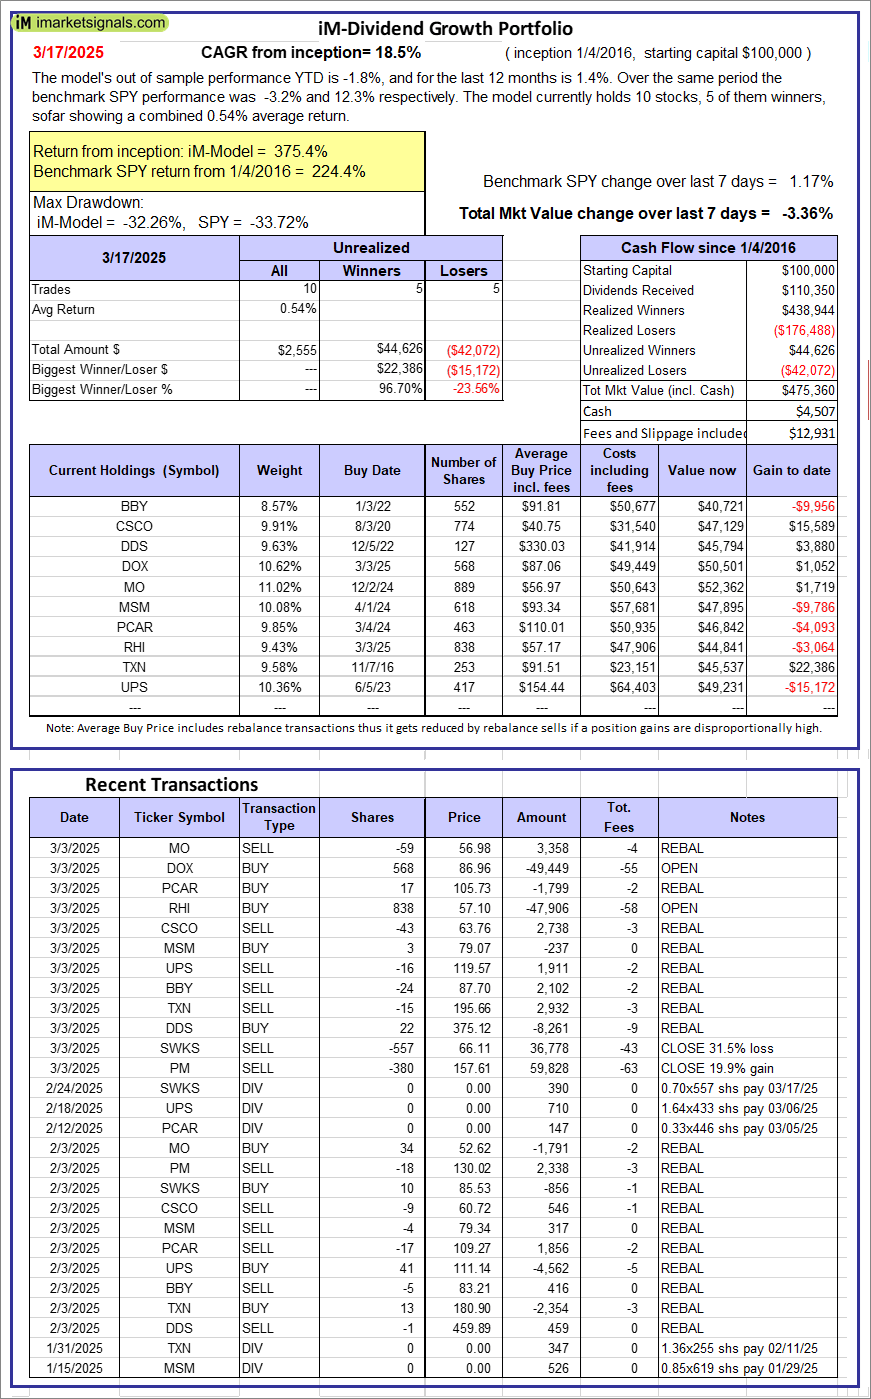 |
iM-Dividend Growth Portfolio: The model’s out of sample performance YTD is -1.8%, and for the last 12 months is 1.4%. Over the same period the benchmark SPY performance was -3.2% and 12.3% respectively. Over the previous week the market value of the iM-Dividend Growth Portfolio gained -3.36% at a time when SPY gained 1.17%. A starting capital of $100,000 at inception on 6/30/2016 would have grown to $475,360 which includes $4,507 cash and excludes $12,931 spent on fees and slippage. |
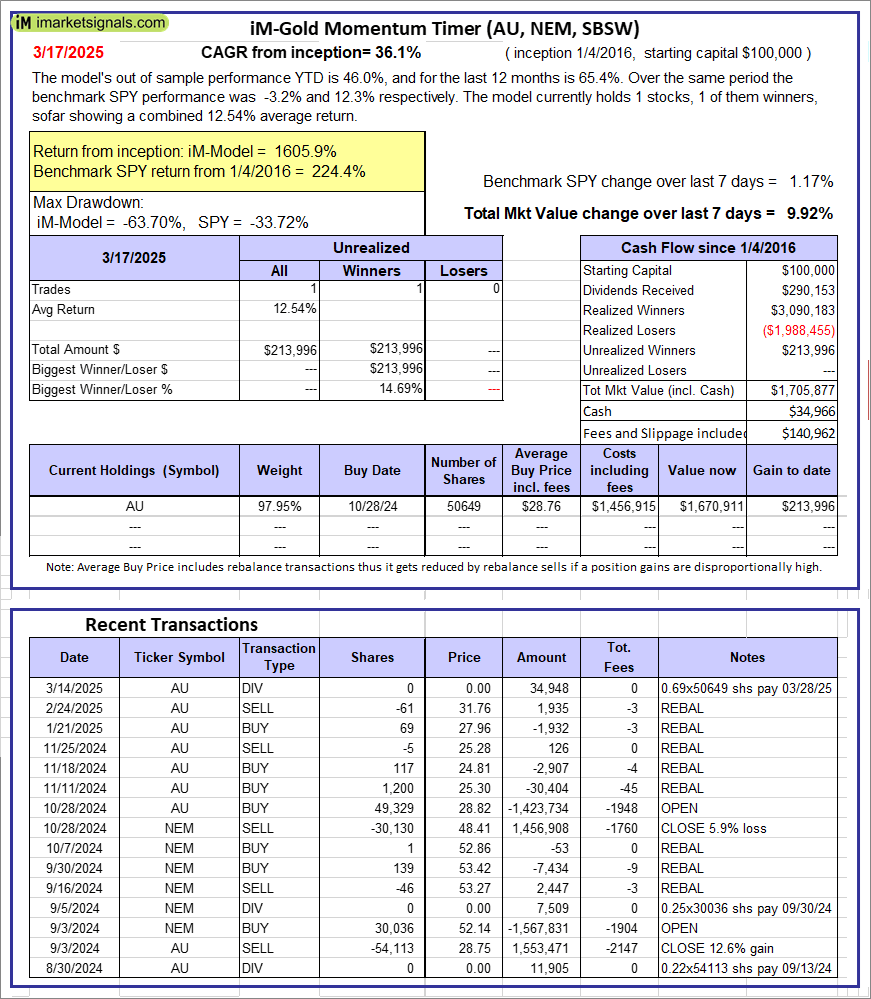 |
iM-Gold Momentum Timer (AU, NEM, SBSW): The model’s out of sample performance YTD is 46.0%, and for the last 12 months is 65.4%. Over the same period the benchmark SPY performance was -3.2% and 12.3% respectively. Over the previous week the market value of iM-Gold Momentum Timer (AU, NEM, SBSW) gained 9.92% at a time when SPY gained 1.17%. A starting capital of $100,000 at inception on 6/30/2016 would have grown to $34,966 which includes $140,962 cash and excludes Gain to date spent on fees and slippage. |
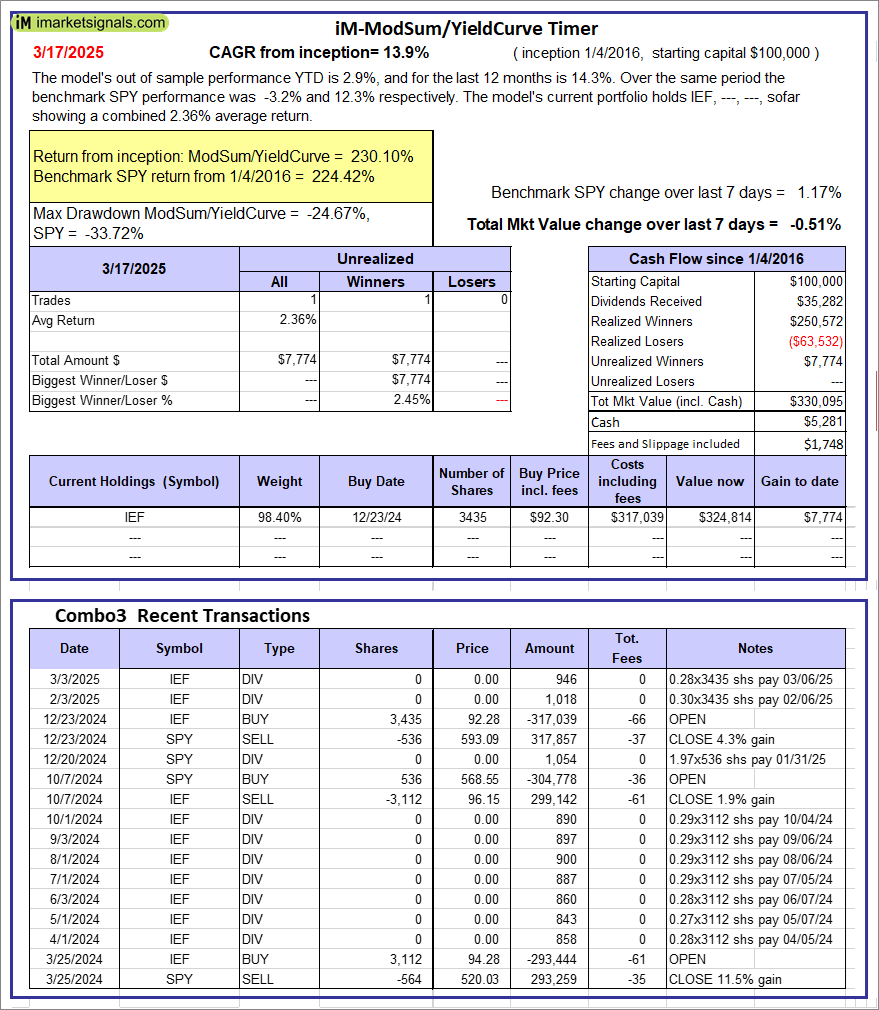 |
iM-ModSum/YieldCurve Timer: The model’s out of sample performance YTD is 2.9%, and for the last 12 months is 14.3%. Over the same period the benchmark SPY performance was -3.2% and 12.3% respectively. Over the previous week the market value of iM-PortSum/YieldCurve Timer gained -0.51% at a time when SPY gained 1.17%. A starting capital of $100,000 at inception on 1/1/2016 would have grown to $330,095 which includes $5,281 cash and excludes $1,748 spent on fees and slippage. |
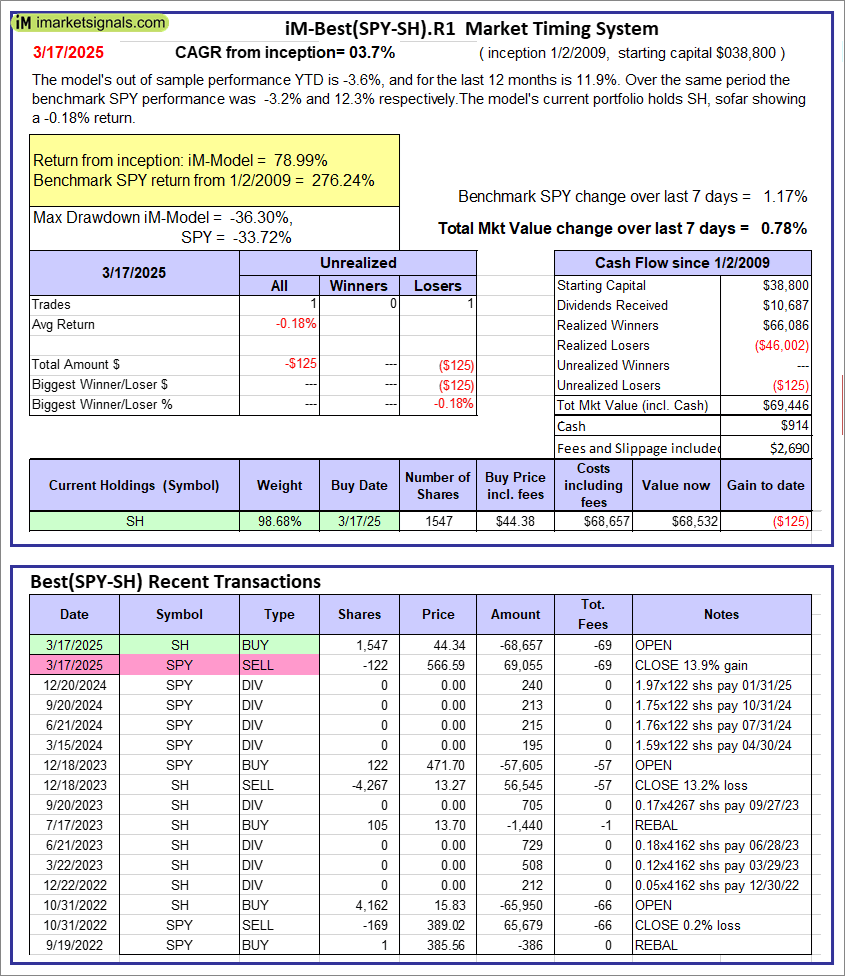 |
iM-Best(SPY-SH).R1: The model’s out of sample performance YTD is -3.6%, and for the last 12 months is 11.9%. Over the same period the benchmark SPY performance was -3.2% and 12.3% respectively. Over the previous week the market value of Best(SPY-SH) gained 0.78% at a time when SPY gained 1.17%. A starting capital of $100,000 at inception on 1/2/2009 would have grown to $69,446 which includes $914 cash and excludes $2,690 spent on fees and slippage. |
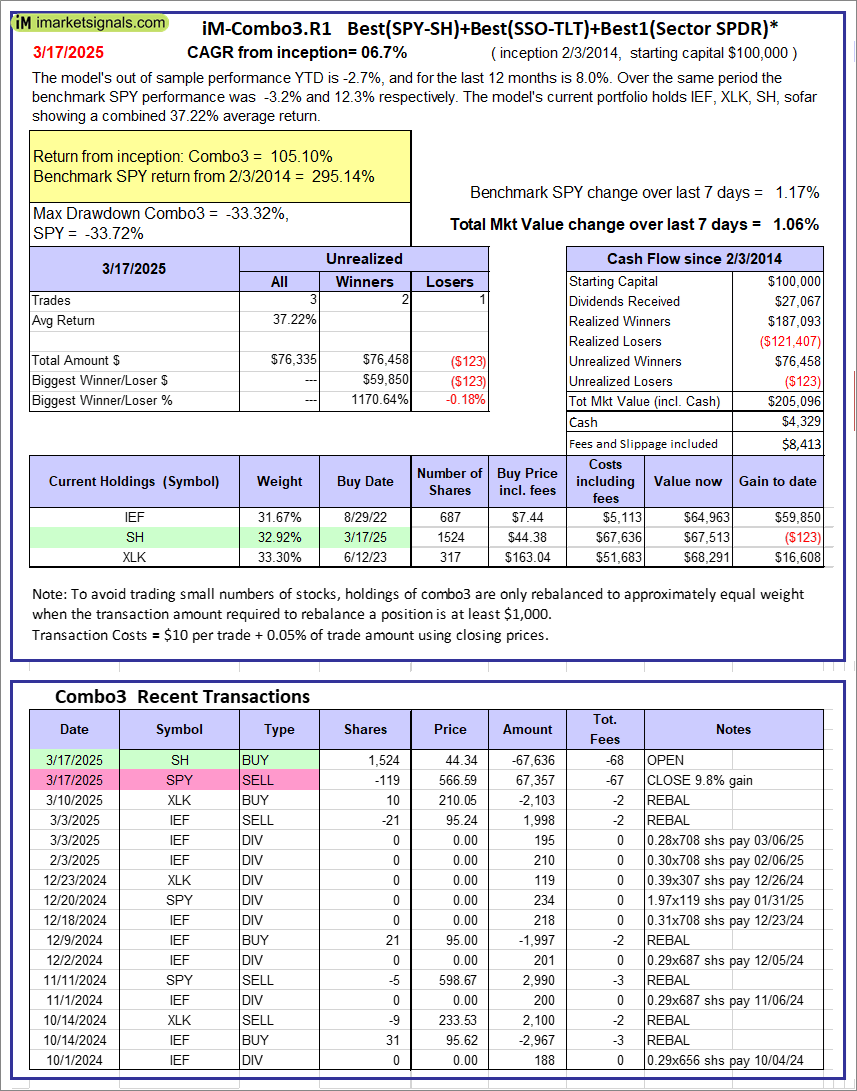 |
iM-Combo3.R1: The model’s out of sample performance YTD is -2.7%, and for the last 12 months is 8.0%. Over the same period the benchmark SPY performance was -3.2% and 12.3% respectively. Over the previous week the market value of iM-Combo3.R1 gained 1.06% at a time when SPY gained 1.17%. A starting capital of $100,000 at inception on 2/3/2014 would have grown to $205,096 which includes $4,329 cash and excludes $8,413 spent on fees and slippage. |
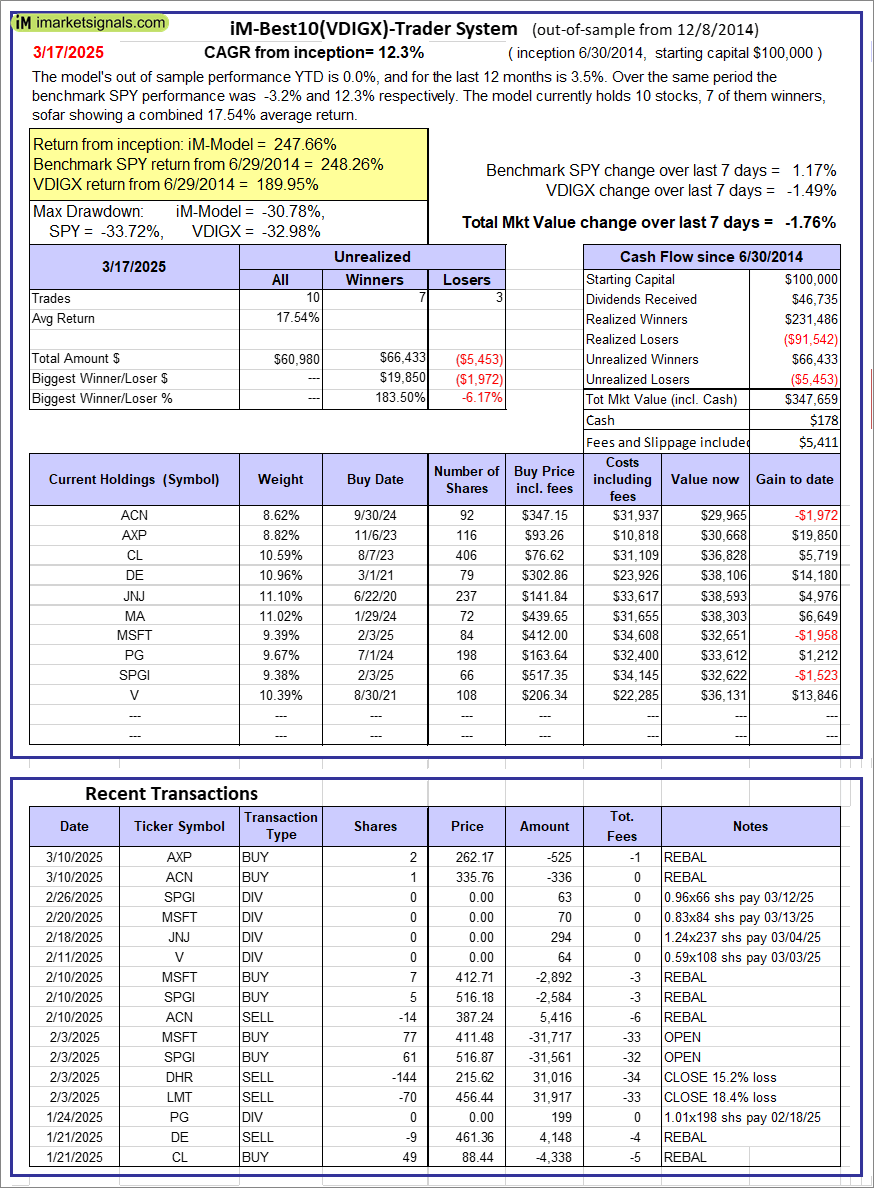 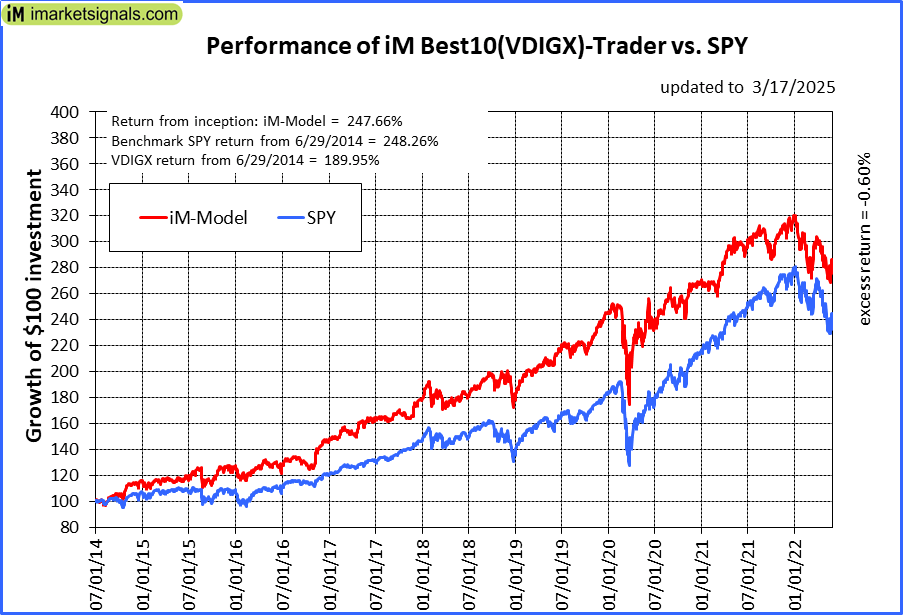 |
iM-Best10(VDIGX)-Trader: The model’s out of sample performance YTD is 0.0%, and for the last 12 months is 3.5%. Over the same period the benchmark SPY performance was -3.2% and 12.3% respectively. Since inception, on 7/1/2014, the model gained 247.66% while the benchmark SPY gained 248.26% and VDIGX gained 189.95% over the same period. Over the previous week the market value of iM-Best10(VDIGX) gained -1.76% at a time when SPY gained 1.17%. A starting capital of $100,000 at inception on 7/1/2014 would have grown to $347,659 which includes $178 cash and excludes $5,411 spent on fees and slippage. |
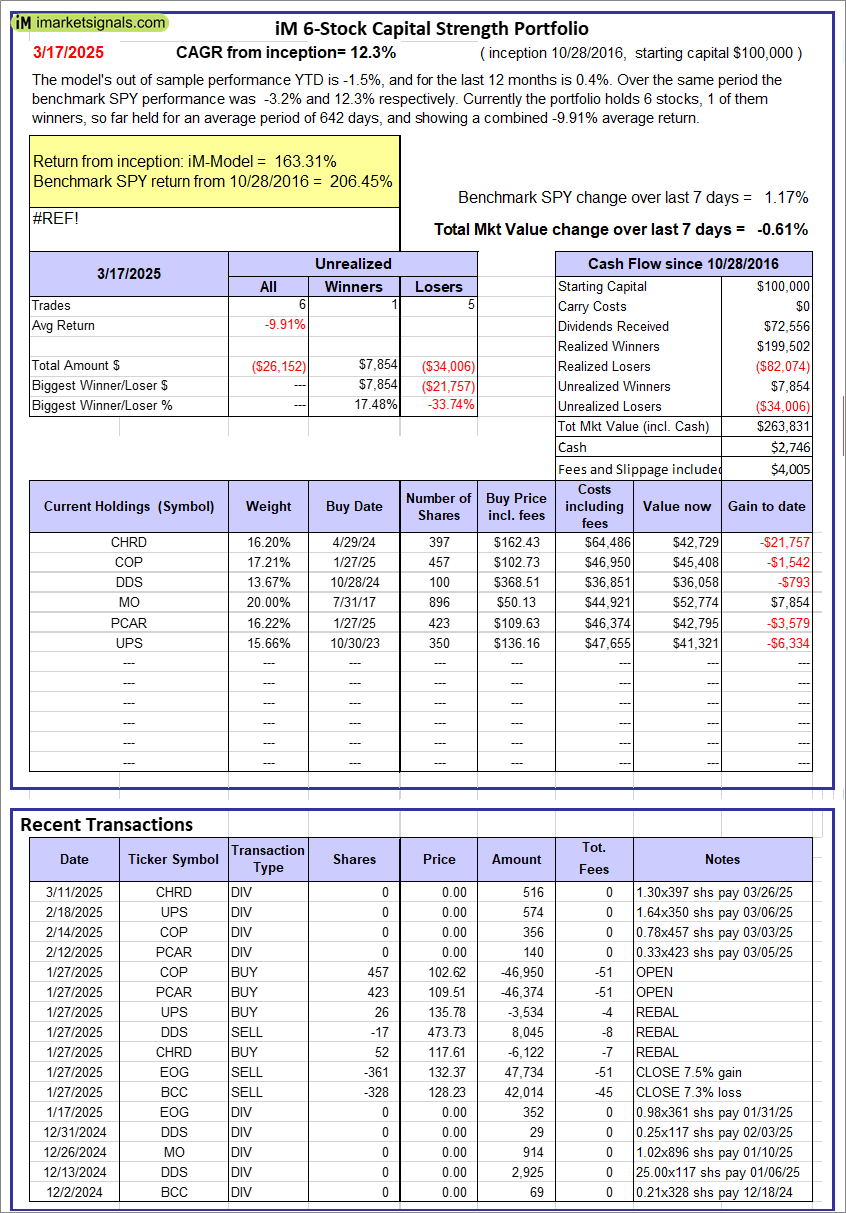 |
iM 6-Stock Capital Strength Portfolio: The model’s out of sample performance YTD is -1.5%, and for the last 12 months is 0.4%. Over the same period the benchmark SPY performance was -3.2% and 12.3% respectively. Over the previous week the market value of the iM 6-Stock Capital Strength Portfolio gained -0.61% at a time when SPY gained 1.17%. A starting capital of $100,000 at inception on 10/28/2016 would have grown to $263,831 which includes $2,746 cash and excludes $4,005 spent on fees and slippage. |
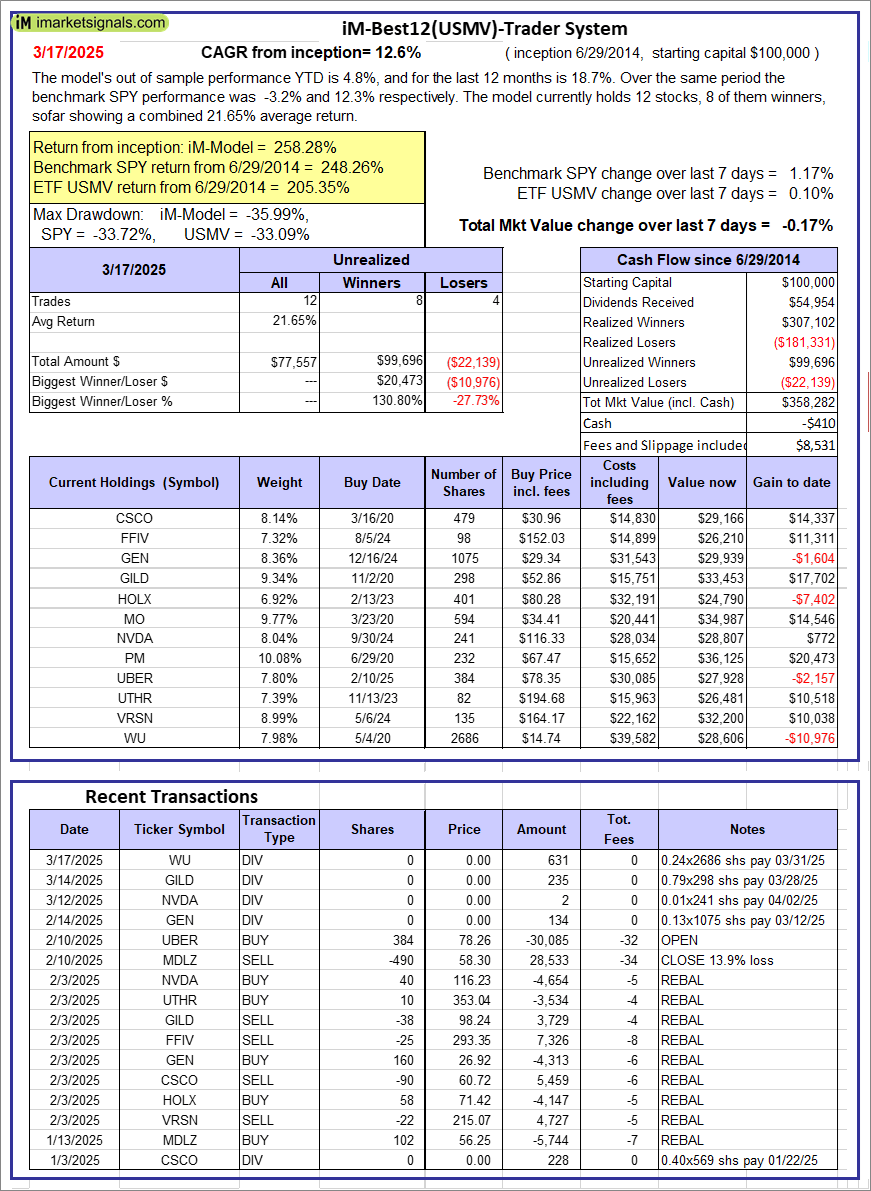 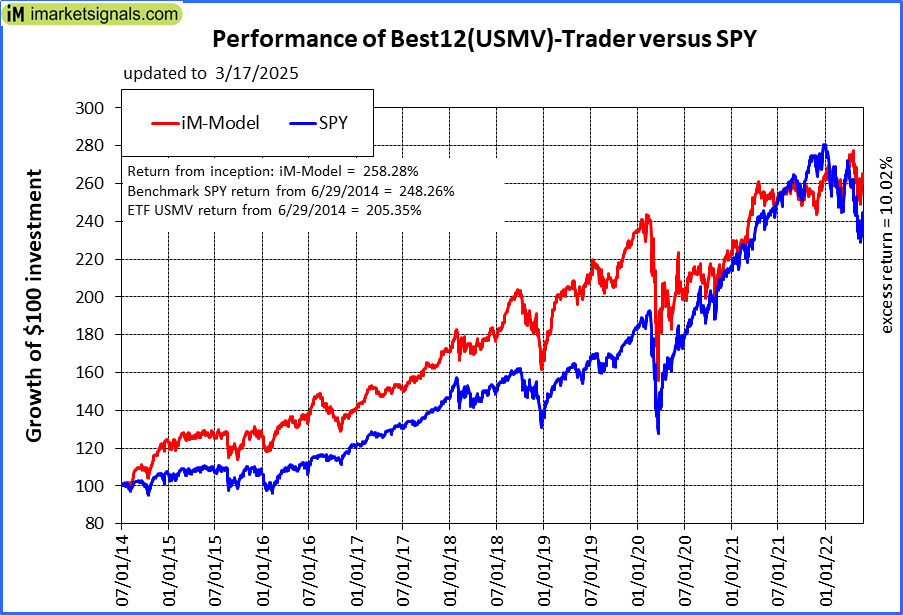 |
iM-Best12(USMV)-Trader: The model’s out of sample performance YTD is 4.8%, and for the last 12 months is 18.7%. Over the same period the benchmark SPY performance was -3.2% and 12.3% respectively. Since inception, on 6/30/2014, the model gained 258.28% while the benchmark SPY gained 248.26% and the ETF USMV gained 205.35% over the same period. Over the previous week the market value of iM-Best12(USMV)-Trader gained -0.17% at a time when SPY gained 1.17%. A starting capital of $100,000 at inception on 6/30/2014 would have grown to $358,282 which includes -$410 cash and excludes $8,531 spent on fees and slippage. |
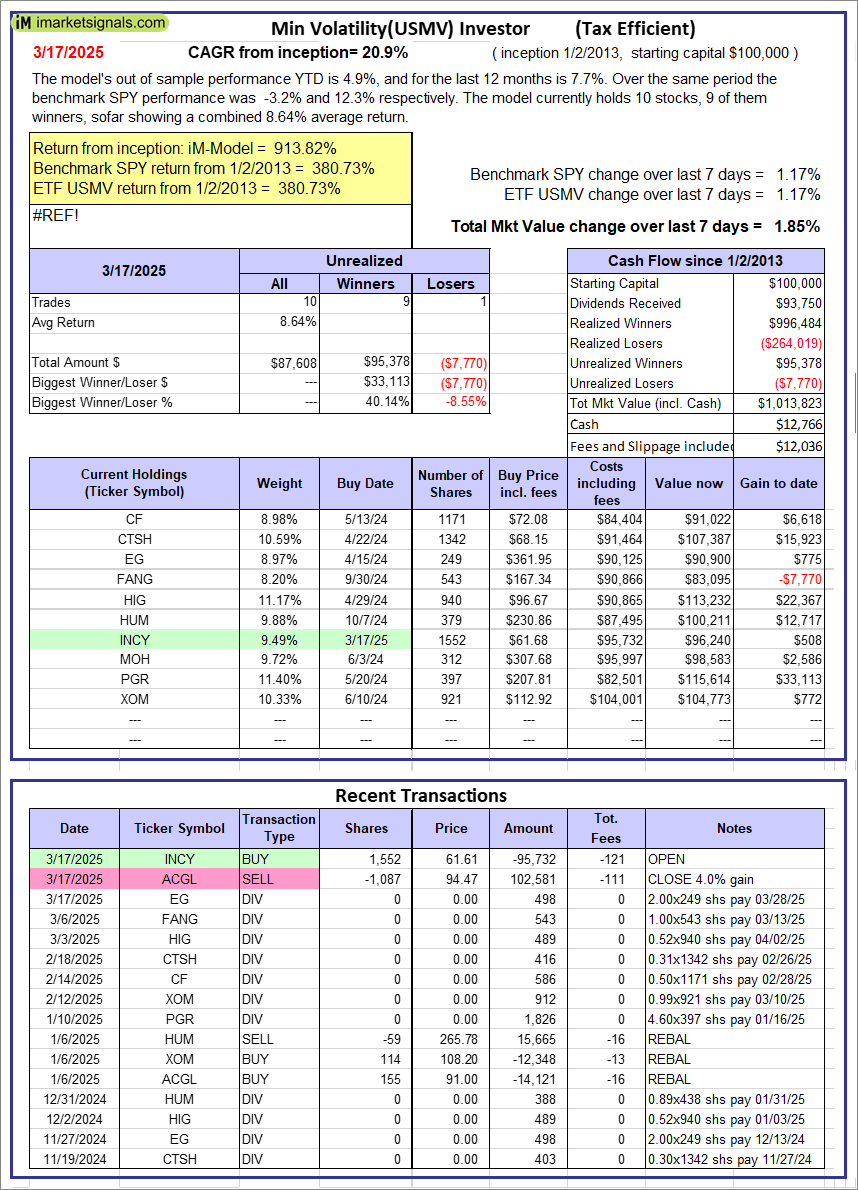 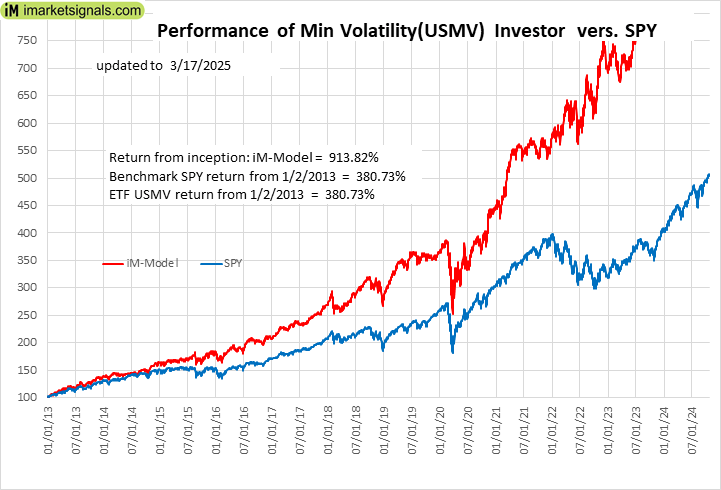 |
iM-Min Volatility(USMV) Investor (Tax Efficient): The model’s out of sample performance YTD is 4.9%, and for the last 12 months is 7.7%. Over the same period the benchmark SPY performance was -3.2% and 12.3% respectively. Since inception, on 1/3/2013, the model gained 913.82% while the benchmark SPY gained 380.73% and the ETF USMV gained 380.73% over the same period. Over the previous week the market value of iM-Best12(USMV)Q1 gained 1.85% at a time when SPY gained 1.17%. A starting capital of $100,000 at inception on 1/3/2013 would have grown to $1,013,823 which includes $12,766 cash and excludes $12,036 spent on fees and slippage. |
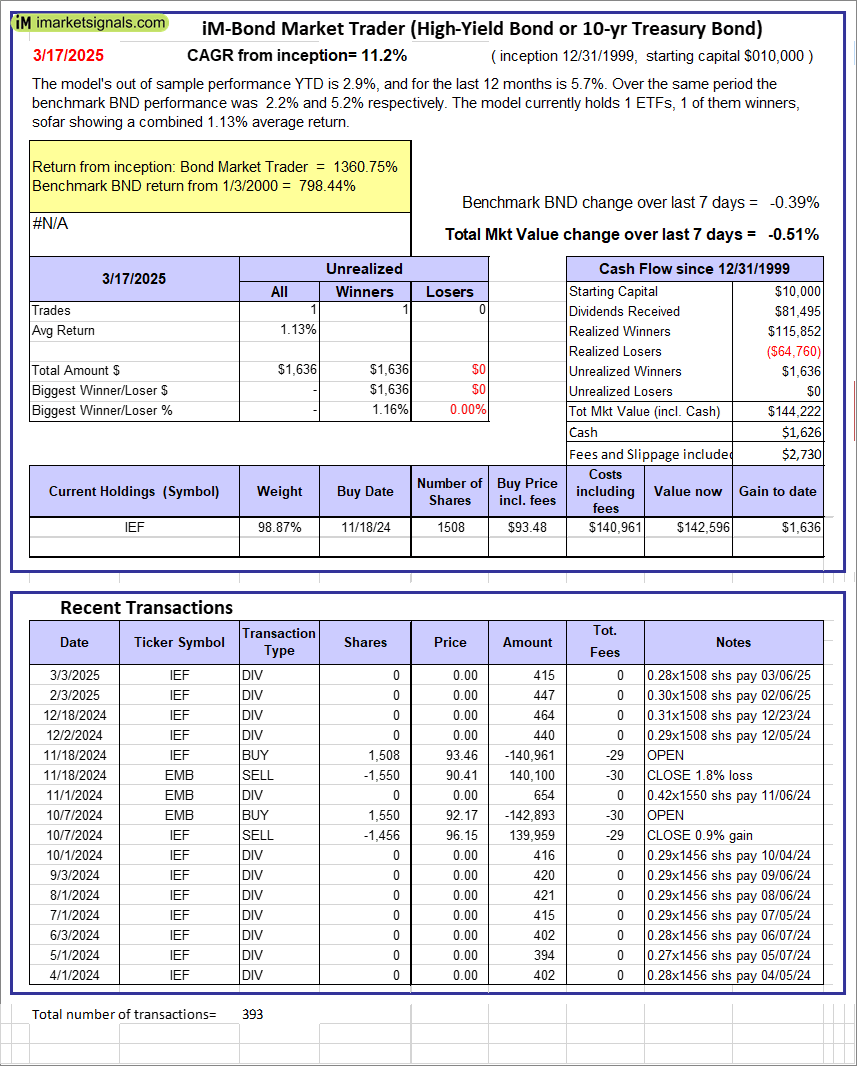 |
iM-Bond Market Trader (High-Yield Bond or 10-yr Treasury Bond): The model’s out of sample performance YTD is 2.9%, and for the last 12 months is 5.7%. Over the same period the benchmark BND performance was 2.2% and 5.2% respectively. Over the previous week the market value of the iM-Bond Market Trader (High-Yield Bond or 10-yr Treasury Bond) gained -0.51% at a time when BND gained -0.39%. A starting capital of $10,000 at inception on 1/3/2000 would have grown to $144,222 which includes $1,626 cash and excludes $2,730 spent on fees and slippage. |
|
|
iM-ModSum/YieldCurve Timer: The model’s out of sample performance YTD is 2.9%, and for the last 12 months is 14.3%. Over the same period the benchmark SPY performance was -3.2% and 12.3% respectively. Over the previous week the market value of iM-PortSum/YieldCurve Timer gained -0.51% at a time when SPY gained 1.17%. A starting capital of $100,000 at inception on 1/1/2016 would have grown to $330,095 which includes $5,281 cash and excludes $1,748 spent on fees and slippage. |
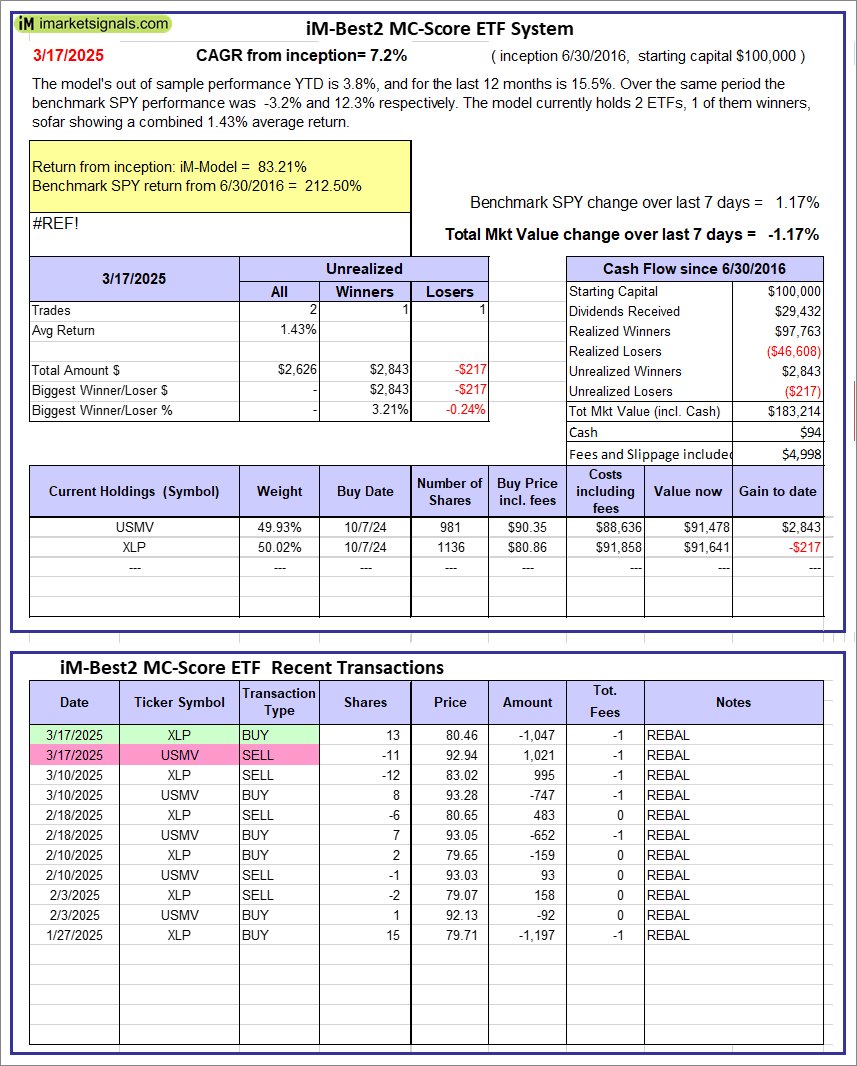 |
iM-Best2 MC-Score ETF System: The model’s out of sample performance YTD is 3.8%, and for the last 12 months is 15.5%. Over the same period the benchmark SPY performance was -3.2% and 12.3% respectively. Over the previous week the market value of the iM-Best2 MC-Score ETF System gained -1.17% at a time when SPY gained 1.17%. A starting capital of $100,000 at inception on 6/30/2016 would have grown to $183,214 which includes $94 cash and excludes $4,998 spent on fees and slippage. |
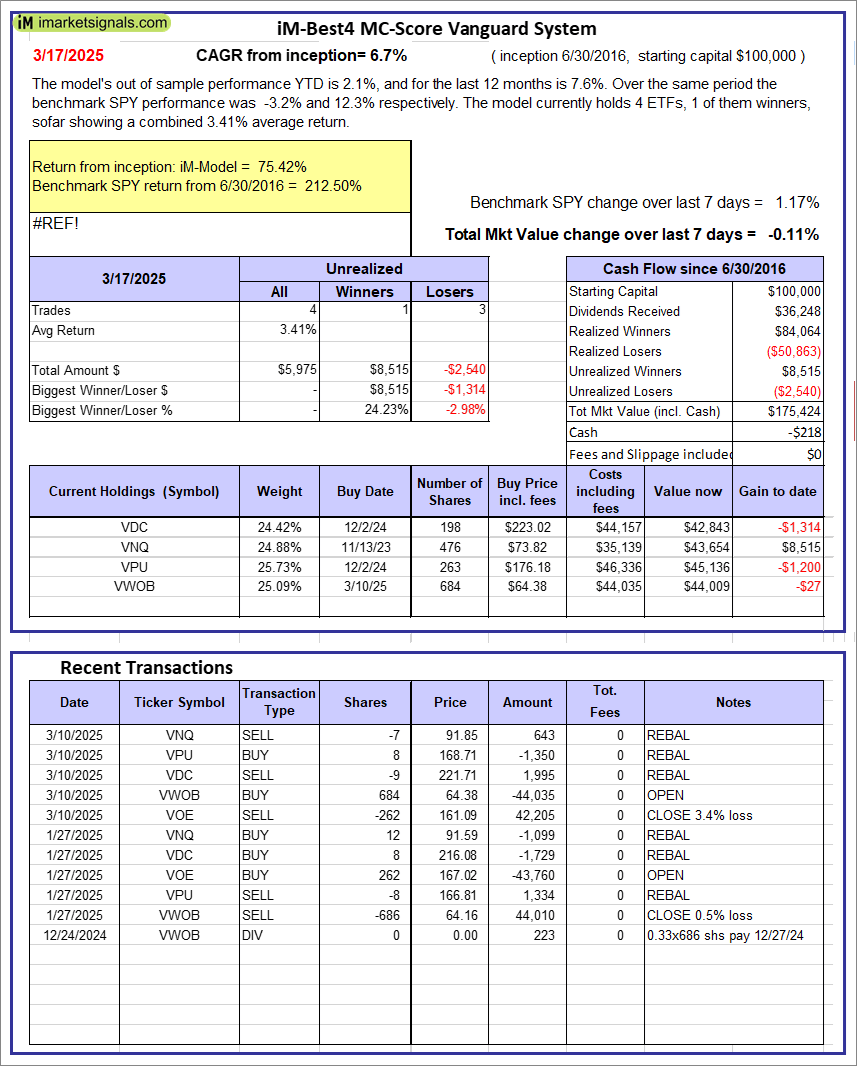 |
iM-Best4 MC-Score Vanguard System: The model’s out of sample performance YTD is 2.1%, and for the last 12 months is 7.6%. Over the same period the benchmark SPY performance was -3.2% and 12.3% respectively. Over the previous week the market value of the iM-Best4 MC-Score Vanguard System gained -0.11% at a time when SPY gained 1.17%. A starting capital of $100,000 at inception on 6/30/2016 would have grown to $175,424 which includes -$218 cash and excludes $00 spent on fees and slippage. |
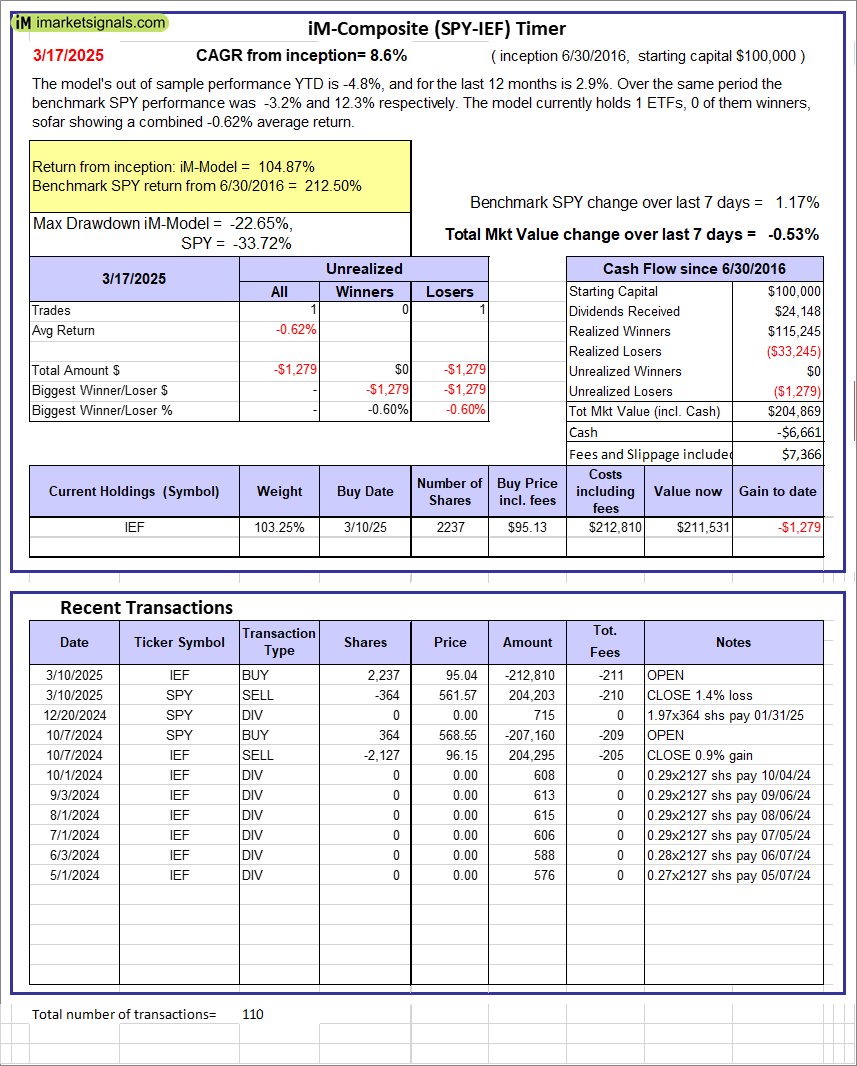 |
iM-Composite (SPY-IEF) Timer: The model’s out of sample performance YTD is -4.8%, and for the last 12 months is 2.9%. Over the same period the benchmark SPY performance was -3.2% and 12.3% respectively. Over the previous week the market value of the iM-Composite (SPY-IEF) Timer gained -0.53% at a time when SPY gained 1.17%. A starting capital of $100,000 at inception on 6/30/2016 would have grown to $204,869 which includes -$6,661 cash and excludes $7,366 spent on fees and slippage. |
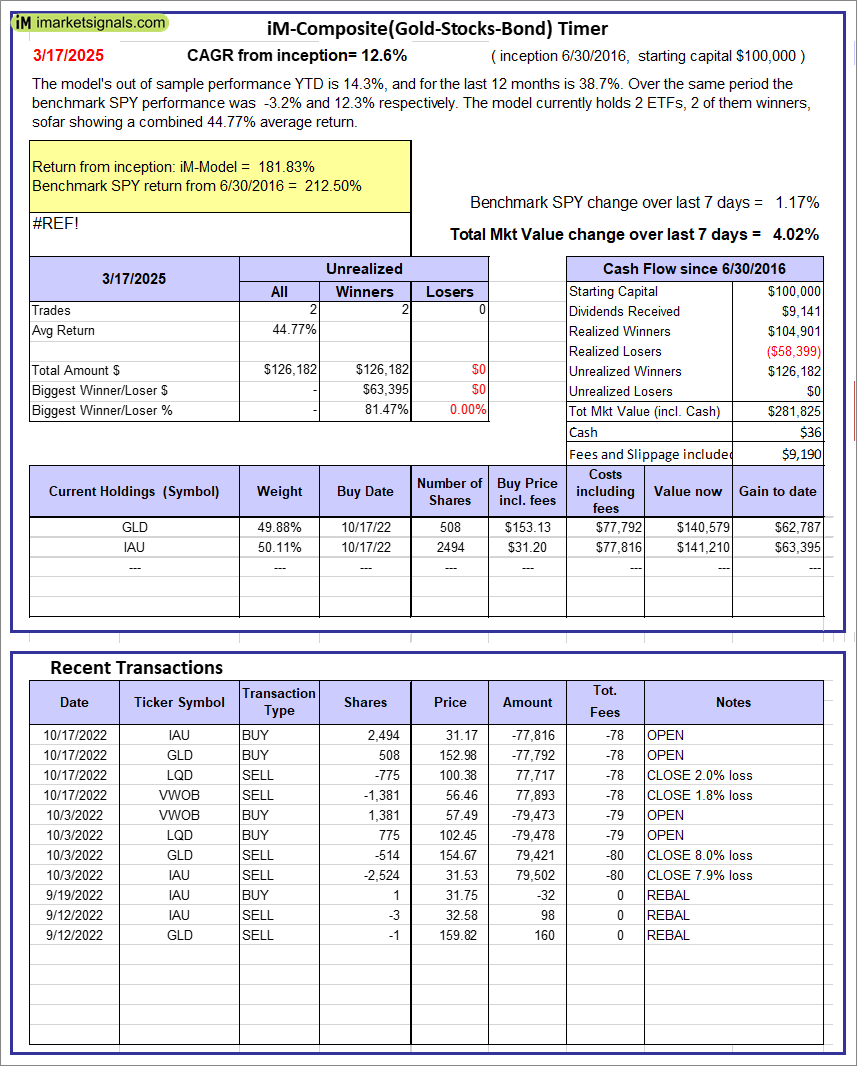 |
iM-Composite(Gold-Stocks-Bond) Timer: The model’s out of sample performance YTD is 14.3%, and for the last 12 months is 38.7%. Over the same period the benchmark SPY performance was -3.2% and 12.3% respectively. Over the previous week the market value of the iM-Composite(Gold-Stocks-Bond) Timer gained 4.02% at a time when SPY gained 1.17%. A starting capital of $100,000 at inception on 6/30/2016 would have grown to $281,825 which includes $36 cash and excludes $9,190 spent on fees and slippage. |
iM-Best Reports – 3/18/2025
Posted in pmp SPY-SH
Leave a Reply
You must be logged in to post a comment.