
  |
Out of sample performance summary of our models for the past 1, 2, 4 and 13 week periods. The active active return indicates how the models over- or underperformed the benchmark ETF SPY. Also the YTD, and the 1-, 3-, 5- and 10-year annualized returns are shown in the second table |
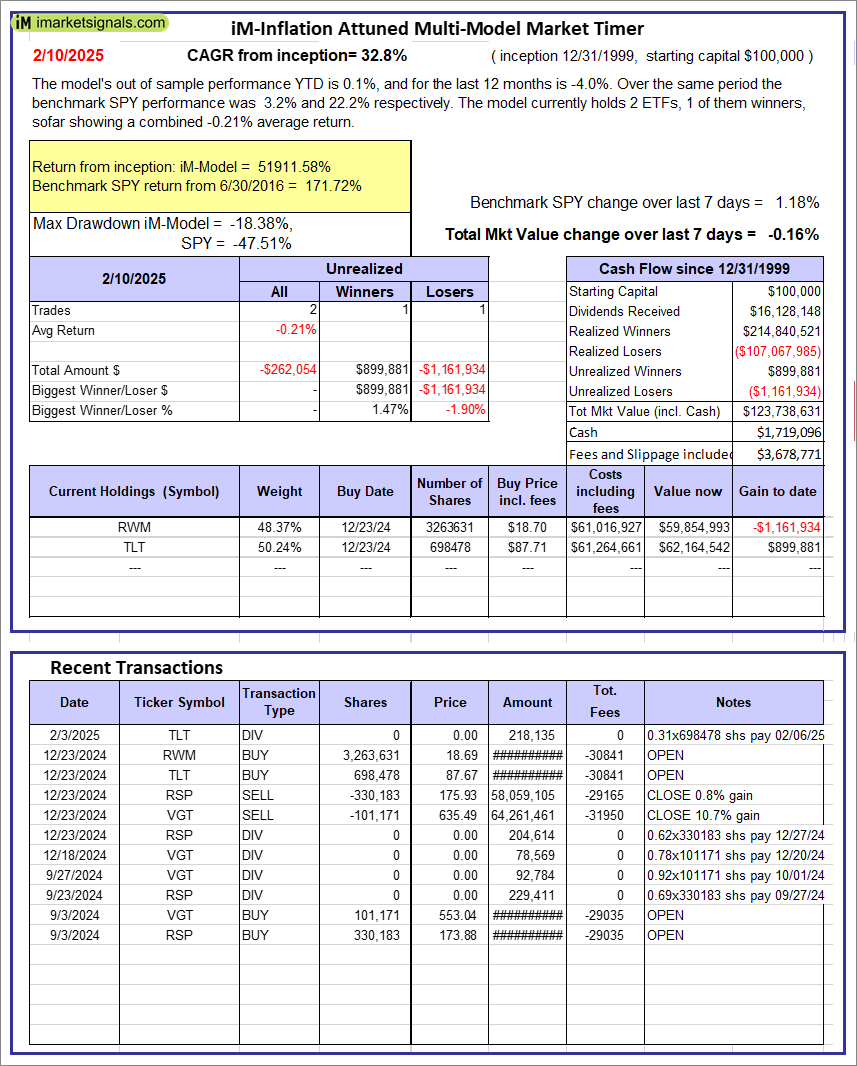 |
iM-Inflation Attuned Multi-Model Market Timer: The model’s out of sample performance YTD is 0.1%, and for the last 12 months is -4.0%. Over the same period the benchmark SPY performance was 3.2% and 22.2% respectively. Over the previous week the market value of the iM-Inflation Attuned Multi-Model Market Timer gained -0.16% at a time when SPY gained 1.18%. A starting capital of $100,000 at inception on 3/24/2017 would have grown to $123,738,631 which includes $1,719,096 cash and excludes $3,678,771 spent on fees and slippage. |
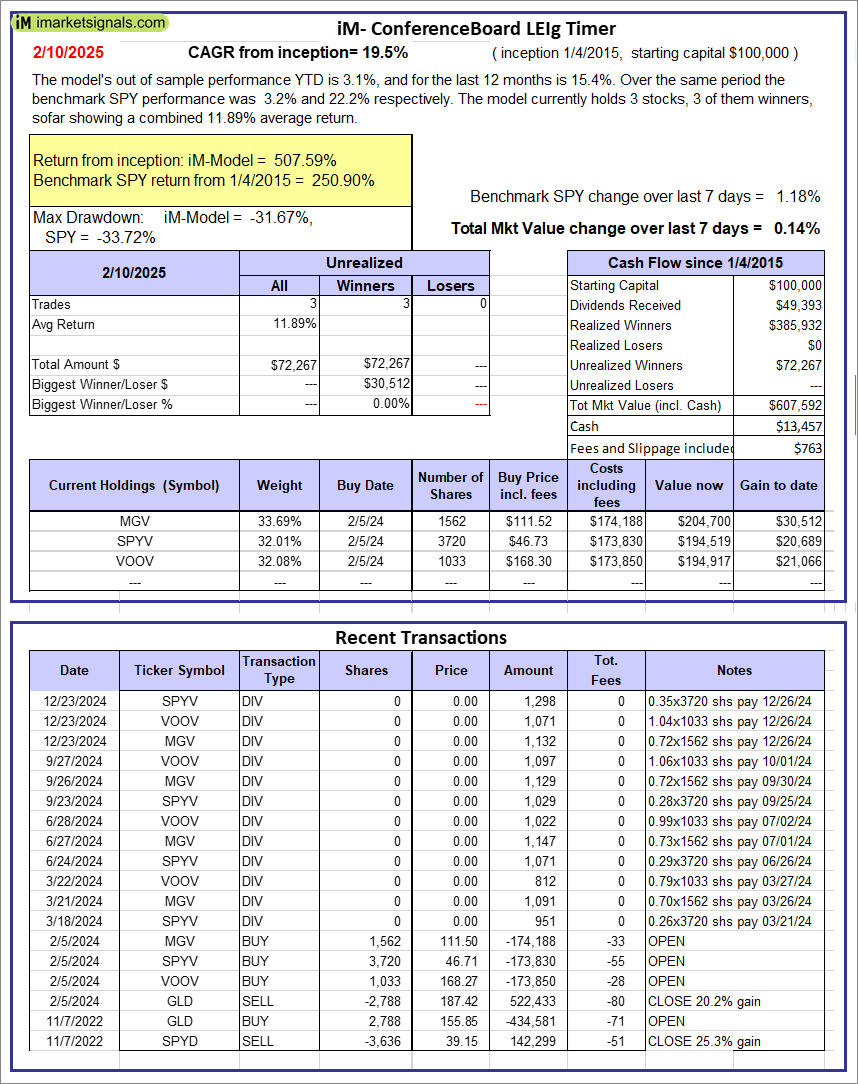 |
iM-Conference Board LEIg Timer: The model’s performance YTD is 14.3%, and for the last 12 months is 7.3%. Over the same period the benchmark SPY performance was 20.1% and 9.4% respectively. Over the previous week the market value of the iM-Conference Board LEIg Timer gained 0.14% at a time when SPY gained 1.18%. A starting capital of $100,000 at inception on 4/5/2017 would have grown to $607,592 which includes $13,457 cash and excludes $763 spent on fees and slippage. |
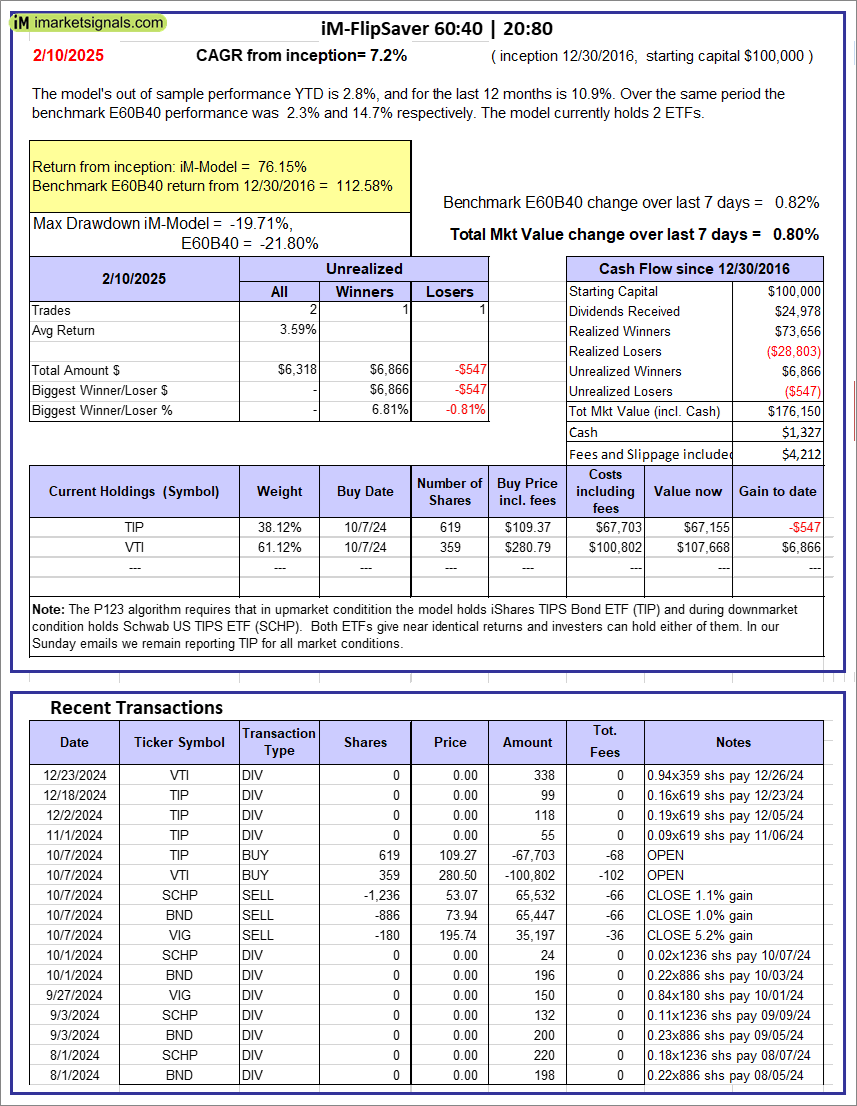 |
iM-FlipSaver 60:40 | 20:80 – 2017: The model’s out of sample performance YTD is 2.8%, and for the last 12 months is 10.9%. Over the same period the benchmark E60B40 performance was 2.3% and 14.7% respectively. Over the previous week the market value of iM-FlipSaver 80:20 | 20:80 gained 0.80% at a time when SPY gained 0.82%. A starting capital of $100,000 at inception on 7/16/2015 would have grown to $176,150 which includes $1,327 cash and excludes $4,212 spent on fees and slippage. |
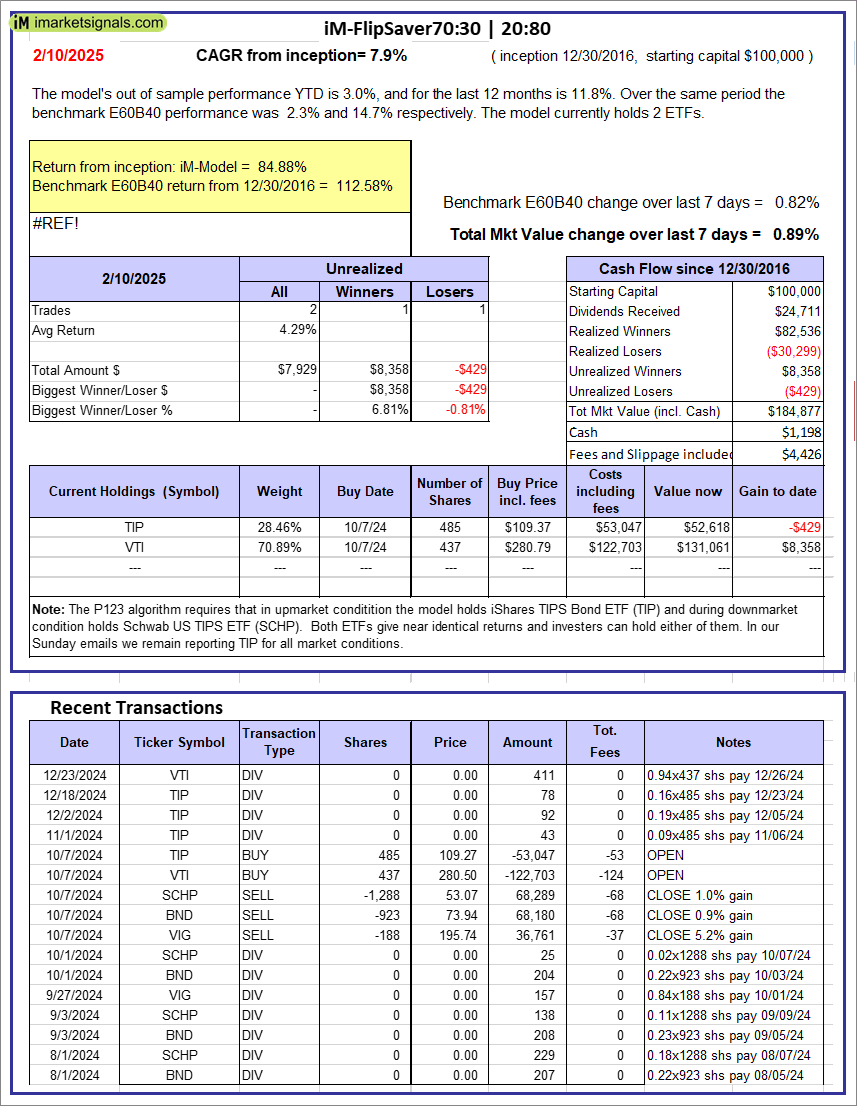 |
iM-FlipSaver 70:30 | 20:80 – 2017: The model’s out of sample performance YTD is 3.0%, and for the last 12 months is 11.8%. Over the same period the benchmark E60B40 performance was 2.3% and 14.7% respectively. Over the previous week the market value of iM-FlipSaver 70:30 | 20:80 gained 0.89% at a time when SPY gained 0.82%. A starting capital of $100,000 at inception on 7/15/2015 would have grown to $184,877 which includes $1,198 cash and excludes $4,426 spent on fees and slippage. |
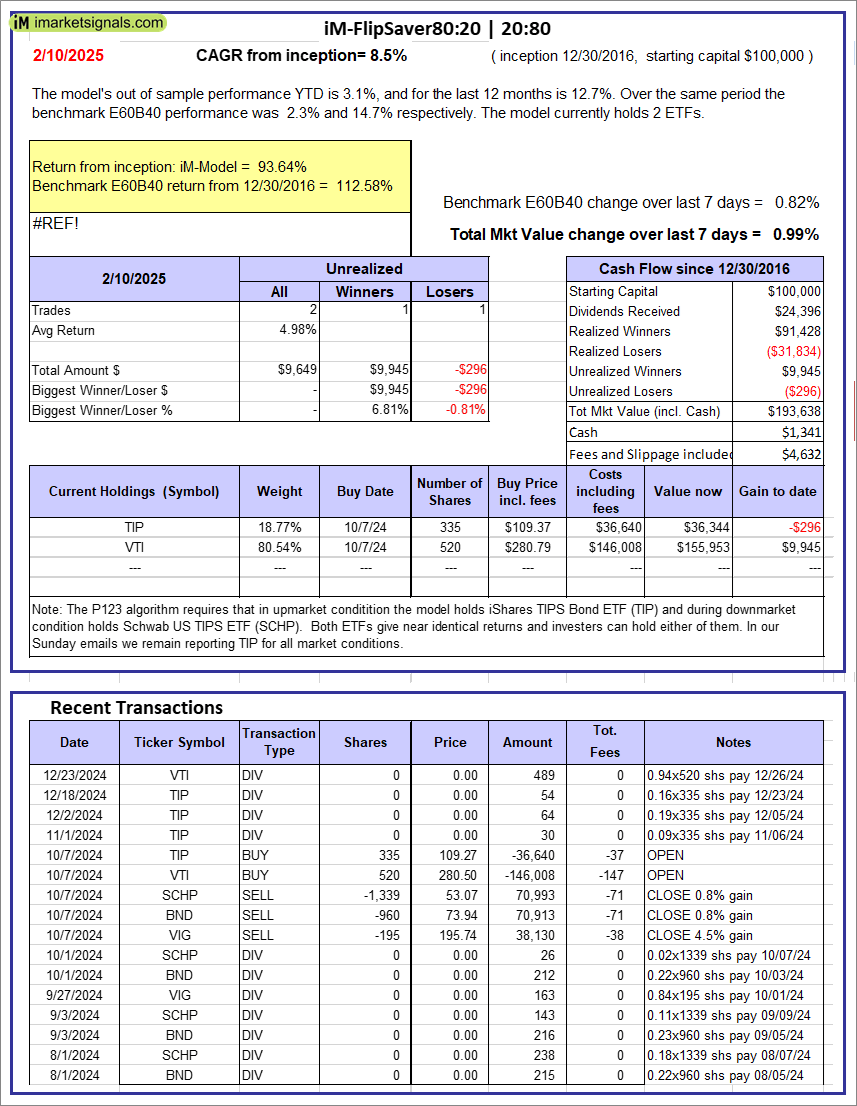 |
iM-FlipSaver 80:20 | 20:80 – 2017: The model’s out of sample performance YTD is 3.1%, and for the last 12 months is 12.7%. Over the same period the benchmark E60B40 performance was 2.3% and 14.7% respectively. Over the previous week the market value of iM-FlipSaver 80:20 | 20:80 gained 0.99% at a time when SPY gained 0.82%. A starting capital of $100,000 at inception on 1/2/2017 would have grown to $193,638 which includes $1,341 cash and excludes $4,632 spent on fees and slippage. |
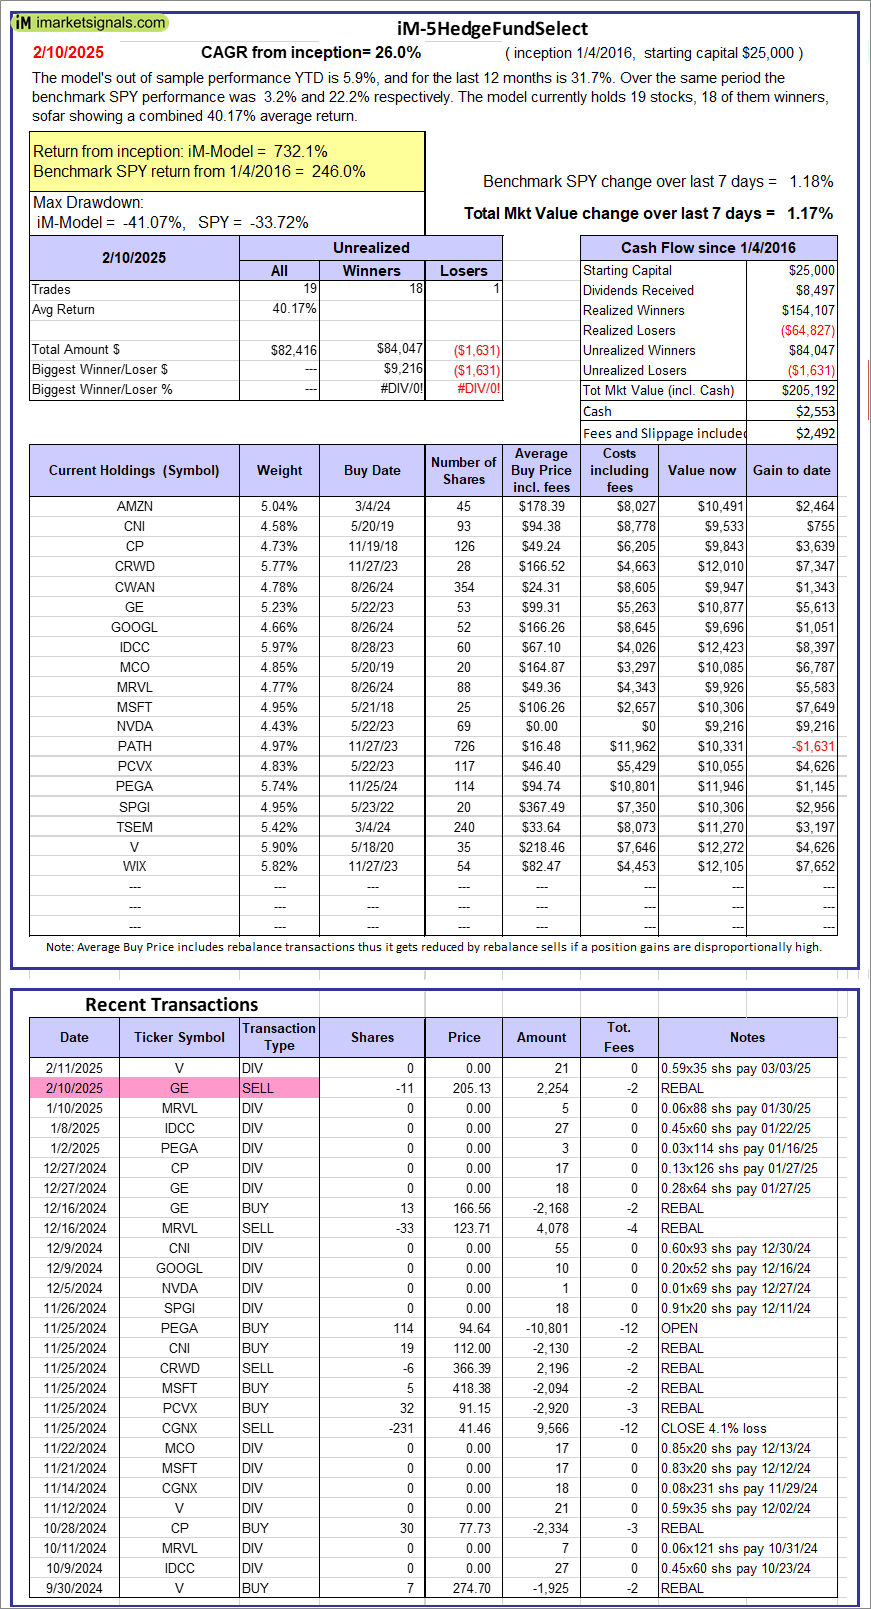  |
iM-5HedgeFundSelect: Since inception, on 1/5/2016, the model gained 732.07% while the benchmark SPY gained 245.99% over the same period. Over the previous week the market value of iM-5HedgeFundSelect gained 1.17% at a time when SPY gained 1.18%. A starting capital of $25,000 at inception on 1/5/2016 would have grown to $205,192 which includes $2,553 cash and excludes $2,492 spent on fees and slippage. |
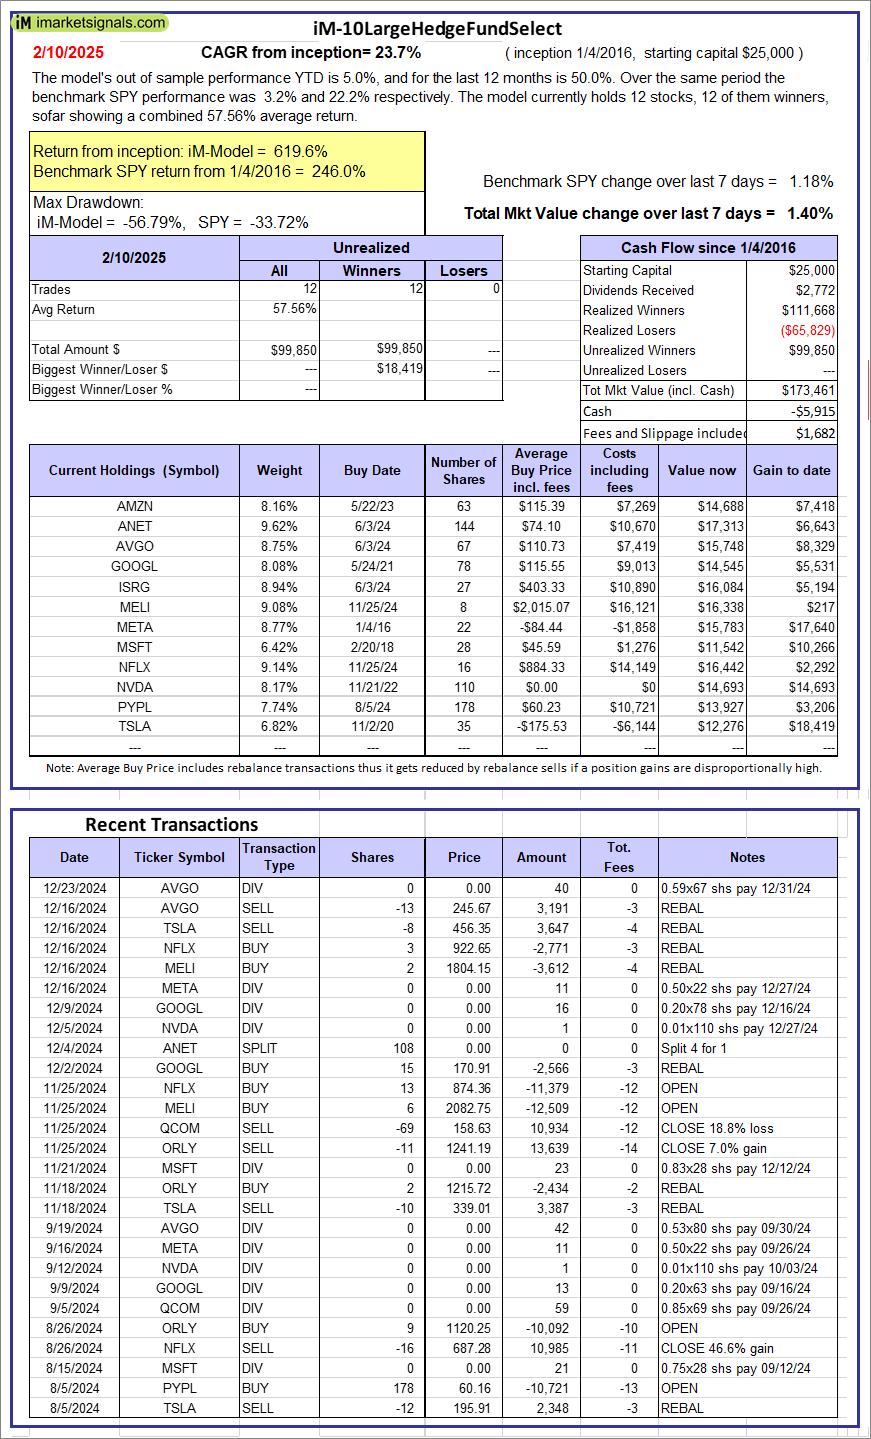  |
iM-10LargeHedgeFundSelect: Since inception, on 1/5/2016, the model gained 619.64% while the benchmark SPY gained 245.99% over the same period. Over the previous week the market value of iM-10LargeHedgeFundSelect gained 1.40% at a time when SPY gained 1.18%. A starting capital of $25,000 at inception on 1/5/2016 would have grown to $173,461 which includes -$5,915 cash and excludes $1,682 spent on fees and slippage. |
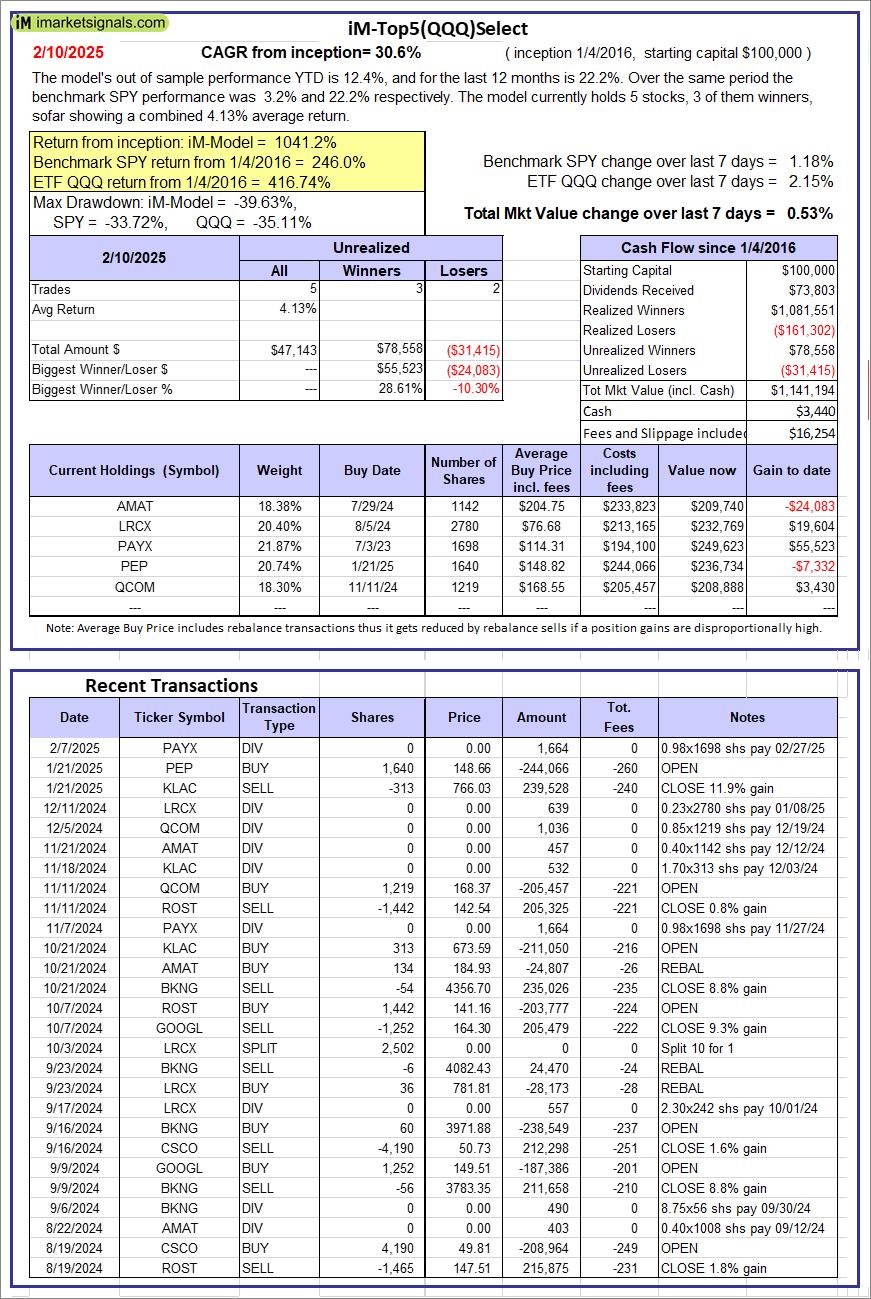  |
iM-Top5(QQQ)Select: Since inception, on 1/5/2016, the model gained 1041.19% while the benchmark SPY gained 245.99% over the same period. Over the previous week the market value of iM-Top5(QQQ)Select gained 0.53% at a time when SPY gained 1.18%. A starting capital of $100,000 at inception on 1/5/2016 would have grown to $1,141,194 which includes $3,440 cash and excludes $16,254 spent on fees and slippage. |
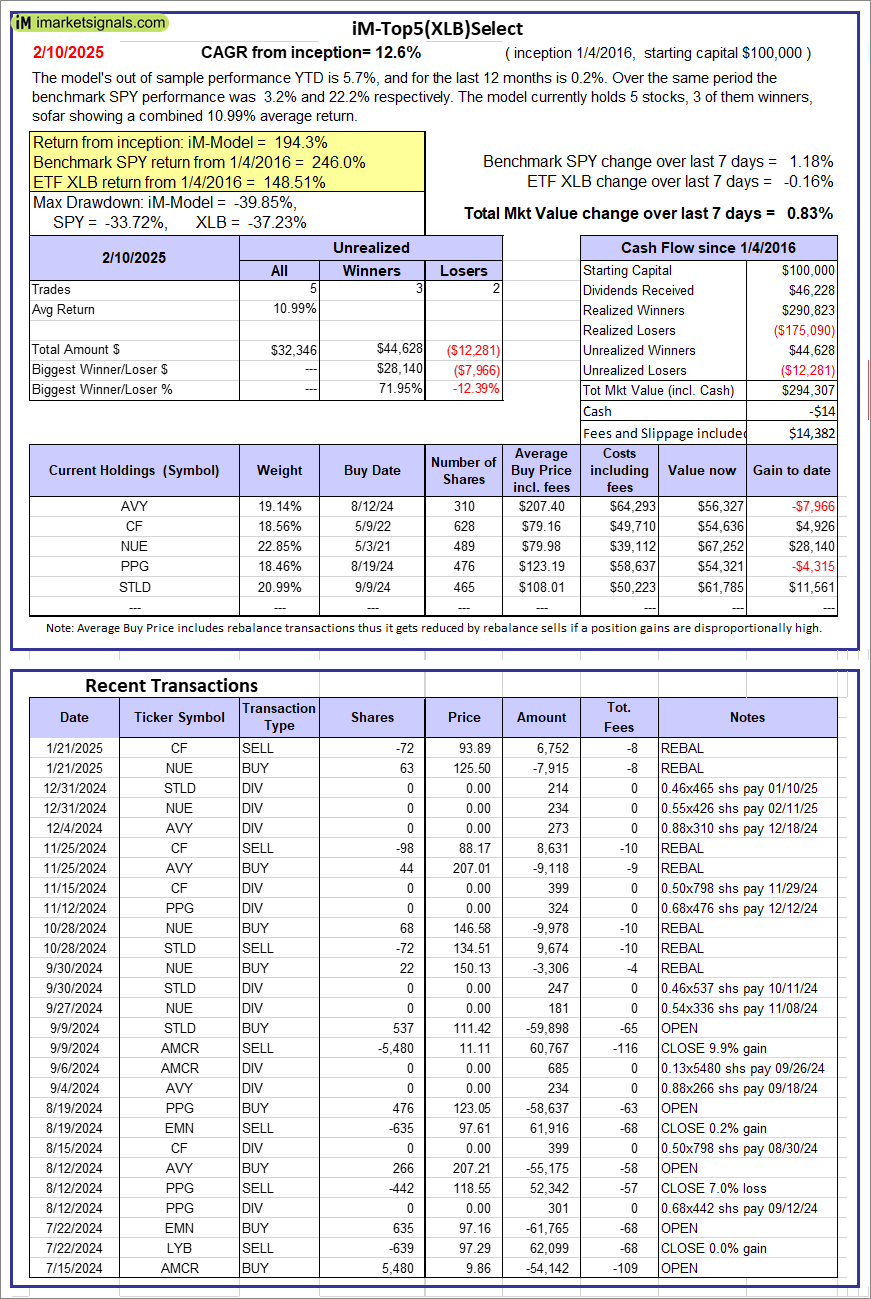  |
iM-Top5(XLB)Select: Since inception, on 1/5/2016, the model gained 194.31% while the benchmark SPY gained 245.99% over the same period. Over the previous week the market value of iM-Top5(XLB)Select gained 0.83% at a time when SPY gained 1.18%. A starting capital of $100,000 at inception on 1/5/2016 would have grown to $294,307 which includes -$14 cash and excludes $14,382 spent on fees and slippage. |
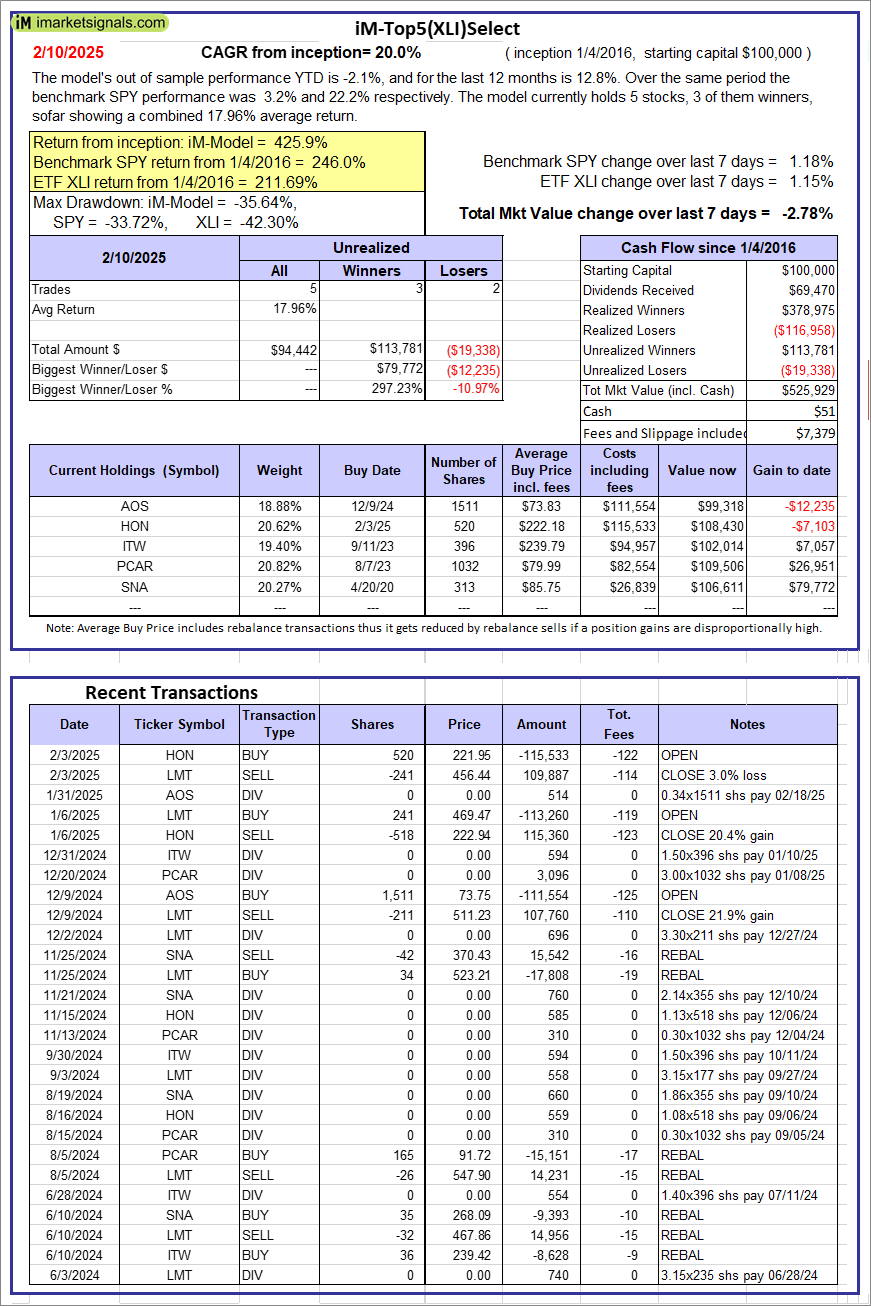  |
iM-Top5(XLI)Select: Since inception, on 1/5/2016, the model gained 425.93% while the benchmark SPY gained 245.99% over the same period. Over the previous week the market value of iM-Top5(XLI)Select gained -2.78% at a time when SPY gained 1.18%. A starting capital of $100,000 at inception on 1/5/2016 would have grown to $525,929 which includes $51 cash and excludes $7,379 spent on fees and slippage. |
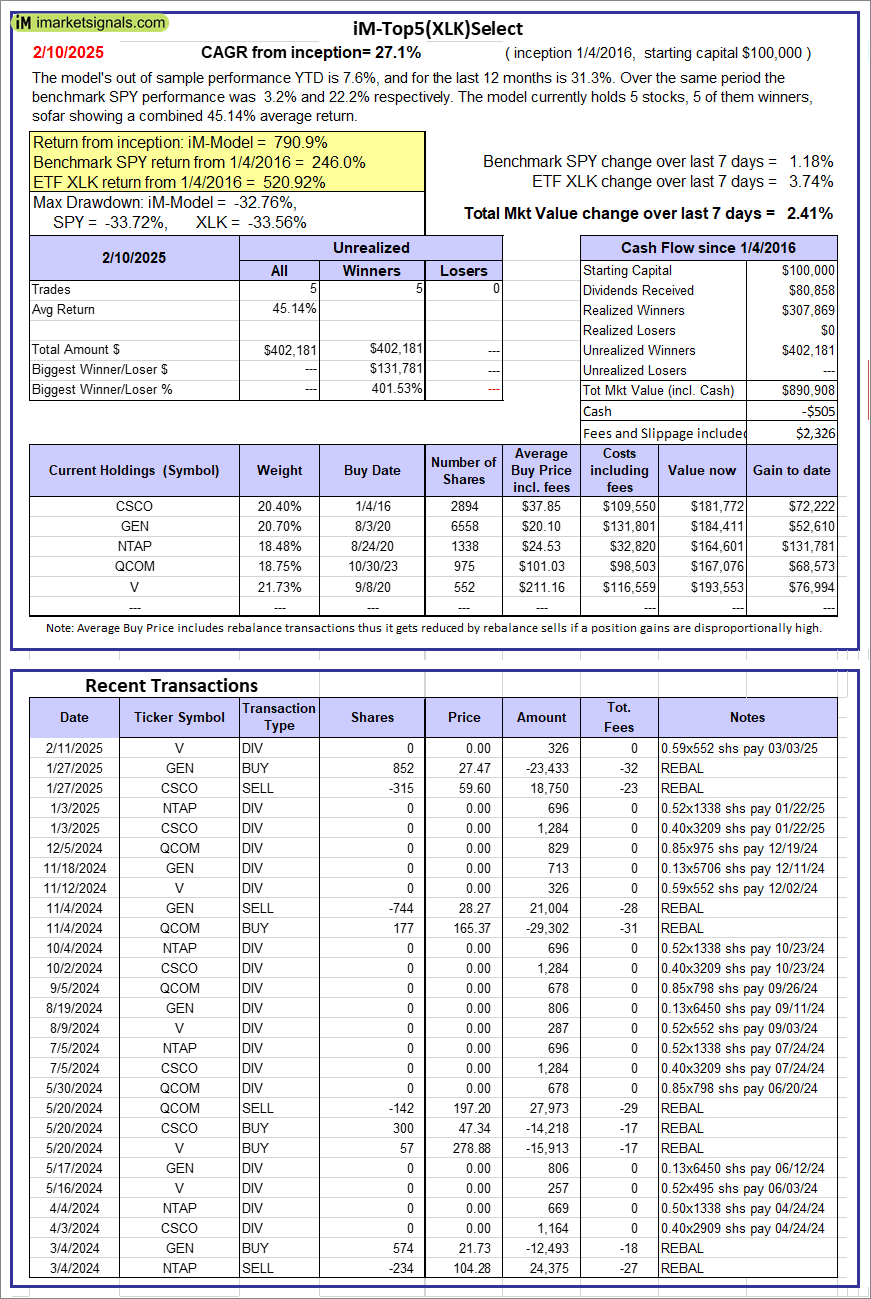  |
iM-Top5(XLK)Select: Since inception, on 1/5/2016, the model gained 790.91% while the benchmark SPY gained 245.99% over the same period. Over the previous week the market value of iM-Top5(XLK)Select gained 2.41% at a time when SPY gained 1.18%. A starting capital of $100,000 at inception on 1/5/2016 would have grown to $890,908 which includes -$505 cash and excludes $2,326 spent on fees and slippage. |
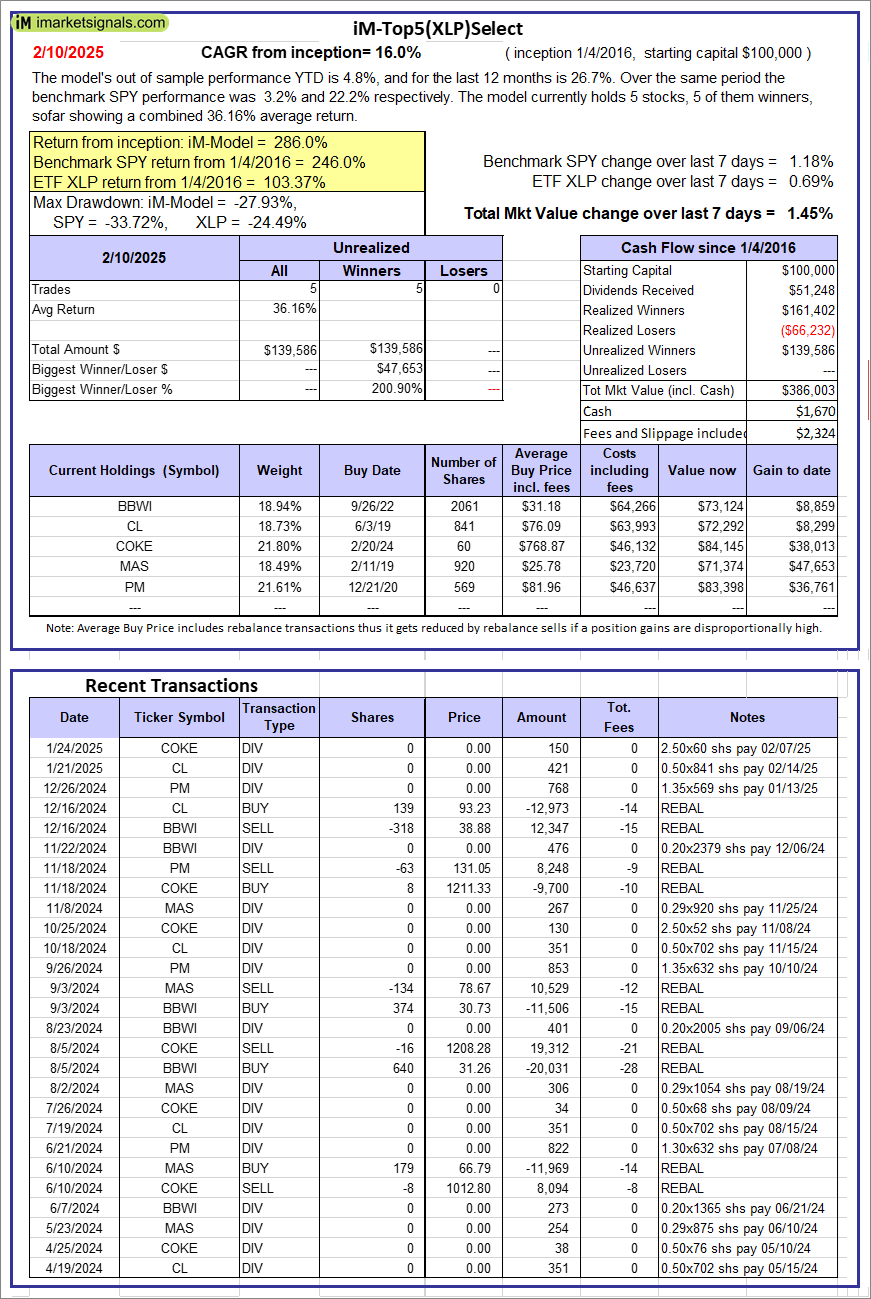  |
iM-Top5(XLP)Select: Since inception, on 1/5/2016, the model gained 286.00% while the benchmark SPY gained 245.99% over the same period. Over the previous week the market value of iM-Top5(XLP)Select gained 1.45% at a time when SPY gained 1.18%. A starting capital of $100,000 at inception on 1/5/2016 would have grown to $386,003 which includes $1,670 cash and excludes $2,324 spent on fees and slippage. |
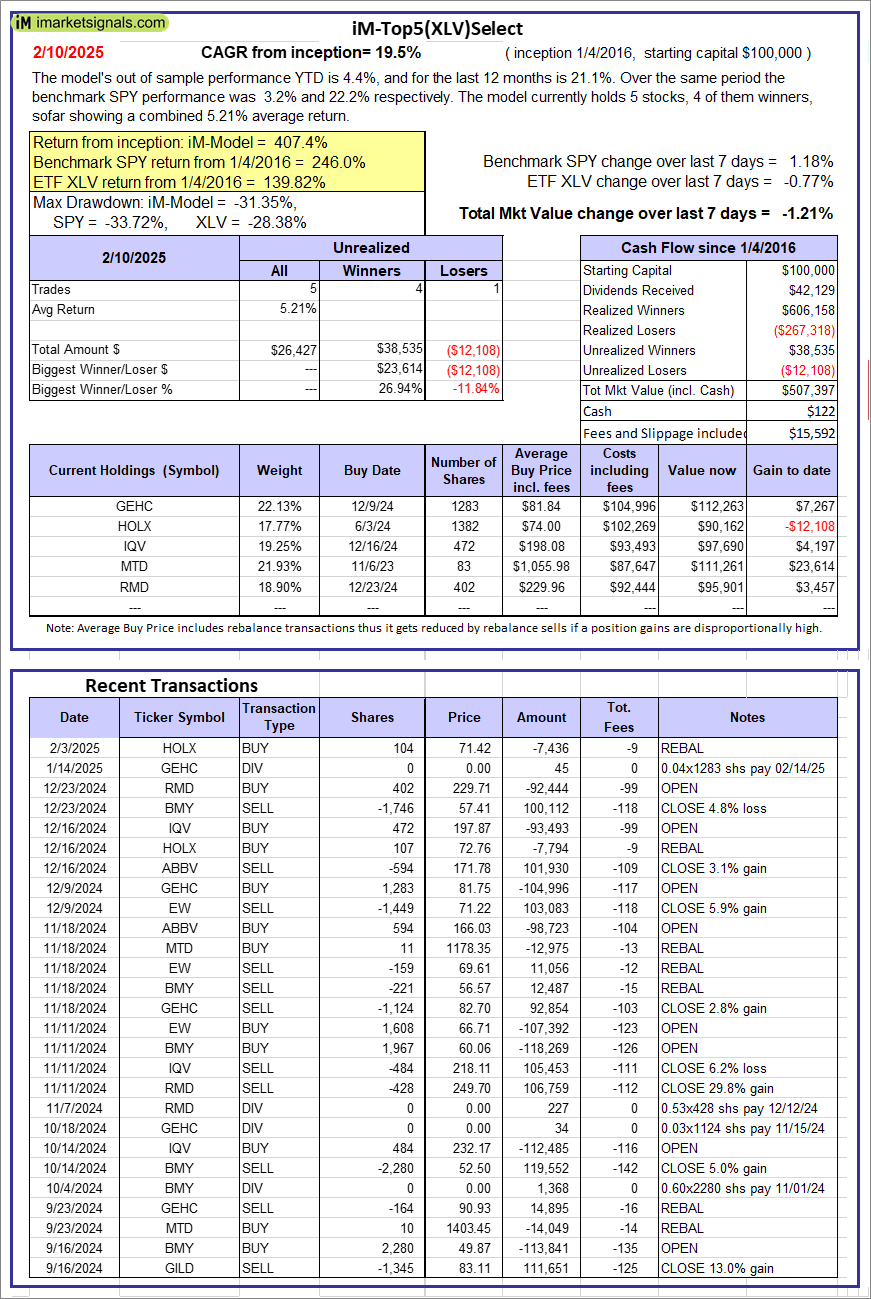  |
iM-Top5(XLV)Select: Since inception, on 1/5/2016, the model gained 407.40% while the benchmark SPY gained 245.99% over the same period. Over the previous week the market value of iM-Top5(XLV)Select gained -1.21% at a time when SPY gained 1.18%. A starting capital of $100,000 at inception on 1/5/2016 would have grown to $507,397 which includes $122 cash and excludes $15,592 spent on fees and slippage. |
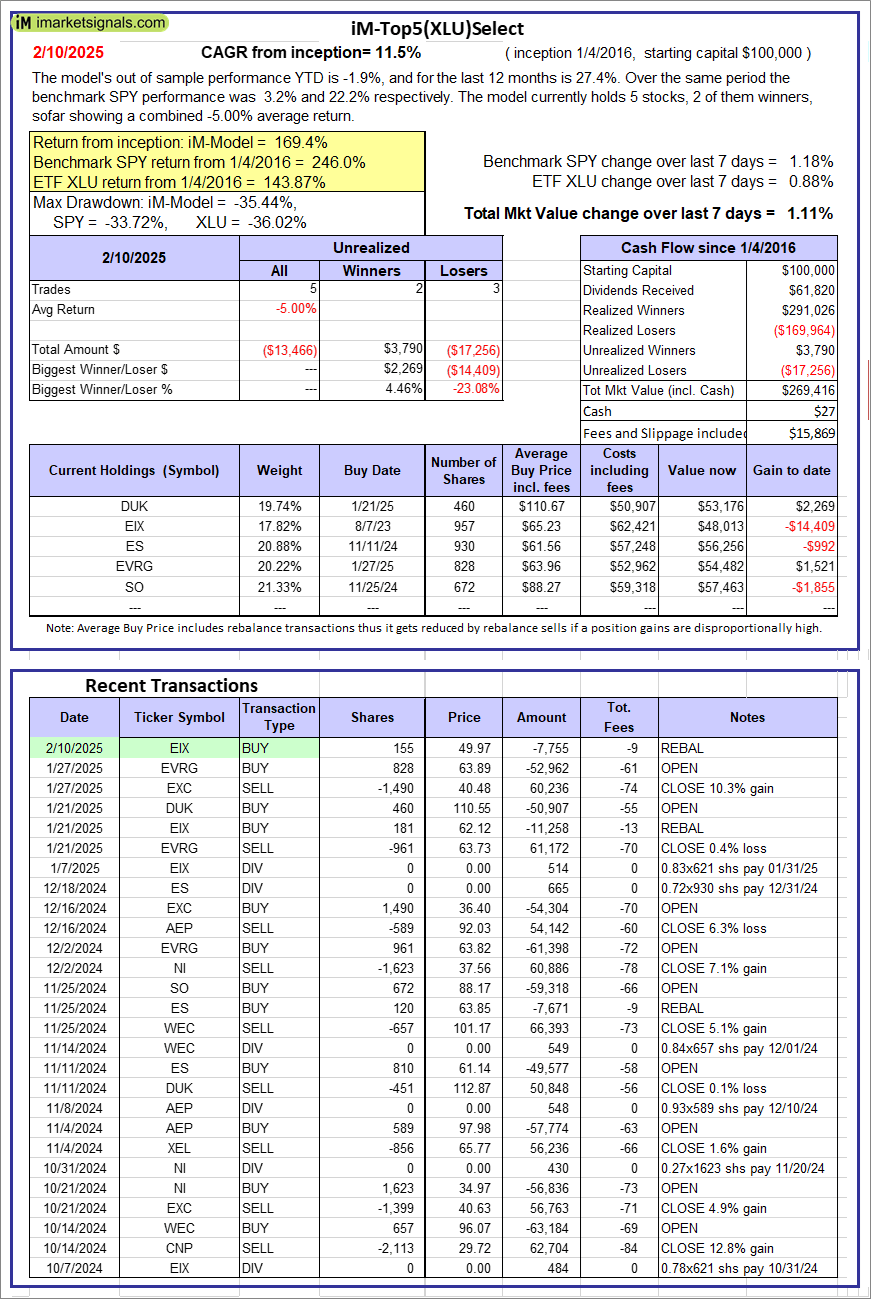  |
iM-Top5(XLU)Select: Since inception, on 1/5/2016, the model gained 169.42% while the benchmark SPY gained 245.99% over the same period. Over the previous week the market value of iM-Top5(XLU)Select gained 1.11% at a time when SPY gained 1.18%. A starting capital of $100,000 at inception on 1/5/2016 would have grown to $269,416 which includes $27 cash and excludes $15,869 spent on fees and slippage. |
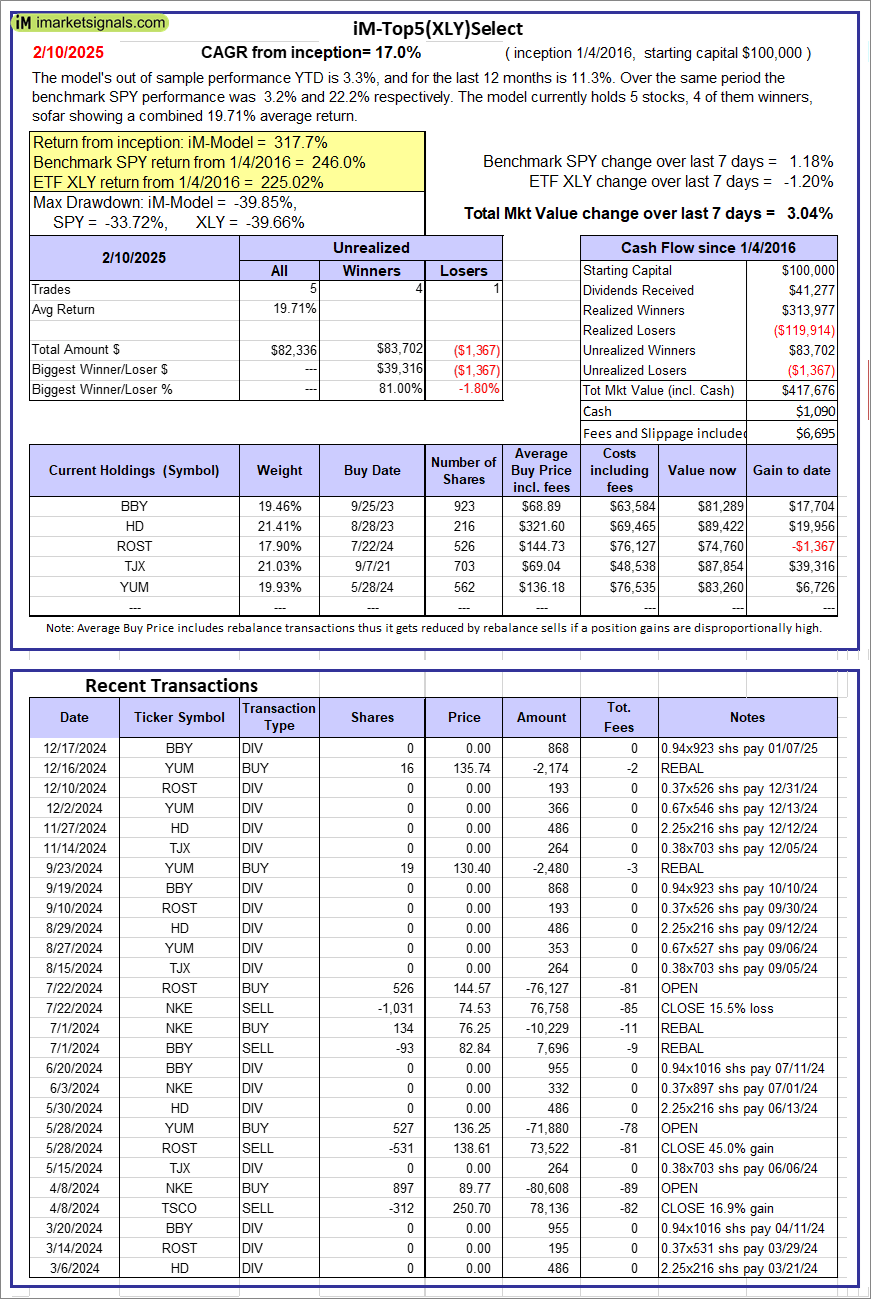  |
iM-Top5(XLY)Select: Since inception, on 1/5/2016, the model gained 317.68% while the benchmark SPY gained 245.99% over the same period. Over the previous week the market value of iM-Top5(XLY)Select gained 3.04% at a time when SPY gained 1.18%. A starting capital of $100,000 at inception on 1/5/2016 would have grown to $417,676 which includes $1,090 cash and excludes $6,695 spent on fees and slippage. |
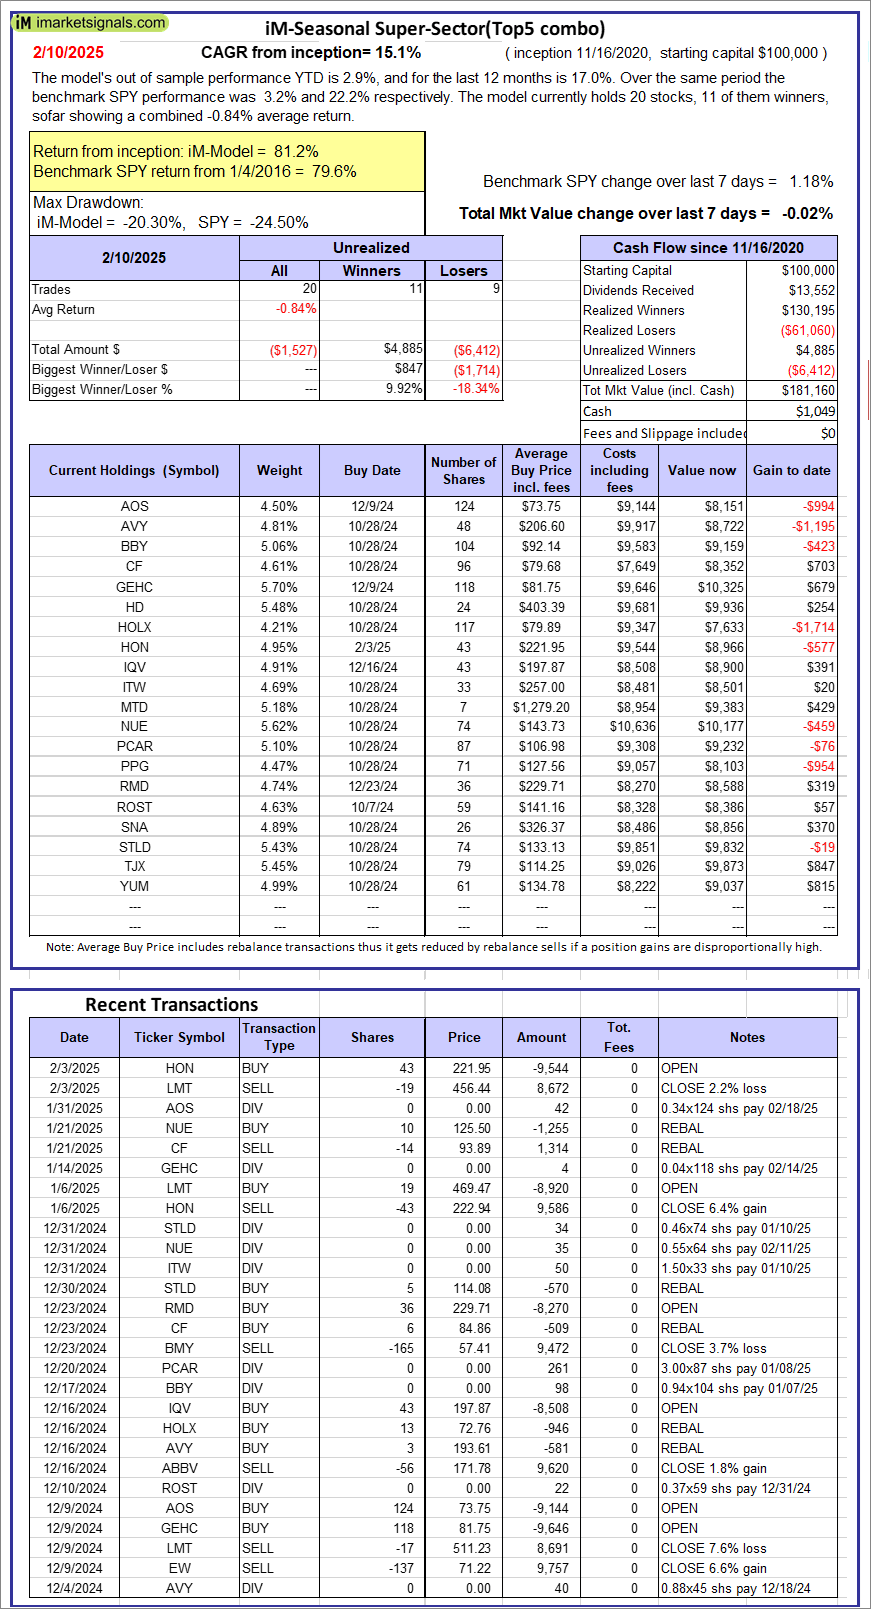 |
iM-Seasonal Super-Sectors (Top5 combo) : Since inception, on 11/17/2020, the model gained 81.16% while the benchmark SPY gained 79.61% over the same period. Over the previous week the market value of iM-Seasonal Super-Sectors (Top5 combo) gained -0.02% at a time when SPY gained 1.18%. A starting capital of $100,000 at inception on 11/17/2020 would have grown to $181,160 which includes $1,049 cash and excludes $00 spent on fees and slippage. |
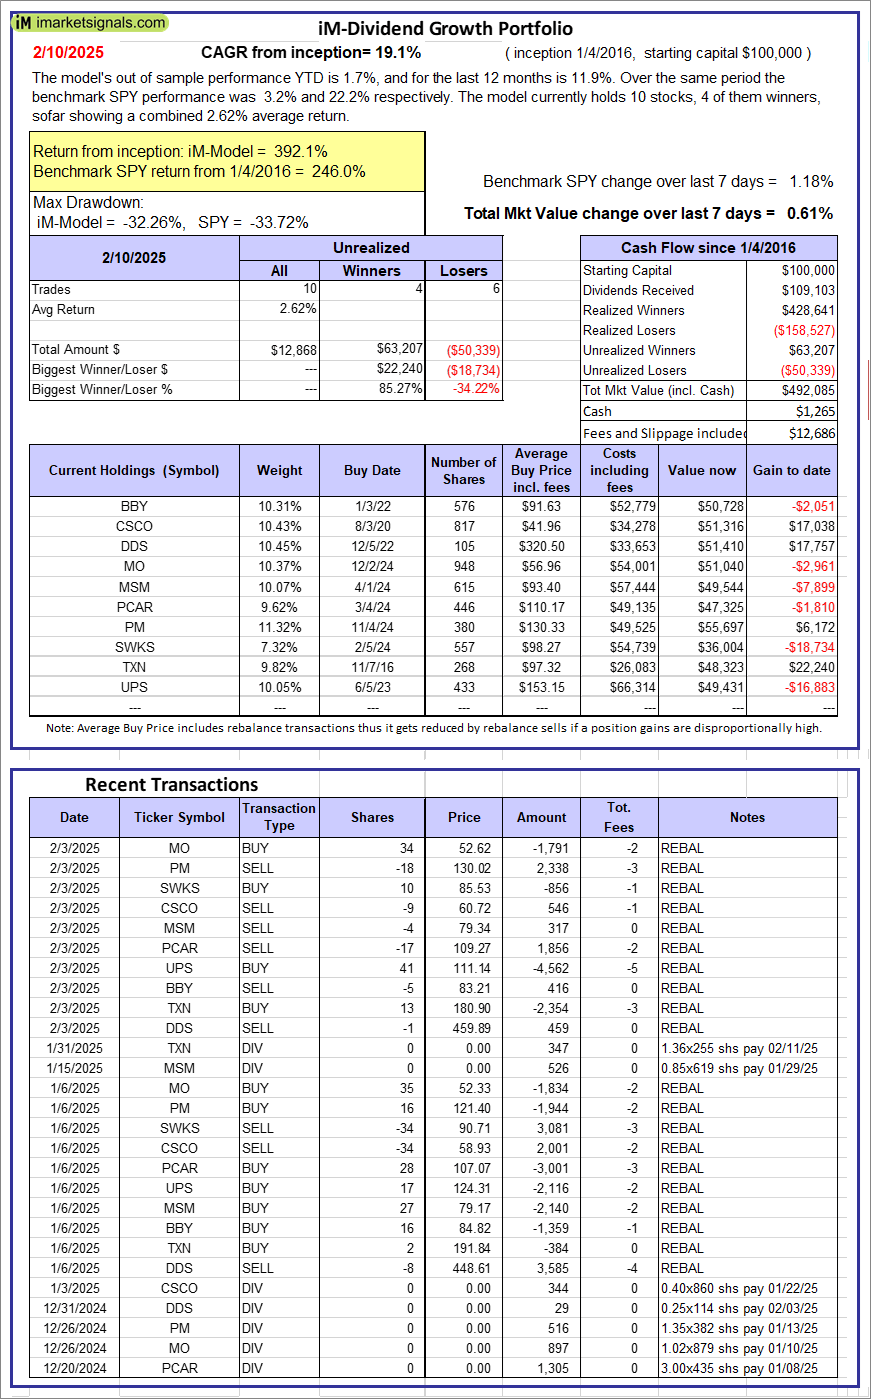 |
iM-Dividend Growth Portfolio: The model’s out of sample performance YTD is 1.7%, and for the last 12 months is 11.9%. Over the same period the benchmark SPY performance was 3.2% and 22.2% respectively. Over the previous week the market value of the iM-Dividend Growth Portfolio gained 0.61% at a time when SPY gained 1.18%. A starting capital of $100,000 at inception on 6/30/2016 would have grown to $492,085 which includes $1,265 cash and excludes $12,686 spent on fees and slippage. |
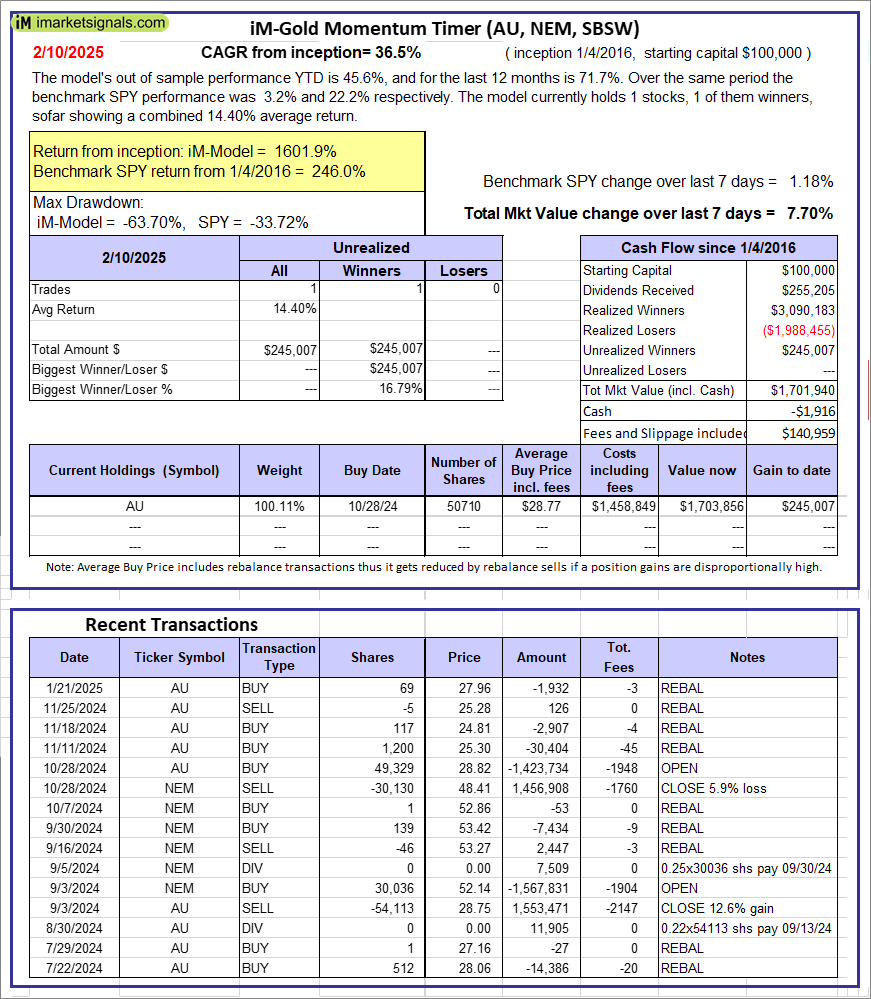 |
iM-Gold Momentum Timer (AU, NEM, SBSW): The model’s out of sample performance YTD is 45.6%, and for the last 12 months is 71.7%. Over the same period the benchmark SPY performance was 3.2% and 22.2% respectively. Over the previous week the market value of iM-Gold Momentum Timer (AU, NEM, SBSW) gained 7.70% at a time when SPY gained 1.18%. A starting capital of $100,000 at inception on 6/30/2016 would have grown to -$1,916 which includes $140,959 cash and excludes Gain to date spent on fees and slippage. |
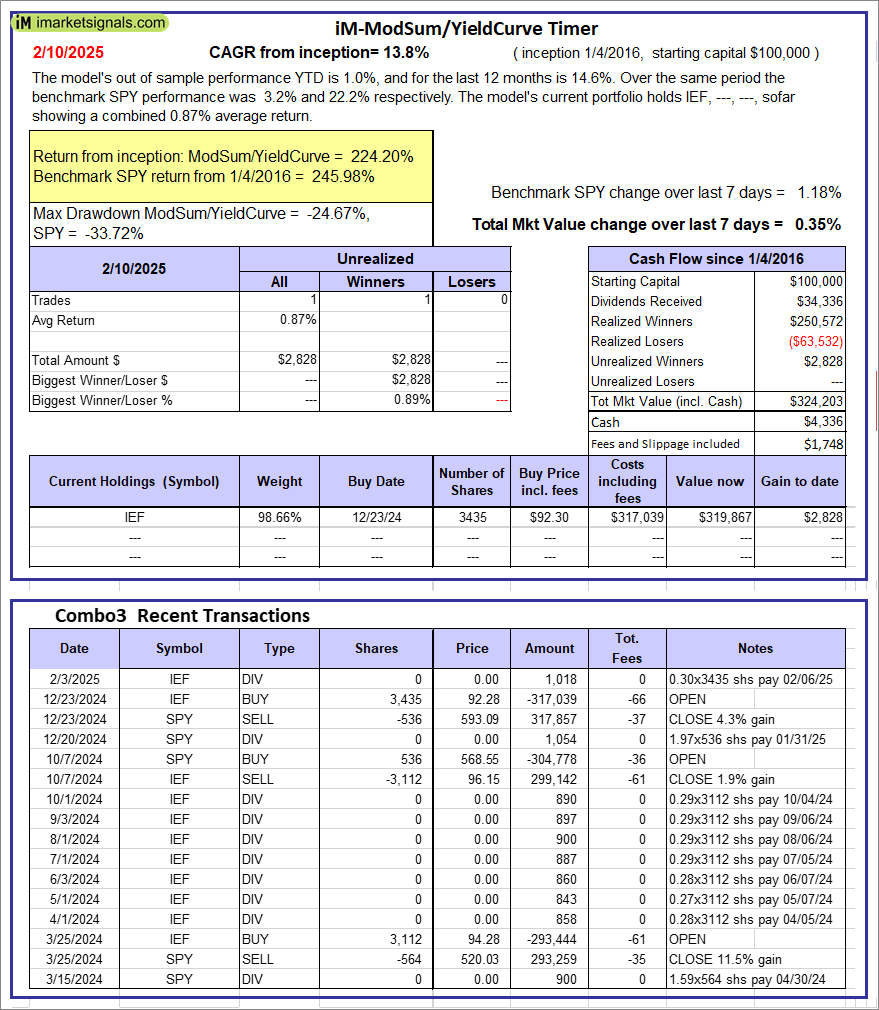 |
iM-ModSum/YieldCurve Timer: The model’s out of sample performance YTD is 1.0%, and for the last 12 months is 14.6%. Over the same period the benchmark SPY performance was 3.2% and 22.2% respectively. Over the previous week the market value of iM-PortSum/YieldCurve Timer gained 0.35% at a time when SPY gained 1.18%. A starting capital of $100,000 at inception on 1/1/2016 would have grown to $324,203 which includes $4,336 cash and excludes $1,748 spent on fees and slippage. |
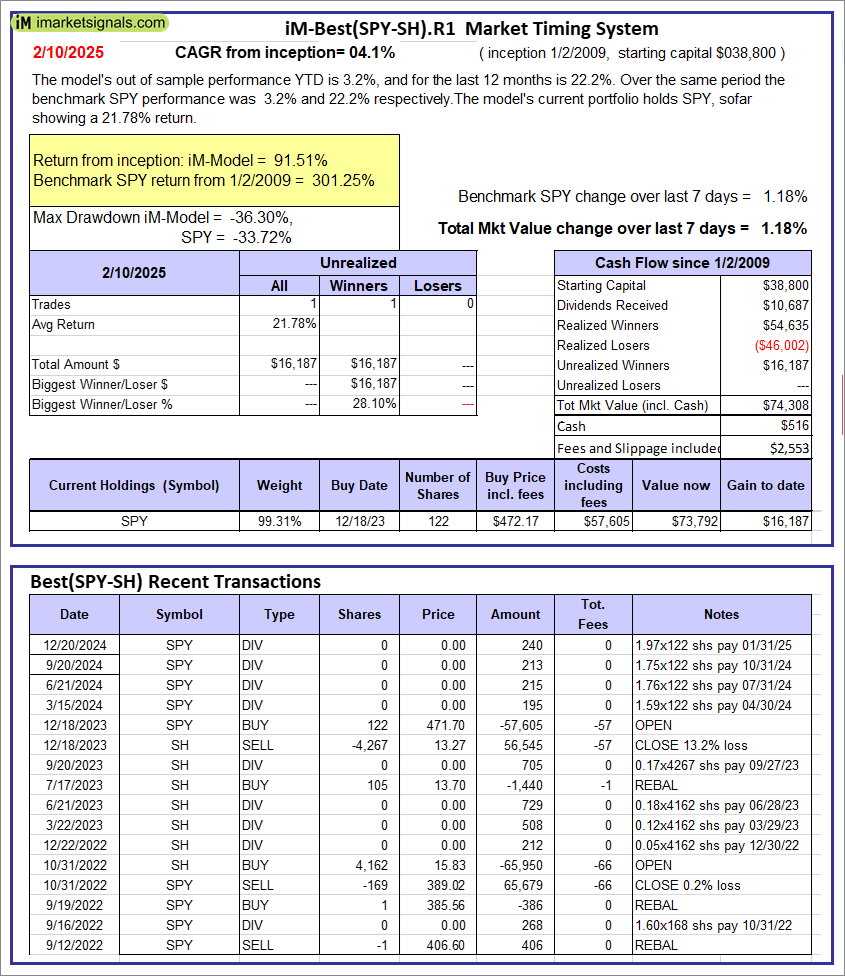 |
iM-Best(SPY-SH).R1: The model’s out of sample performance YTD is 3.2%, and for the last 12 months is 22.2%. Over the same period the benchmark SPY performance was 3.2% and 22.2% respectively. Over the previous week the market value of Best(SPY-SH) gained 1.18% at a time when SPY gained 1.18%. A starting capital of $100,000 at inception on 1/2/2009 would have grown to $74,308 which includes $516 cash and excludes $2,553 spent on fees and slippage. |
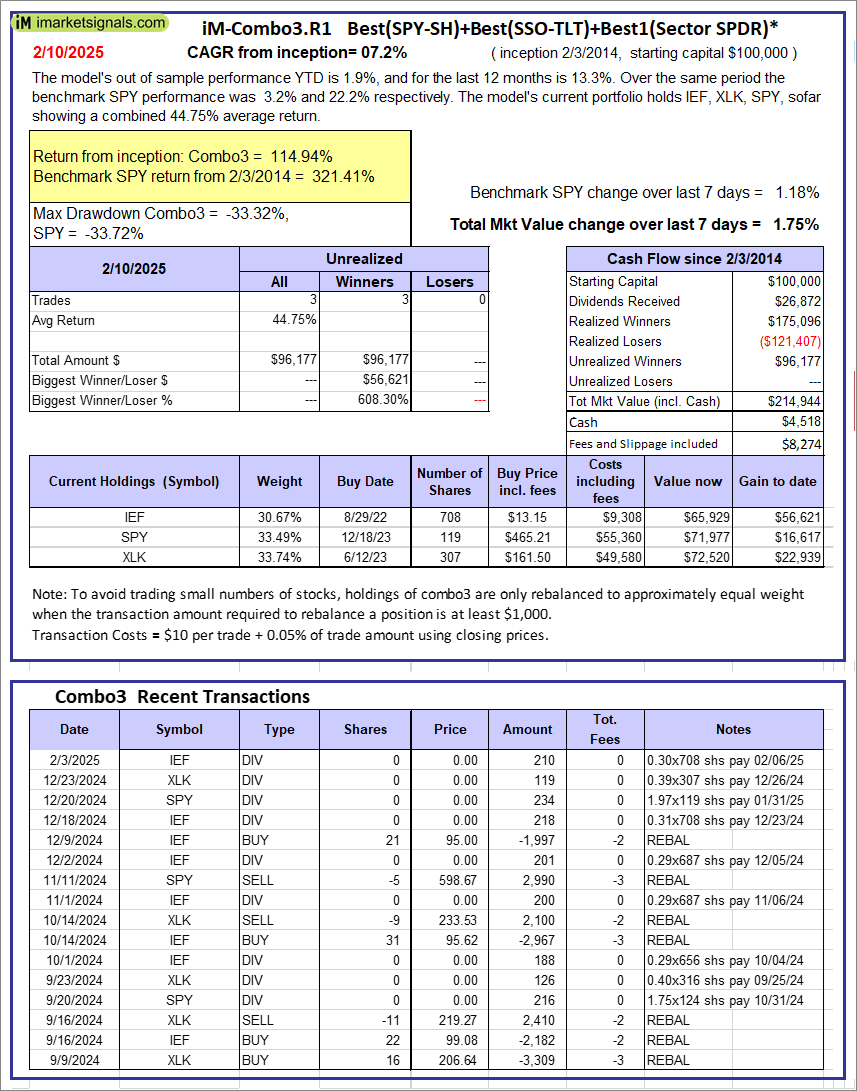 |
iM-Combo3.R1: The model’s out of sample performance YTD is 1.9%, and for the last 12 months is 13.3%. Over the same period the benchmark SPY performance was 3.2% and 22.2% respectively. Over the previous week the market value of iM-Combo3.R1 gained 1.75% at a time when SPY gained 1.18%. A starting capital of $100,000 at inception on 2/3/2014 would have grown to $214,944 which includes $4,518 cash and excludes $8,274 spent on fees and slippage. |
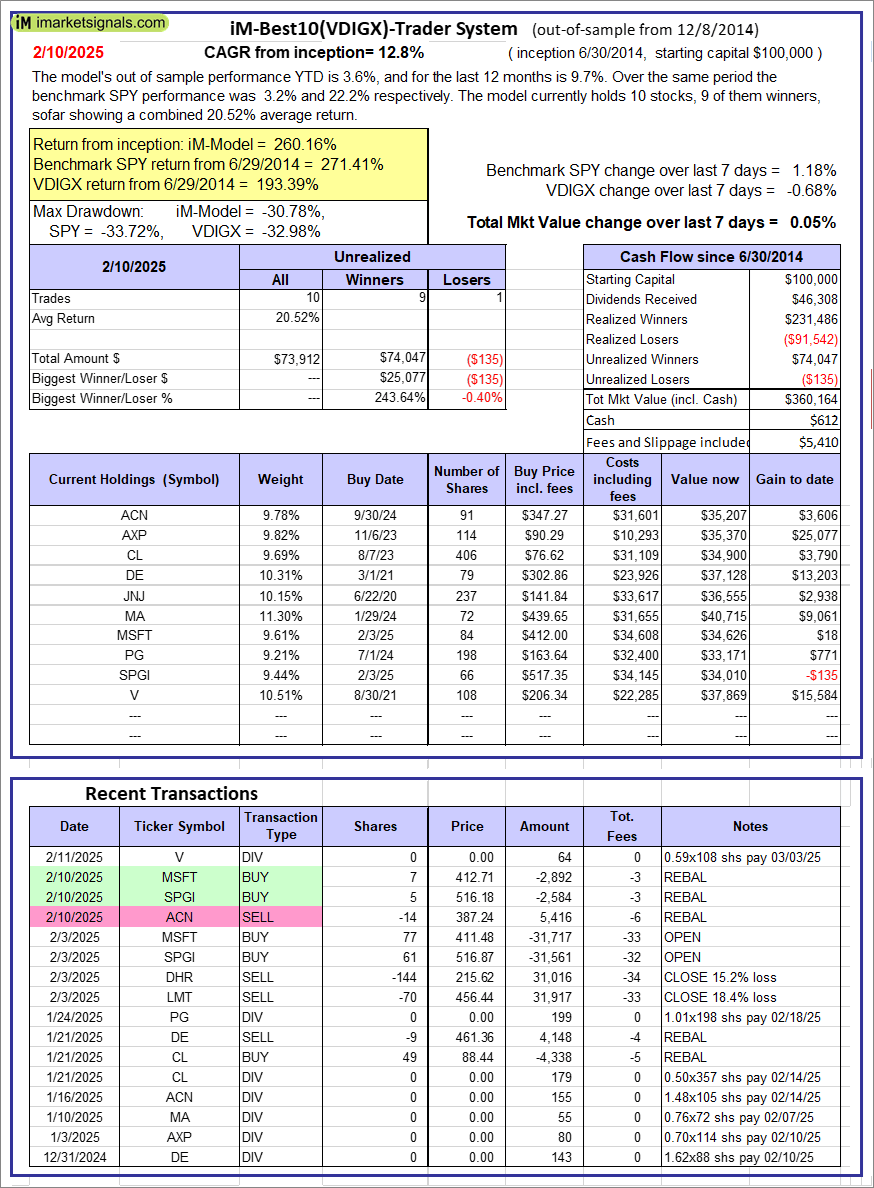  |
iM-Best10(VDIGX)-Trader: The model’s out of sample performance YTD is 3.6%, and for the last 12 months is 9.7%. Over the same period the benchmark SPY performance was 3.2% and 22.2% respectively. Since inception, on 7/1/2014, the model gained 260.16% while the benchmark SPY gained 271.41% and VDIGX gained 193.39% over the same period. Over the previous week the market value of iM-Best10(VDIGX) gained 0.05% at a time when SPY gained 1.18%. A starting capital of $100,000 at inception on 7/1/2014 would have grown to $360,164 which includes $612 cash and excludes $5,410 spent on fees and slippage. |
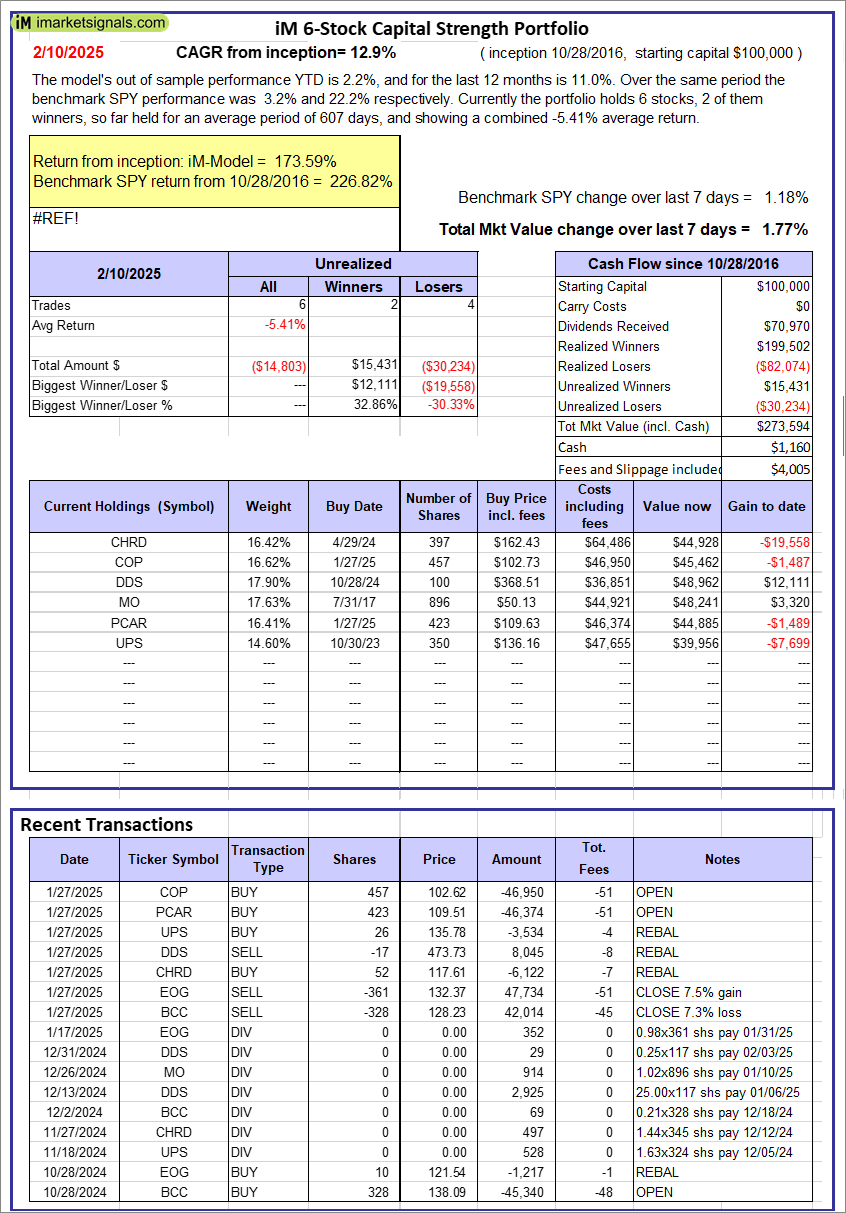 |
iM 6-Stock Capital Strength Portfolio: The model’s out of sample performance YTD is 2.2%, and for the last 12 months is 11.0%. Over the same period the benchmark SPY performance was 3.2% and 22.2% respectively. Over the previous week the market value of the iM 6-Stock Capital Strength Portfolio gained 1.77% at a time when SPY gained 1.18%. A starting capital of $100,000 at inception on 10/28/2016 would have grown to $273,594 which includes $1,160 cash and excludes $4,005 spent on fees and slippage. |
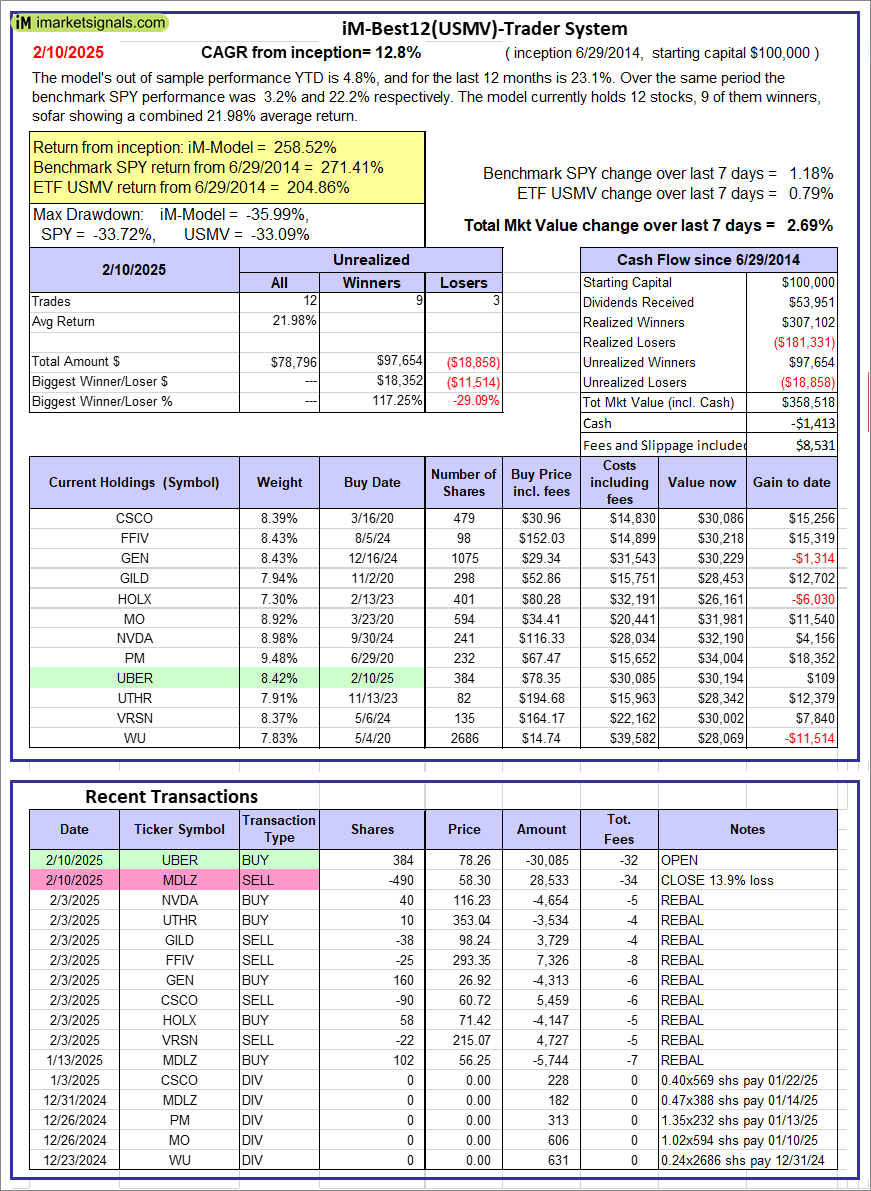  |
iM-Best12(USMV)-Trader: The model’s out of sample performance YTD is 4.8%, and for the last 12 months is 23.1%. Over the same period the benchmark SPY performance was 3.2% and 22.2% respectively. Since inception, on 6/30/2014, the model gained 258.52% while the benchmark SPY gained 271.41% and the ETF USMV gained 204.86% over the same period. Over the previous week the market value of iM-Best12(USMV)-Trader gained 2.69% at a time when SPY gained 1.18%. A starting capital of $100,000 at inception on 6/30/2014 would have grown to $358,518 which includes -$1,413 cash and excludes $8,531 spent on fees and slippage. |
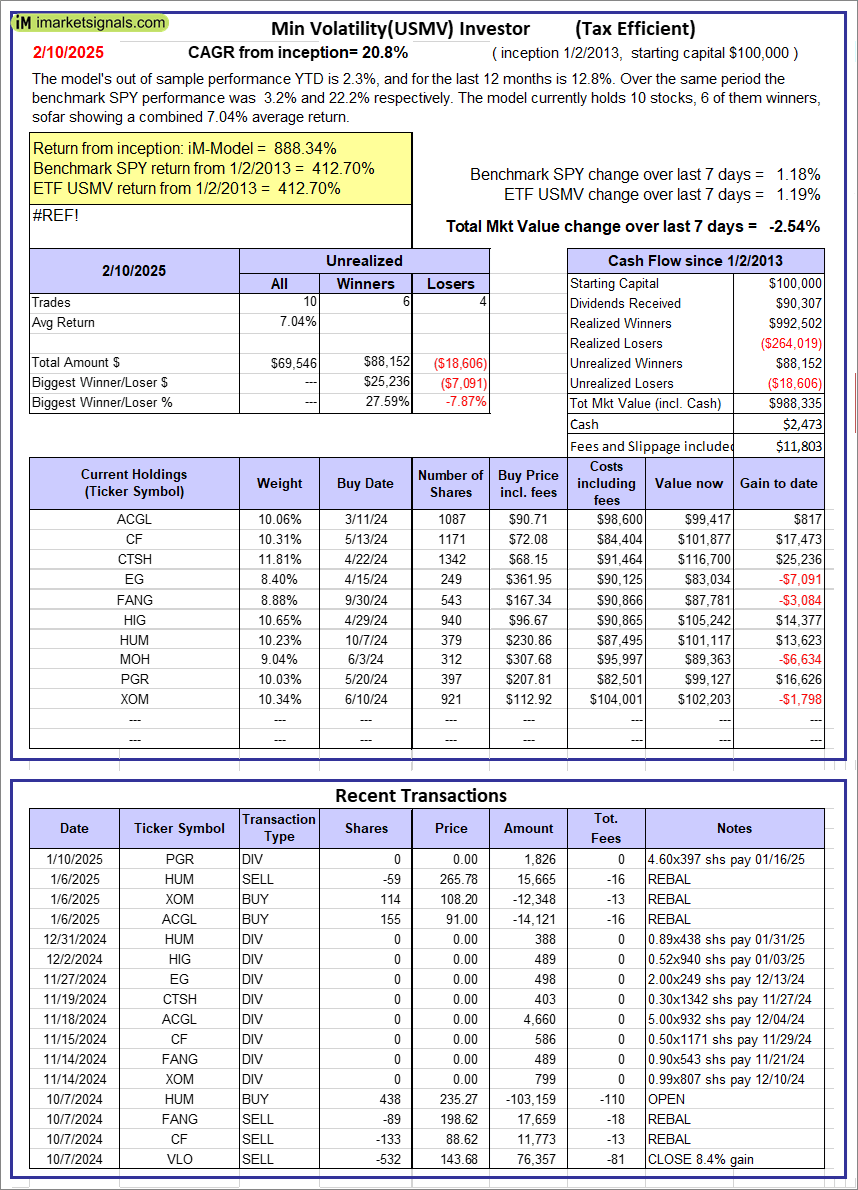  |
iM-Min Volatility(USMV) Investor (Tax Efficient): The model’s out of sample performance YTD is 2.3%, and for the last 12 months is 12.8%. Over the same period the benchmark SPY performance was 3.2% and 22.2% respectively. Since inception, on 1/3/2013, the model gained 888.34% while the benchmark SPY gained 412.70% and the ETF USMV gained 412.70% over the same period. Over the previous week the market value of iM-Best12(USMV)Q1 gained -2.54% at a time when SPY gained 1.18%. A starting capital of $100,000 at inception on 1/3/2013 would have grown to $988,335 which includes $2,473 cash and excludes $11,803 spent on fees and slippage. |
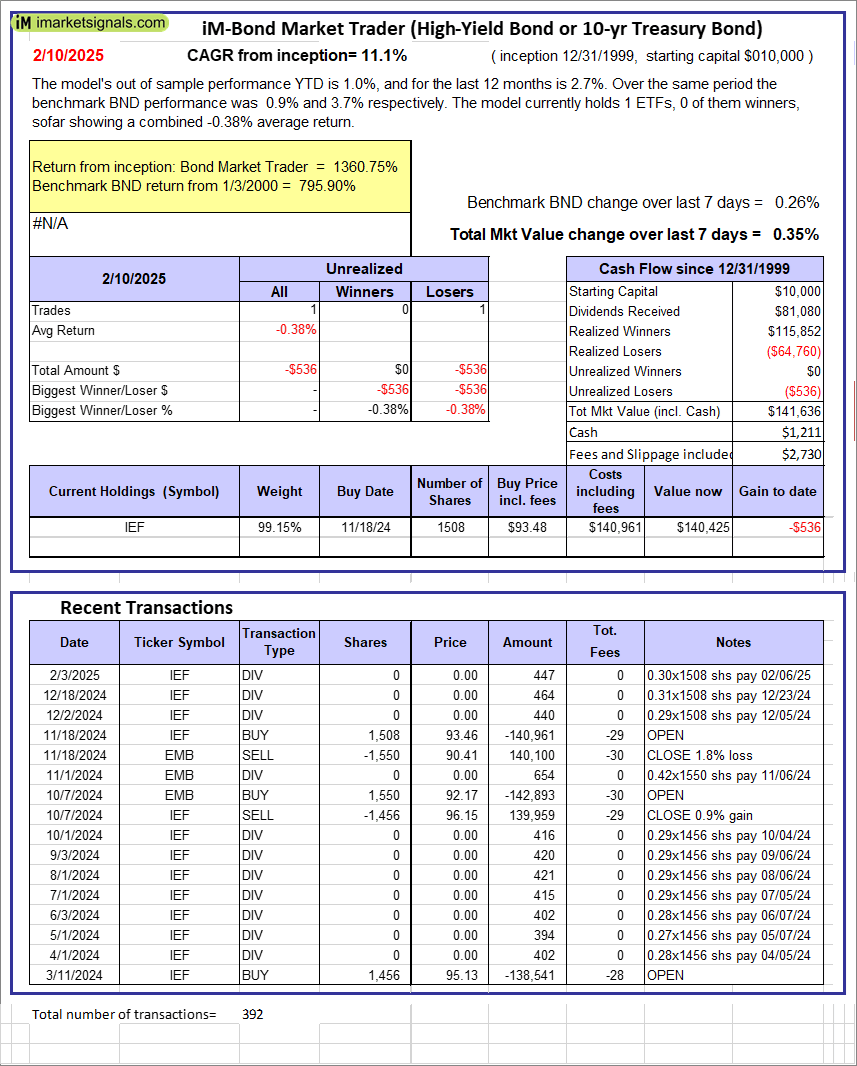 |
iM-Bond Market Trader (High-Yield Bond or 10-yr Treasury Bond): The model’s out of sample performance YTD is 1.0%, and for the last 12 months is 2.7%. Over the same period the benchmark BND performance was 0.9% and 3.7% respectively. Over the previous week the market value of the iM-Bond Market Trader (High-Yield Bond or 10-yr Treasury Bond) gained 0.35% at a time when BND gained 0.26%. A starting capital of $10,000 at inception on 1/3/2000 would have grown to $141,636 which includes $1,211 cash and excludes $2,730 spent on fees and slippage. |
|
|
iM-ModSum/YieldCurve Timer: The model’s out of sample performance YTD is 1.0%, and for the last 12 months is 14.6%. Over the same period the benchmark SPY performance was 3.2% and 22.2% respectively. Over the previous week the market value of iM-PortSum/YieldCurve Timer gained 0.35% at a time when SPY gained 1.18%. A starting capital of $100,000 at inception on 1/1/2016 would have grown to $324,203 which includes $4,336 cash and excludes $1,748 spent on fees and slippage. |
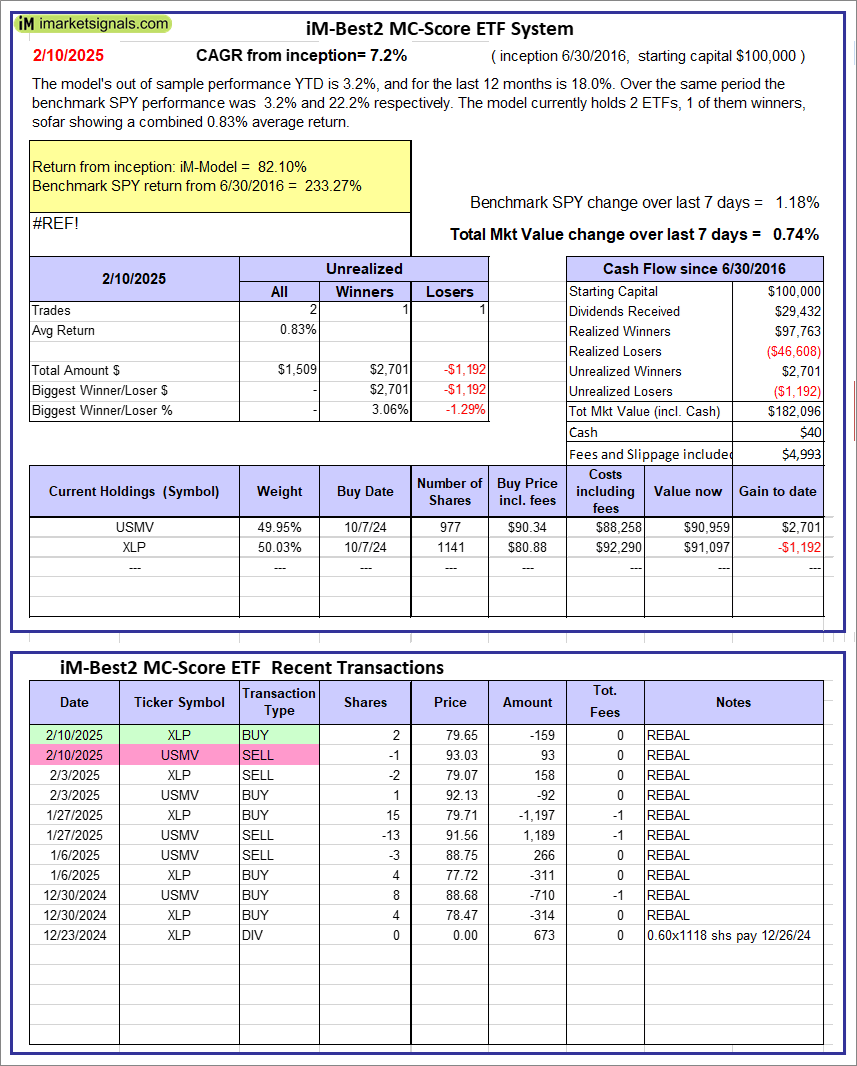 |
iM-Best2 MC-Score ETF System: The model’s out of sample performance YTD is 3.2%, and for the last 12 months is 18.0%. Over the same period the benchmark SPY performance was 3.2% and 22.2% respectively. Over the previous week the market value of the iM-Best2 MC-Score ETF System gained 0.74% at a time when SPY gained 1.18%. A starting capital of $100,000 at inception on 6/30/2016 would have grown to $182,096 which includes $40 cash and excludes $4,993 spent on fees and slippage. |
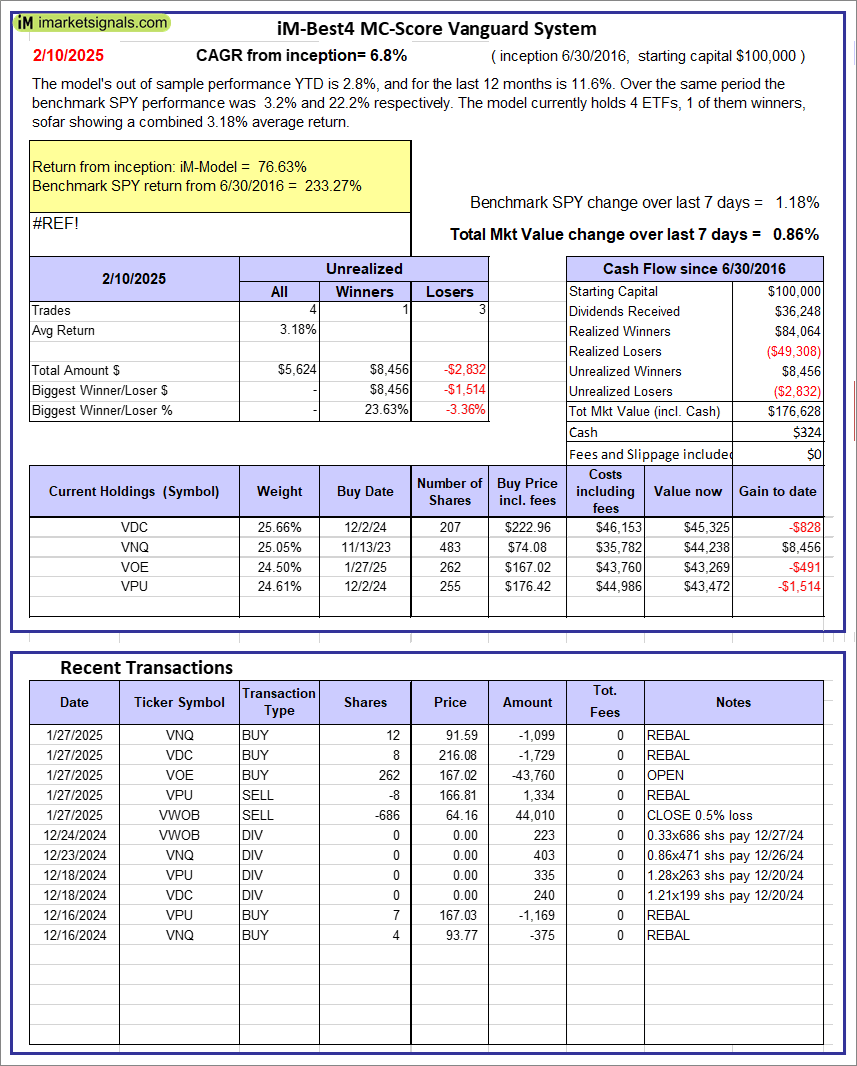 |
iM-Best4 MC-Score Vanguard System: The model’s out of sample performance YTD is 2.8%, and for the last 12 months is 11.6%. Over the same period the benchmark SPY performance was 3.2% and 22.2% respectively. Over the previous week the market value of the iM-Best4 MC-Score Vanguard System gained 0.86% at a time when SPY gained 1.18%. A starting capital of $100,000 at inception on 6/30/2016 would have grown to $176,628 which includes $324 cash and excludes $00 spent on fees and slippage. |
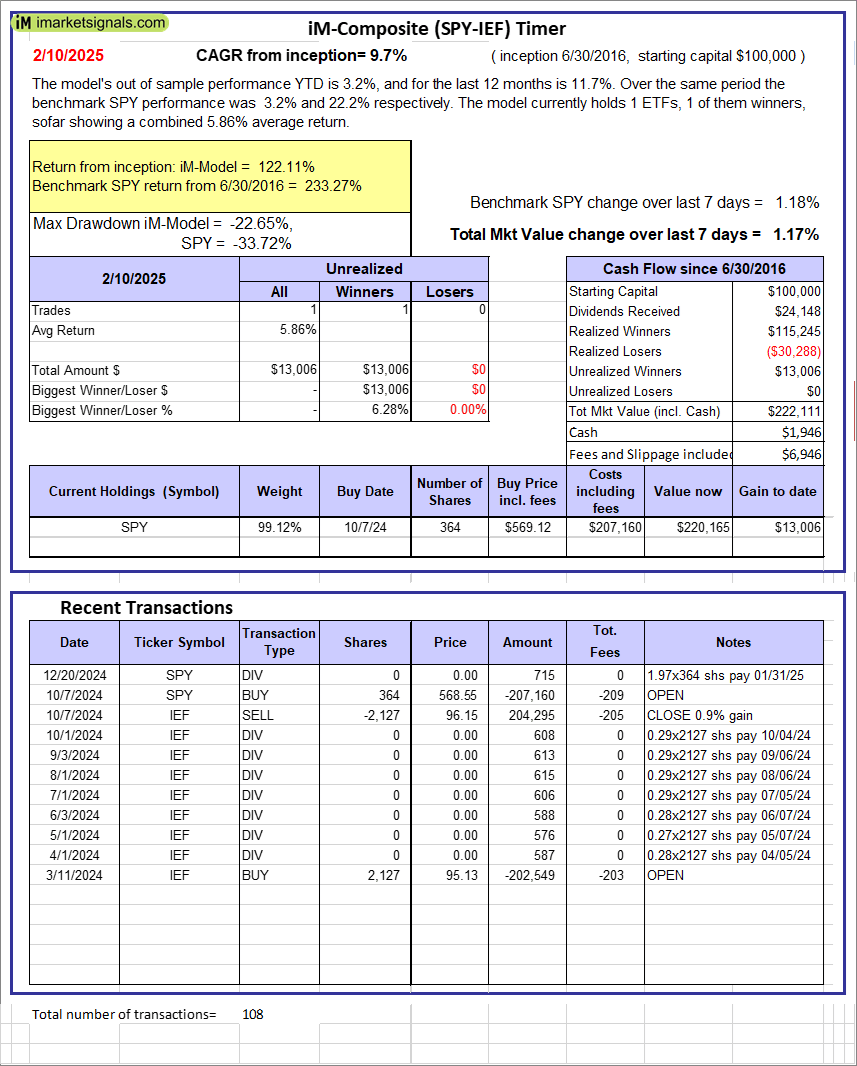 |
iM-Composite (SPY-IEF) Timer: The model’s out of sample performance YTD is 3.2%, and for the last 12 months is 11.7%. Over the same period the benchmark SPY performance was 3.2% and 22.2% respectively. Over the previous week the market value of the iM-Composite (SPY-IEF) Timer gained 1.17% at a time when SPY gained 1.18%. A starting capital of $100,000 at inception on 6/30/2016 would have grown to $222,111 which includes $1,946 cash and excludes $6,946 spent on fees and slippage. |
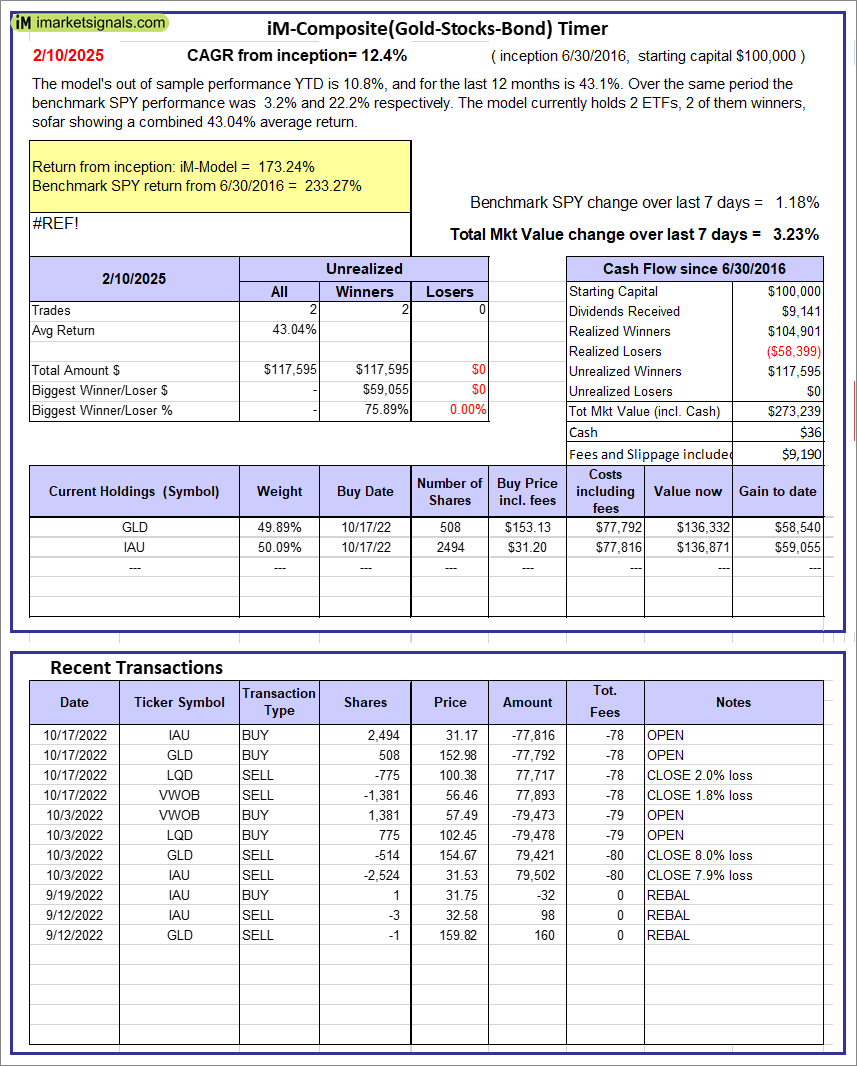 |
iM-Composite(Gold-Stocks-Bond) Timer: The model’s out of sample performance YTD is 10.8%, and for the last 12 months is 43.1%. Over the same period the benchmark SPY performance was 3.2% and 22.2% respectively. Over the previous week the market value of the iM-Composite(Gold-Stocks-Bond) Timer gained 3.23% at a time when SPY gained 1.18%. A starting capital of $100,000 at inception on 6/30/2016 would have grown to $273,239 which includes $36 cash and excludes $9,190 spent on fees and slippage. |
iM-Best Reports – 2/11/2025
Posted in pmp SPY-SH
Leave a Reply
You must be logged in to post a comment.