
  |
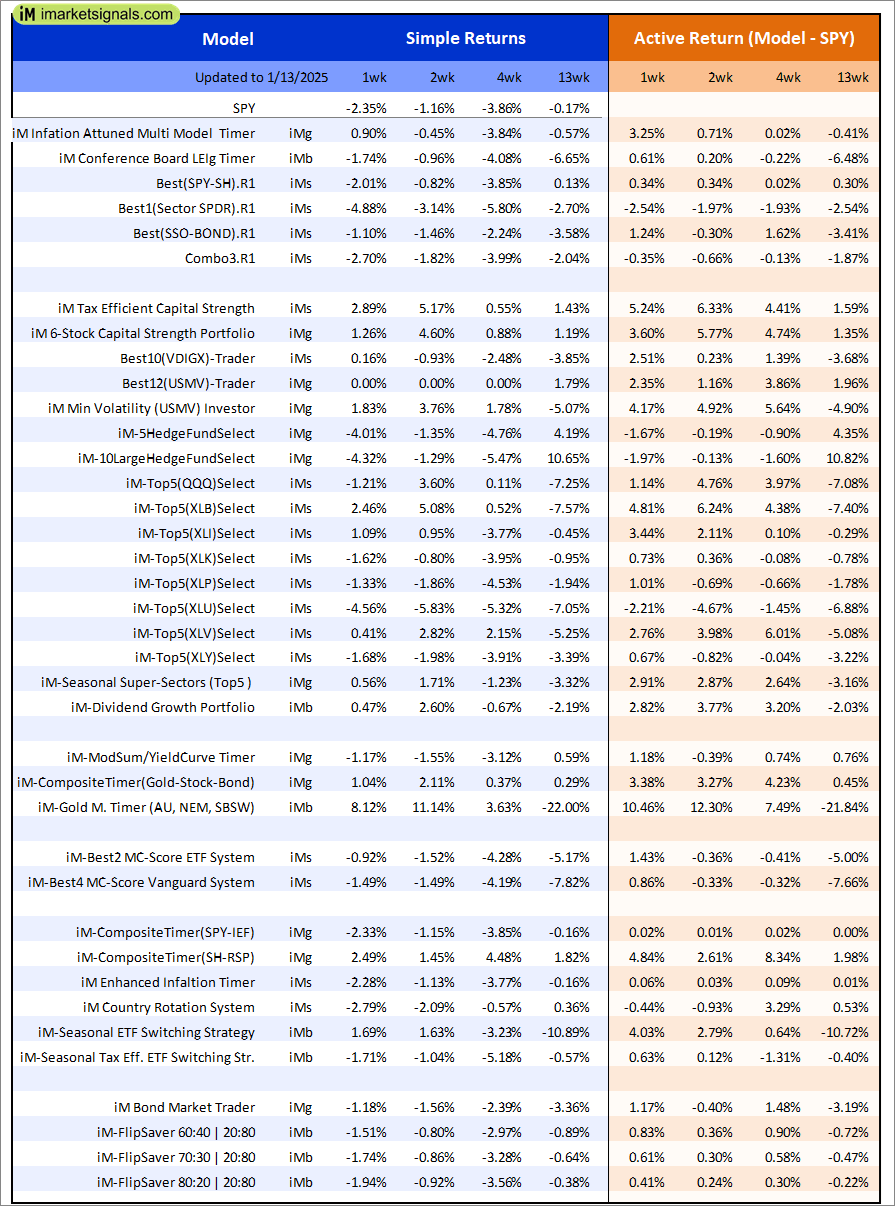
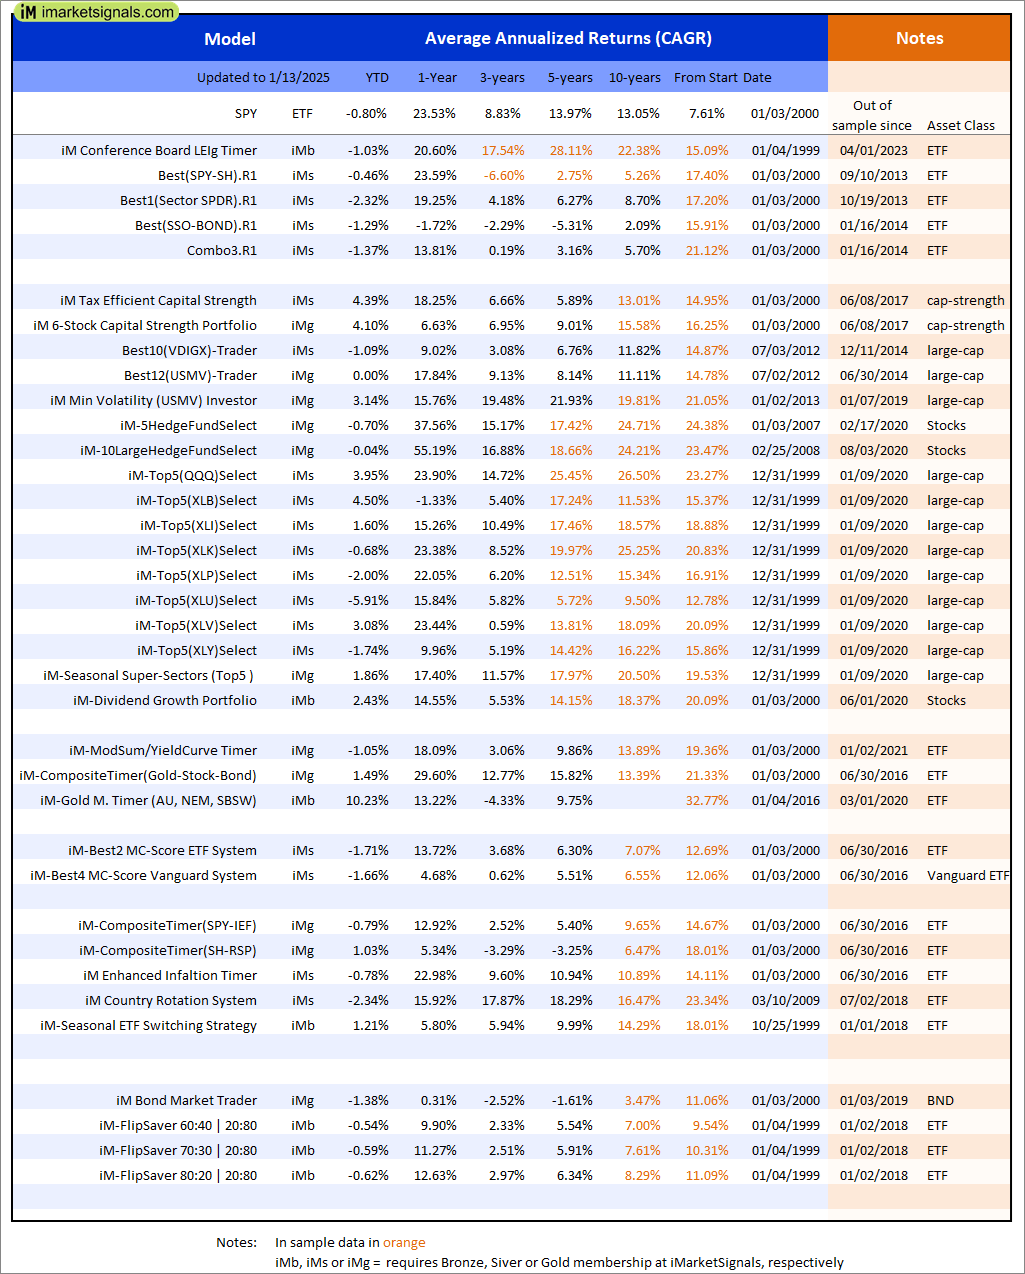
Out of sample performance summary of our models for the past 1, 2, 4 and 13 week periods. The active active return indicates how the models over- or underperformed the benchmark ETF SPY. Also the YTD, and the 1-, 3-, 5- and 10-year annualized returns are shown in the second table |
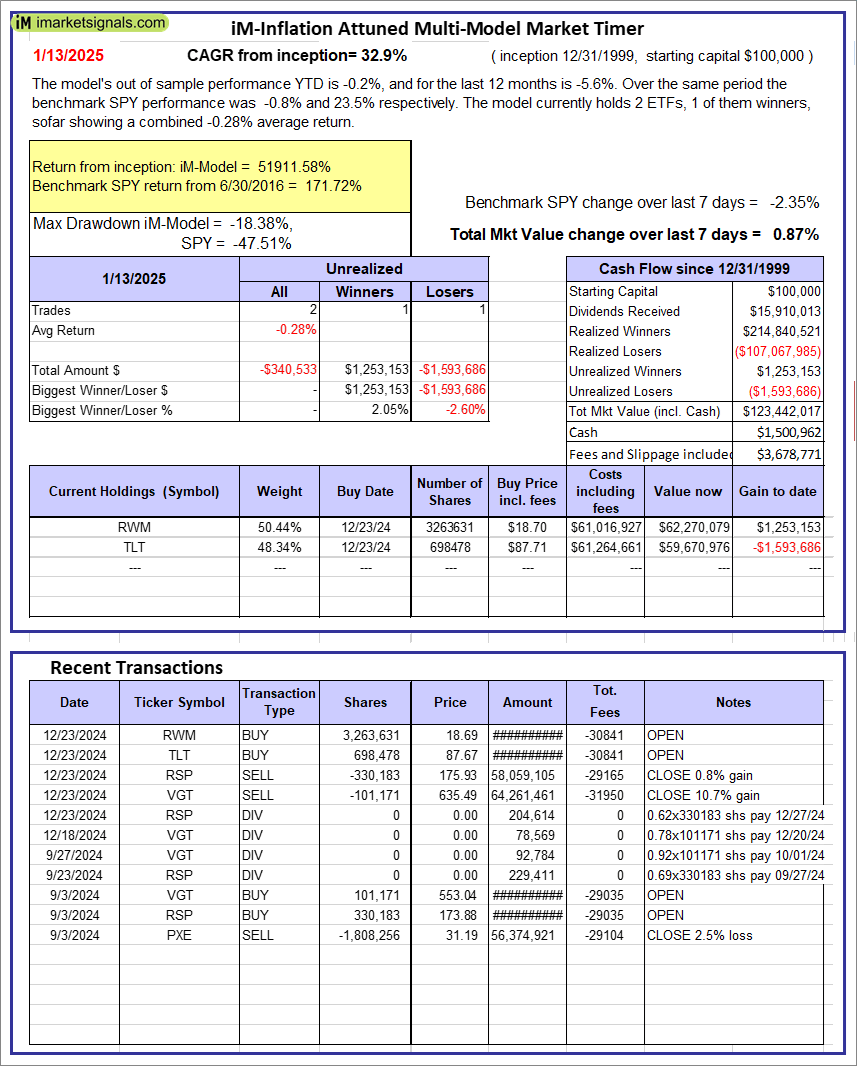 |
iM-Inflation Attuned Multi-Model Market Timer: The model’s out of sample performance YTD is -0.2%, and for the last 12 months is -5.6%. Over the same period the benchmark SPY performance was -0.8% and 23.5% respectively. Over the previous week the market value of the iM-Inflation Attuned Multi-Model Market Timer gained 0.87% at a time when SPY gained -2.35%. A starting capital of $100,000 at inception on 3/24/2017 would have grown to $123,442,017 which includes $1,500,962 cash and excludes $3,678,771 spent on fees and slippage. |
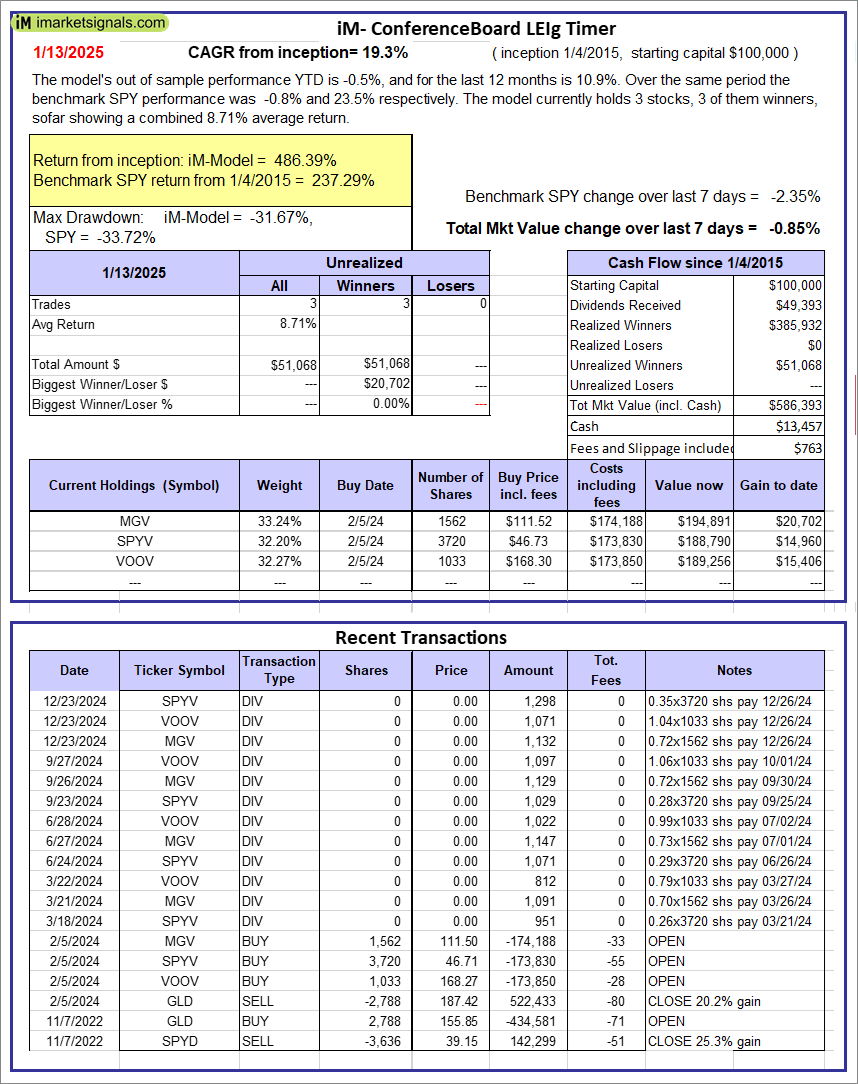 |
iM-Conference Board LEIg Timer: The model’s performance YTD is 14.3%, and for the last 12 months is 7.3%. Over the same period the benchmark SPY performance was 20.1% and 9.4% respectively. Over the previous week the market value of the iM-Conference Board LEIg Timer gained -0.85% at a time when SPY gained -2.35%. A starting capital of $100,000 at inception on 4/5/2017 would have grown to $586,393 which includes $13,457 cash and excludes $763 spent on fees and slippage. |
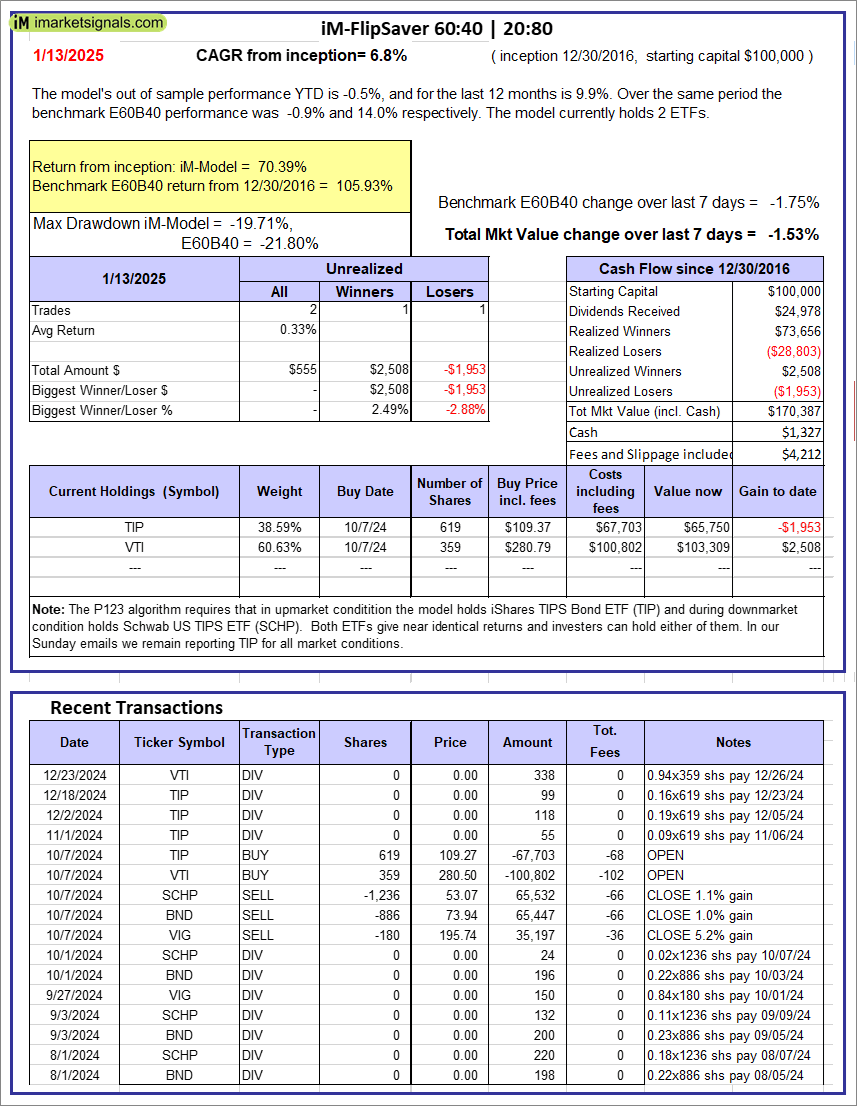 |
iM-FlipSaver 60:40 | 20:80 – 2017: The model’s out of sample performance YTD is -0.5%, and for the last 12 months is 9.9%. Over the same period the benchmark E60B40 performance was -0.9% and 14.0% respectively. Over the previous week the market value of iM-FlipSaver 80:20 | 20:80 gained -1.53% at a time when SPY gained -1.75%. A starting capital of $100,000 at inception on 7/16/2015 would have grown to $170,387 which includes $1,327 cash and excludes $4,212 spent on fees and slippage. |
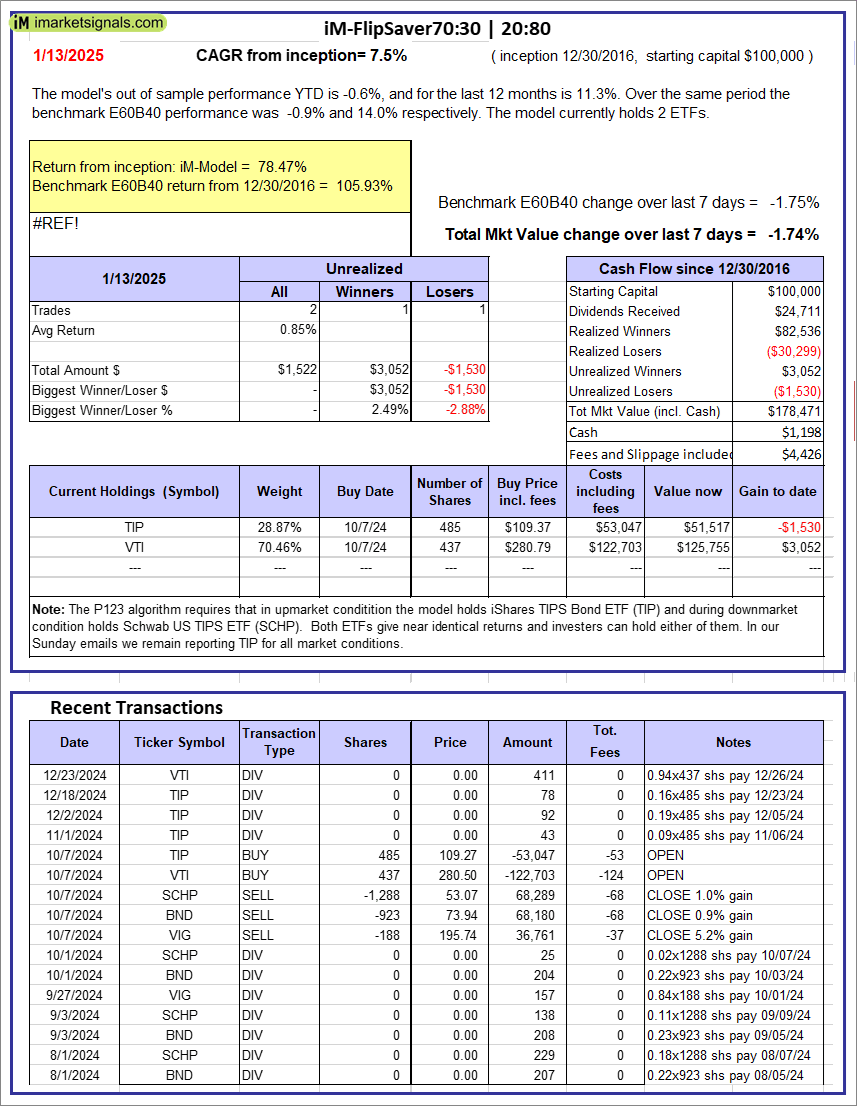 |
iM-FlipSaver 70:30 | 20:80 – 2017: The model’s out of sample performance YTD is -0.6%, and for the last 12 months is 11.3%. Over the same period the benchmark E60B40 performance was -0.9% and 14.0% respectively. Over the previous week the market value of iM-FlipSaver 70:30 | 20:80 gained -1.74% at a time when SPY gained -1.75%. A starting capital of $100,000 at inception on 7/15/2015 would have grown to $178,471 which includes $1,198 cash and excludes $4,426 spent on fees and slippage. |
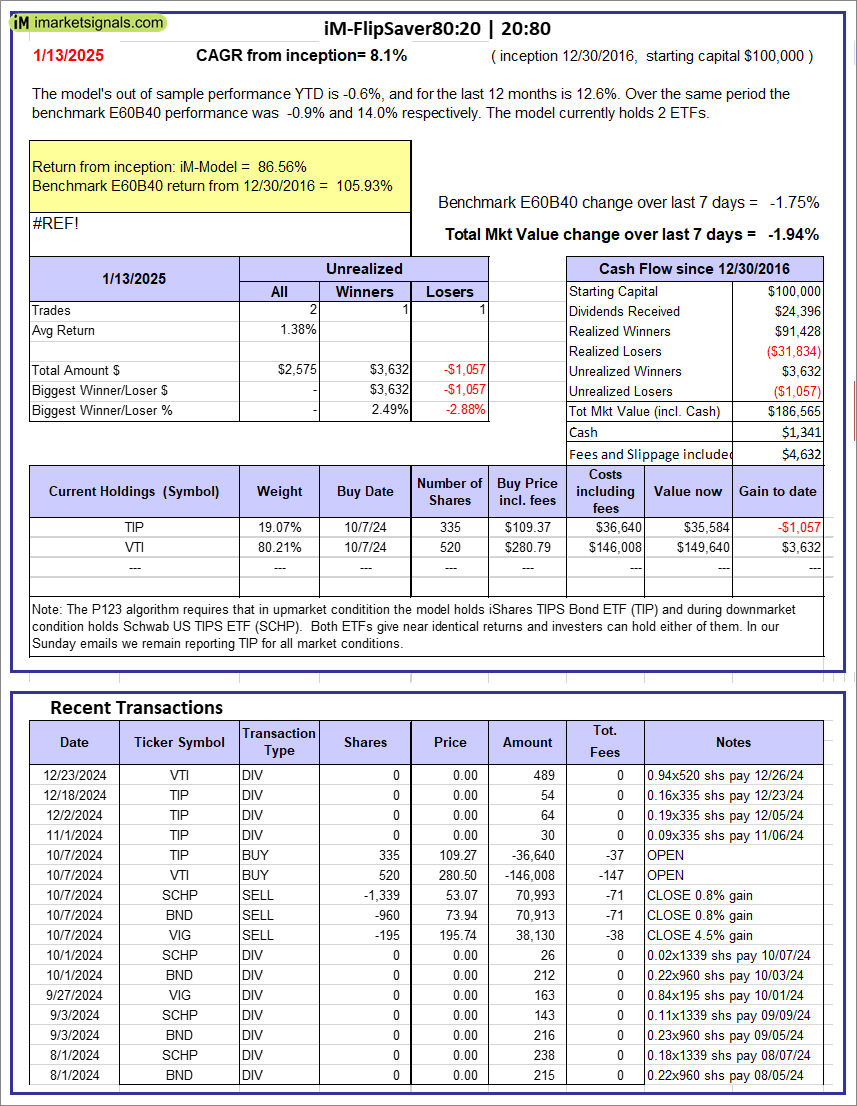 |
iM-FlipSaver 80:20 | 20:80 – 2017: The model’s out of sample performance YTD is -0.6%, and for the last 12 months is 12.6%. Over the same period the benchmark E60B40 performance was -0.9% and 14.0% respectively. Over the previous week the market value of iM-FlipSaver 80:20 | 20:80 gained -1.94% at a time when SPY gained -1.75%. A starting capital of $100,000 at inception on 1/2/2017 would have grown to $186,565 which includes $1,341 cash and excludes $4,632 spent on fees and slippage. |
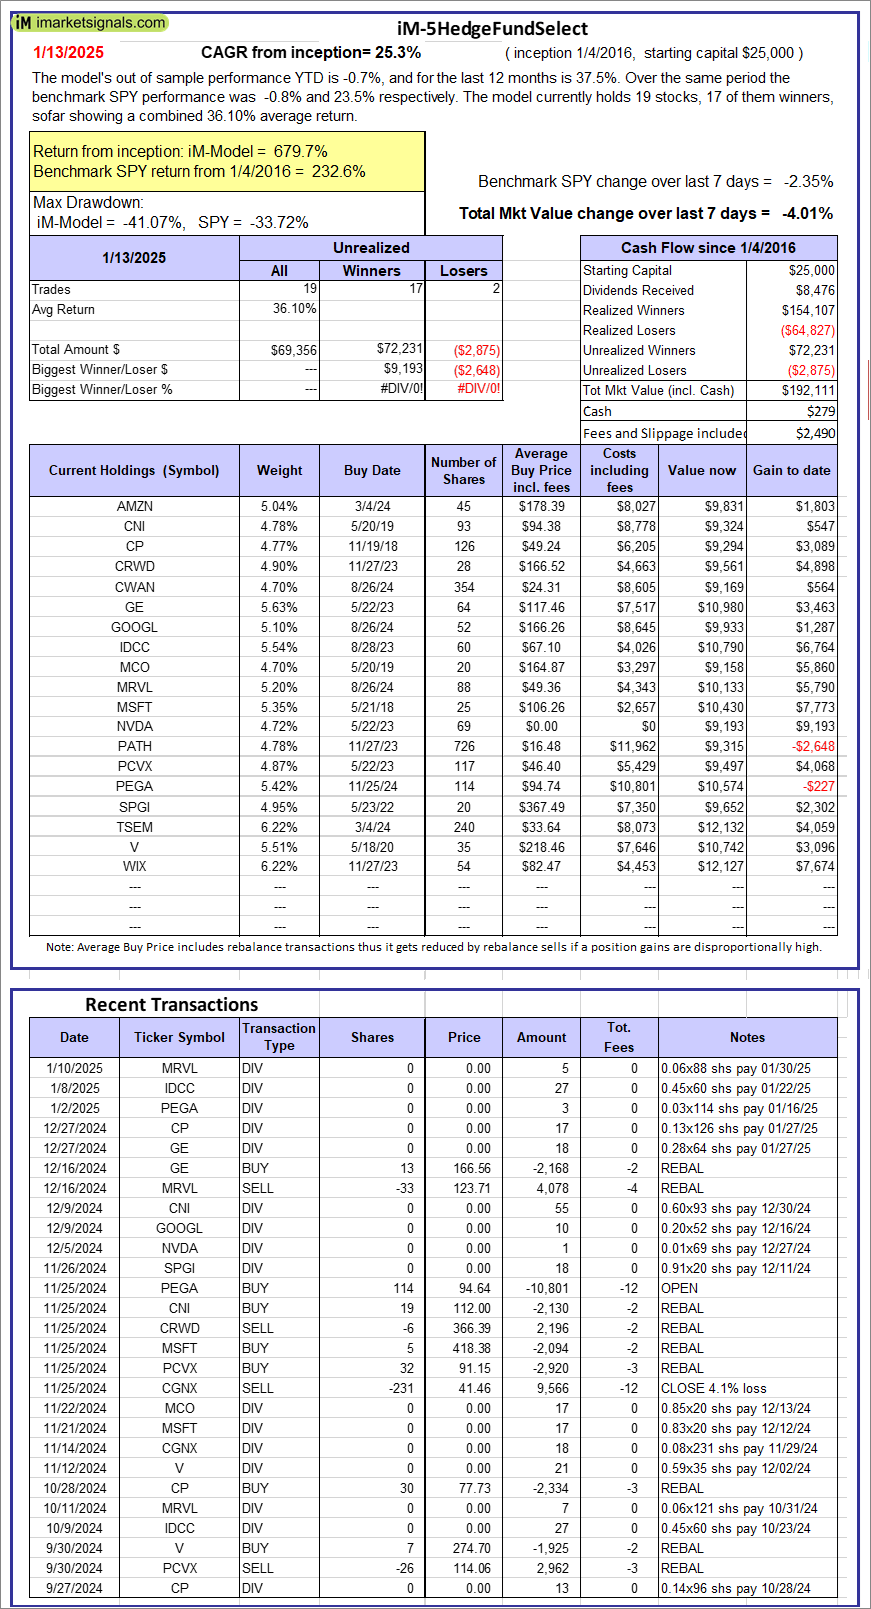 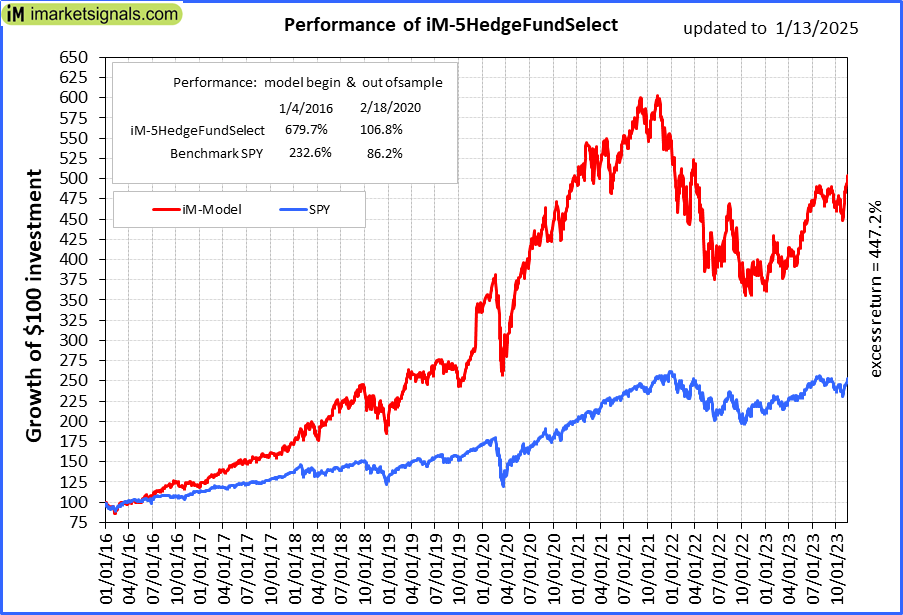 |
iM-5HedgeFundSelect: Since inception, on 1/5/2016, the model gained 679.74% while the benchmark SPY gained 232.57% over the same period. Over the previous week the market value of iM-5HedgeFundSelect gained -4.01% at a time when SPY gained -2.35%. A starting capital of $25,000 at inception on 1/5/2016 would have grown to $192,111 which includes $279 cash and excludes $2,490 spent on fees and slippage. |
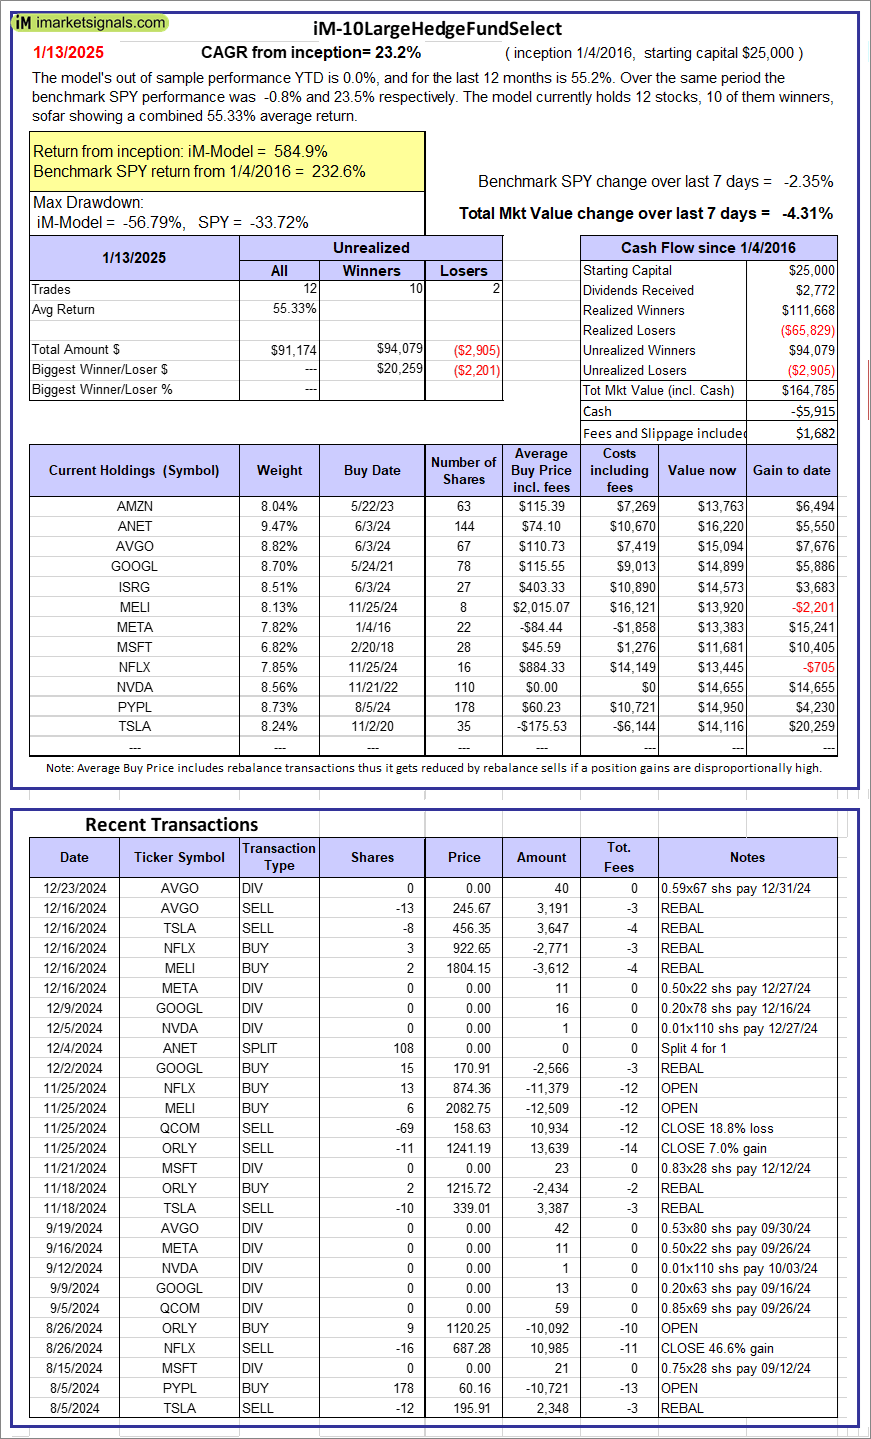 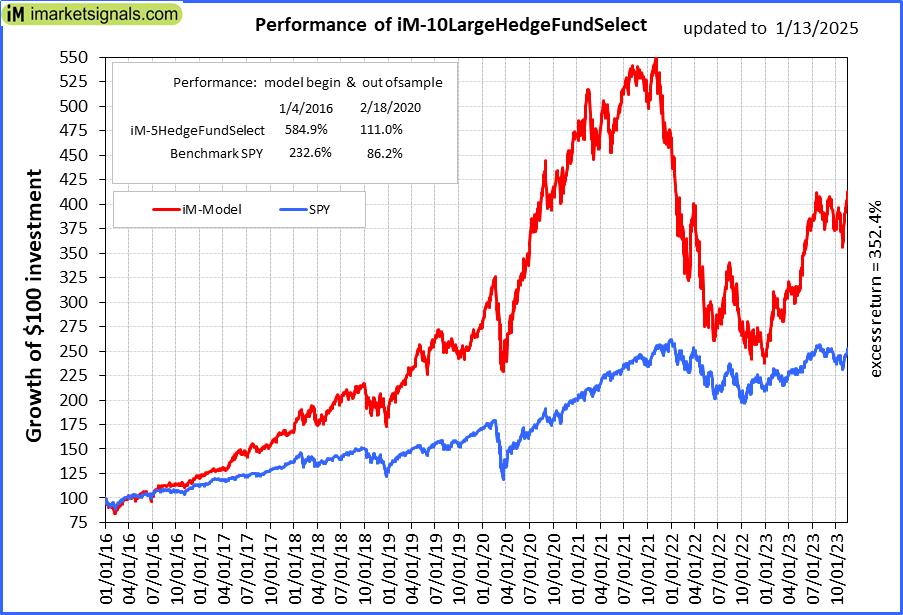 |
iM-10LargeHedgeFundSelect: Since inception, on 1/5/2016, the model gained 584.93% while the benchmark SPY gained 232.57% over the same period. Over the previous week the market value of iM-10LargeHedgeFundSelect gained -4.31% at a time when SPY gained -2.35%. A starting capital of $25,000 at inception on 1/5/2016 would have grown to $164,785 which includes -$5,915 cash and excludes $1,682 spent on fees and slippage. |
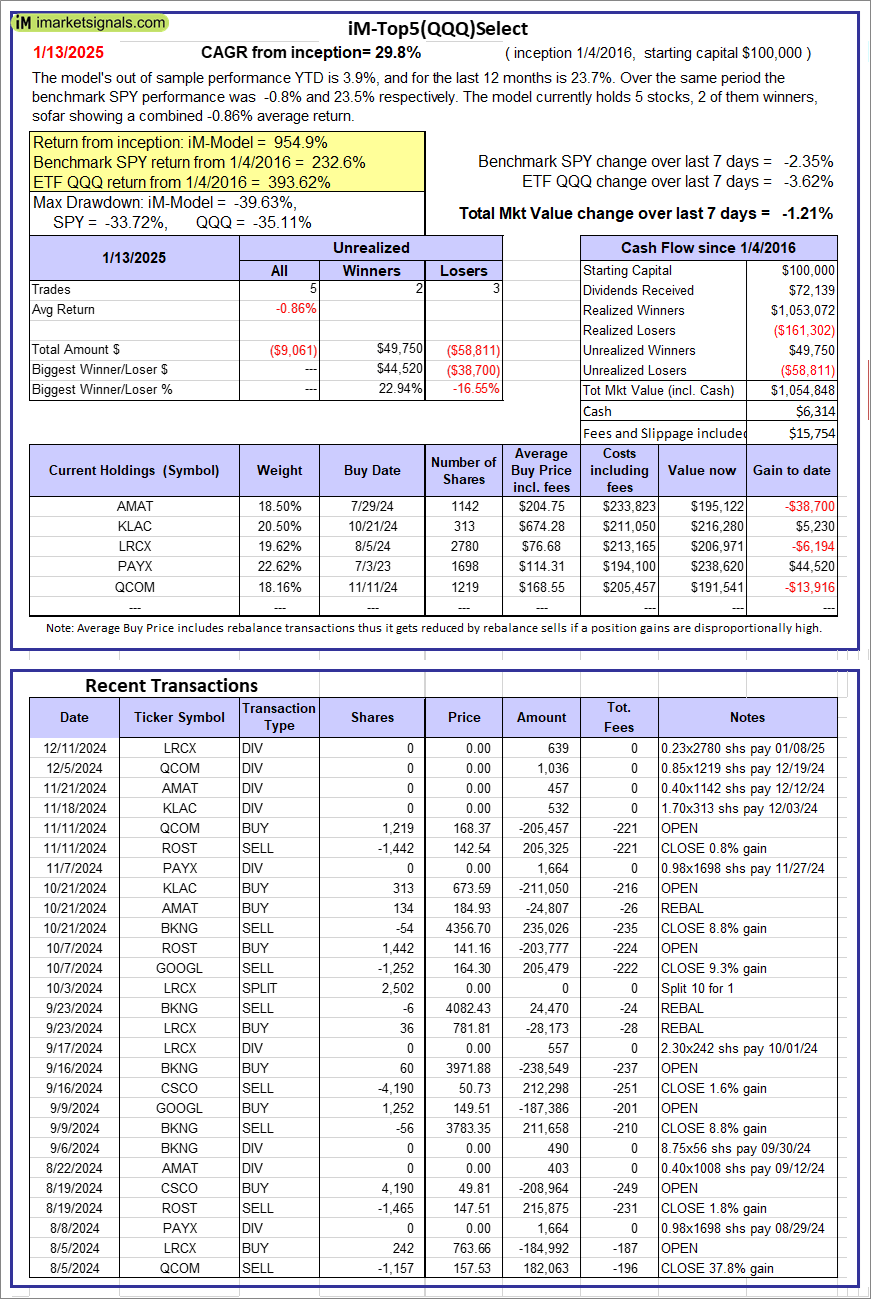 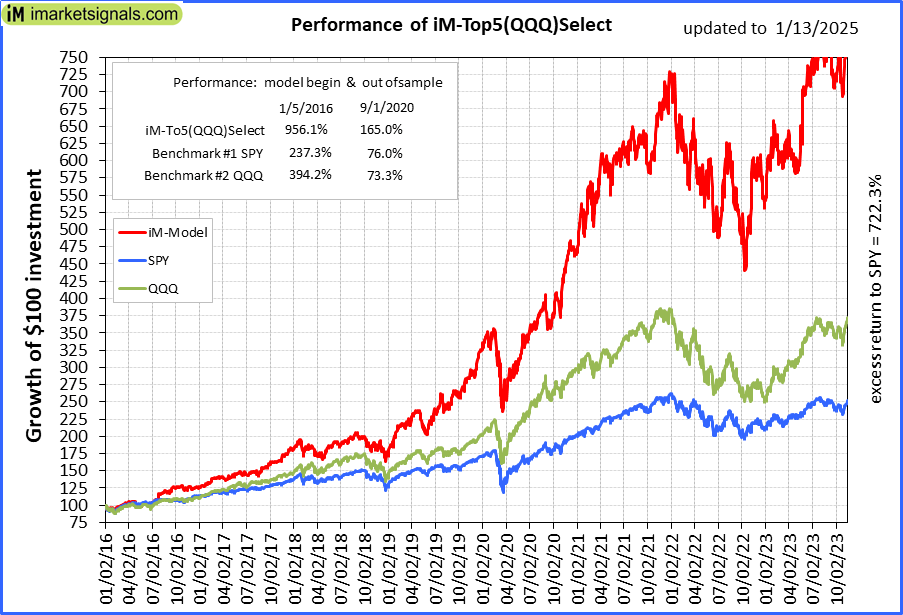 |
iM-Top5(QQQ)Select: Since inception, on 1/5/2016, the model gained 954.85% while the benchmark SPY gained 232.57% over the same period. Over the previous week the market value of iM-Top5(QQQ)Select gained -1.21% at a time when SPY gained -2.35%. A starting capital of $100,000 at inception on 1/5/2016 would have grown to $1,054,848 which includes $6,314 cash and excludes $15,754 spent on fees and slippage. |
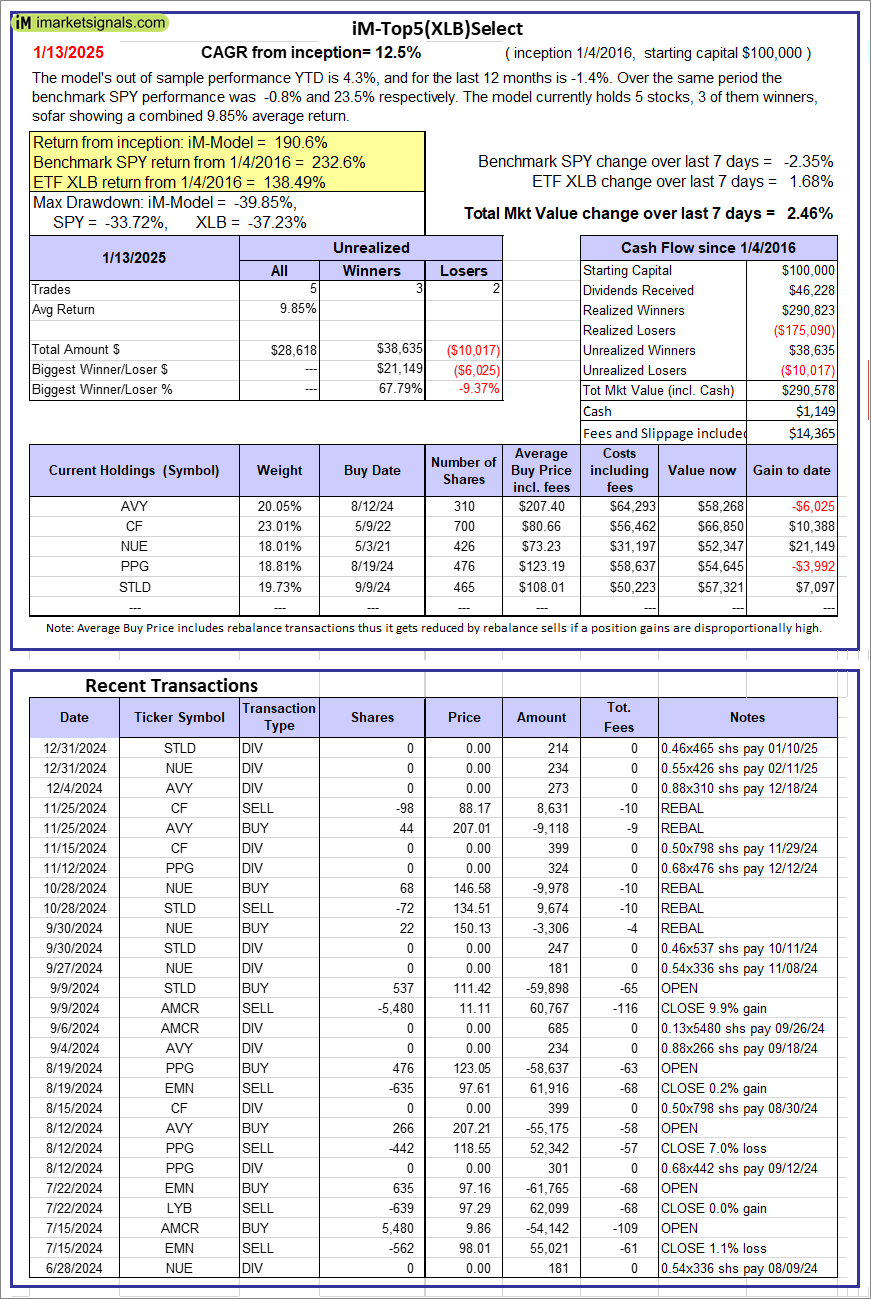 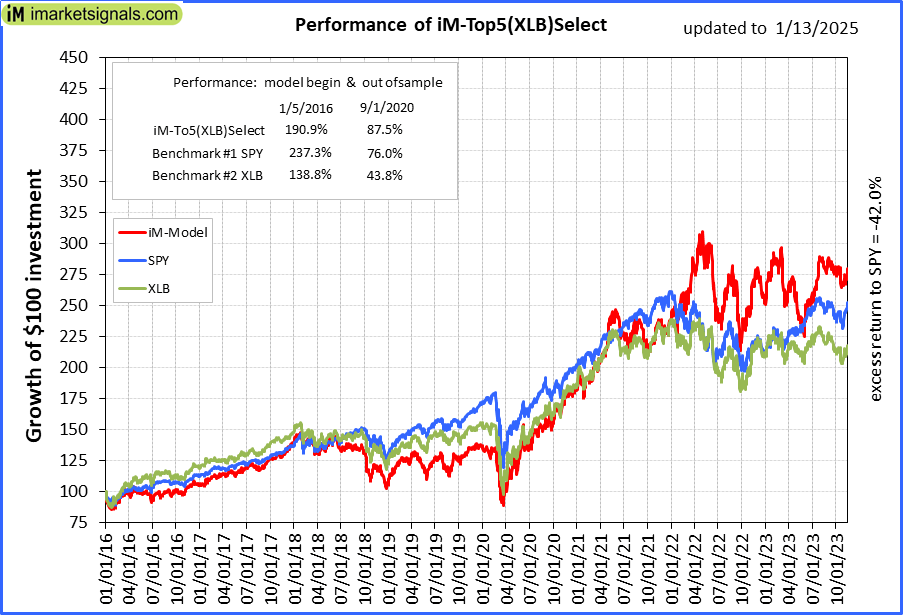 |
iM-Top5(XLB)Select: Since inception, on 1/5/2016, the model gained 190.58% while the benchmark SPY gained 232.57% over the same period. Over the previous week the market value of iM-Top5(XLB)Select gained 2.46% at a time when SPY gained -2.35%. A starting capital of $100,000 at inception on 1/5/2016 would have grown to $290,578 which includes $1,149 cash and excludes $14,365 spent on fees and slippage. |
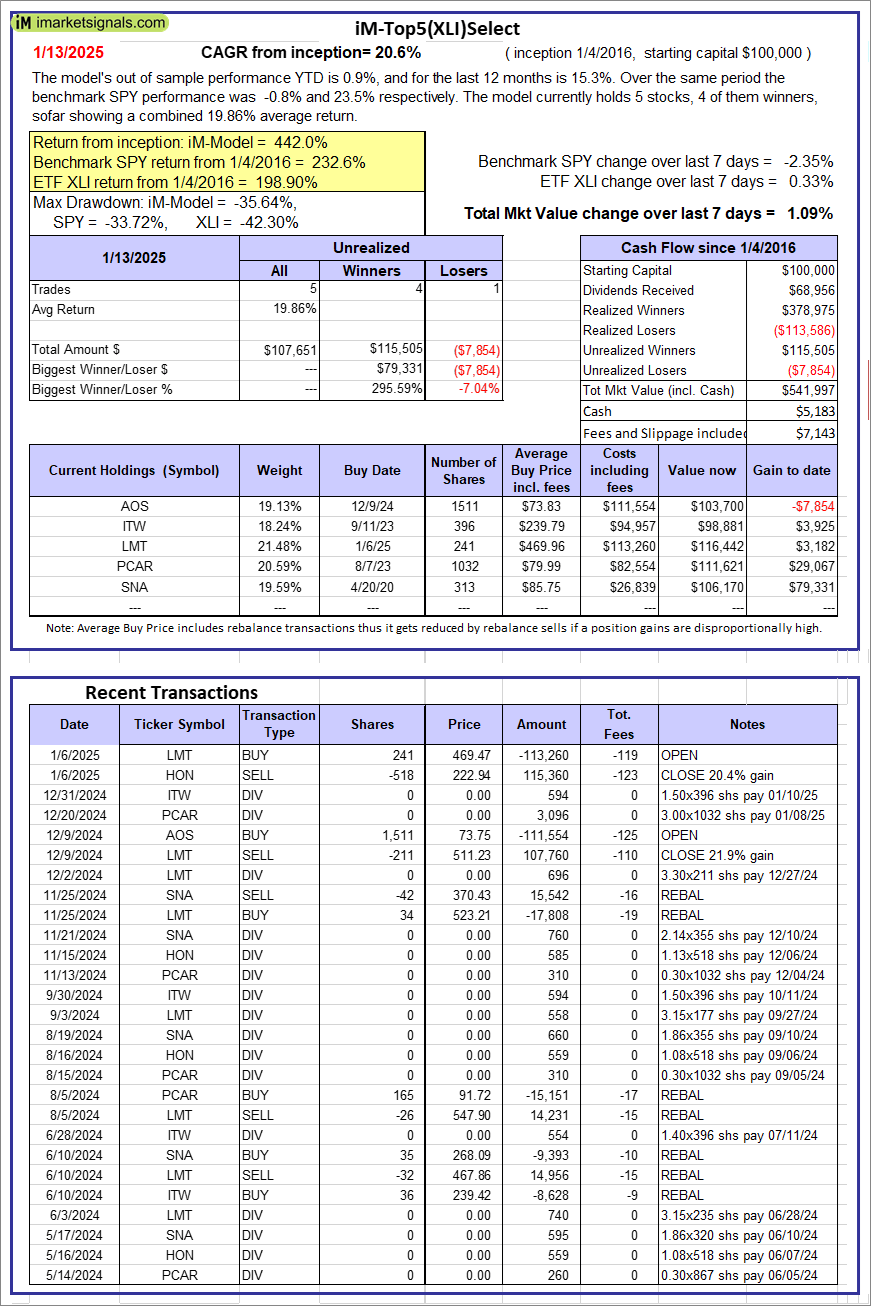 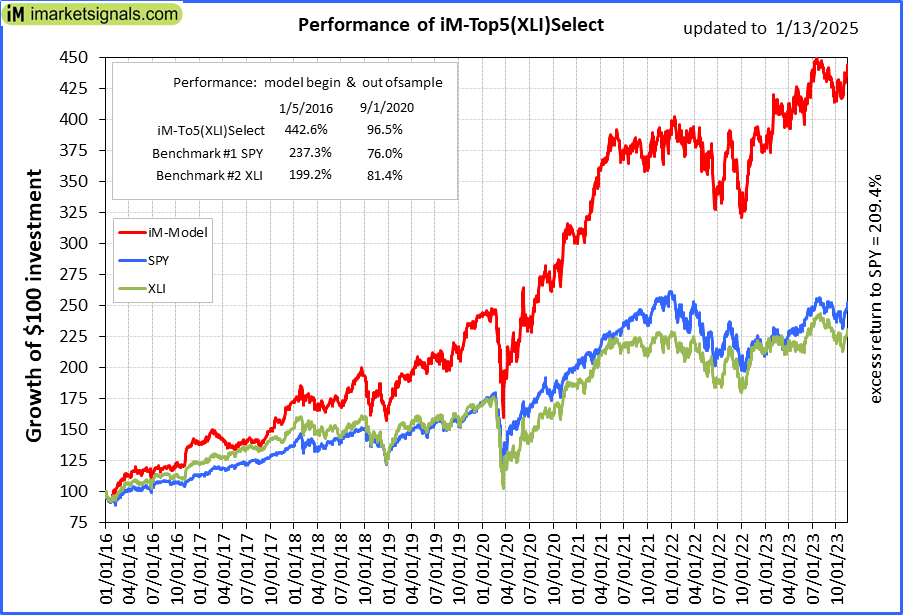 |
iM-Top5(XLI)Select: Since inception, on 1/5/2016, the model gained 442.00% while the benchmark SPY gained 232.57% over the same period. Over the previous week the market value of iM-Top5(XLI)Select gained 1.09% at a time when SPY gained -2.35%. A starting capital of $100,000 at inception on 1/5/2016 would have grown to $541,997 which includes $5,183 cash and excludes $7,143 spent on fees and slippage. |
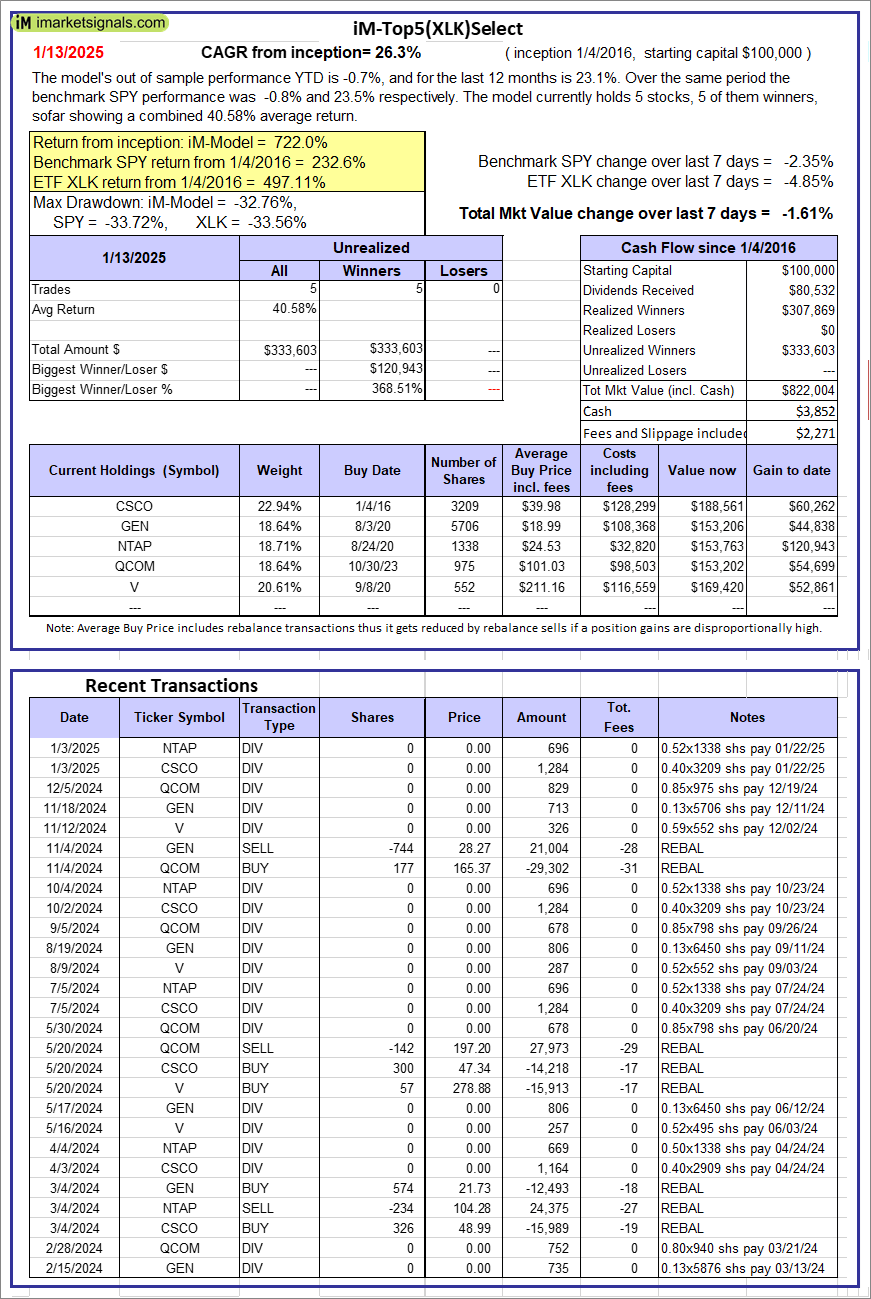 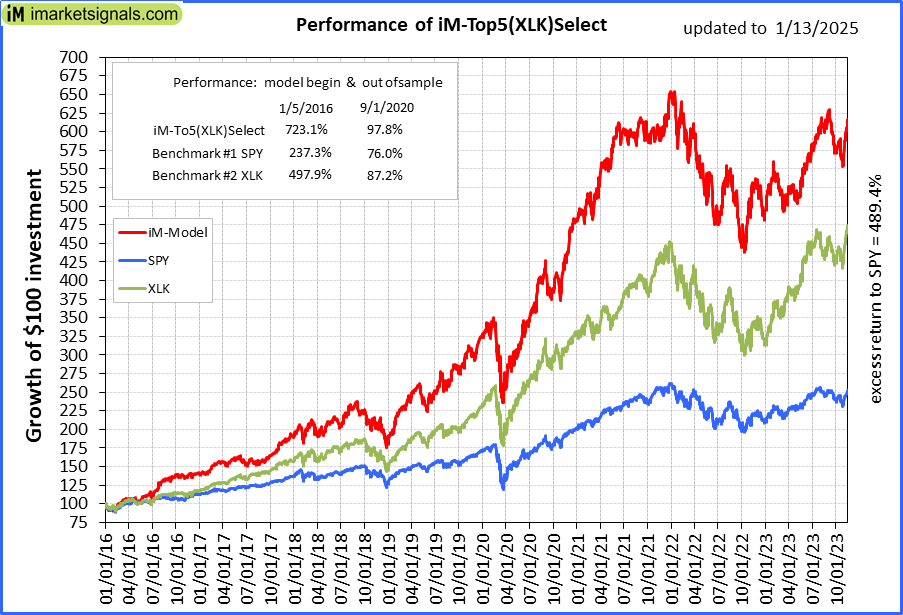 |
iM-Top5(XLK)Select: Since inception, on 1/5/2016, the model gained 722.00% while the benchmark SPY gained 232.57% over the same period. Over the previous week the market value of iM-Top5(XLK)Select gained -1.61% at a time when SPY gained -2.35%. A starting capital of $100,000 at inception on 1/5/2016 would have grown to $822,004 which includes $3,852 cash and excludes $2,271 spent on fees and slippage. |
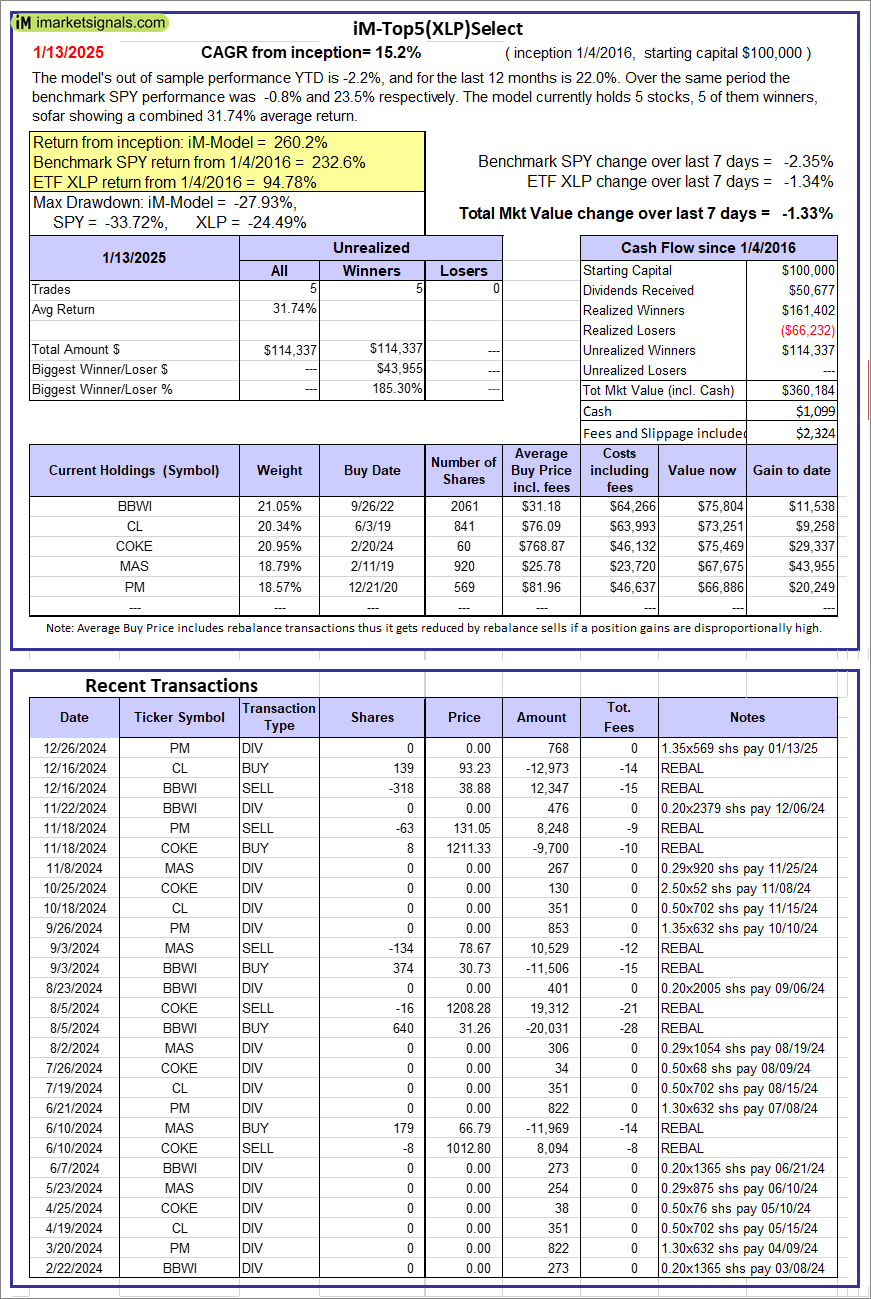 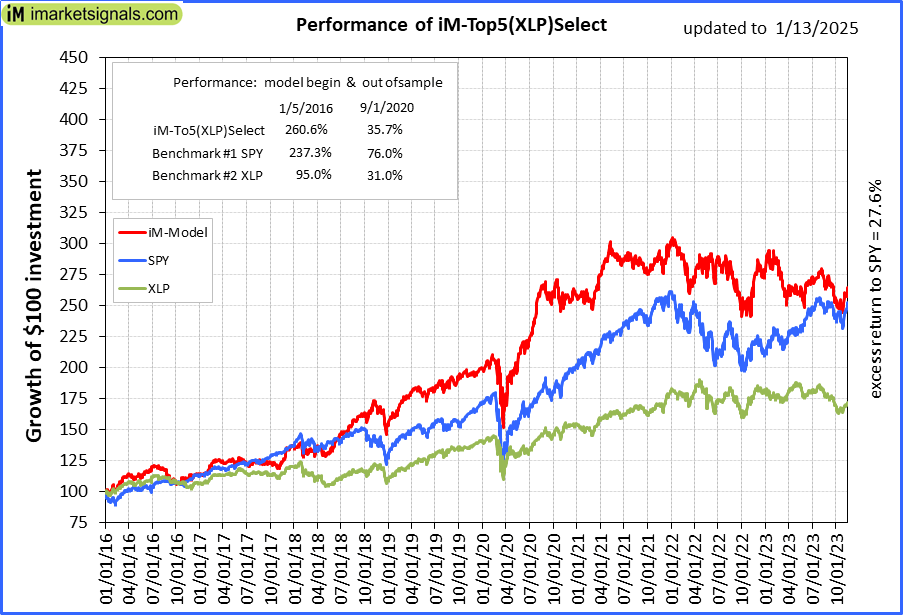 |
iM-Top5(XLP)Select: Since inception, on 1/5/2016, the model gained 260.18% while the benchmark SPY gained 232.57% over the same period. Over the previous week the market value of iM-Top5(XLP)Select gained -1.33% at a time when SPY gained -2.35%. A starting capital of $100,000 at inception on 1/5/2016 would have grown to $360,184 which includes $1,099 cash and excludes $2,324 spent on fees and slippage. |
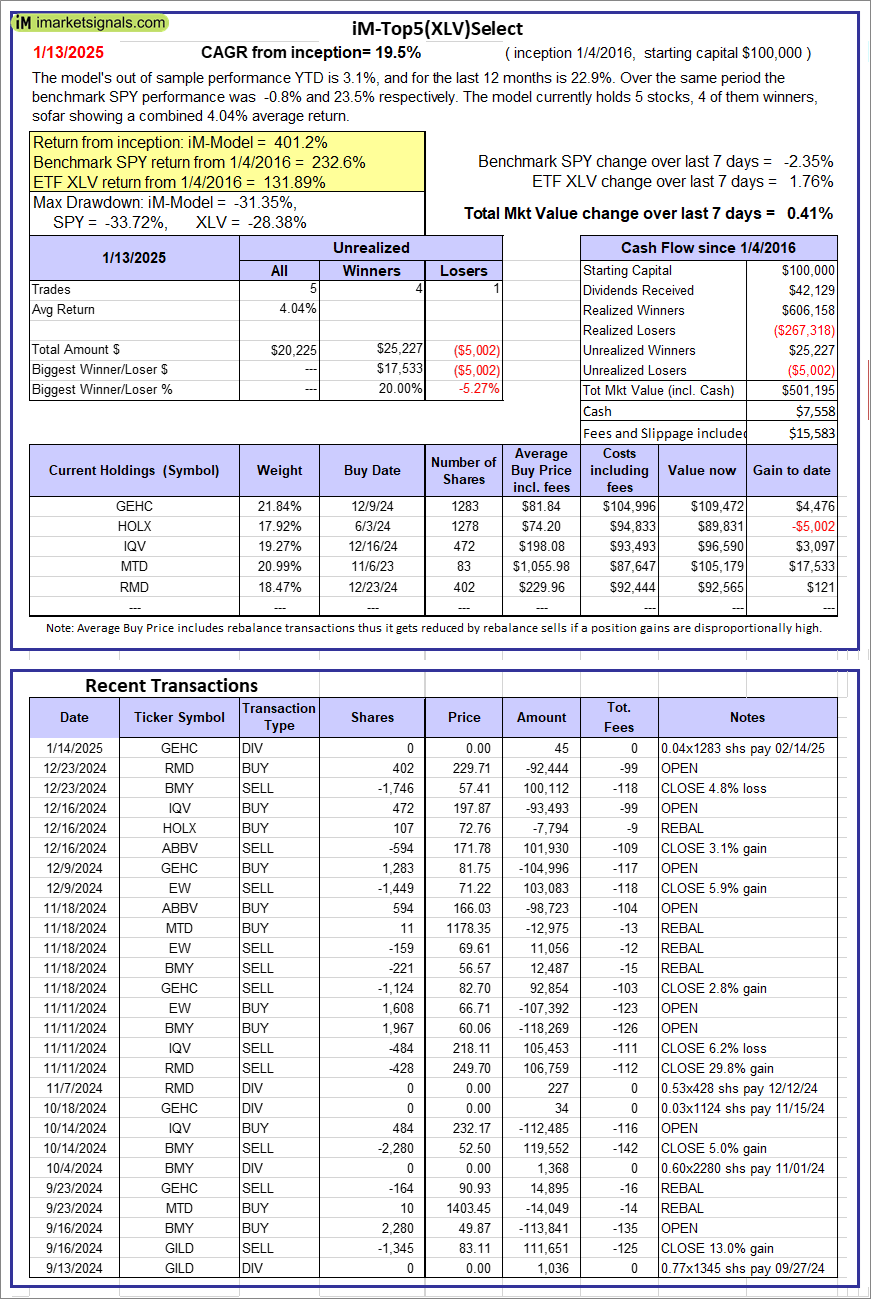 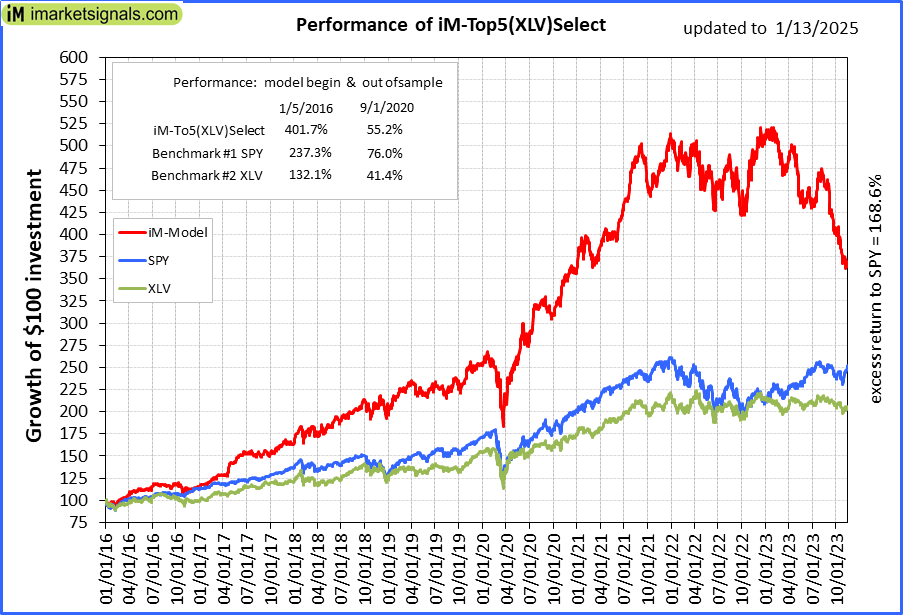 |
iM-Top5(XLV)Select: Since inception, on 1/5/2016, the model gained 401.19% while the benchmark SPY gained 232.57% over the same period. Over the previous week the market value of iM-Top5(XLV)Select gained 0.41% at a time when SPY gained -2.35%. A starting capital of $100,000 at inception on 1/5/2016 would have grown to $501,195 which includes $7,558 cash and excludes $15,583 spent on fees and slippage. |
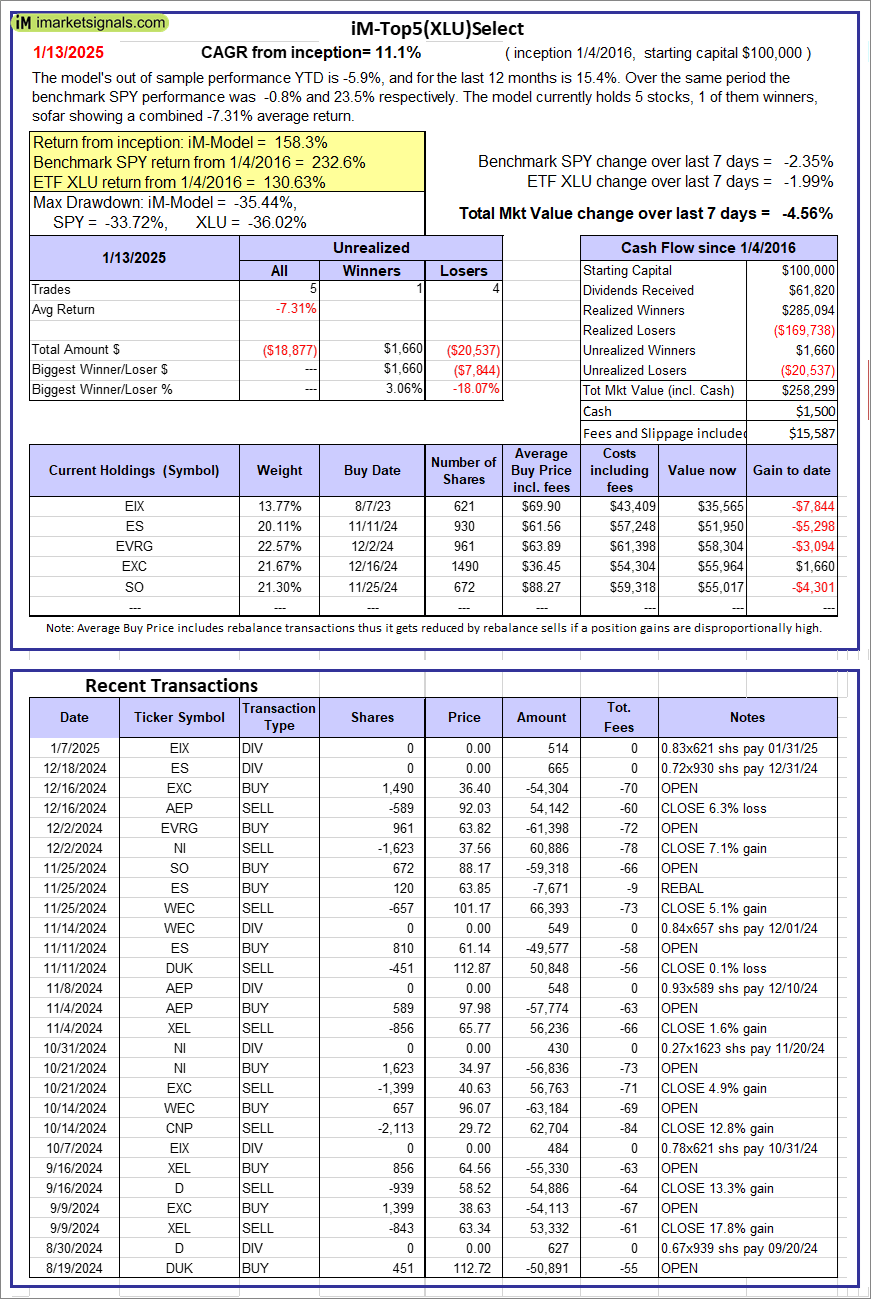 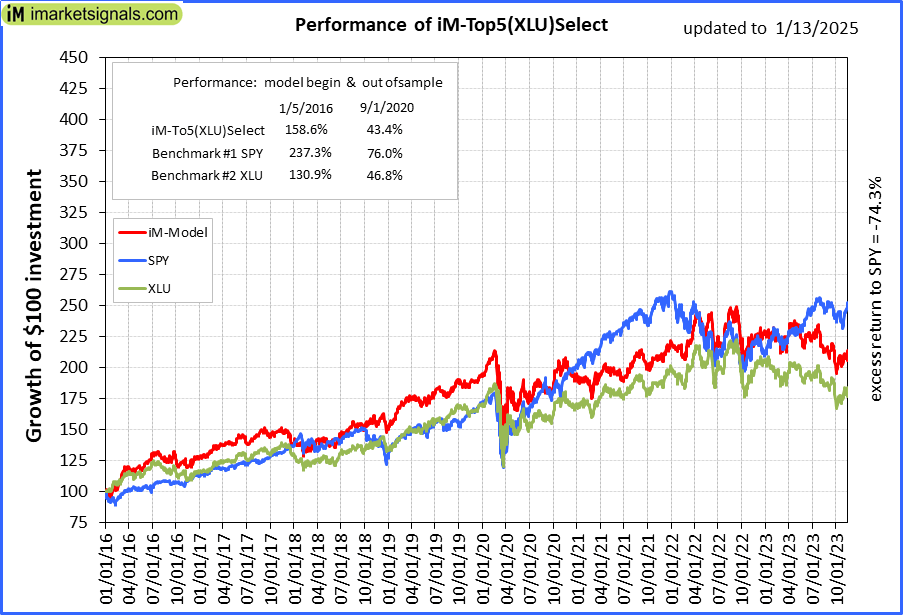 |
iM-Top5(XLU)Select: Since inception, on 1/5/2016, the model gained 158.30% while the benchmark SPY gained 232.57% over the same period. Over the previous week the market value of iM-Top5(XLU)Select gained -4.56% at a time when SPY gained -2.35%. A starting capital of $100,000 at inception on 1/5/2016 would have grown to $258,299 which includes $1,500 cash and excludes $15,587 spent on fees and slippage. |
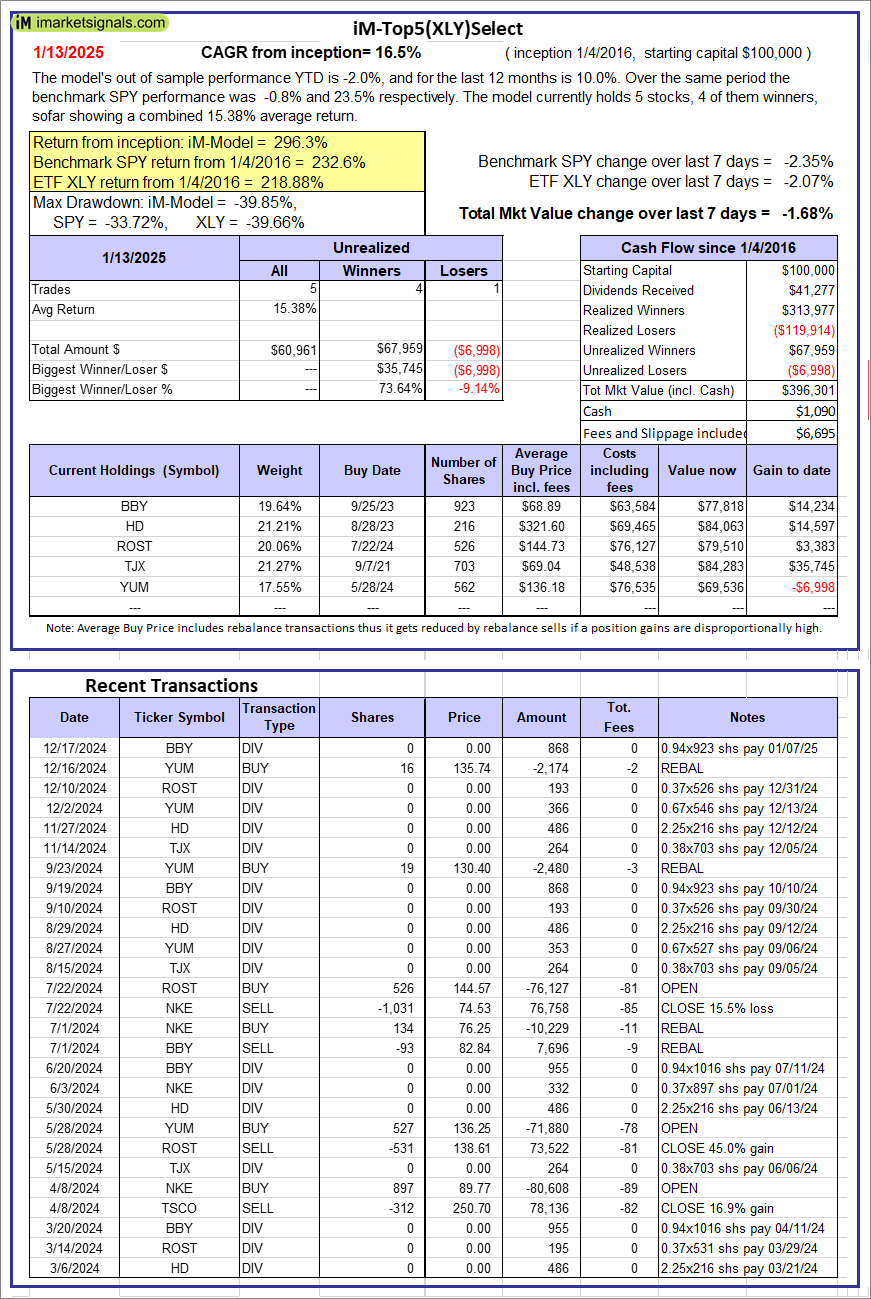 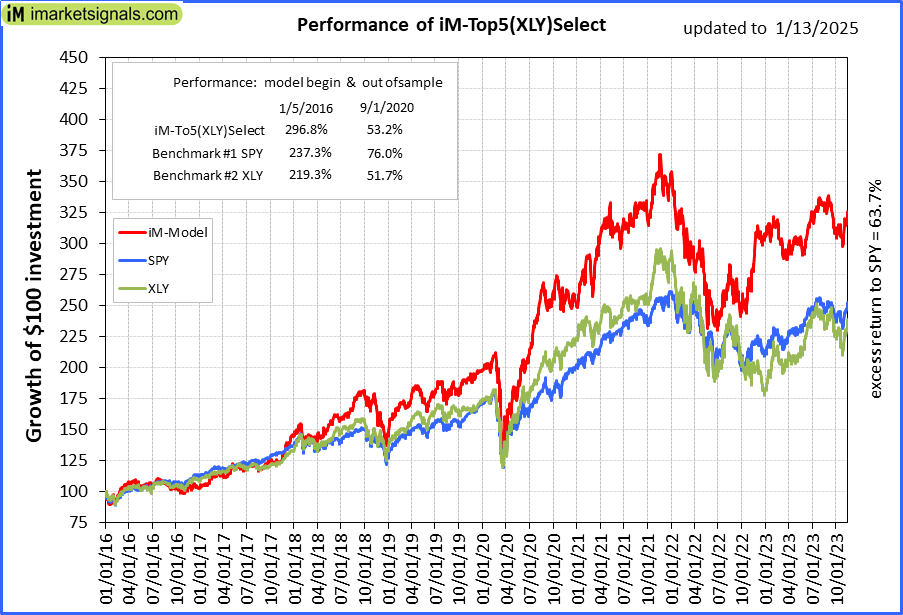 |
iM-Top5(XLY)Select: Since inception, on 1/5/2016, the model gained 296.30% while the benchmark SPY gained 232.57% over the same period. Over the previous week the market value of iM-Top5(XLY)Select gained -1.68% at a time when SPY gained -2.35%. A starting capital of $100,000 at inception on 1/5/2016 would have grown to $396,301 which includes $1,090 cash and excludes $6,695 spent on fees and slippage. |
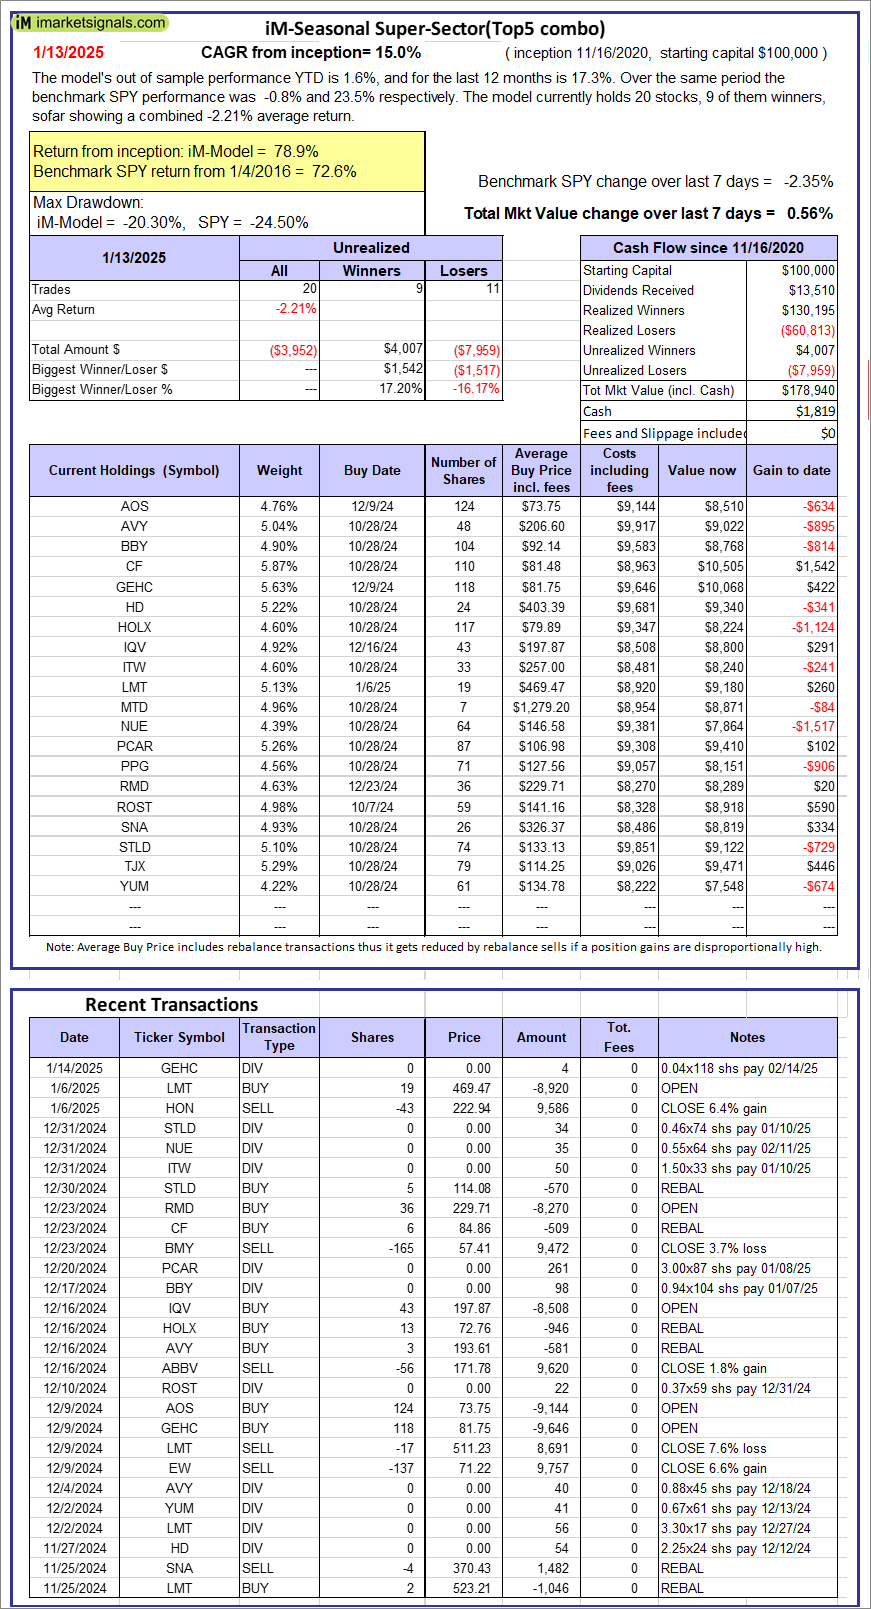 |
iM-Seasonal Super-Sectors (Top5 combo) : Since inception, on 11/17/2020, the model gained 78.94% while the benchmark SPY gained 72.64% over the same period. Over the previous week the market value of iM-Seasonal Super-Sectors (Top5 combo) gained 0.56% at a time when SPY gained -2.35%. A starting capital of $100,000 at inception on 11/17/2020 would have grown to $178,940 which includes $1,819 cash and excludes $00 spent on fees and slippage. |
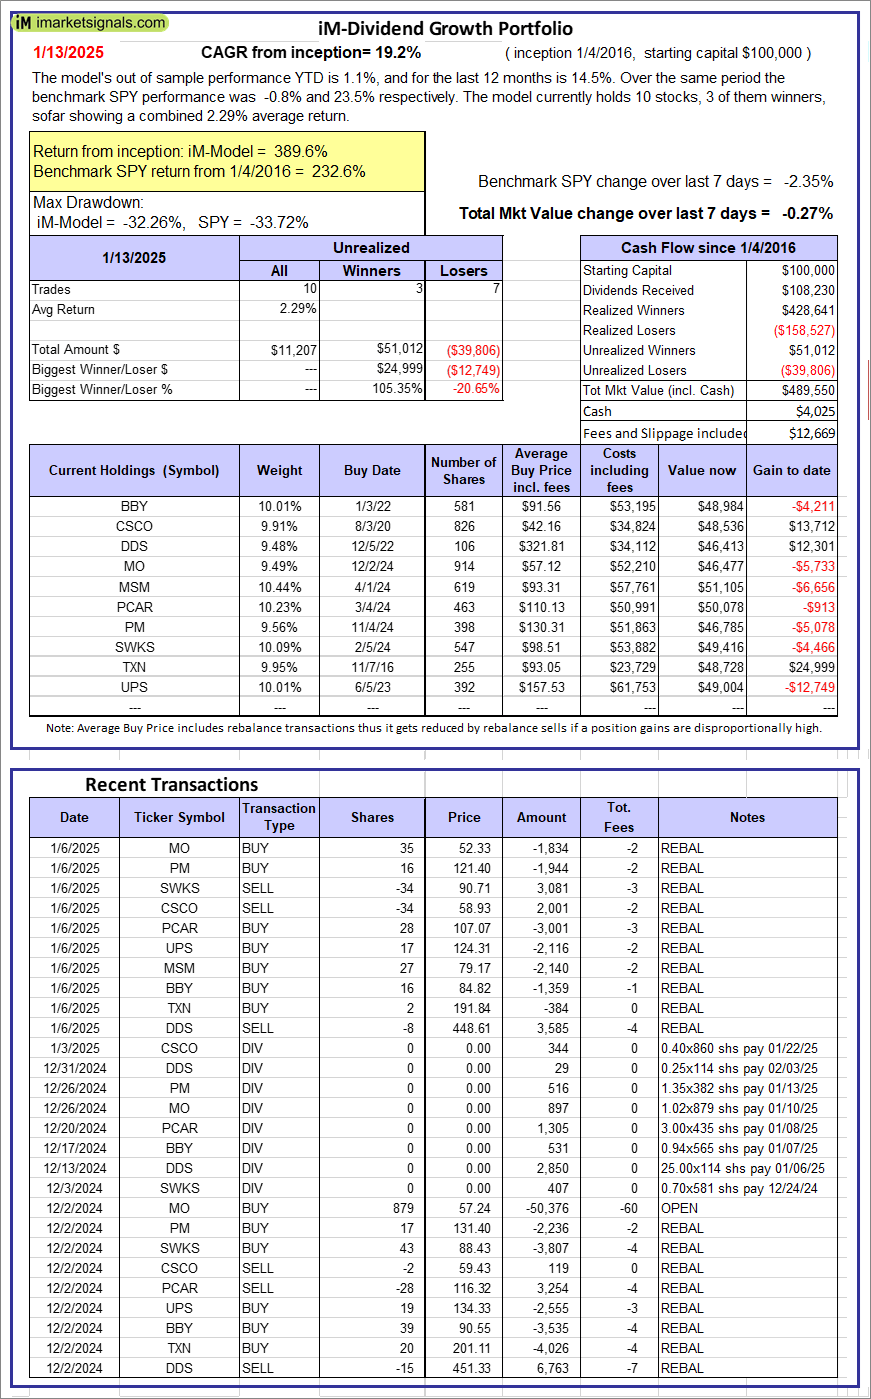 |
iM-Dividend Growth Portfolio: The model’s out of sample performance YTD is 1.1%, and for the last 12 months is 14.5%. Over the same period the benchmark SPY performance was -0.8% and 23.5% respectively. Over the previous week the market value of the iM-Dividend Growth Portfolio gained -0.27% at a time when SPY gained -2.35%. A starting capital of $100,000 at inception on 6/30/2016 would have grown to $489,550 which includes $4,025 cash and excludes $12,669 spent on fees and slippage. |
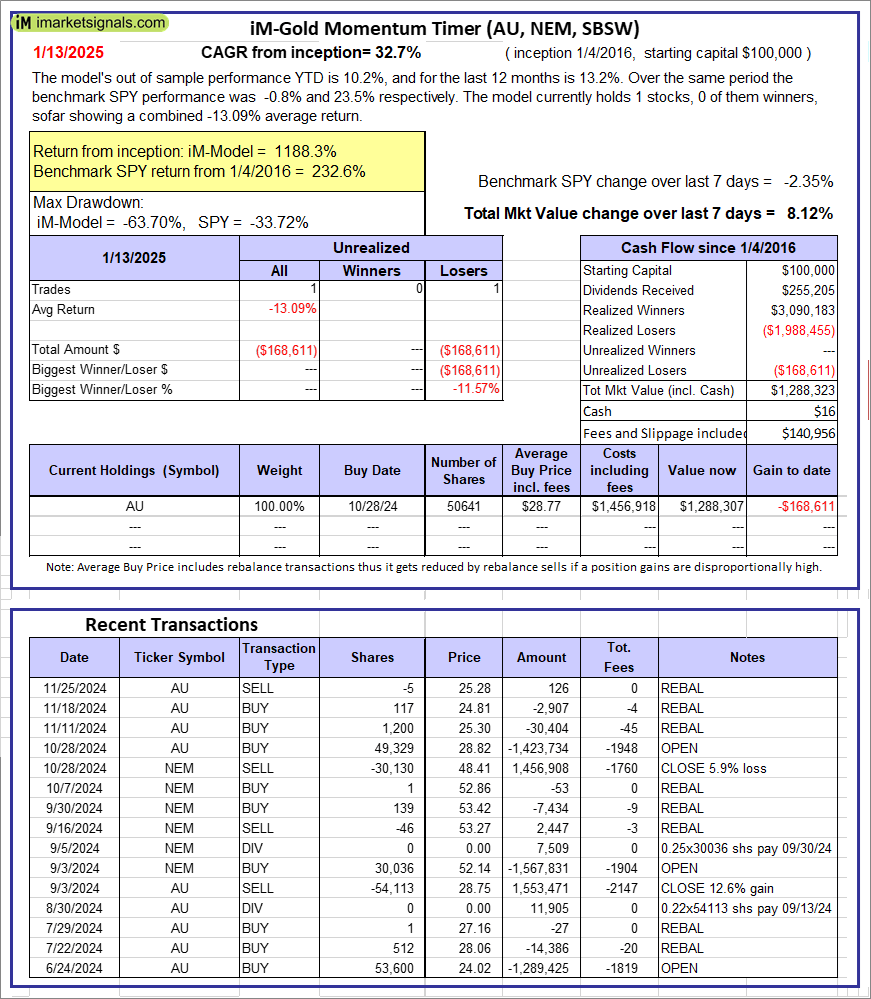 |
iM-Gold Momentum Timer (AU, NEM, SBSW): The model’s out of sample performance YTD is 10.2%, and for the last 12 months is 13.2%. Over the same period the benchmark SPY performance was -0.8% and 23.5% respectively. Over the previous week the market value of iM-Gold Momentum Timer (AU, NEM, SBSW) gained 8.12% at a time when SPY gained -2.35%. A starting capital of $100,000 at inception on 6/30/2016 would have grown to $16 which includes $140,956 cash and excludes Gain to date spent on fees and slippage. |
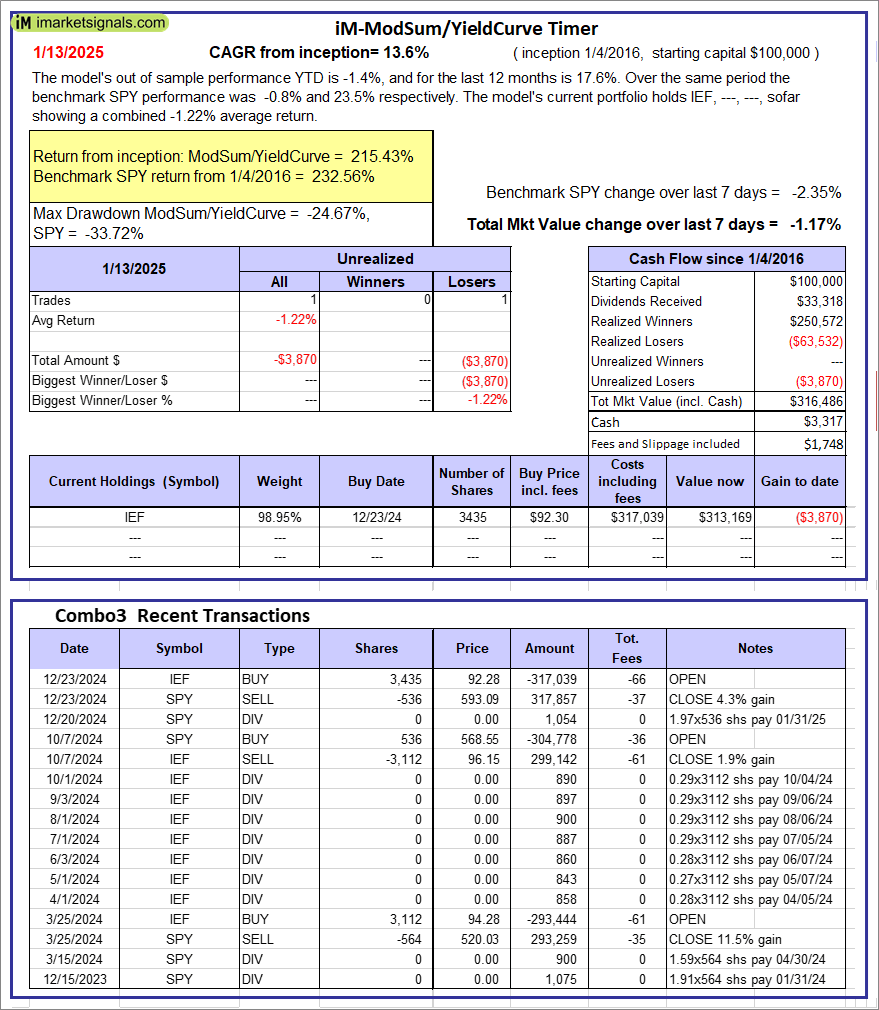 |
iM-ModSum/YieldCurve Timer: The model’s out of sample performance YTD is -1.4%, and for the last 12 months is 17.6%. Over the same period the benchmark SPY performance was -0.8% and 23.5% respectively. Over the previous week the market value of iM-PortSum/YieldCurve Timer gained -1.17% at a time when SPY gained -2.35%. A starting capital of $100,000 at inception on 1/1/2016 would have grown to $316,486 which includes $3,317 cash and excludes $1,748 spent on fees and slippage. |
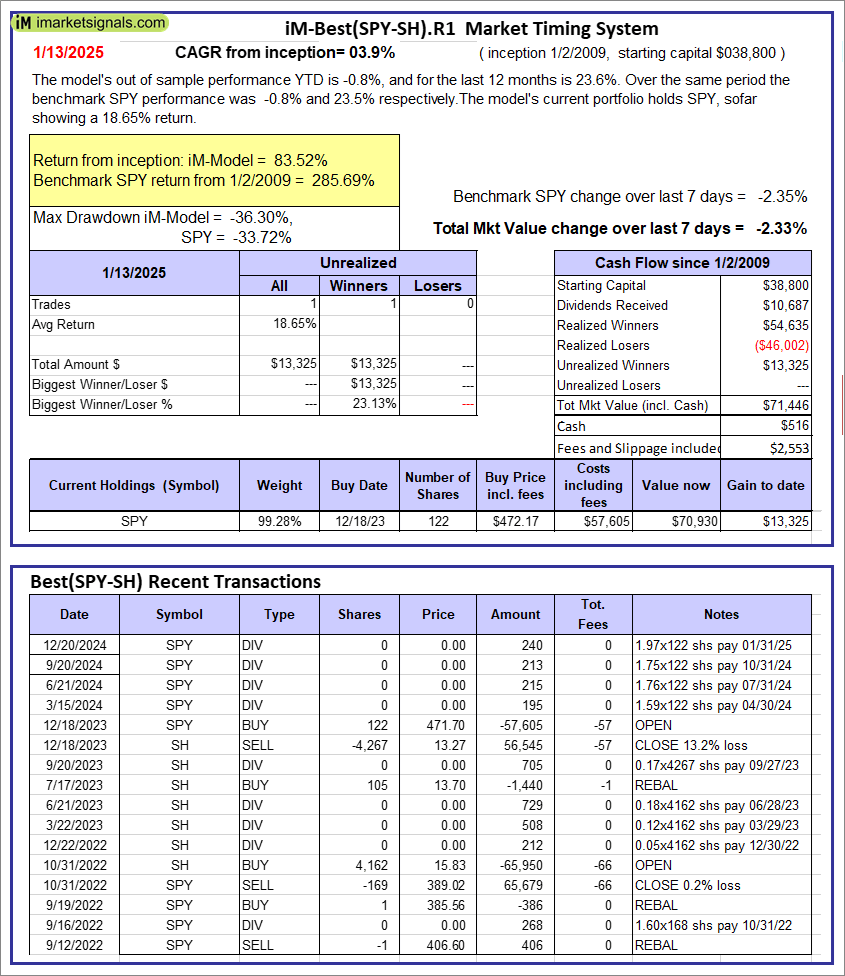 |
iM-Best(SPY-SH).R1: The model’s out of sample performance YTD is -0.8%, and for the last 12 months is 23.6%. Over the same period the benchmark SPY performance was -0.8% and 23.5% respectively. Over the previous week the market value of Best(SPY-SH) gained -2.33% at a time when SPY gained -2.35%. A starting capital of $100,000 at inception on 1/2/2009 would have grown to $71,446 which includes $516 cash and excludes $2,553 spent on fees and slippage. |
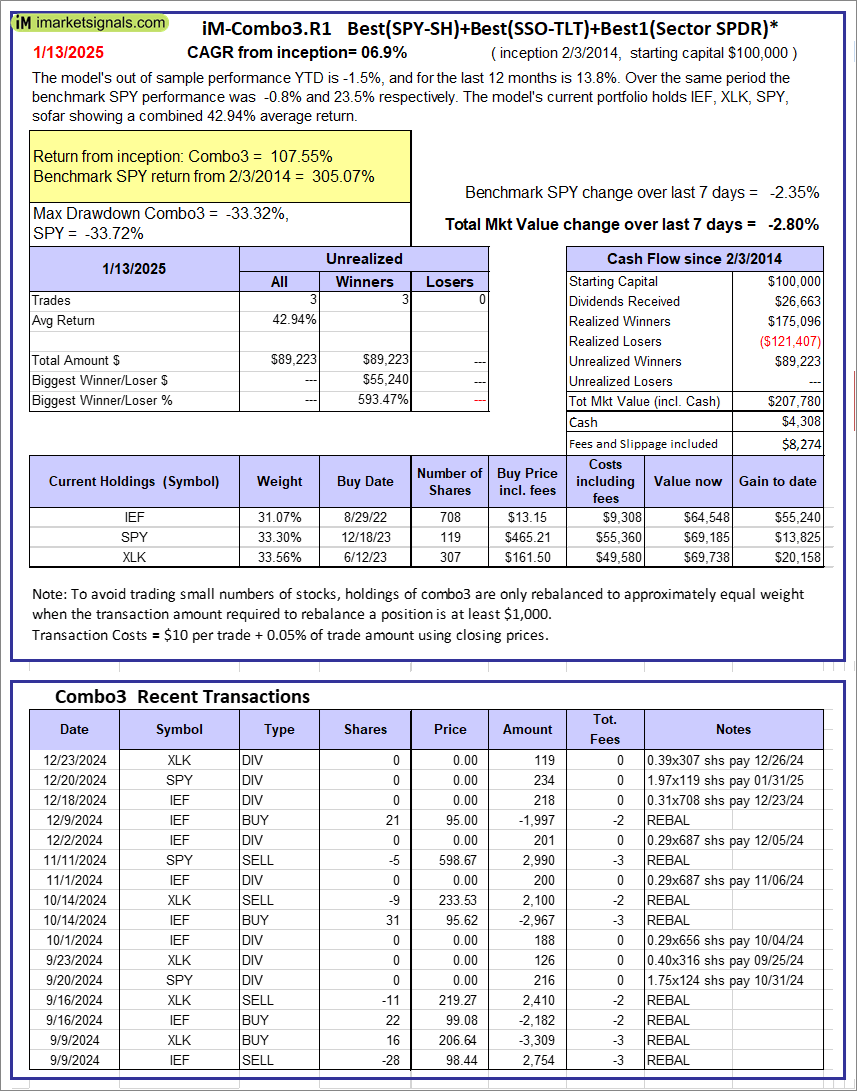 |
iM-Combo3.R1: The model’s out of sample performance YTD is -1.5%, and for the last 12 months is 13.8%. Over the same period the benchmark SPY performance was -0.8% and 23.5% respectively. Over the previous week the market value of iM-Combo3.R1 gained -2.80% at a time when SPY gained -2.35%. A starting capital of $100,000 at inception on 2/3/2014 would have grown to $207,780 which includes $4,308 cash and excludes $8,274 spent on fees and slippage. |
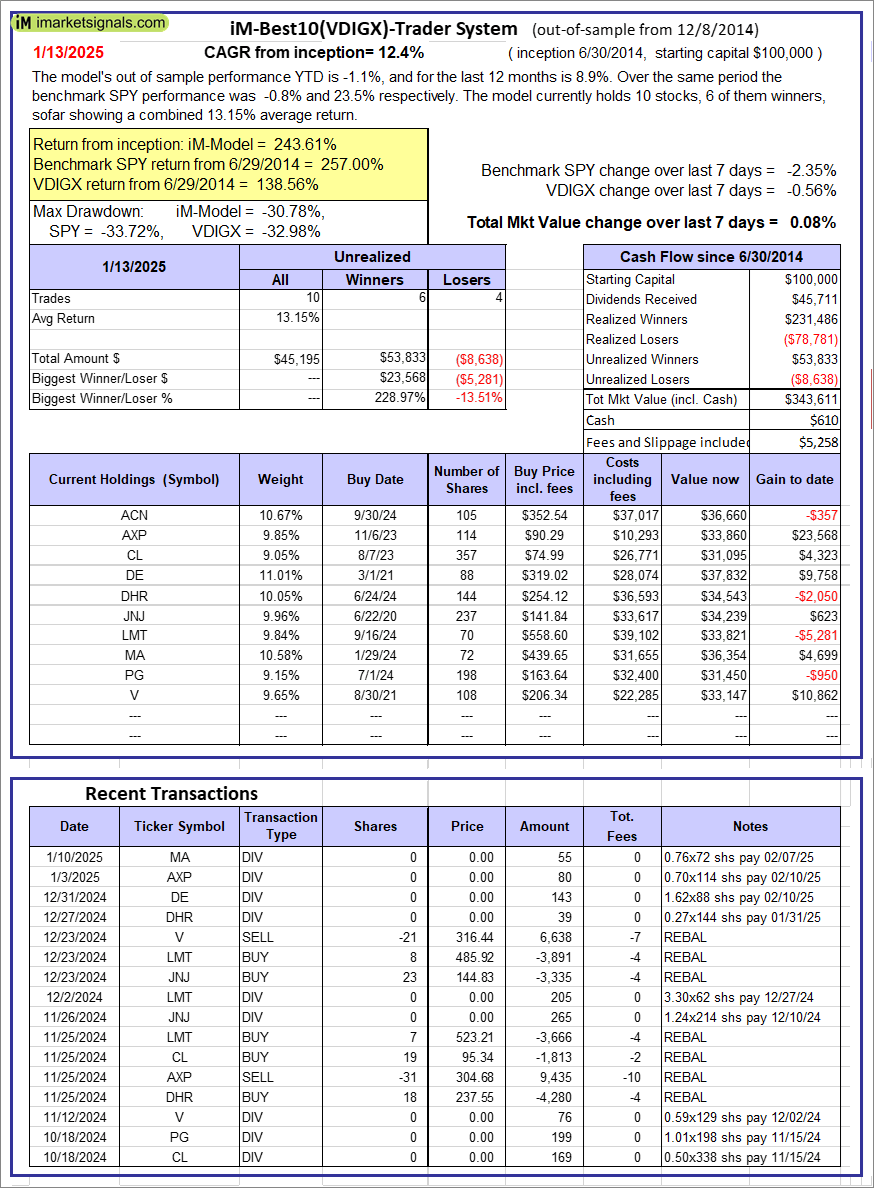 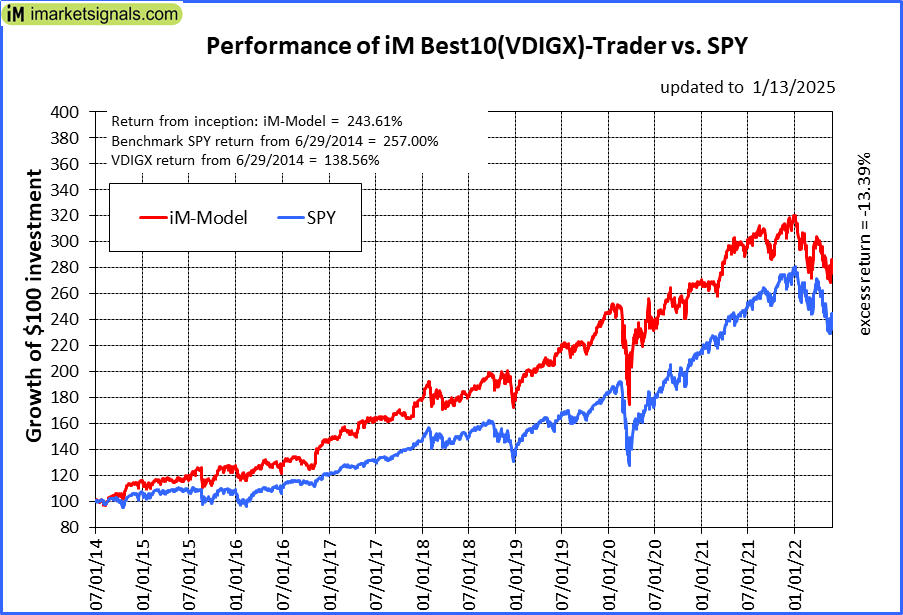 |
iM-Best10(VDIGX)-Trader: The model’s out of sample performance YTD is -1.1%, and for the last 12 months is 8.9%. Over the same period the benchmark SPY performance was -0.8% and 23.5% respectively. Since inception, on 7/1/2014, the model gained 243.61% while the benchmark SPY gained 257.00% and VDIGX gained 138.56% over the same period. Over the previous week the market value of iM-Best10(VDIGX) gained 0.08% at a time when SPY gained -2.35%. A starting capital of $100,000 at inception on 7/1/2014 would have grown to $343,611 which includes $610 cash and excludes $5,258 spent on fees and slippage. |
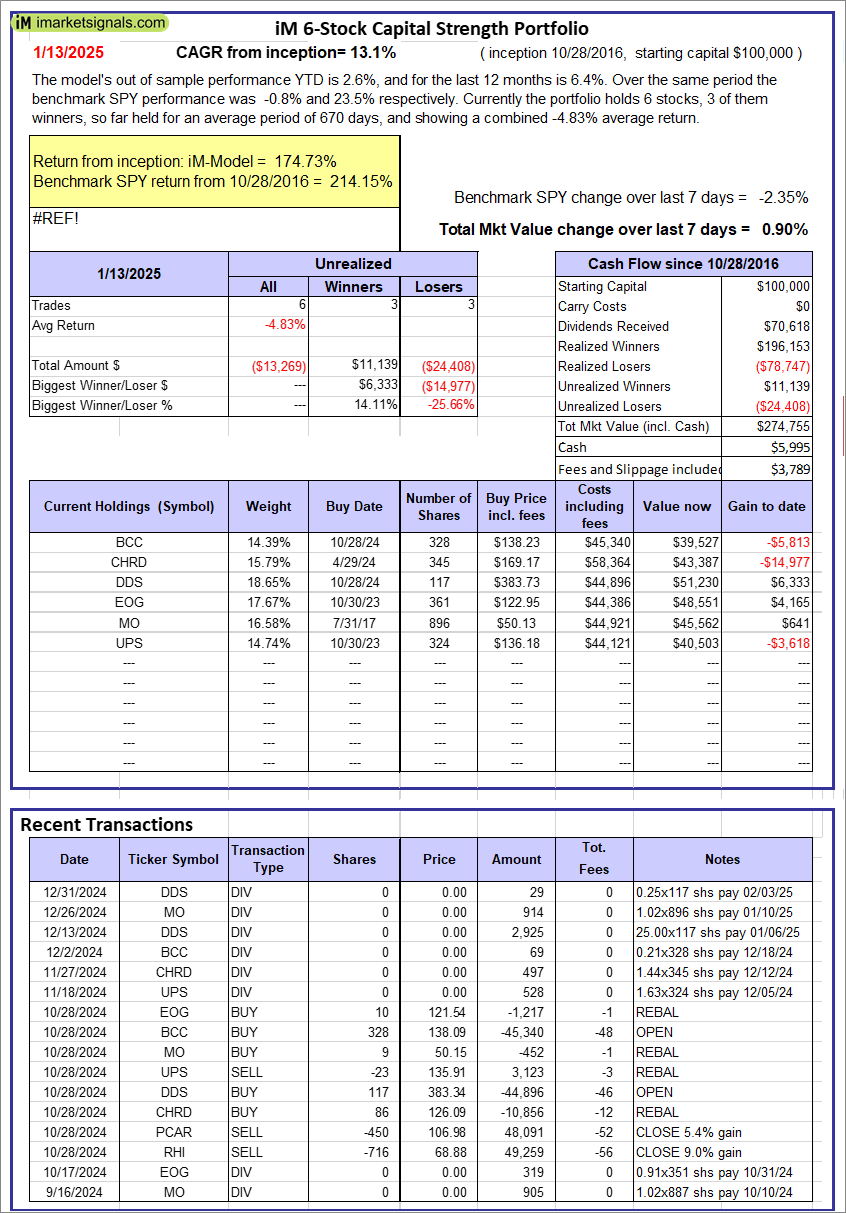 |
iM 6-Stock Capital Strength Portfolio: The model’s out of sample performance YTD is 2.6%, and for the last 12 months is 6.4%. Over the same period the benchmark SPY performance was -0.8% and 23.5% respectively. Over the previous week the market value of the iM 6-Stock Capital Strength Portfolio gained 0.90% at a time when SPY gained -2.35%. A starting capital of $100,000 at inception on 10/28/2016 would have grown to $274,755 which includes $5,995 cash and excludes $3,789 spent on fees and slippage. |
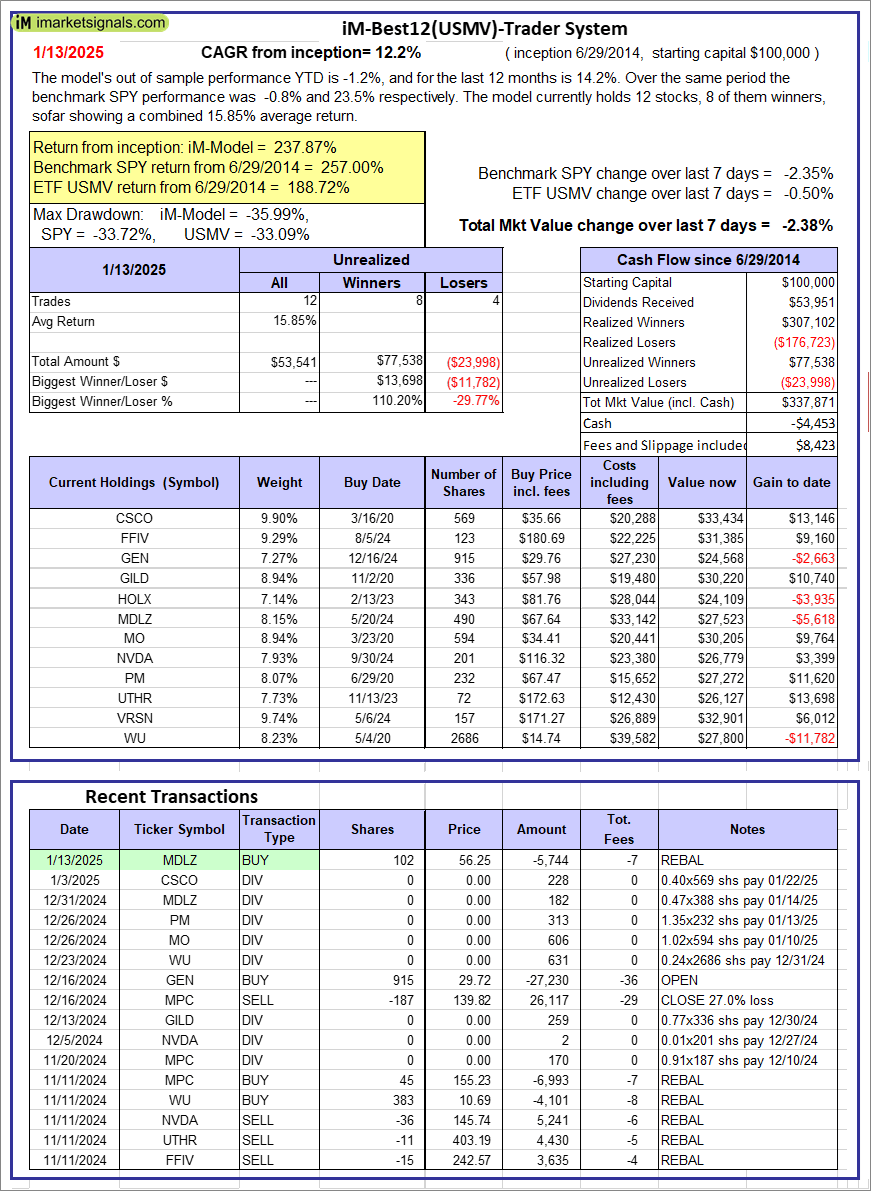 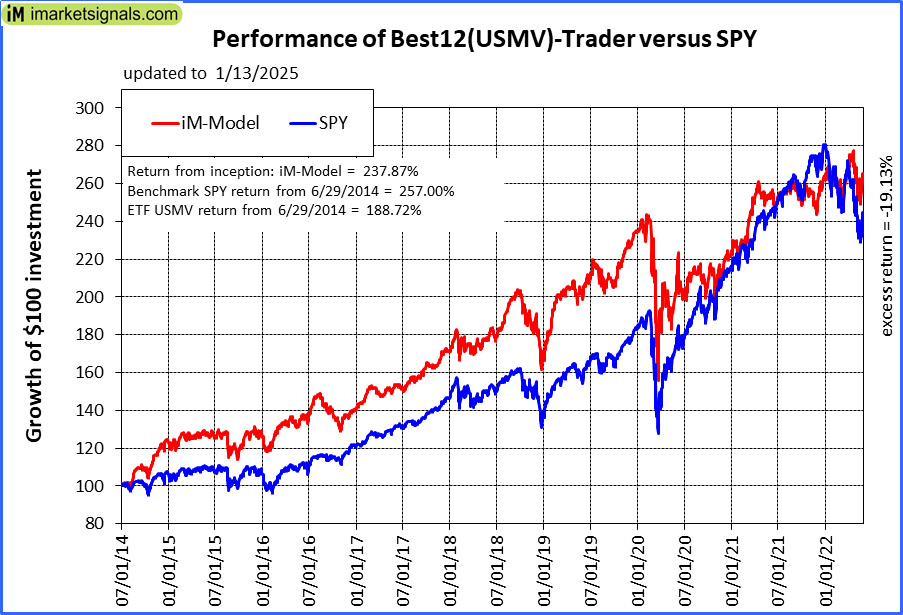 |
iM-Best12(USMV)-Trader: The model’s out of sample performance YTD is -1.2%, and for the last 12 months is 14.2%. Over the same period the benchmark SPY performance was -0.8% and 23.5% respectively. Since inception, on 6/30/2014, the model gained 237.87% while the benchmark SPY gained 257.00% and the ETF USMV gained 188.72% over the same period. Over the previous week the market value of iM-Best12(USMV)-Trader gained -2.38% at a time when SPY gained -2.35%. A starting capital of $100,000 at inception on 6/30/2014 would have grown to $337,871 which includes -$4,453 cash and excludes $8,423 spent on fees and slippage. |
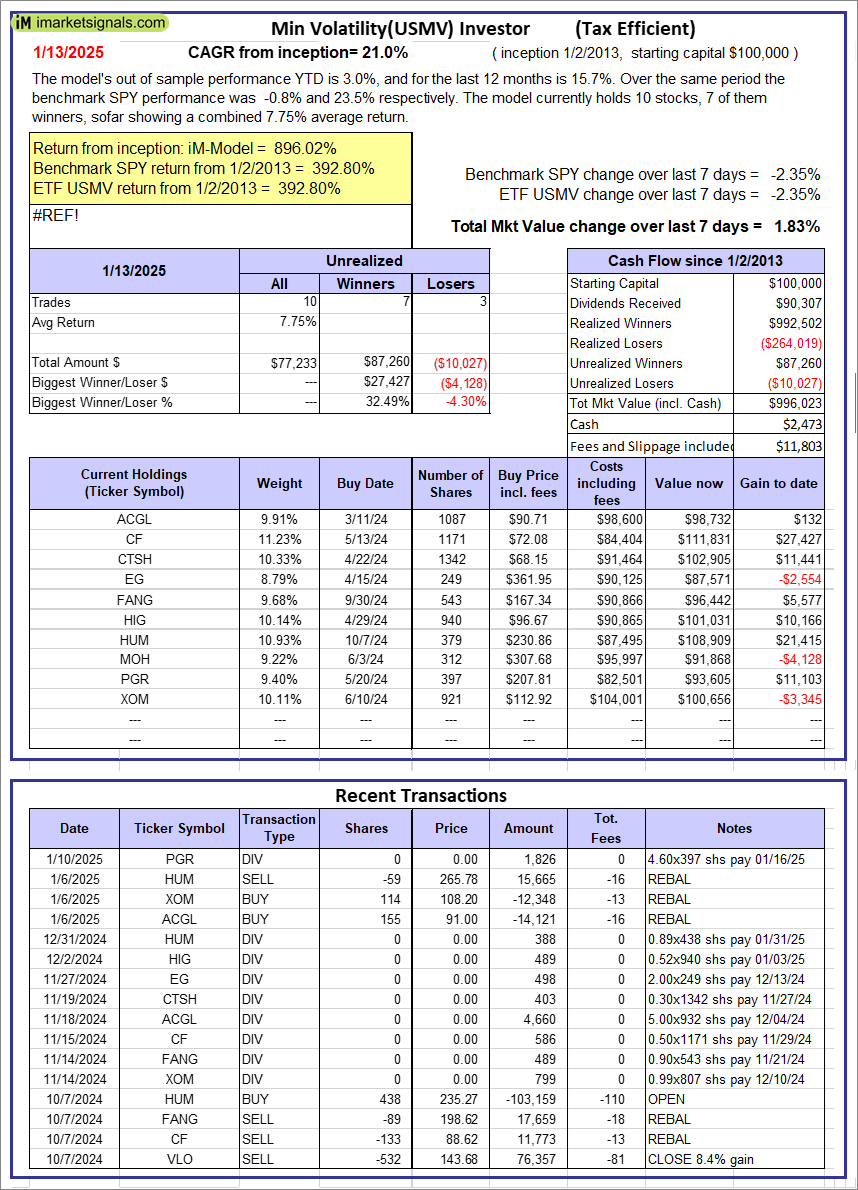 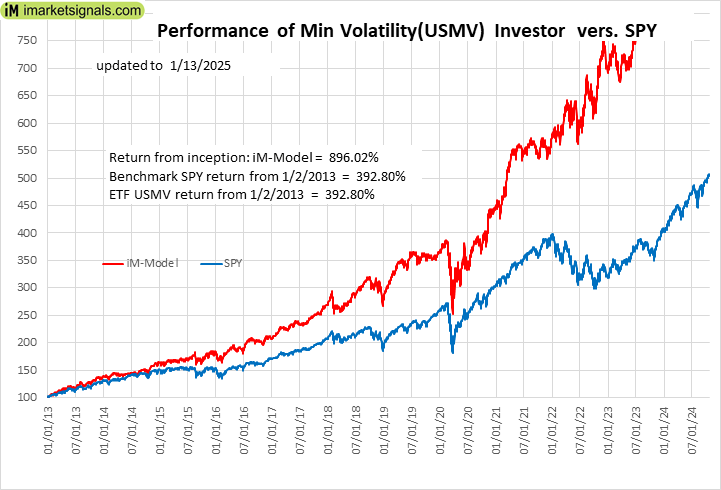 |
iM-Min Volatility(USMV) Investor (Tax Efficient): The model’s out of sample performance YTD is 3.0%, and for the last 12 months is 15.7%. Over the same period the benchmark SPY performance was -0.8% and 23.5% respectively. Since inception, on 1/3/2013, the model gained 896.02% while the benchmark SPY gained 392.80% and the ETF USMV gained 392.80% over the same period. Over the previous week the market value of iM-Best12(USMV)Q1 gained 1.83% at a time when SPY gained -2.35%. A starting capital of $100,000 at inception on 1/3/2013 would have grown to $996,023 which includes $2,473 cash and excludes $11,803 spent on fees and slippage. |
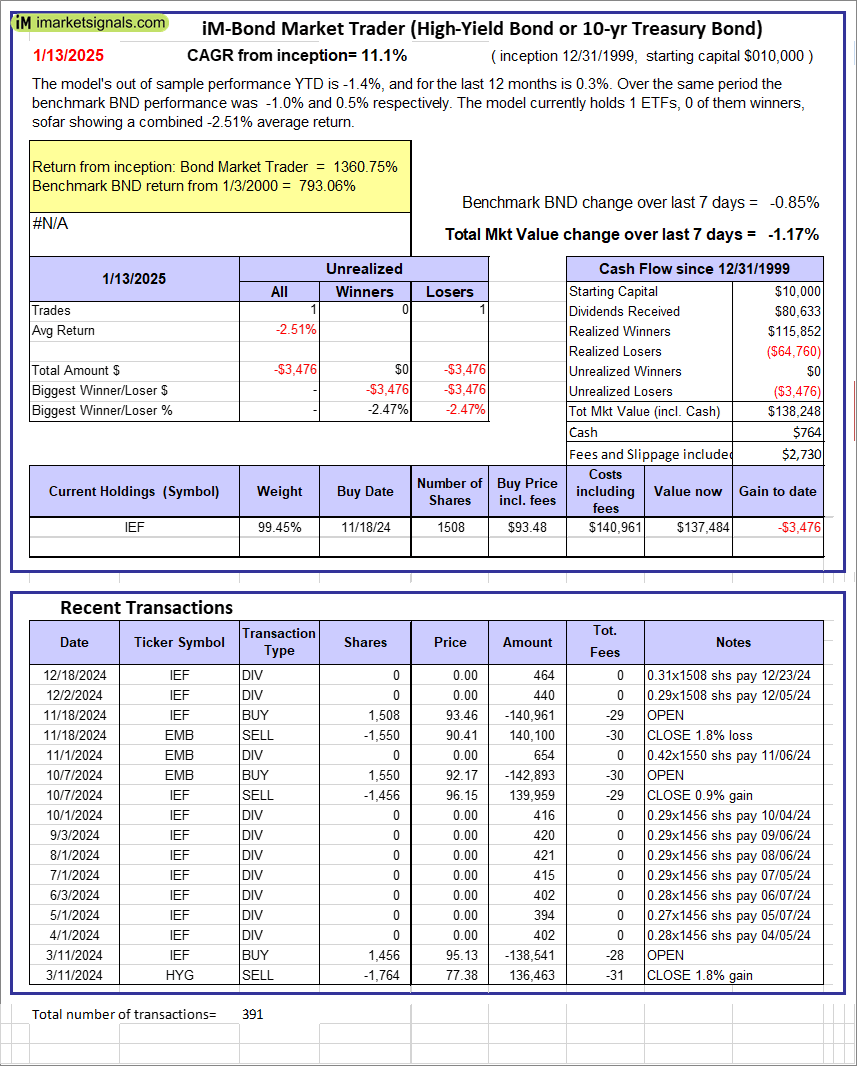 |
iM-Bond Market Trader (High-Yield Bond or 10-yr Treasury Bond): The model’s out of sample performance YTD is -1.4%, and for the last 12 months is 0.3%. Over the same period the benchmark BND performance was -1.0% and 0.5% respectively. Over the previous week the market value of the iM-Bond Market Trader (High-Yield Bond or 10-yr Treasury Bond) gained -1.17% at a time when BND gained -0.85%. A starting capital of $10,000 at inception on 1/3/2000 would have grown to $138,248 which includes $764 cash and excludes $2,730 spent on fees and slippage. |
|
|
iM-ModSum/YieldCurve Timer: The model’s out of sample performance YTD is -1.4%, and for the last 12 months is 17.6%. Over the same period the benchmark SPY performance was -0.8% and 23.5% respectively. Over the previous week the market value of iM-PortSum/YieldCurve Timer gained -1.17% at a time when SPY gained -2.35%. A starting capital of $100,000 at inception on 1/1/2016 would have grown to $316,486 which includes $3,317 cash and excludes $1,748 spent on fees and slippage. |
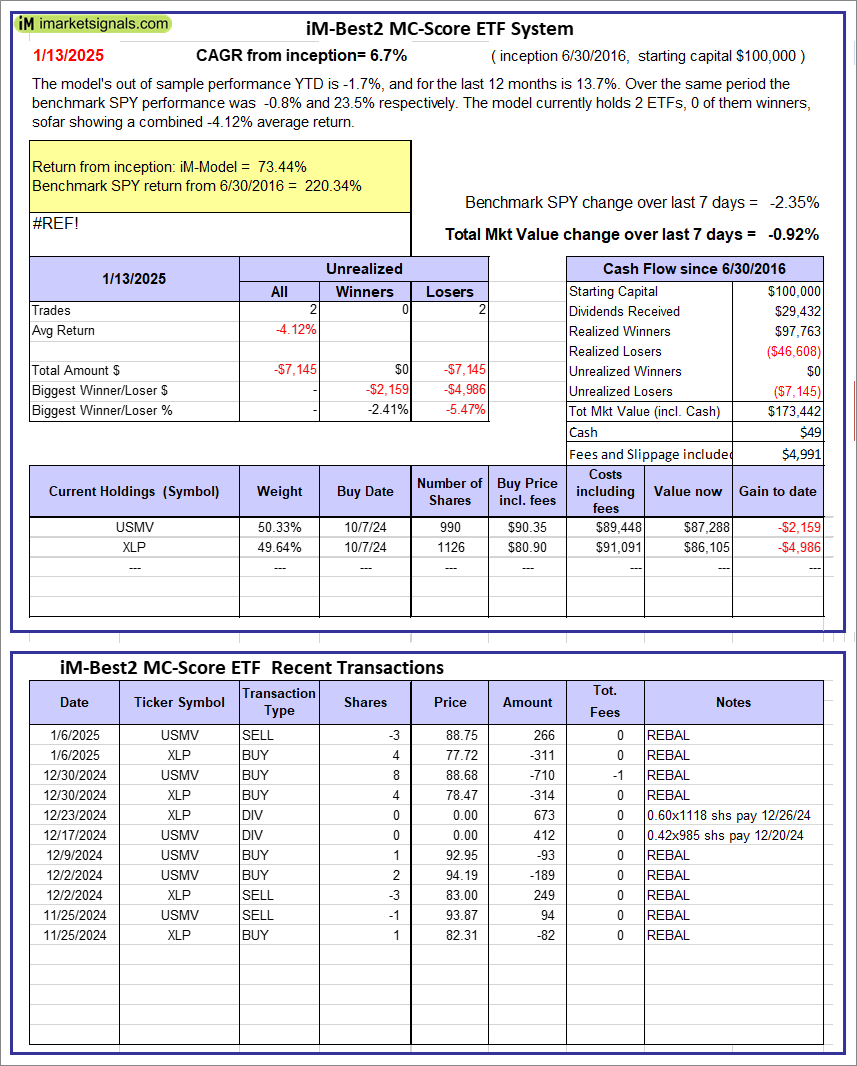 |
iM-Best2 MC-Score ETF System: The model’s out of sample performance YTD is -1.7%, and for the last 12 months is 13.7%. Over the same period the benchmark SPY performance was -0.8% and 23.5% respectively. Over the previous week the market value of the iM-Best2 MC-Score ETF System gained -0.92% at a time when SPY gained -2.35%. A starting capital of $100,000 at inception on 6/30/2016 would have grown to $173,442 which includes $49 cash and excludes $4,991 spent on fees and slippage. |
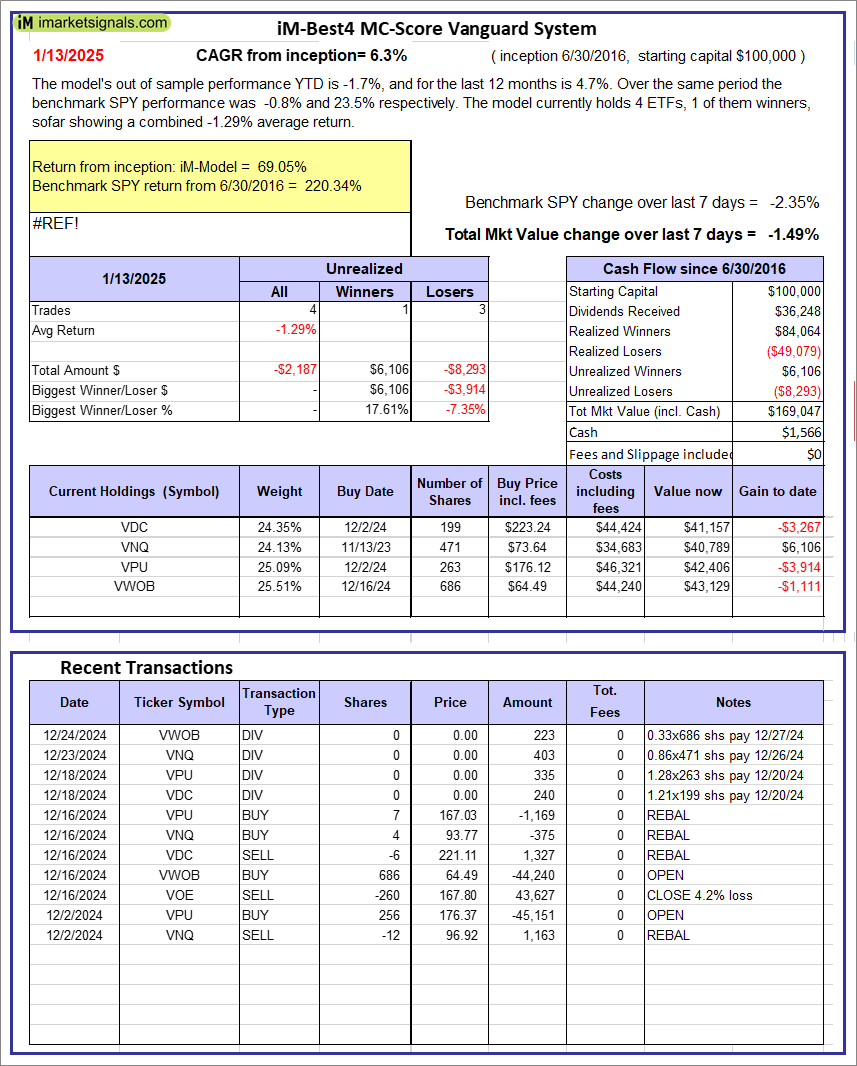 |
iM-Best4 MC-Score Vanguard System: The model’s out of sample performance YTD is -1.7%, and for the last 12 months is 4.7%. Over the same period the benchmark SPY performance was -0.8% and 23.5% respectively. Over the previous week the market value of the iM-Best4 MC-Score Vanguard System gained -1.49% at a time when SPY gained -2.35%. A starting capital of $100,000 at inception on 6/30/2016 would have grown to $169,047 which includes $1,566 cash and excludes $00 spent on fees and slippage. |
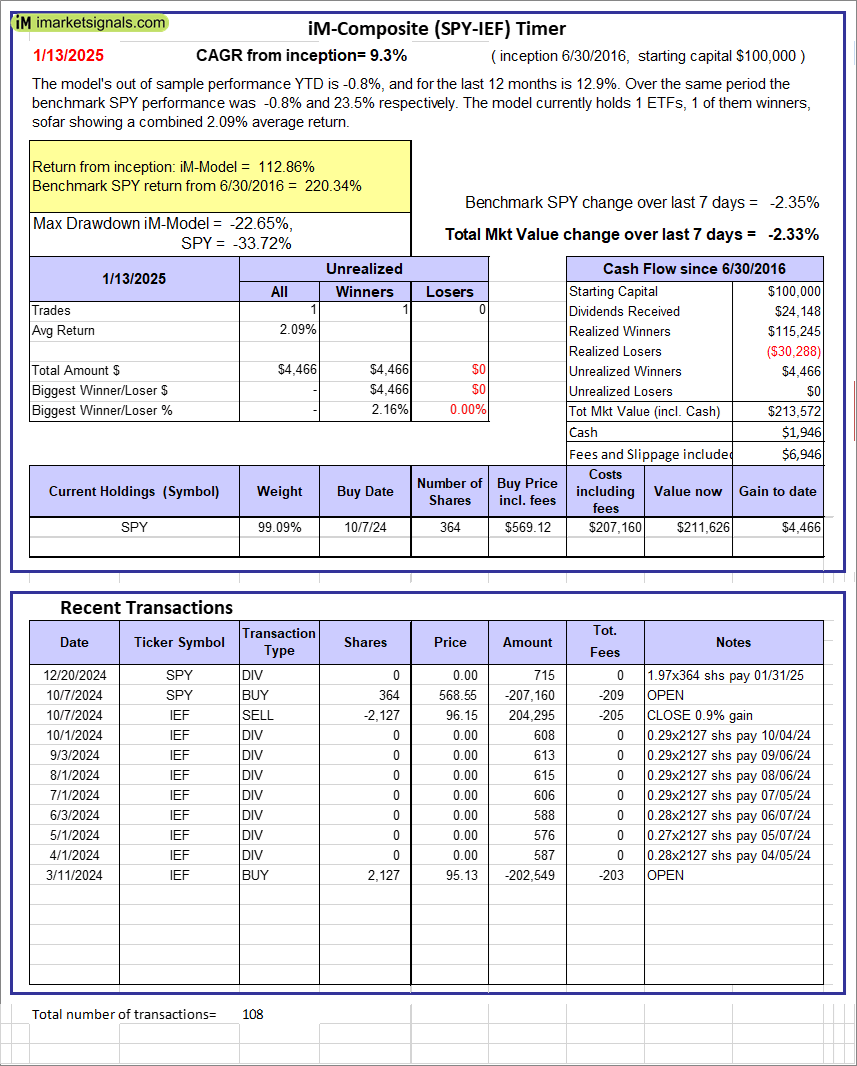 |
iM-Composite (SPY-IEF) Timer: The model’s out of sample performance YTD is -0.8%, and for the last 12 months is 12.9%. Over the same period the benchmark SPY performance was -0.8% and 23.5% respectively. Over the previous week the market value of the iM-Composite (SPY-IEF) Timer gained -2.33% at a time when SPY gained -2.35%. A starting capital of $100,000 at inception on 6/30/2016 would have grown to $213,572 which includes $1,946 cash and excludes $6,946 spent on fees and slippage. |
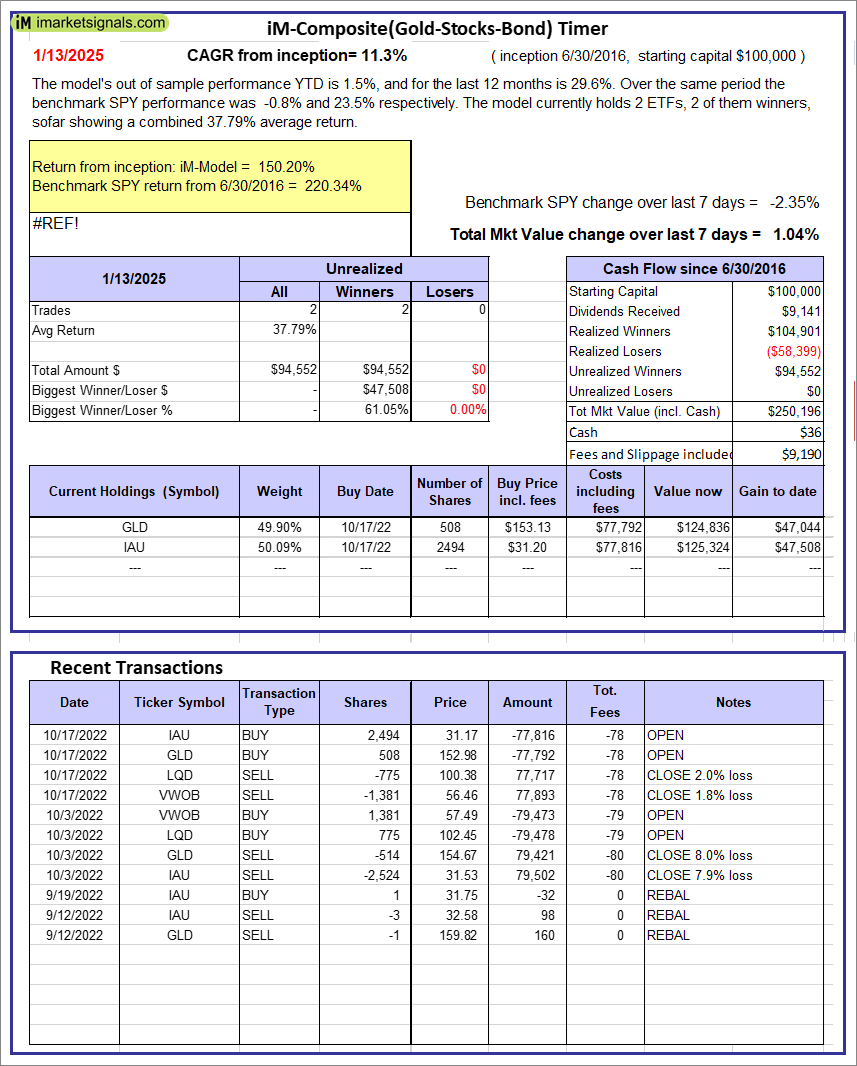 |
iM-Composite(Gold-Stocks-Bond) Timer: The model’s out of sample performance YTD is 1.5%, and for the last 12 months is 29.6%. Over the same period the benchmark SPY performance was -0.8% and 23.5% respectively. Over the previous week the market value of the iM-Composite(Gold-Stocks-Bond) Timer gained 1.04% at a time when SPY gained -2.35%. A starting capital of $100,000 at inception on 6/30/2016 would have grown to $250,196 which includes $36 cash and excludes $9,190 spent on fees and slippage. |
iM-Best Reports – 1/13/2025
Posted in pmp SPY-SH
Leave a Reply
You must be logged in to post a comment.