
  |
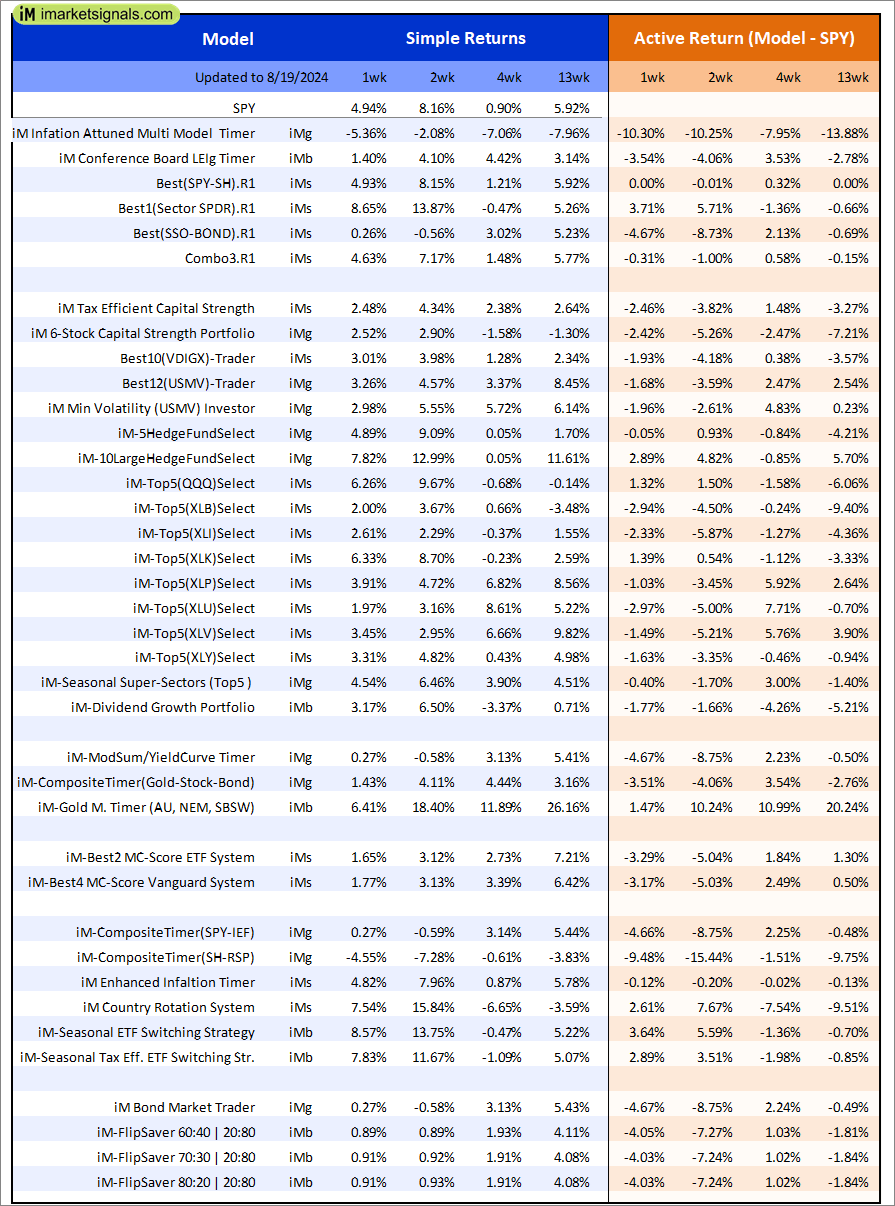
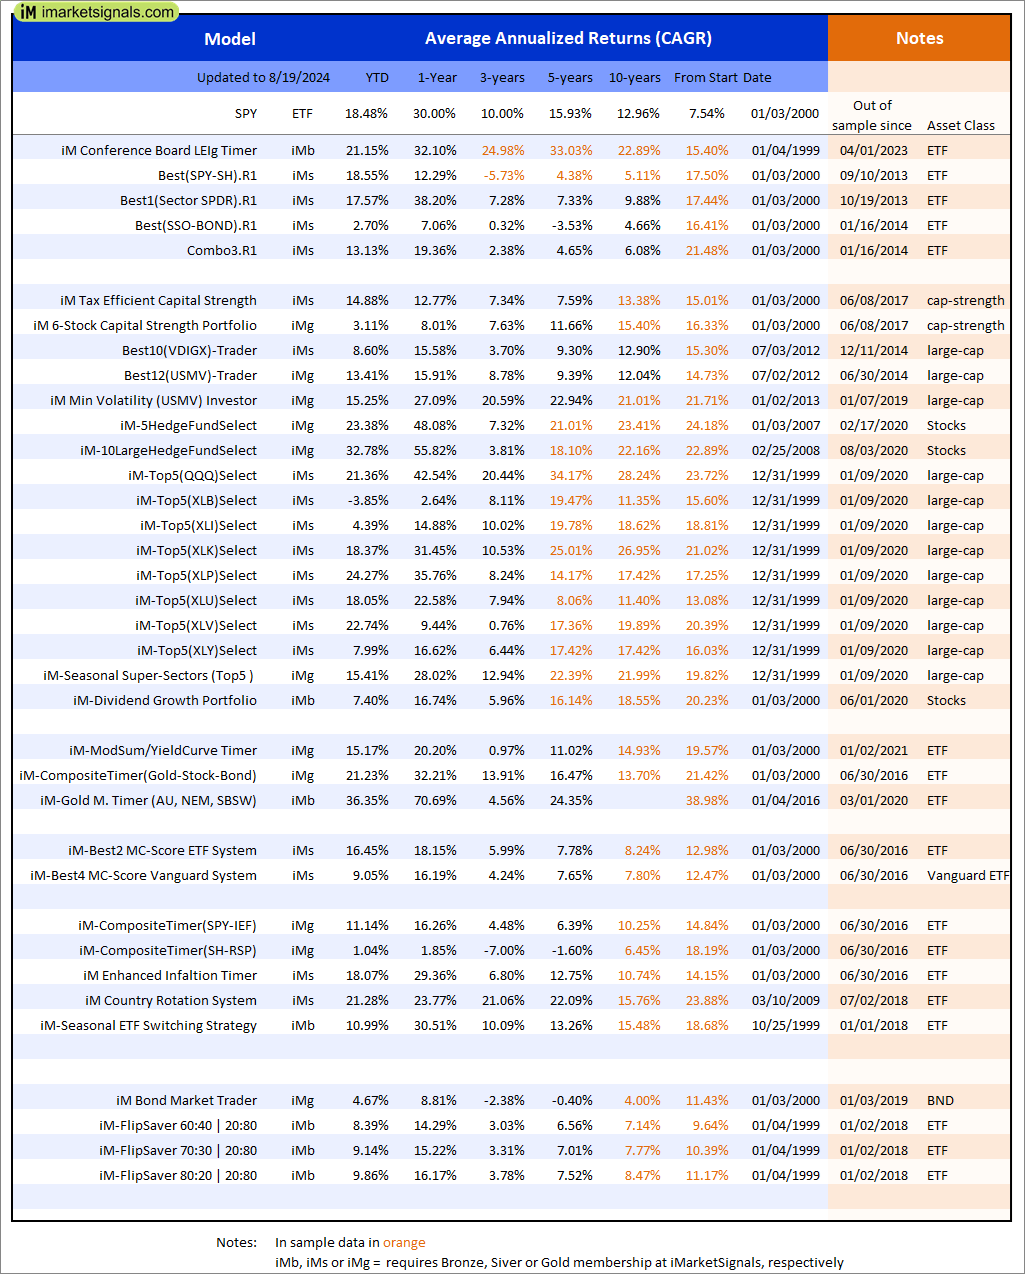
Out of sample performance summary of our models for the past 1, 2, 4 and 13 week periods. The active active return indicates how the models over- or underperformed the benchmark ETF SPY. Also the YTD, and the 1-, 3-, 5- and 10-year annualized returns are shown in the second table |
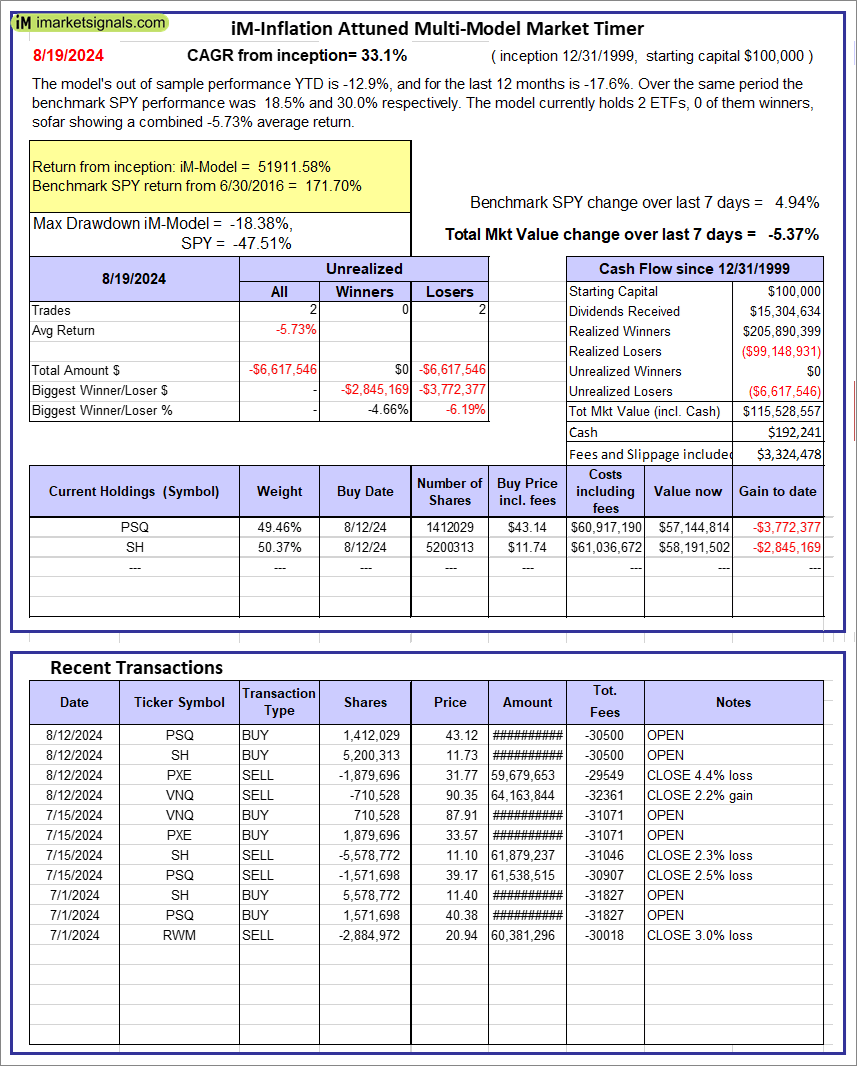 |
iM-Inflation Attuned Multi-Model Market Timer: The model’s out of sample performance YTD is -12.9%, and for the last 12 months is -17.6%. Over the same period the benchmark SPY performance was 18.5% and 30.0% respectively. Over the previous week the market value of the iM-Inflation Attuned Multi-Model Market Timer gained -5.37% at a time when SPY gained 4.94%. A starting capital of $100,000 at inception on 3/24/2017 would have grown to $115,528,557 which includes $192,241 cash and excludes $3,324,478 spent on fees and slippage. |
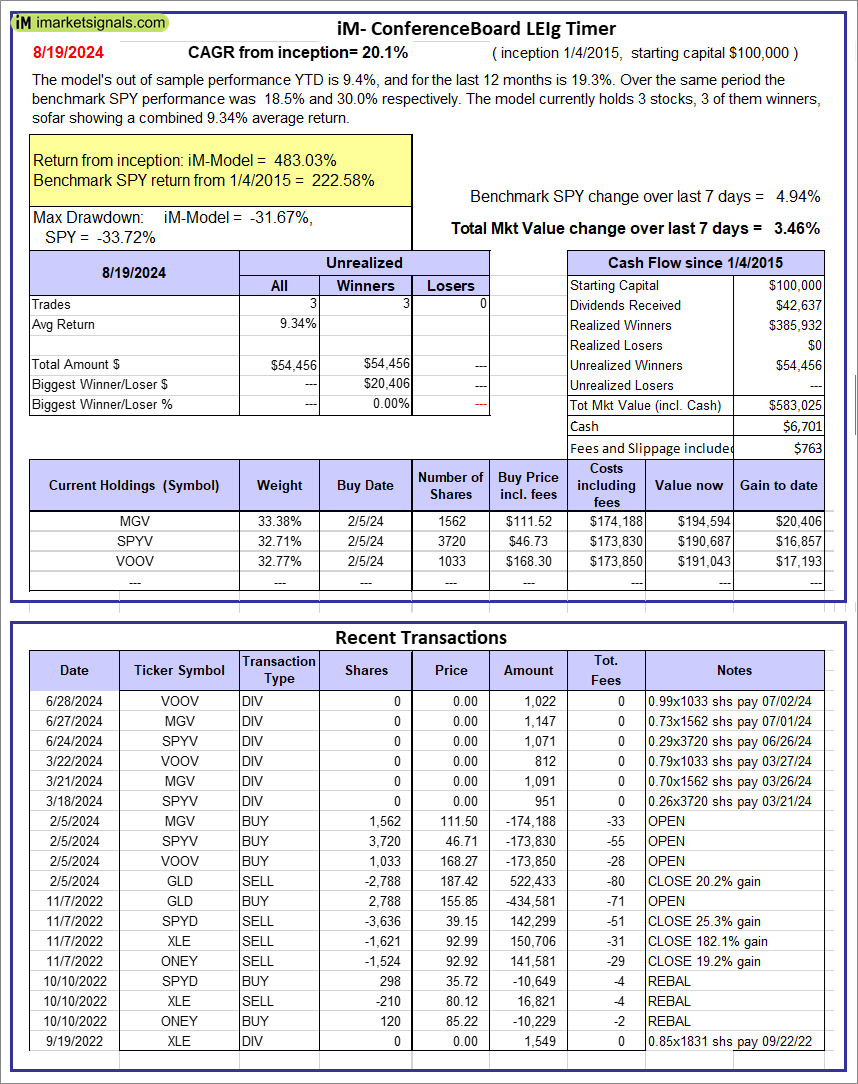 |
iM-Conference Board LEIg Timer: The model’s performance YTD is 14.3%, and for the last 12 months is 7.3%. Over the same period the benchmark SPY performance was 20.1% and 9.4% respectively. Over the previous week the market value of the iM-Conference Board LEIg Timer gained 3.46% at a time when SPY gained 4.94%. A starting capital of $100,000 at inception on 4/5/2017 would have grown to $583,025 which includes $6,701 cash and excludes $763 spent on fees and slippage. |
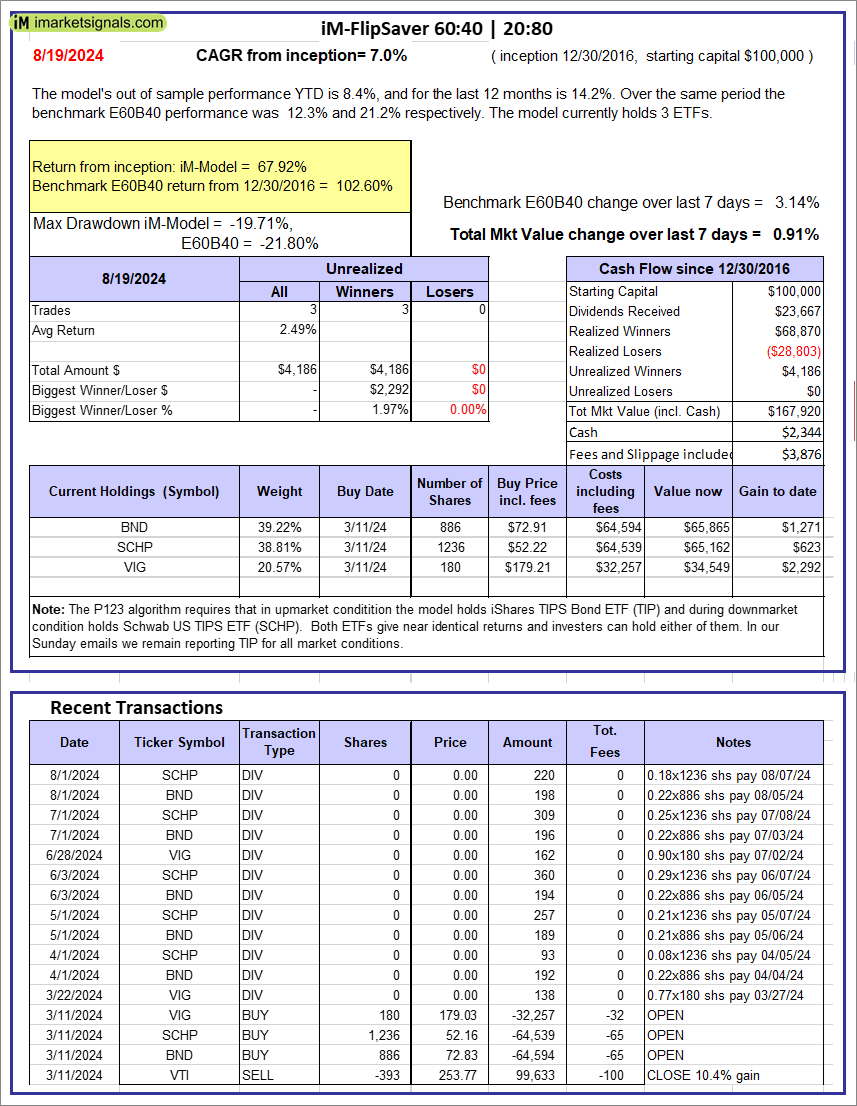 |
iM-FlipSaver 60:40 | 20:80 – 2017: The model’s out of sample performance YTD is 8.4%, and for the last 12 months is 14.2%. Over the same period the benchmark E60B40 performance was 12.3% and 21.2% respectively. Over the previous week the market value of iM-FlipSaver 80:20 | 20:80 gained 0.91% at a time when SPY gained 3.14%. A starting capital of $100,000 at inception on 7/16/2015 would have grown to $167,920 which includes $2,344 cash and excludes $3,876 spent on fees and slippage. |
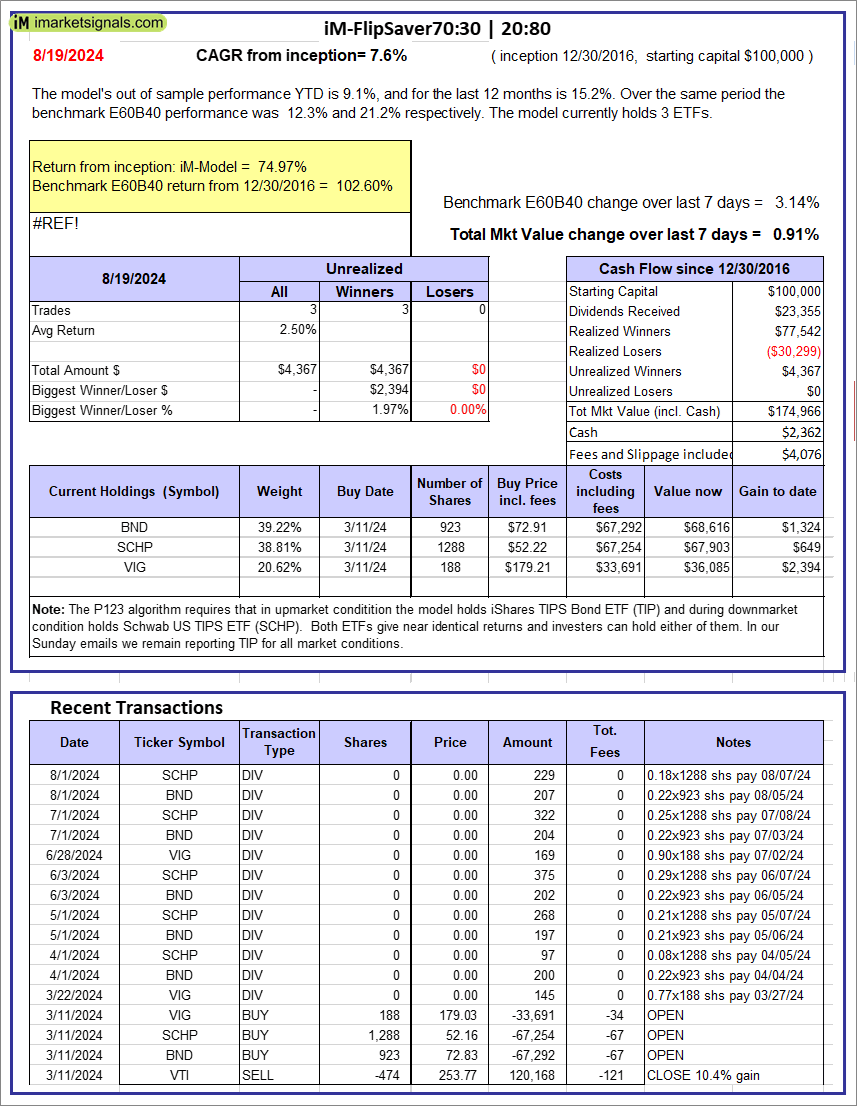 |
iM-FlipSaver 70:30 | 20:80 – 2017: The model’s out of sample performance YTD is 9.1%, and for the last 12 months is 15.2%. Over the same period the benchmark E60B40 performance was 12.3% and 21.2% respectively. Over the previous week the market value of iM-FlipSaver 70:30 | 20:80 gained 0.91% at a time when SPY gained 3.14%. A starting capital of $100,000 at inception on 7/15/2015 would have grown to $174,966 which includes $2,362 cash and excludes $4,076 spent on fees and slippage. |
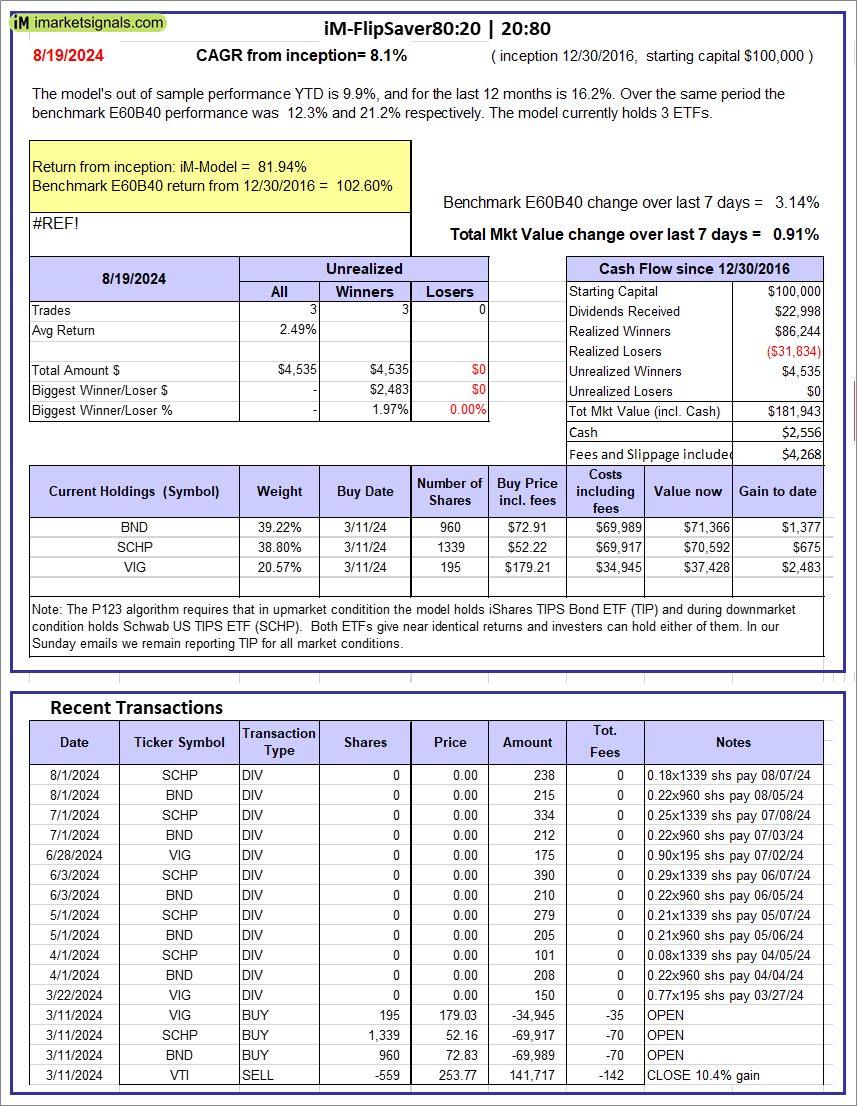 |
iM-FlipSaver 80:20 | 20:80 – 2017: The model’s out of sample performance YTD is 9.9%, and for the last 12 months is 16.2%. Over the same period the benchmark E60B40 performance was 12.3% and 21.2% respectively. Over the previous week the market value of iM-FlipSaver 80:20 | 20:80 gained 0.91% at a time when SPY gained 3.14%. A starting capital of $100,000 at inception on 1/2/2017 would have grown to $181,943 which includes $2,556 cash and excludes $4,268 spent on fees and slippage. |
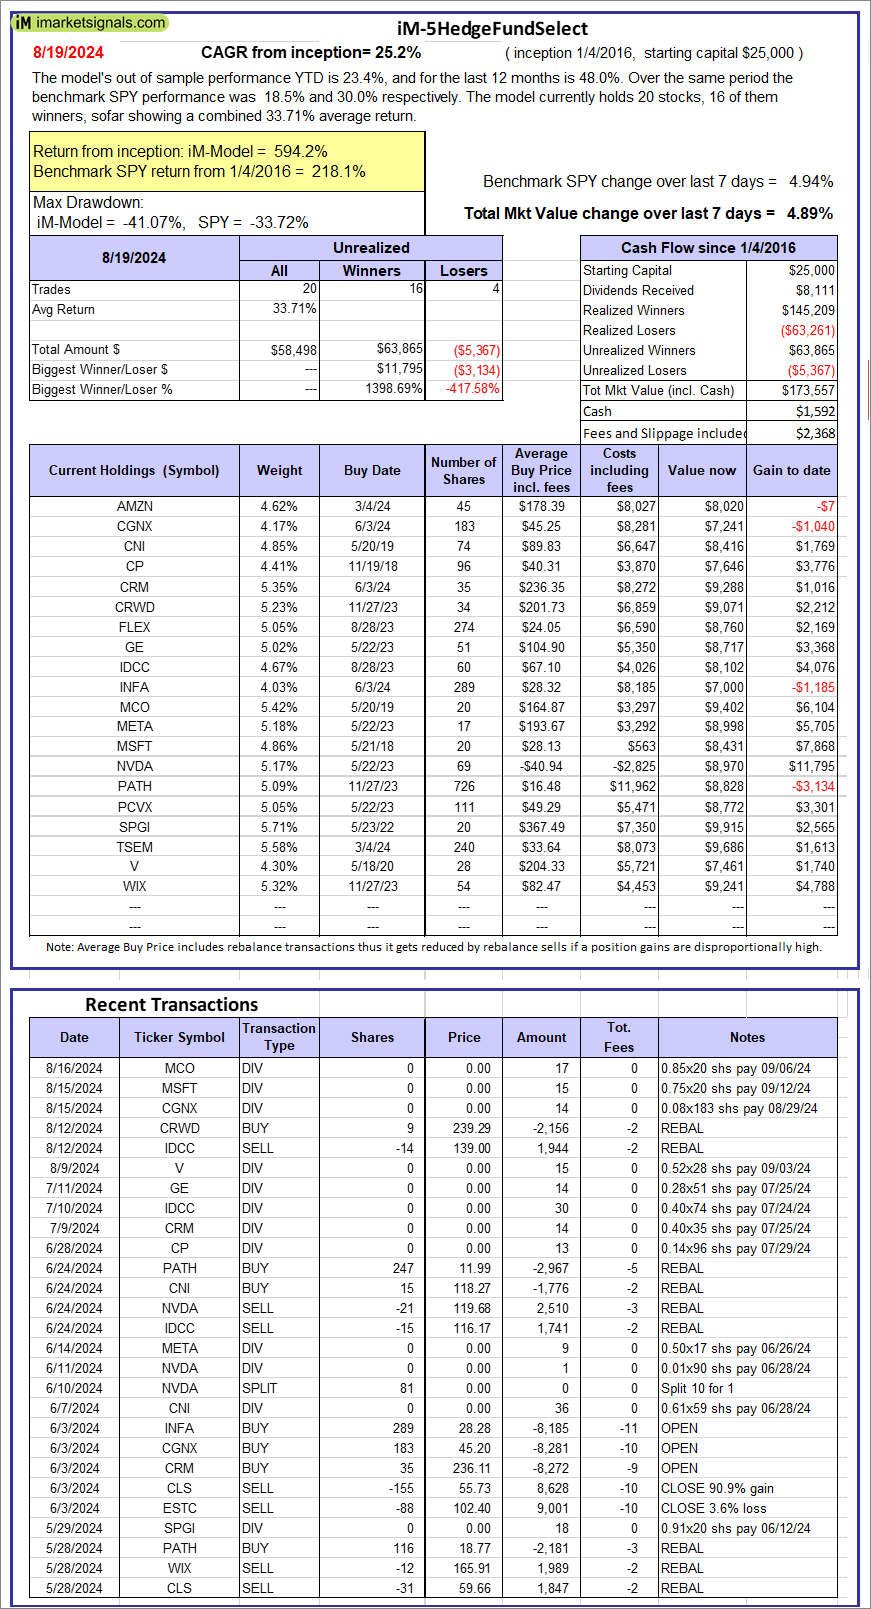 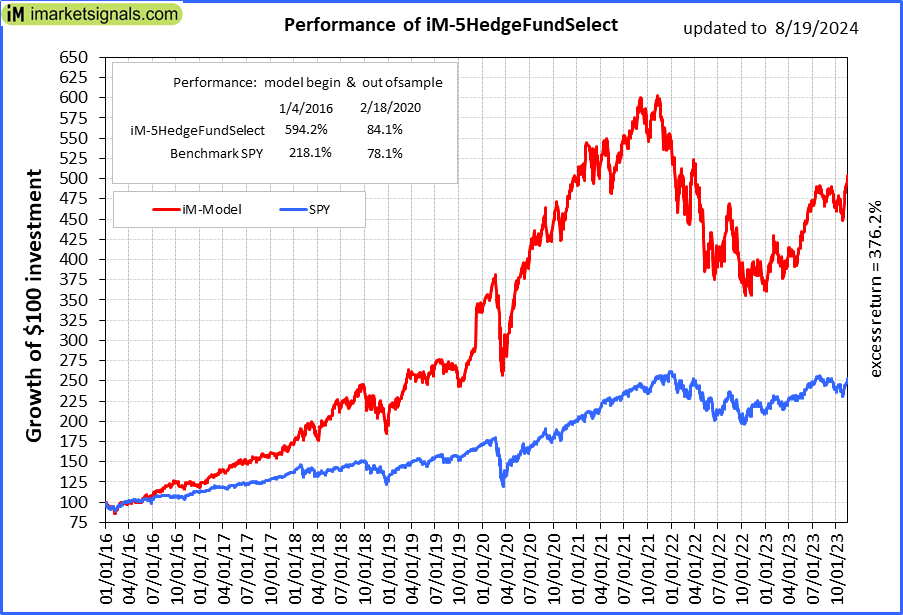 |
iM-5HedgeFundSelect: Since inception, on 1/5/2016, the model gained 594.23% while the benchmark SPY gained 218.06% over the same period. Over the previous week the market value of iM-5HedgeFundSelect gained 4.89% at a time when SPY gained 4.94%. A starting capital of $25,000 at inception on 1/5/2016 would have grown to $173,557 which includes $1,592 cash and excludes $2,368 spent on fees and slippage. |
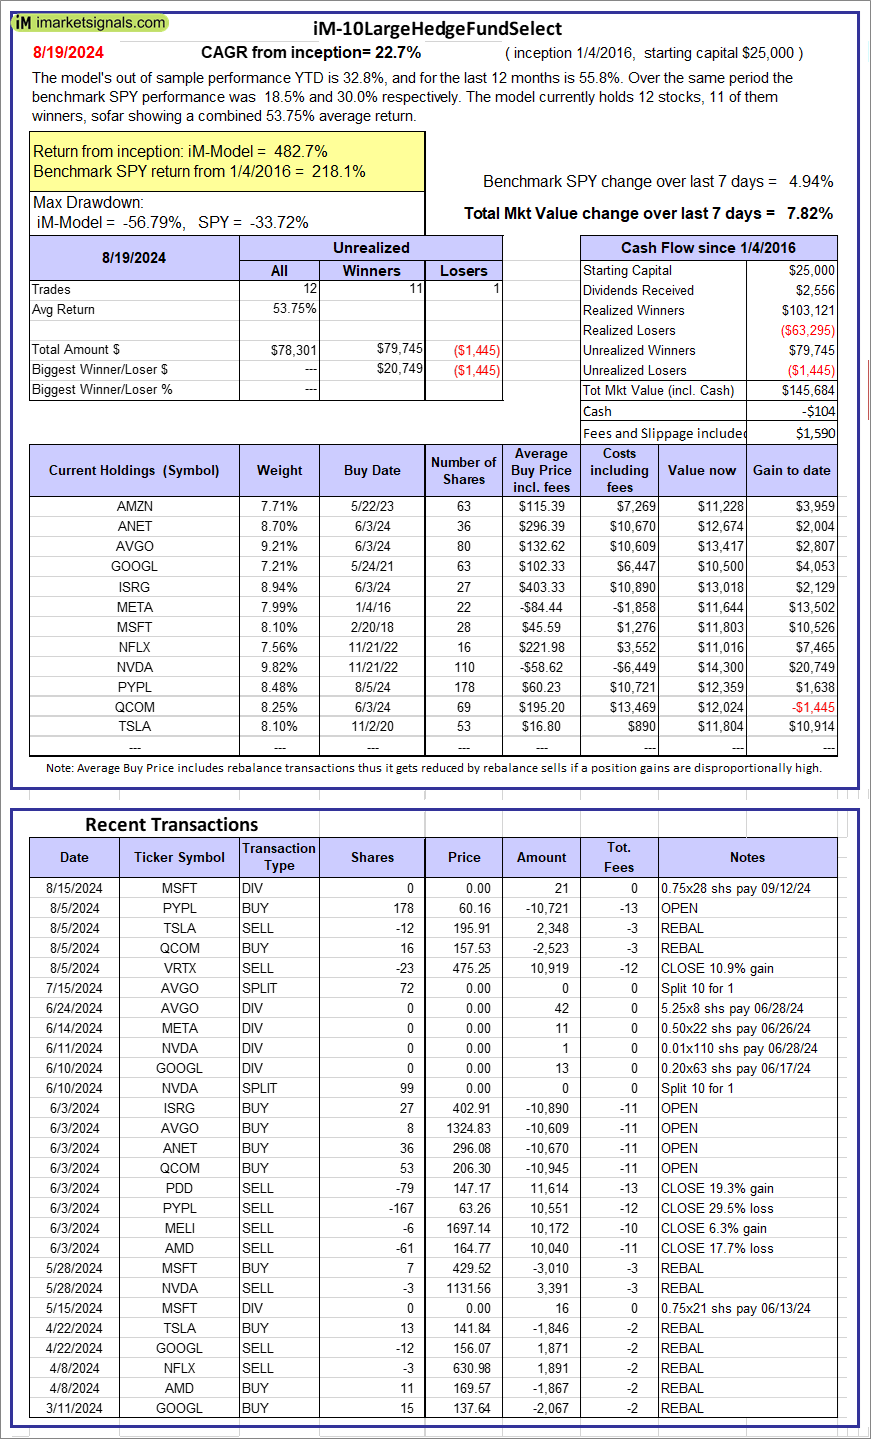 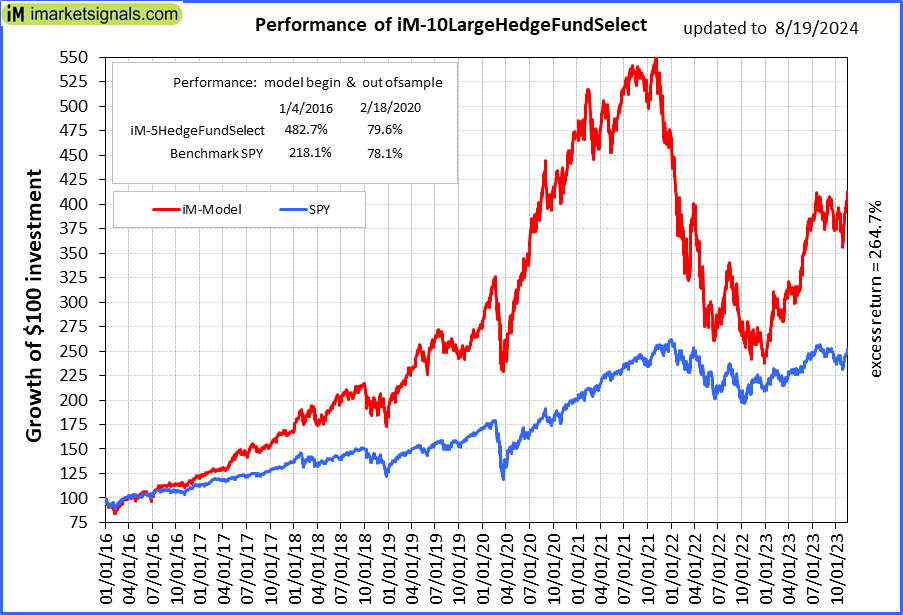 |
iM-10LargeHedgeFundSelect: Since inception, on 1/5/2016, the model gained 482.74% while the benchmark SPY gained 218.06% over the same period. Over the previous week the market value of iM-10LargeHedgeFundSelect gained 7.82% at a time when SPY gained 4.94%. A starting capital of $25,000 at inception on 1/5/2016 would have grown to $145,684 which includes -$104 cash and excludes $1,590 spent on fees and slippage. |
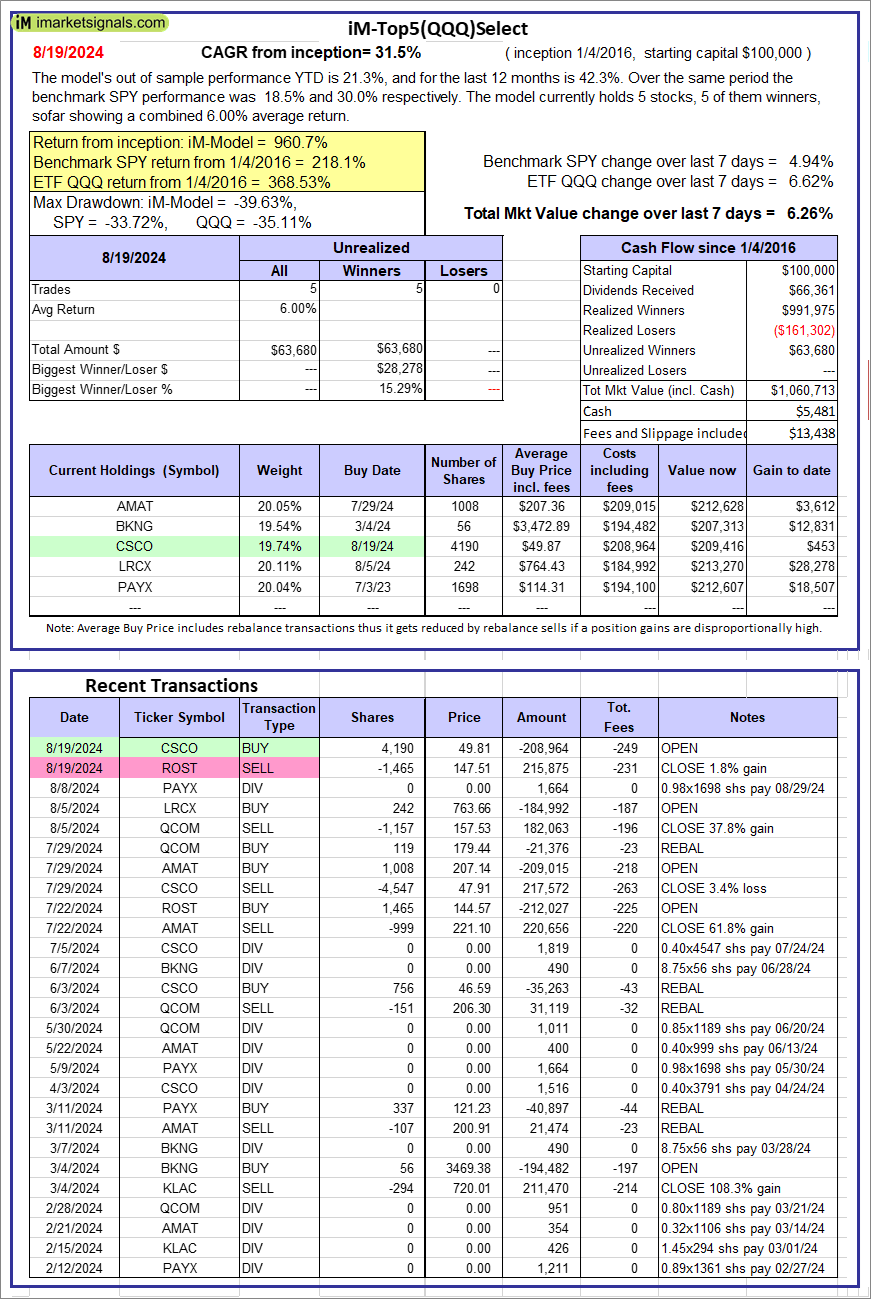 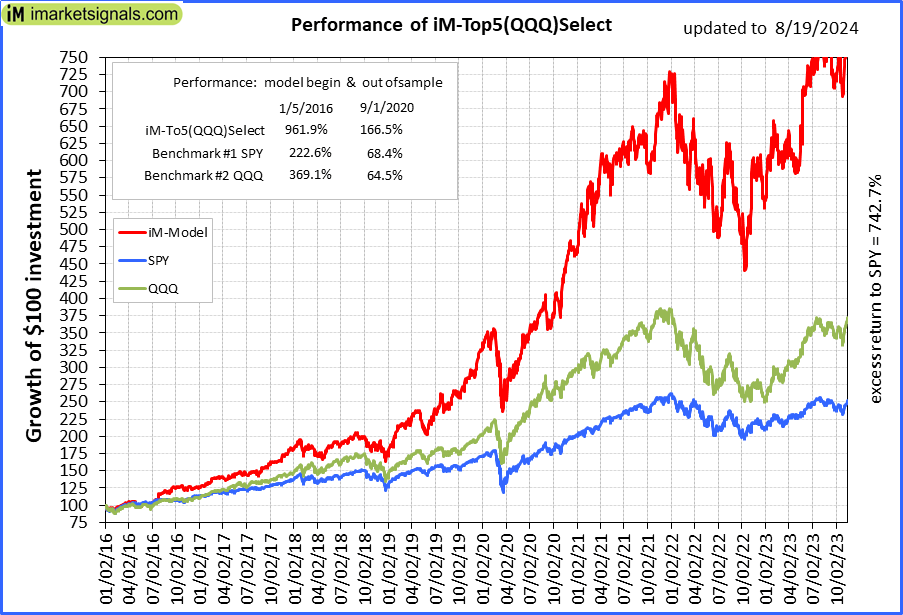 |
iM-Top5(QQQ)Select: Since inception, on 1/5/2016, the model gained 960.71% while the benchmark SPY gained 218.06% over the same period. Over the previous week the market value of iM-Top5(QQQ)Select gained 6.26% at a time when SPY gained 4.94%. A starting capital of $100,000 at inception on 1/5/2016 would have grown to $1,060,713 which includes $5,481 cash and excludes $13,438 spent on fees and slippage. |
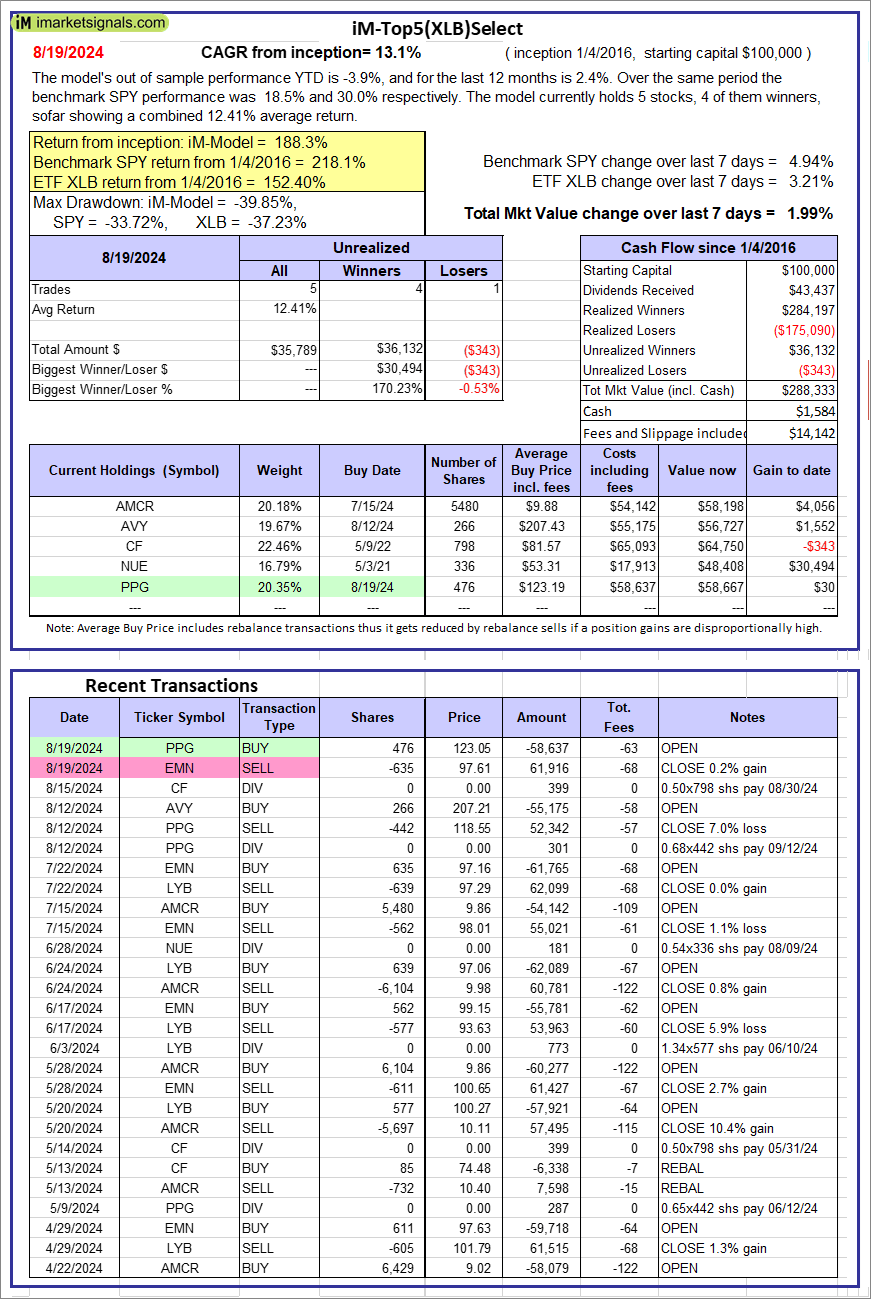 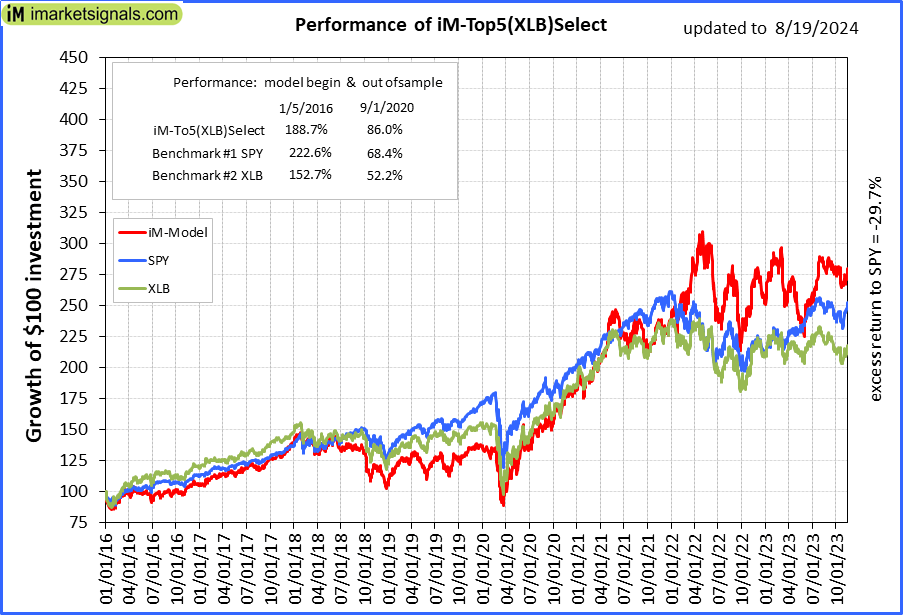 |
iM-Top5(XLB)Select: Since inception, on 1/5/2016, the model gained 188.33% while the benchmark SPY gained 218.06% over the same period. Over the previous week the market value of iM-Top5(XLB)Select gained 1.99% at a time when SPY gained 4.94%. A starting capital of $100,000 at inception on 1/5/2016 would have grown to $288,333 which includes $1,584 cash and excludes $14,142 spent on fees and slippage. |
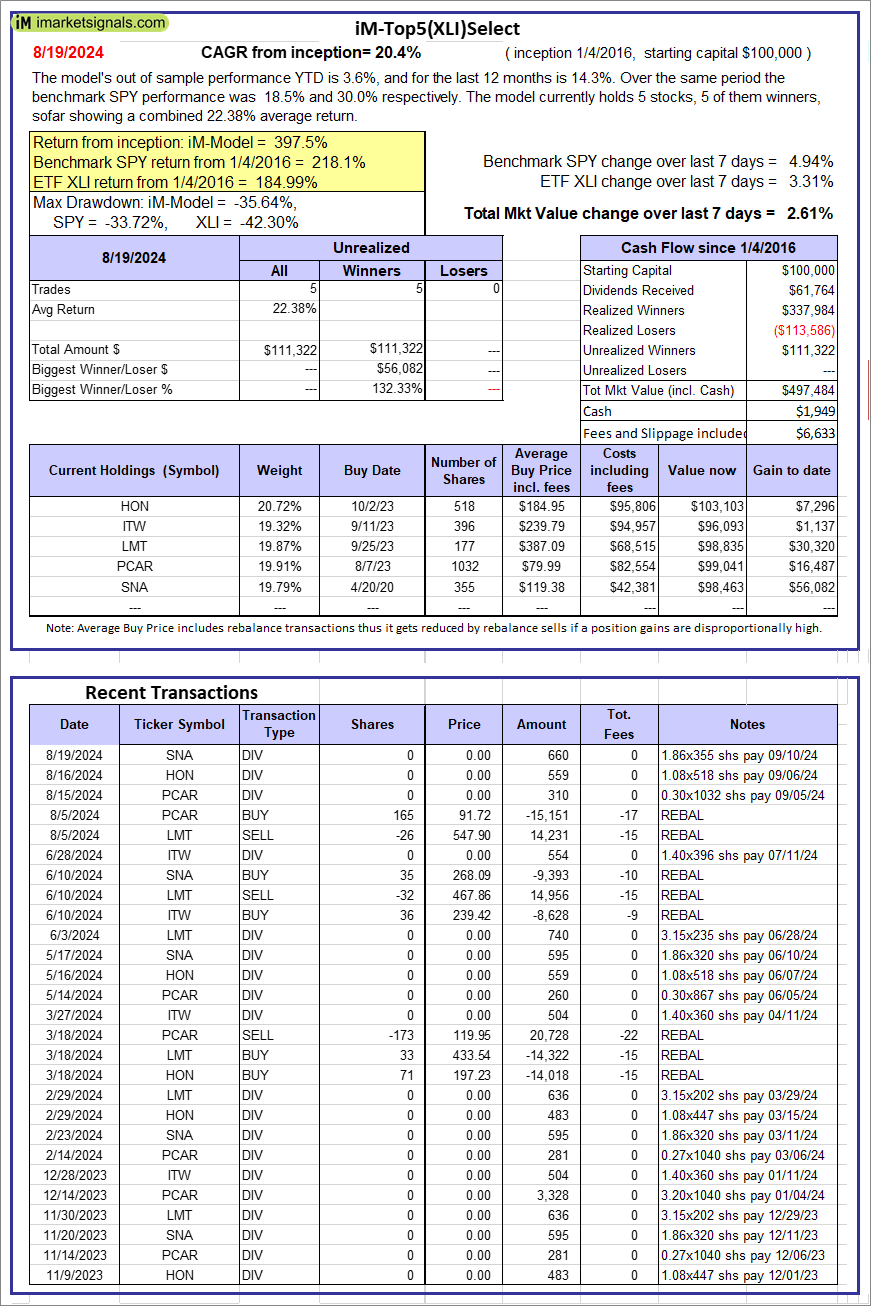 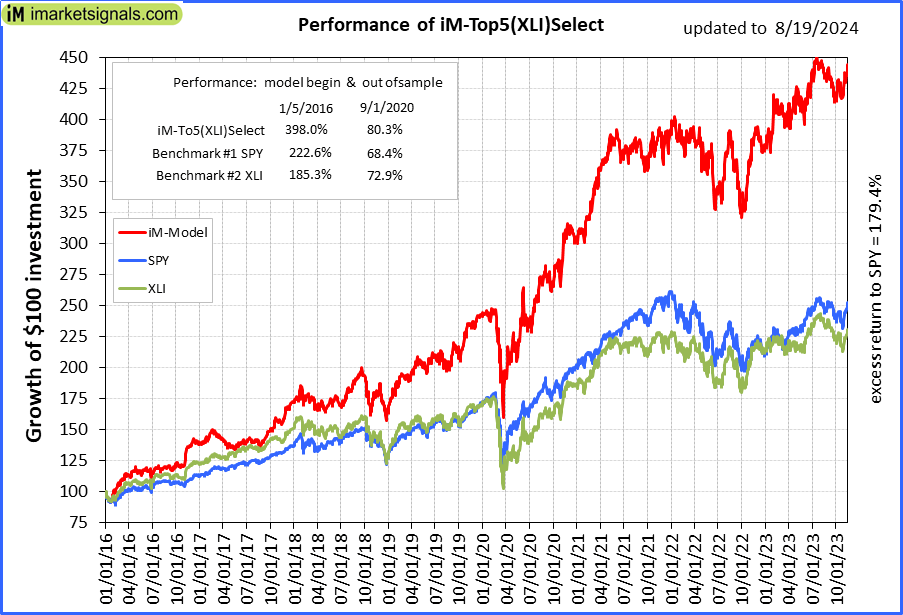 |
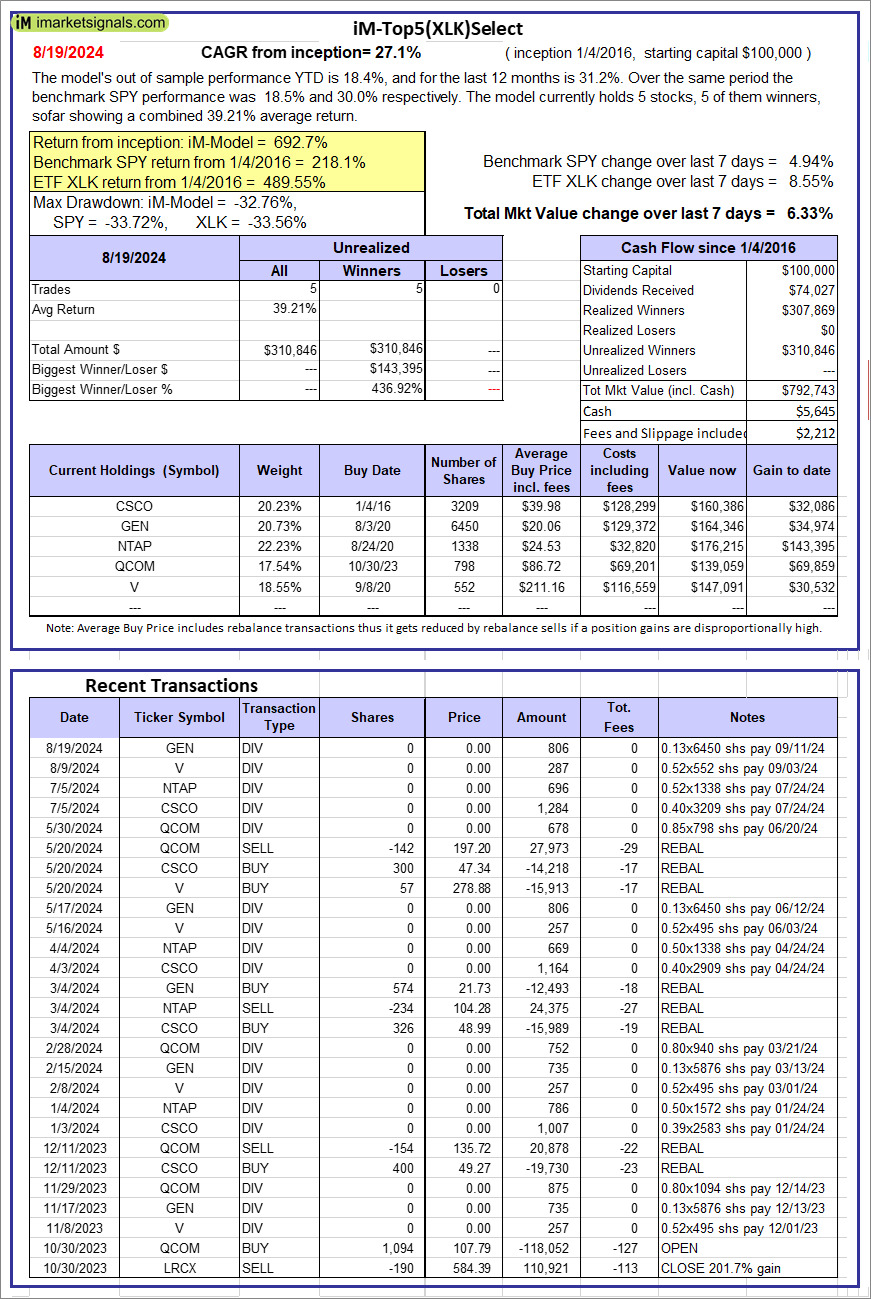
iM-Top5(XLI)Select: Since inception, on 1/5/2016, the model gained 397.48% while the benchmark SPY gained 218.06% over the same period. Over the previous week the market value of iM-Top5(XLI)Select gained 2.61% at a time when SPY gained 4.94%. A starting capital of $100,000 at inception on 1/5/2016 would have grown to $497,484 which includes $1,949 cash and excludes $6,633 spent on fees and slippage. |
 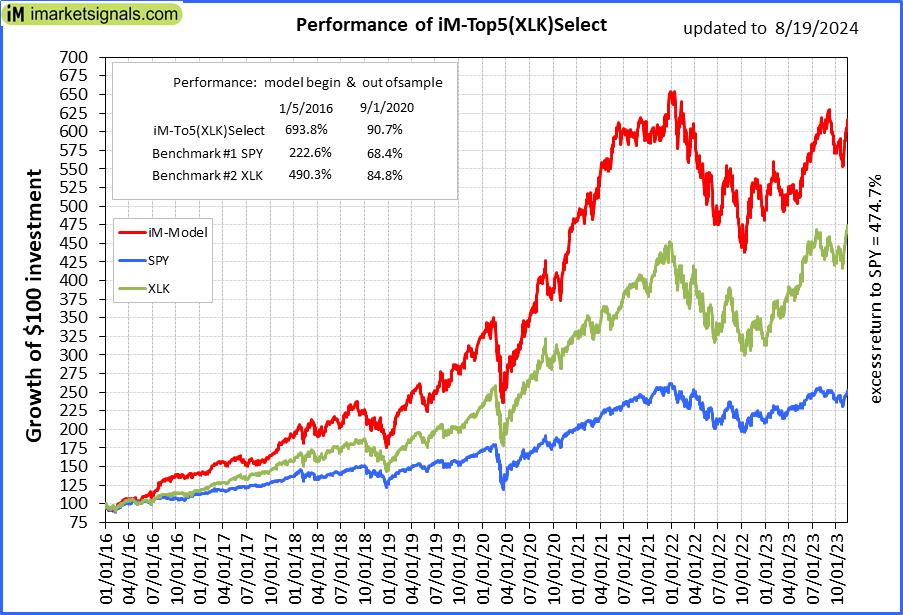 |
iM-Top5(XLK)Select: Since inception, on 1/5/2016, the model gained 692.74% while the benchmark SPY gained 218.06% over the same period. Over the previous week the market value of iM-Top5(XLK)Select gained 6.33% at a time when SPY gained 4.94%. A starting capital of $100,000 at inception on 1/5/2016 would have grown to $792,743 which includes $5,645 cash and excludes $2,212 spent on fees and slippage. |
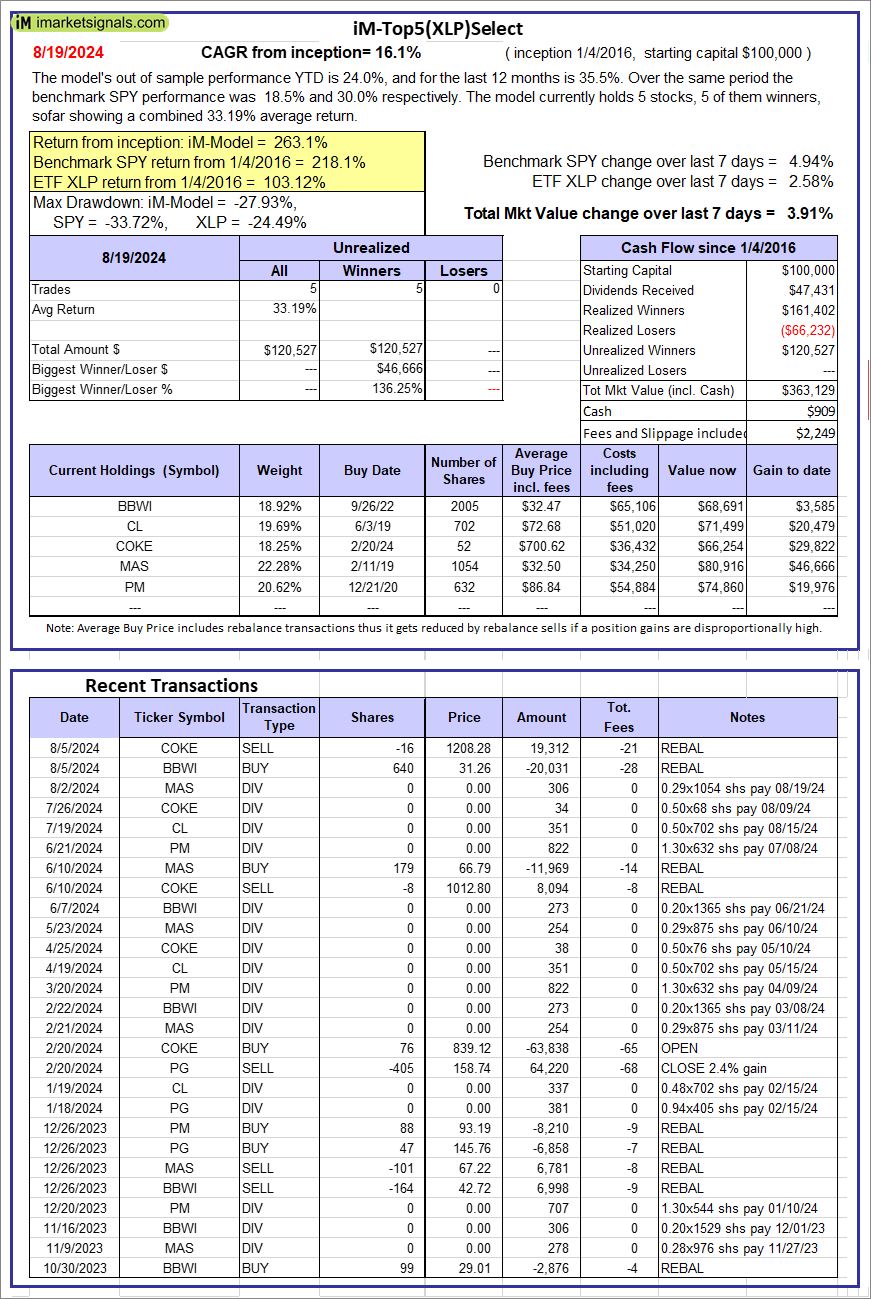 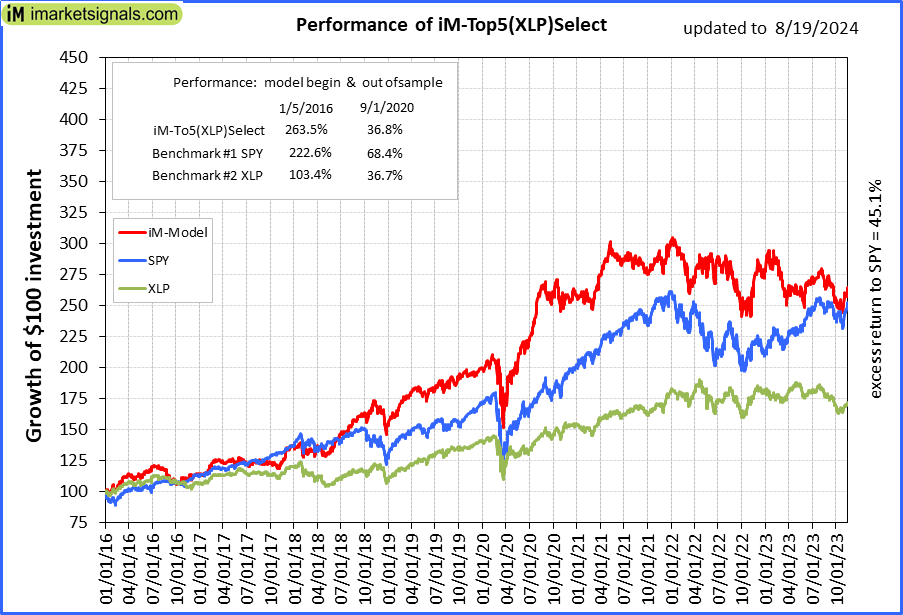 |
iM-Top5(XLP)Select: Since inception, on 1/5/2016, the model gained 263.13% while the benchmark SPY gained 218.06% over the same period. Over the previous week the market value of iM-Top5(XLP)Select gained 3.91% at a time when SPY gained 4.94%. A starting capital of $100,000 at inception on 1/5/2016 would have grown to $363,129 which includes $909 cash and excludes $2,249 spent on fees and slippage. |
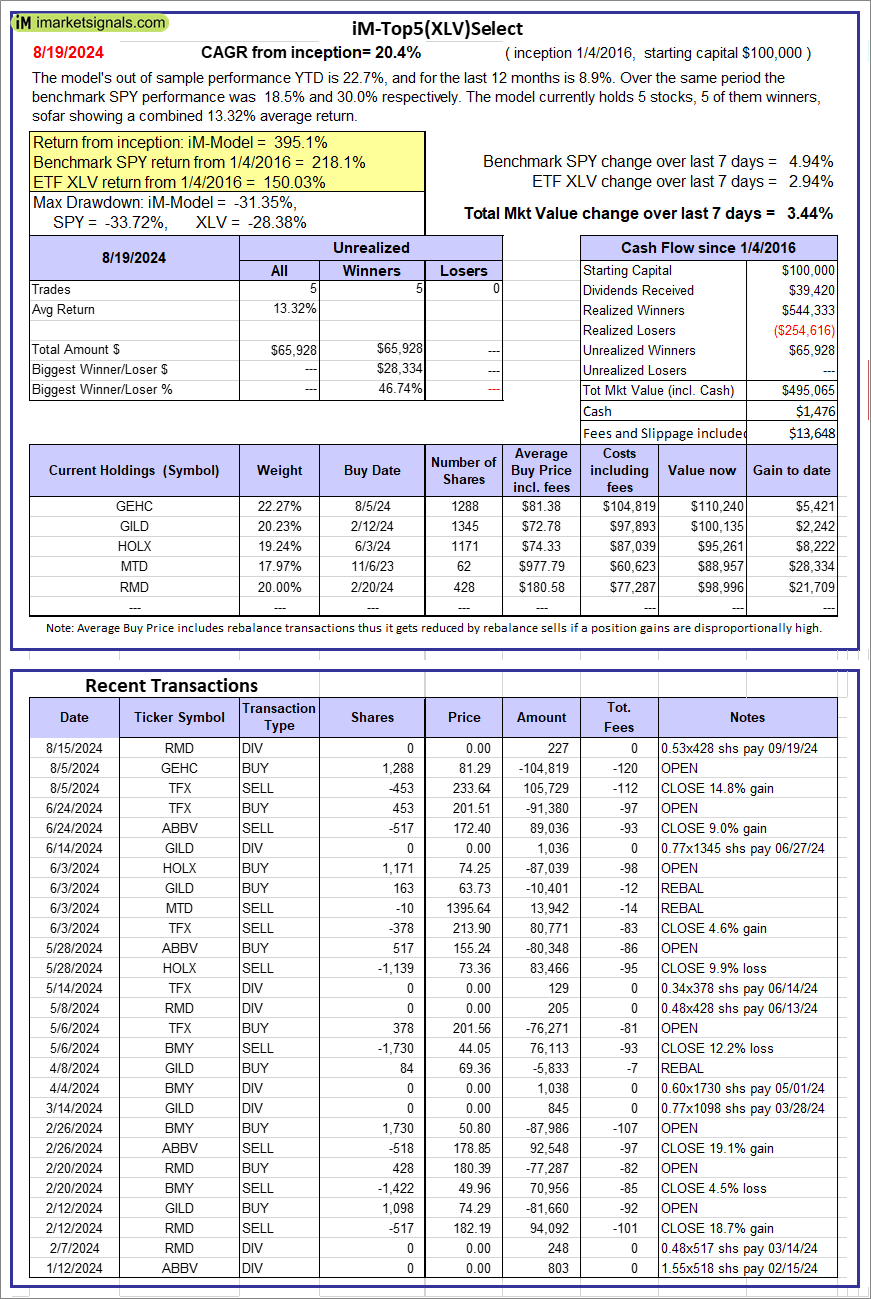  |
iM-Top5(XLV)Select: Since inception, on 1/5/2016, the model gained 395.07% while the benchmark SPY gained 218.06% over the same period. Over the previous week the market value of iM-Top5(XLV)Select gained 3.44% at a time when SPY gained 4.94%. A starting capital of $100,000 at inception on 1/5/2016 would have grown to $495,065 which includes $1,476 cash and excludes $13,648 spent on fees and slippage. |
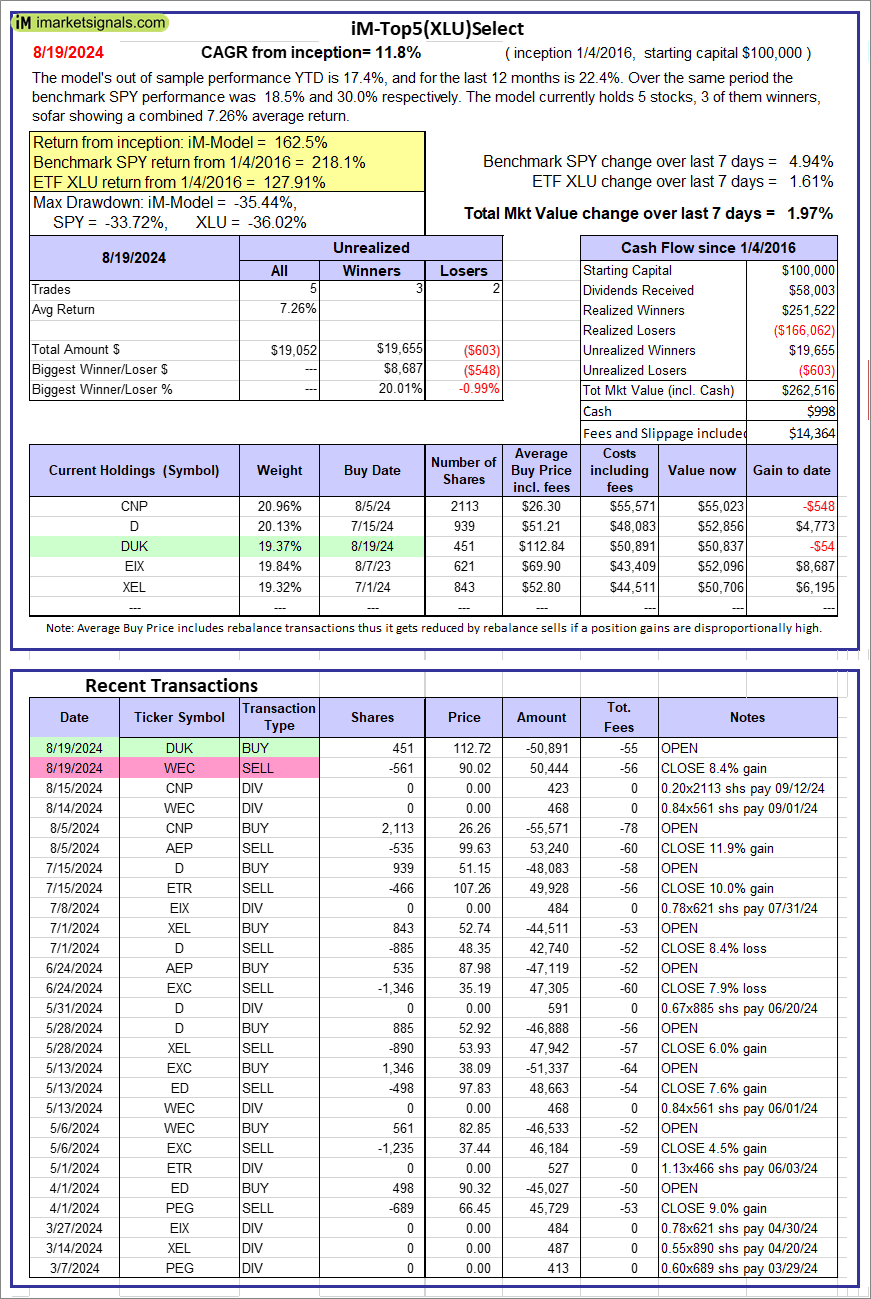 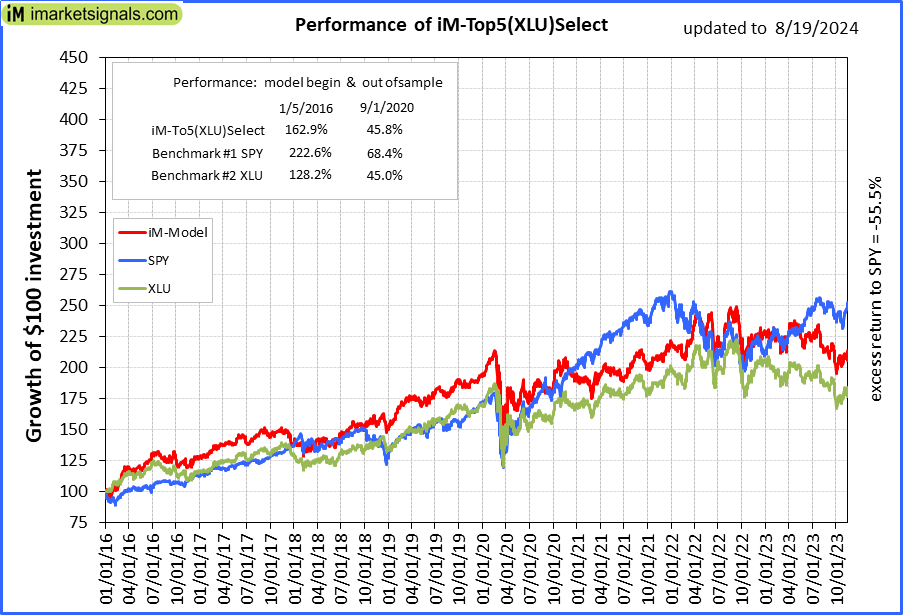 |
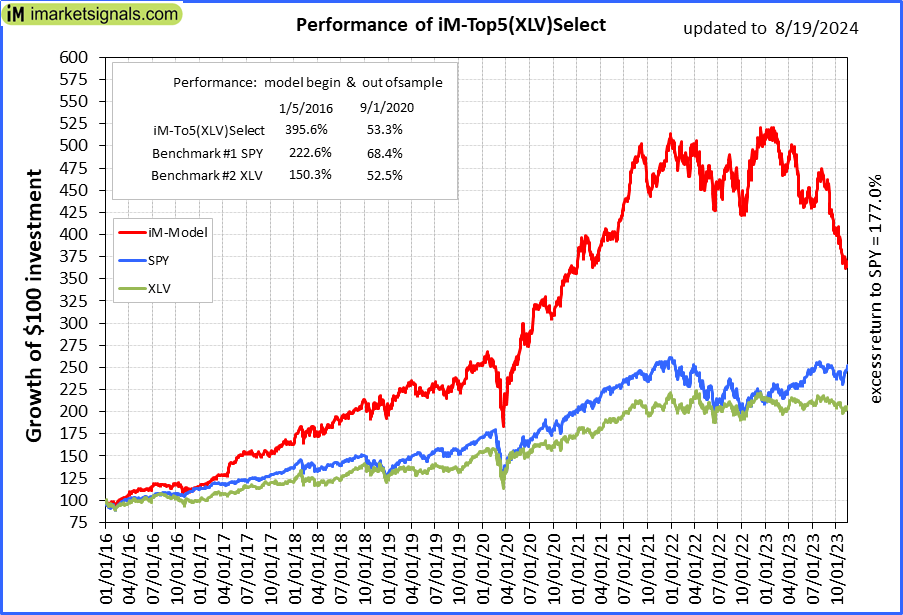
iM-Top5(XLU)Select: Since inception, on 1/5/2016, the model gained 162.52% while the benchmark SPY gained 218.06% over the same period. Over the previous week the market value of iM-Top5(XLU)Select gained 1.97% at a time when SPY gained 4.94%. A starting capital of $100,000 at inception on 1/5/2016 would have grown to $262,516 which includes $998 cash and excludes $14,364 spent on fees and slippage. |
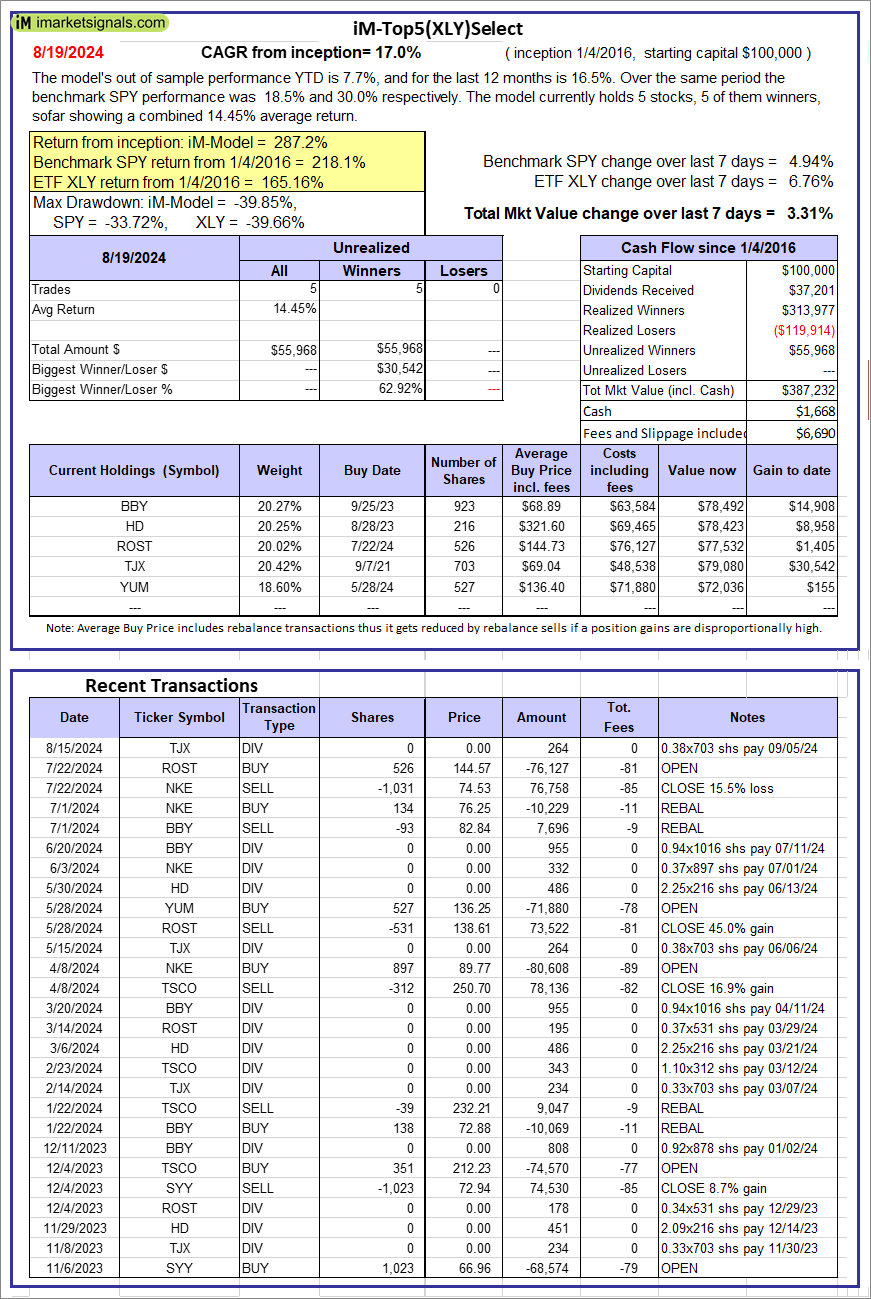 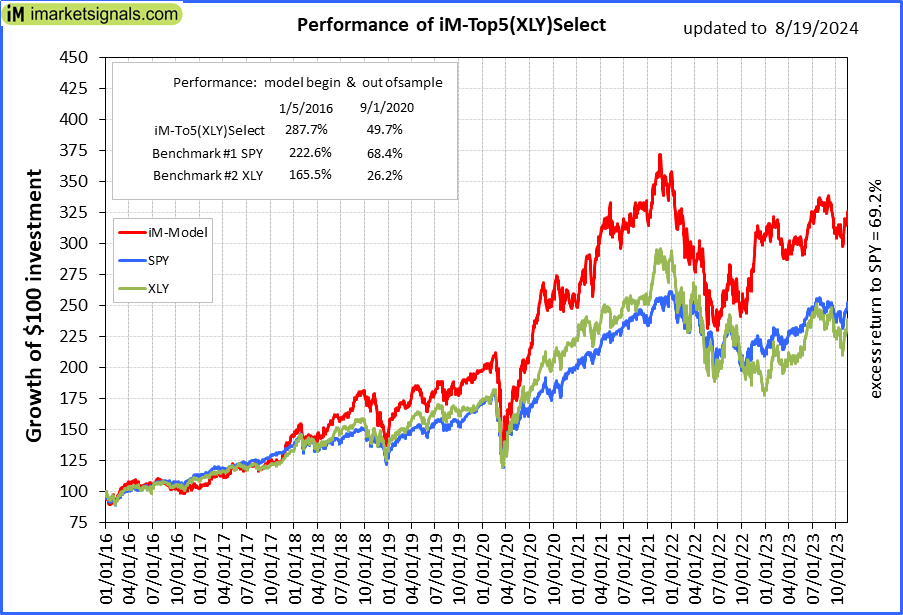 |
iM-Top5(XLY)Select: Since inception, on 1/5/2016, the model gained 287.23% while the benchmark SPY gained 218.06% over the same period. Over the previous week the market value of iM-Top5(XLY)Select gained 3.31% at a time when SPY gained 4.94%. A starting capital of $100,000 at inception on 1/5/2016 would have grown to $387,232 which includes $1,668 cash and excludes $6,690 spent on fees and slippage. |
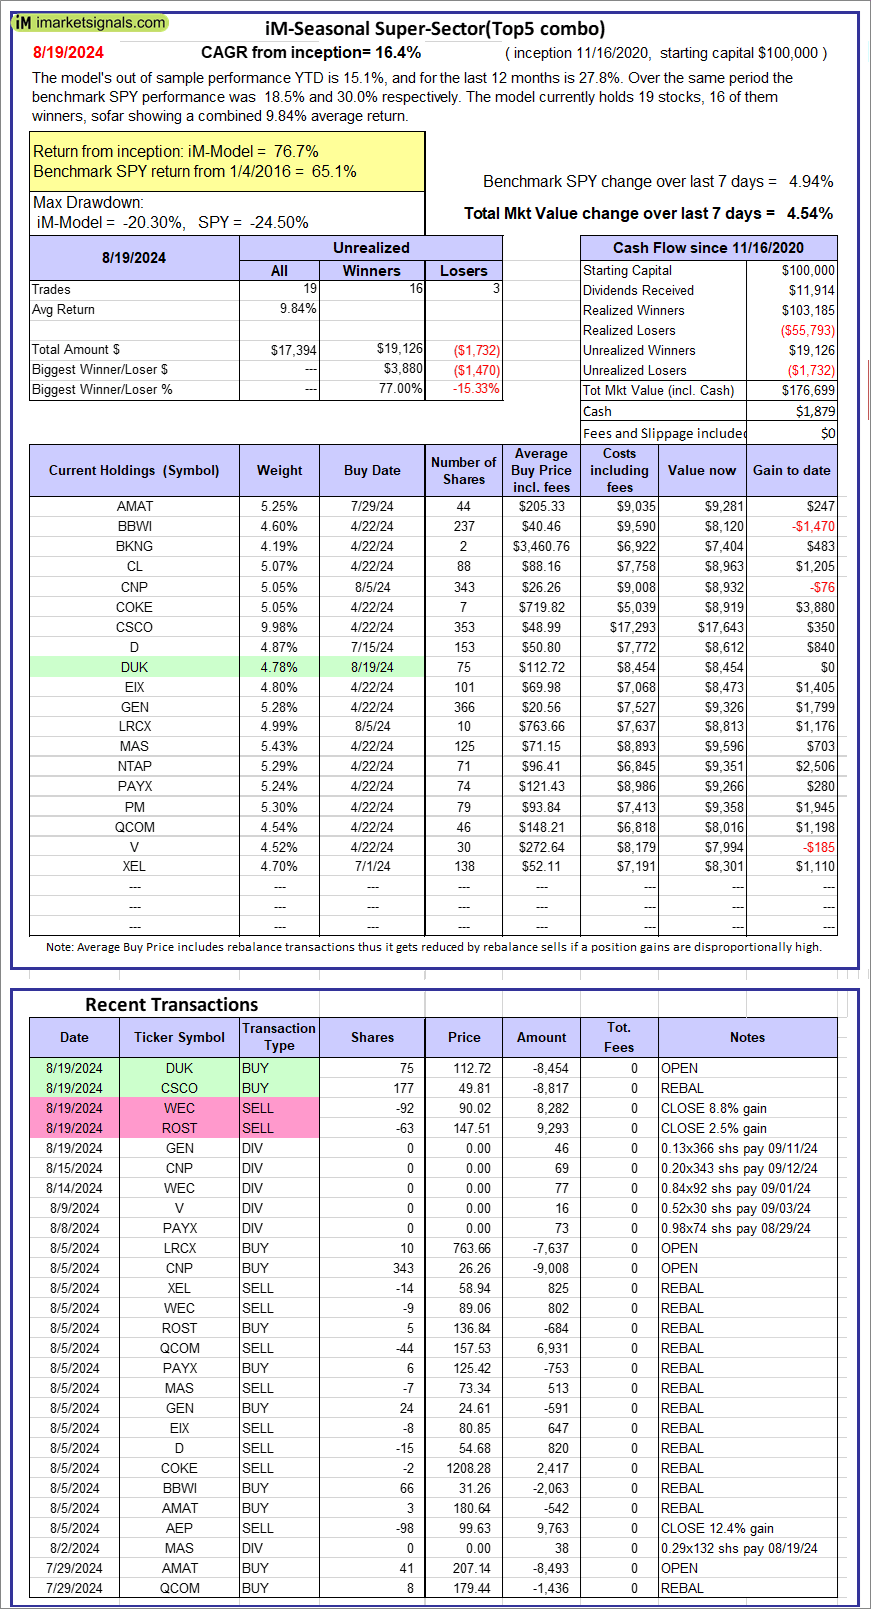 |
iM-Seasonal Super-Sectors (Top5 combo) : Since inception, on 11/17/2020, the model gained 76.70% while the benchmark SPY gained 65.11% over the same period. Over the previous week the market value of iM-Seasonal Super-Sectors (Top5 combo) gained 4.54% at a time when SPY gained 4.94%. A starting capital of $100,000 at inception on 11/17/2020 would have grown to $176,699 which includes $1,879 cash and excludes $00 spent on fees and slippage. |
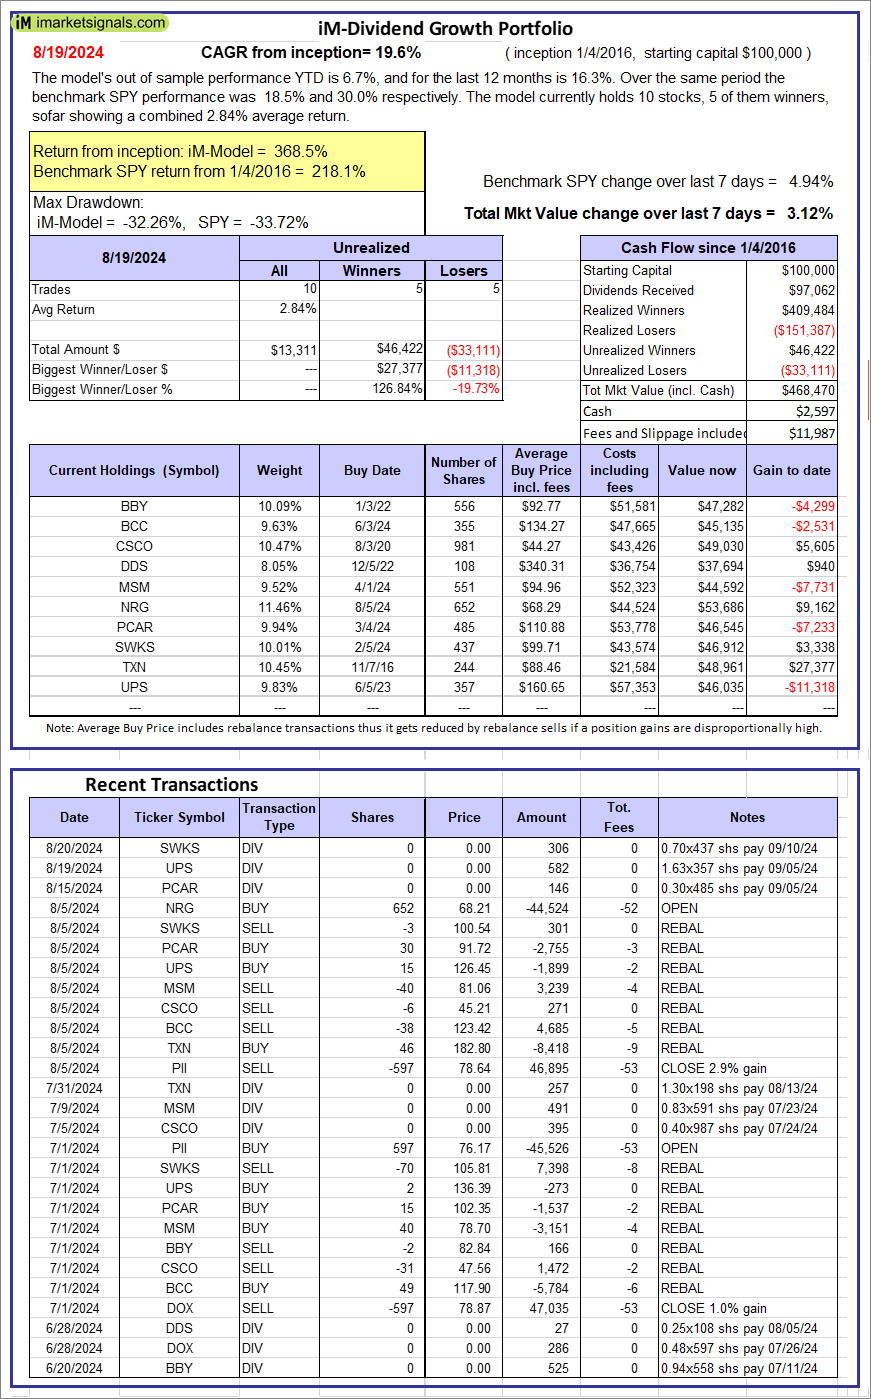 |
iM-Dividend Growth Portfolio: The model’s out of sample performance YTD is 6.7%, and for the last 12 months is 16.3%. Over the same period the benchmark SPY performance was 18.5% and 30.0% respectively. Over the previous week the market value of the iM-Dividend Growth Portfolio gained 3.12% at a time when SPY gained 4.94%. A starting capital of $100,000 at inception on 6/30/2016 would have grown to $468,470 which includes $2,597 cash and excludes $11,987 spent on fees and slippage. |
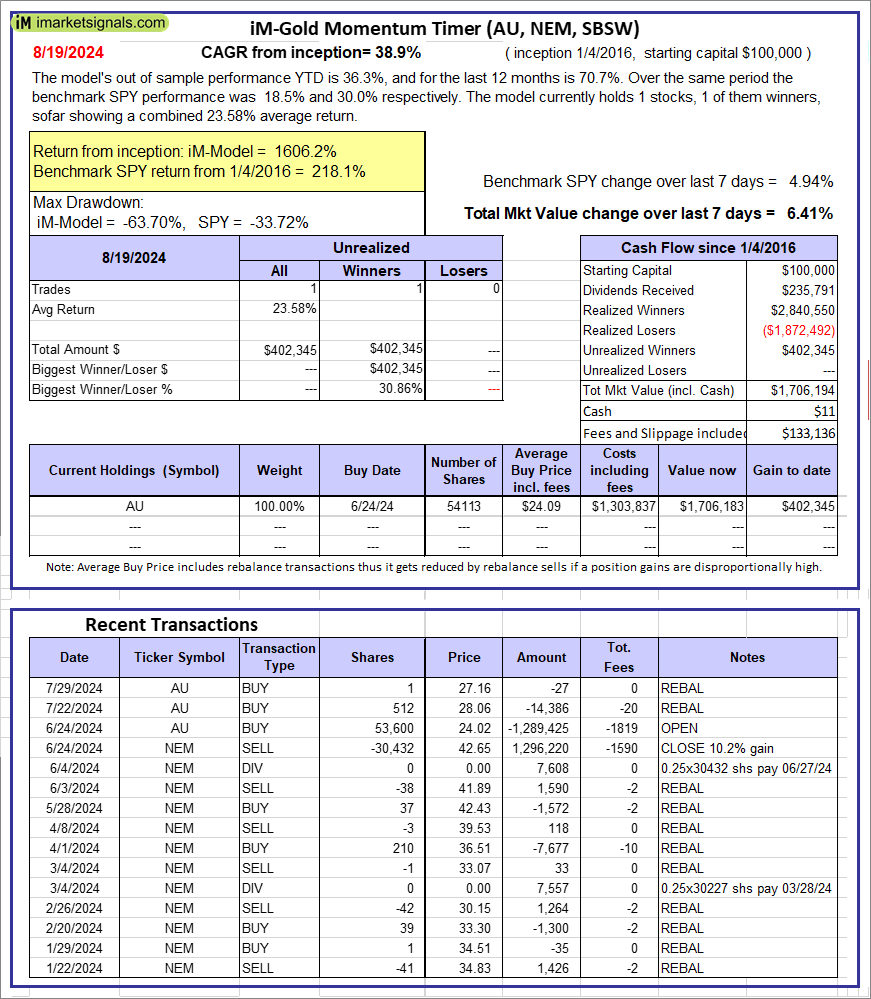 |
iM-Gold Momentum Timer (AU, NEM, SBSW): The model’s out of sample performance YTD is 36.3%, and for the last 12 months is 70.7%. Over the same period the benchmark SPY performance was 18.5% and 30.0% respectively. Over the previous week the market value of iM-Gold Momentum Timer (AU, NEM, SBSW) gained 6.41% at a time when SPY gained 4.94%. A starting capital of $100,000 at inception on 6/30/2016 would have grown to $11 which includes $133,136 cash and excludes Gain to date spent on fees and slippage. |
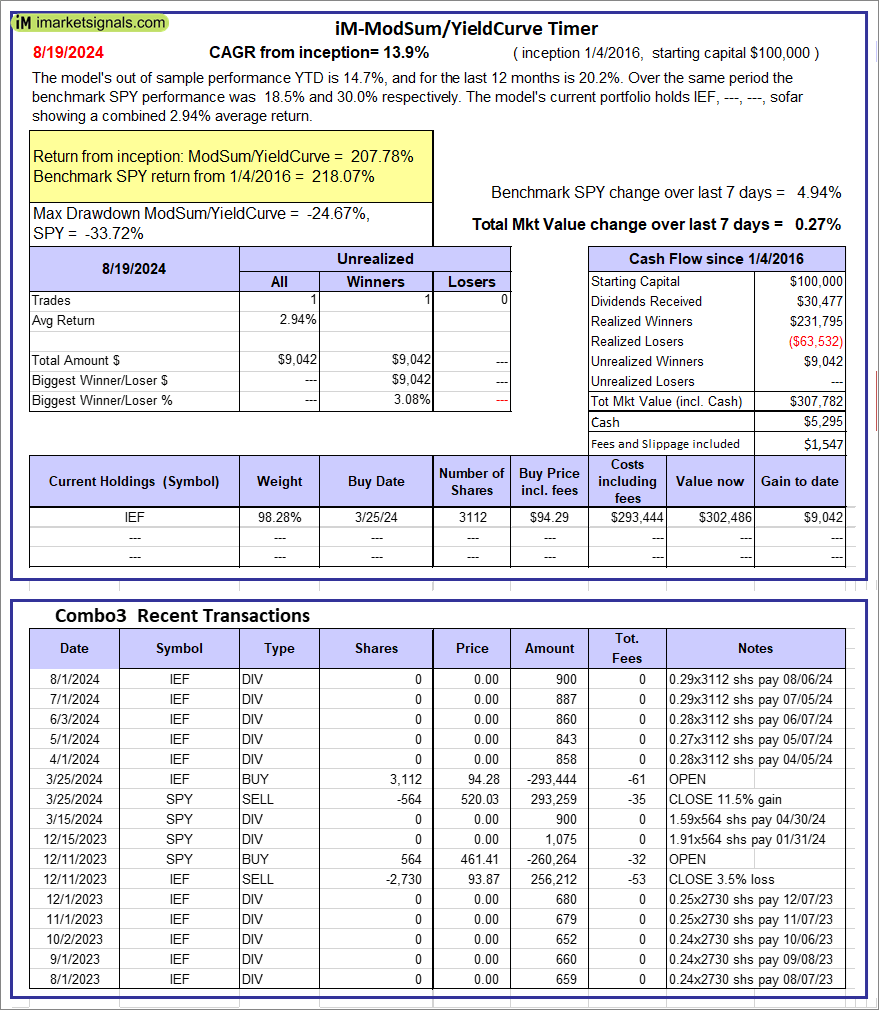 |
iM-ModSum/YieldCurve Timer: The model’s out of sample performance YTD is 14.7%, and for the last 12 months is 20.2%. Over the same period the benchmark SPY performance was 18.5% and 30.0% respectively. Over the previous week the market value of iM-PortSum/YieldCurve Timer gained 0.27% at a time when SPY gained 4.94%. A starting capital of $100,000 at inception on 1/1/2016 would have grown to $307,782 which includes $5,295 cash and excludes $1,547 spent on fees and slippage. |
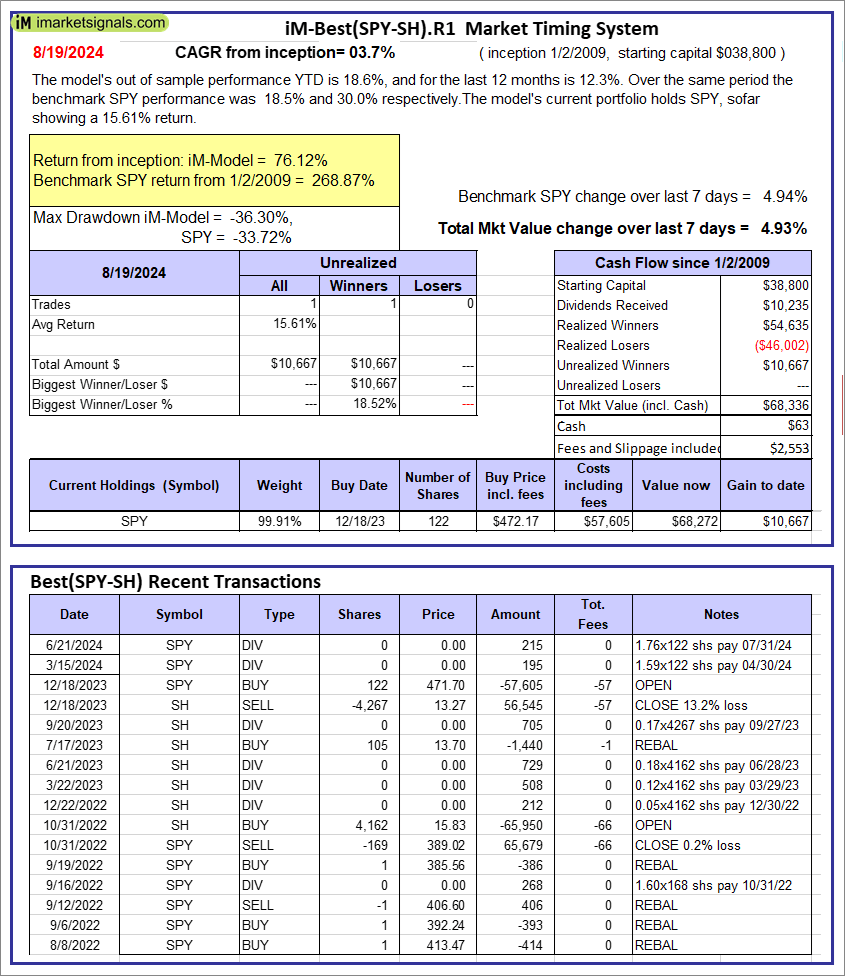 |
iM-Best(SPY-SH).R1: The model’s out of sample performance YTD is 18.6%, and for the last 12 months is 12.3%. Over the same period the benchmark SPY performance was 18.5% and 30.0% respectively. Over the previous week the market value of Best(SPY-SH) gained 4.93% at a time when SPY gained 4.94%. A starting capital of $100,000 at inception on 1/2/2009 would have grown to $68,336 which includes $63 cash and excludes $2,553 spent on fees and slippage. |
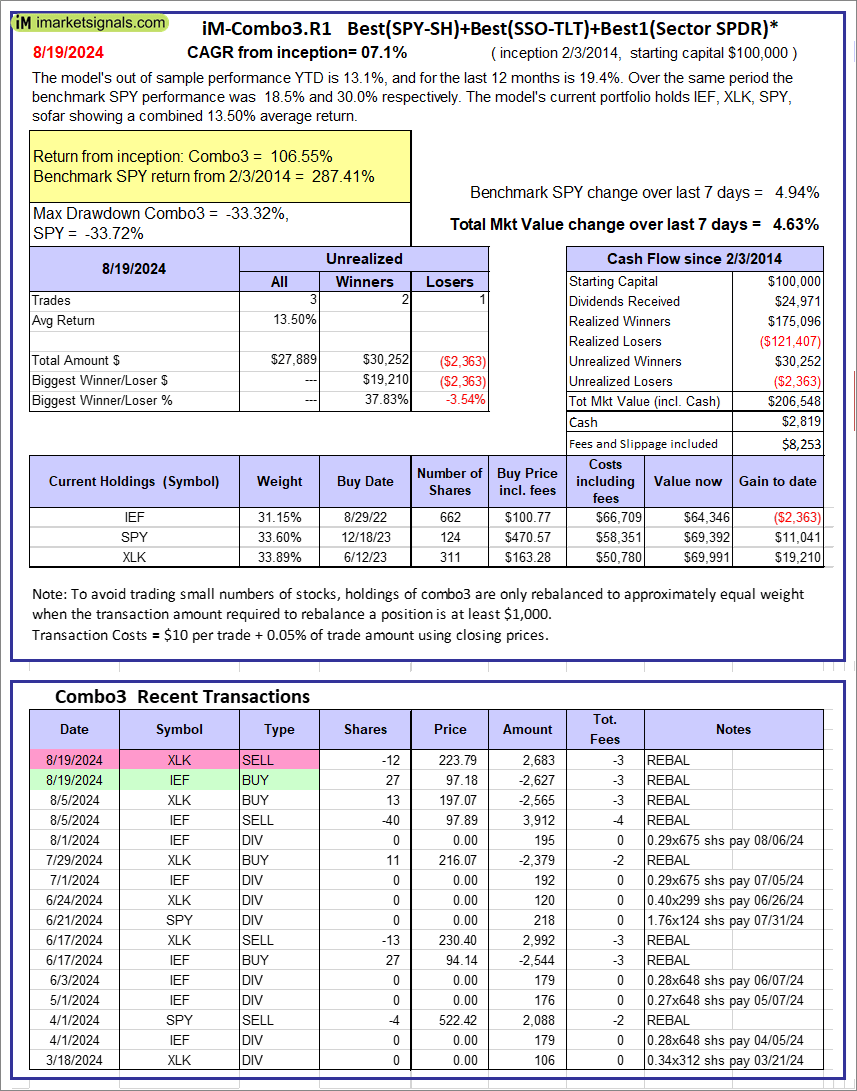 |
iM-Combo3.R1: The model’s out of sample performance YTD is 13.1%, and for the last 12 months is 19.4%. Over the same period the benchmark SPY performance was 18.5% and 30.0% respectively. Over the previous week the market value of iM-Combo3.R1 gained 4.63% at a time when SPY gained 4.94%. A starting capital of $100,000 at inception on 2/3/2014 would have grown to $206,548 which includes $2,819 cash and excludes $8,253 spent on fees and slippage. |
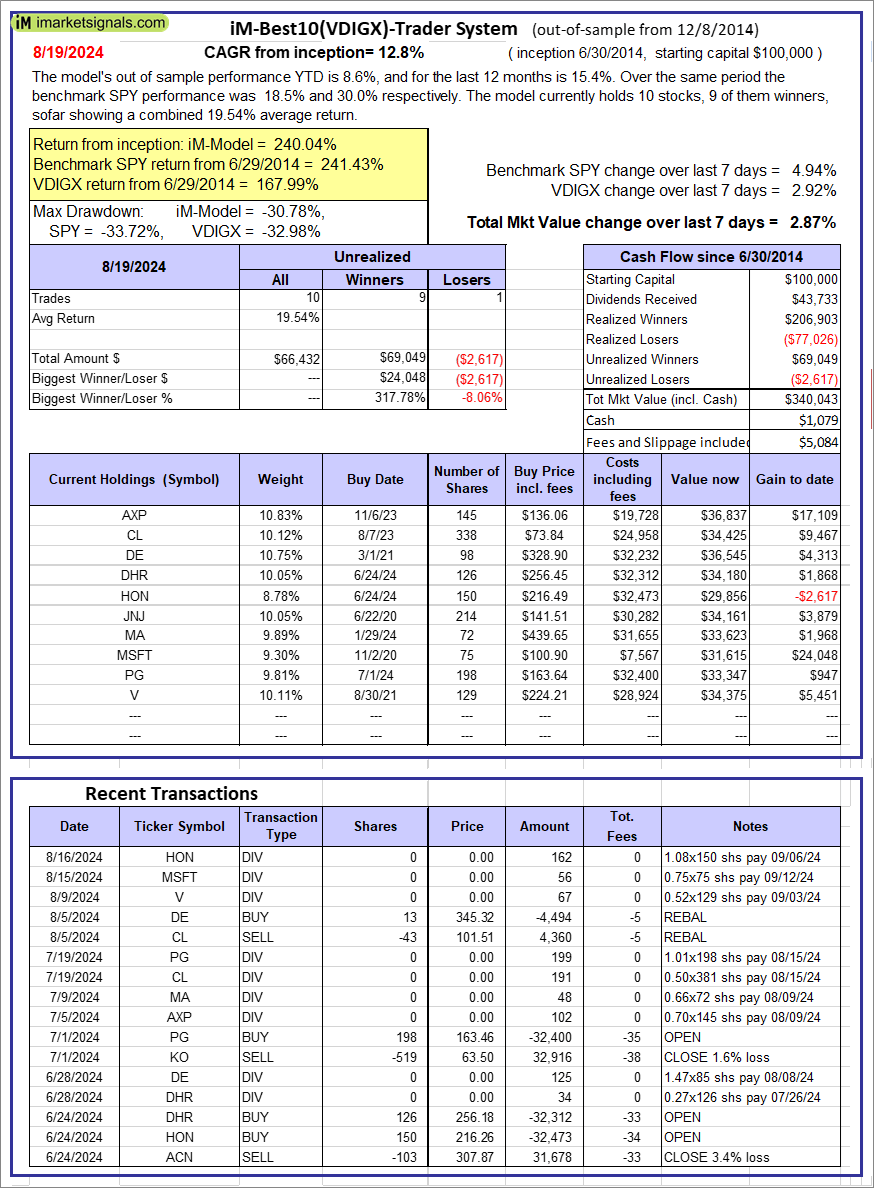 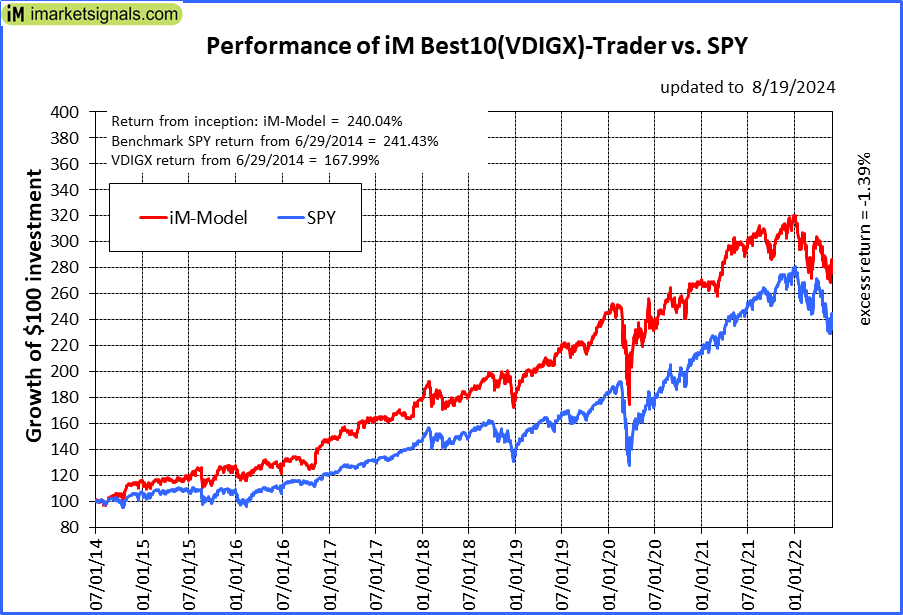 |
iM-Best10(VDIGX)-Trader: The model’s out of sample performance YTD is 8.6%, and for the last 12 months is 15.4%. Over the same period the benchmark SPY performance was 18.5% and 30.0% respectively. Since inception, on 7/1/2014, the model gained 240.04% while the benchmark SPY gained 241.43% and VDIGX gained 167.99% over the same period. Over the previous week the market value of iM-Best10(VDIGX) gained 2.87% at a time when SPY gained 4.94%. A starting capital of $100,000 at inception on 7/1/2014 would have grown to $340,043 which includes $1,079 cash and excludes $5,084 spent on fees and slippage. |
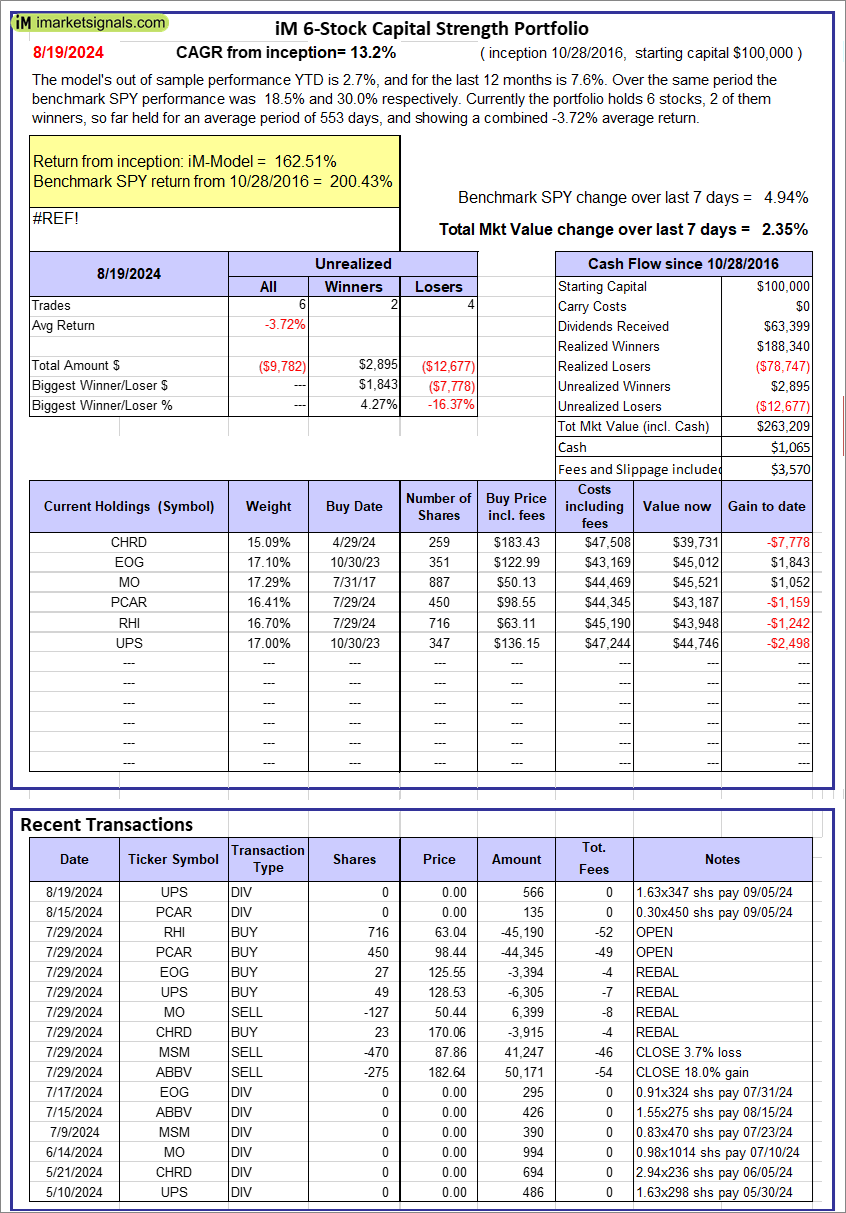 |
iM 6-Stock Capital Strength Portfolio: The model’s out of sample performance YTD is 2.7%, and for the last 12 months is 7.6%. Over the same period the benchmark SPY performance was 18.5% and 30.0% respectively. Over the previous week the market value of the iM 6-Stock Capital Strength Portfolio gained 2.35% at a time when SPY gained 4.94%. A starting capital of $100,000 at inception on 10/28/2016 would have grown to $263,209 which includes $1,065 cash and excludes $3,570 spent on fees and slippage. |
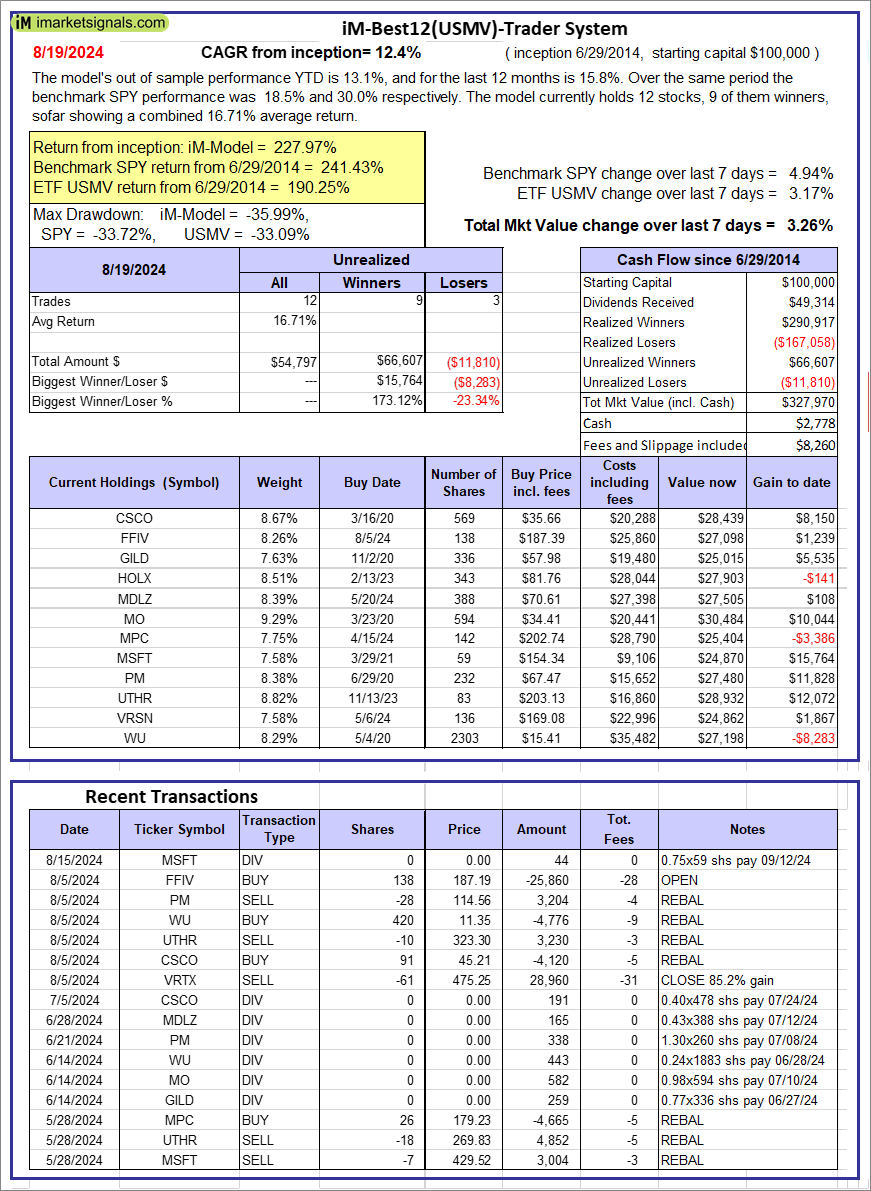 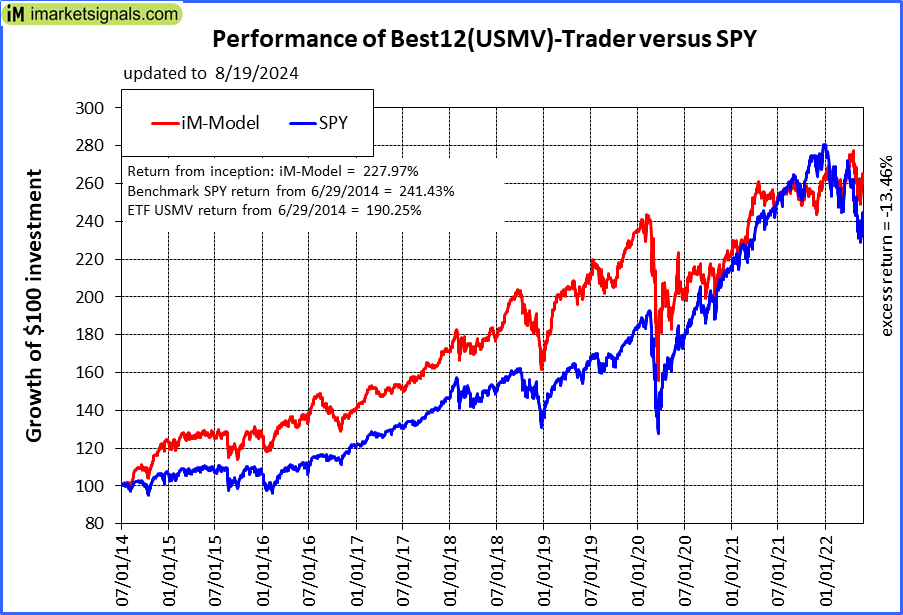 |
iM-Best12(USMV)-Trader: The model’s out of sample performance YTD is 13.1%, and for the last 12 months is 15.8%. Over the same period the benchmark SPY performance was 18.5% and 30.0% respectively. Since inception, on 6/30/2014, the model gained 227.97% while the benchmark SPY gained 241.43% and the ETF USMV gained 190.25% over the same period. Over the previous week the market value of iM-Best12(USMV)-Trader gained 3.26% at a time when SPY gained 4.94%. A starting capital of $100,000 at inception on 6/30/2014 would have grown to $327,970 which includes $2,778 cash and excludes $8,260 spent on fees and slippage. |
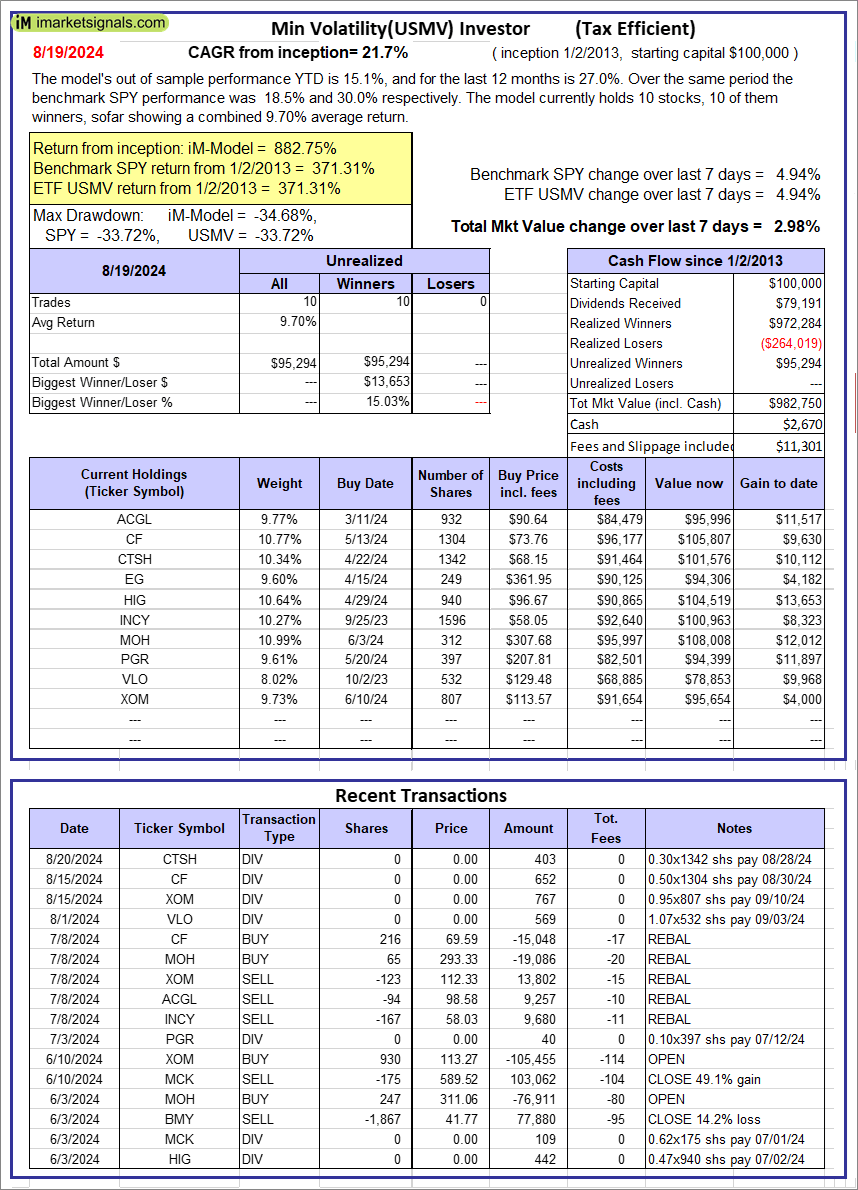 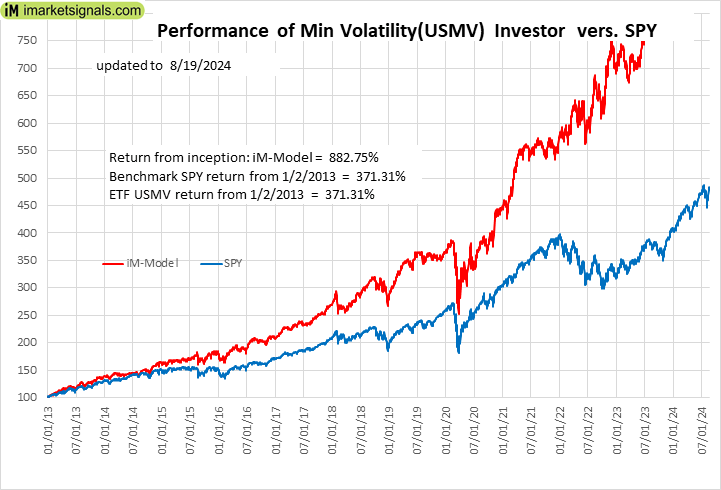 |
iM-Min Volatility(USMV) Investor (Tax Efficient): The model’s out of sample performance YTD is 15.1%, and for the last 12 months is 27.0%. Over the same period the benchmark SPY performance was 18.5% and 30.0% respectively. Since inception, on 1/3/2013, the model gained 882.75% while the benchmark SPY gained 371.31% and the ETF USMV gained 371.31% over the same period. Over the previous week the market value of iM-Best12(USMV)Q1 gained 2.98% at a time when SPY gained 4.94%. A starting capital of $100,000 at inception on 1/3/2013 would have grown to $982,750 which includes $2,670 cash and excludes $11,301 spent on fees and slippage. |
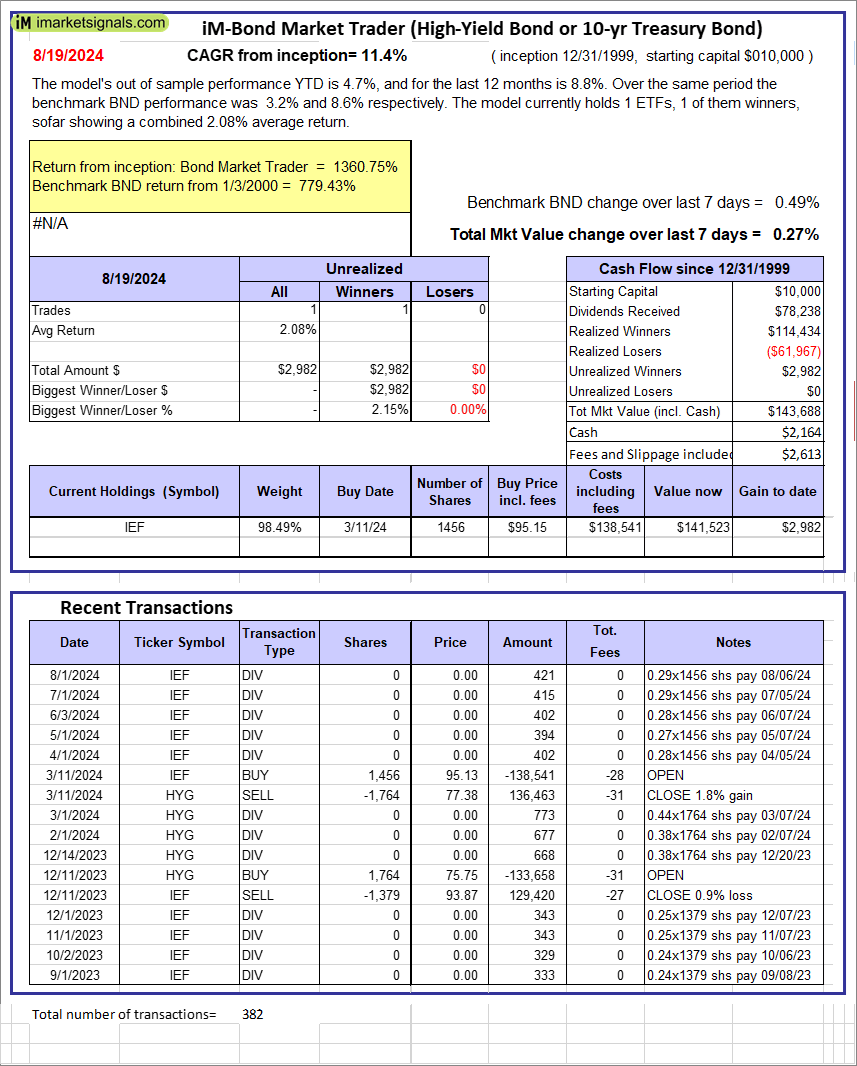 |
iM-Bond Market Trader (High-Yield Bond or 10-yr Treasury Bond): The model’s out of sample performance YTD is 4.7%, and for the last 12 months is 8.8%. Over the same period the benchmark BND performance was 3.2% and 8.6% respectively. Over the previous week the market value of the iM-Bond Market Trader (High-Yield Bond or 10-yr Treasury Bond) gained 0.27% at a time when BND gained 0.49%. A starting capital of $10,000 at inception on 1/3/2000 would have grown to $143,688 which includes $2,164 cash and excludes $2,613 spent on fees and slippage. |
|
|
iM-ModSum/YieldCurve Timer: The model’s out of sample performance YTD is 14.7%, and for the last 12 months is 20.2%. Over the same period the benchmark SPY performance was 18.5% and 30.0% respectively. Over the previous week the market value of iM-PortSum/YieldCurve Timer gained 0.27% at a time when SPY gained 4.94%. A starting capital of $100,000 at inception on 1/1/2016 would have grown to $307,782 which includes $5,295 cash and excludes $1,547 spent on fees and slippage. |
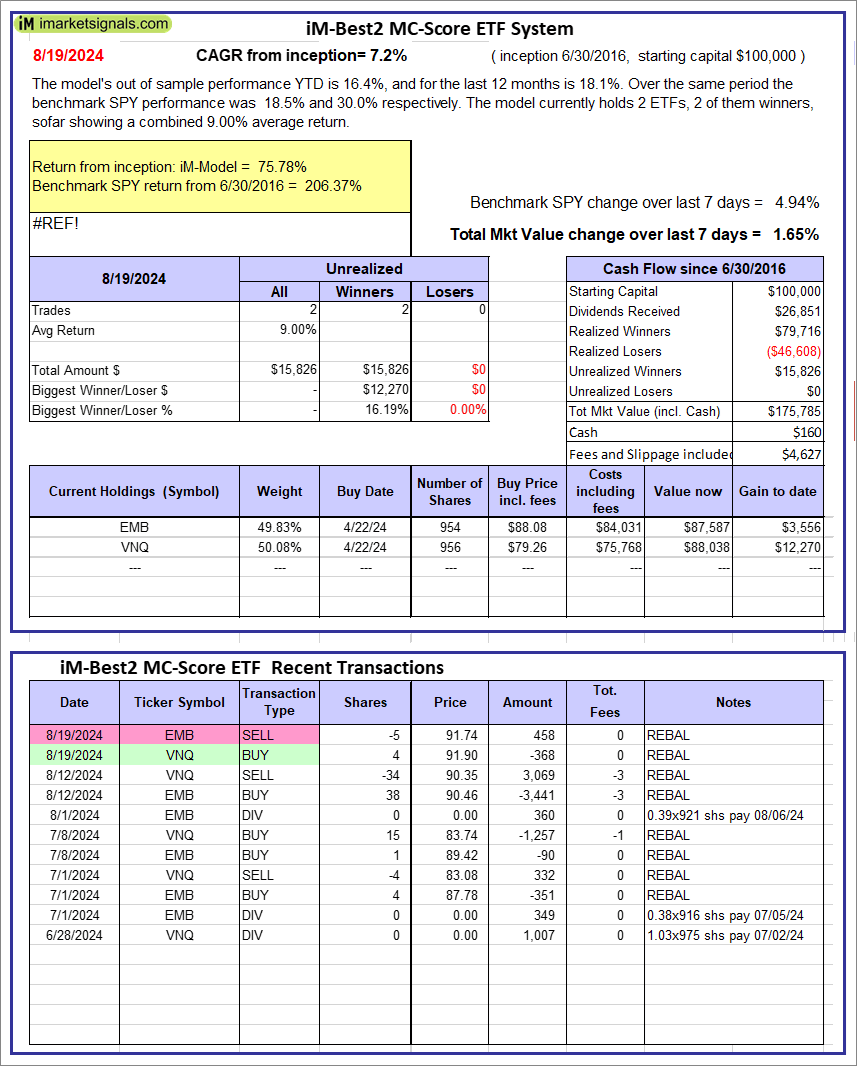 |
iM-Best2 MC-Score ETF System: The model’s out of sample performance YTD is 16.4%, and for the last 12 months is 18.1%. Over the same period the benchmark SPY performance was 18.5% and 30.0% respectively. Over the previous week the market value of the iM-Best2 MC-Score ETF System gained 1.65% at a time when SPY gained 4.94%. A starting capital of $100,000 at inception on 6/30/2016 would have grown to $175,785 which includes $160 cash and excludes $4,627 spent on fees and slippage. |
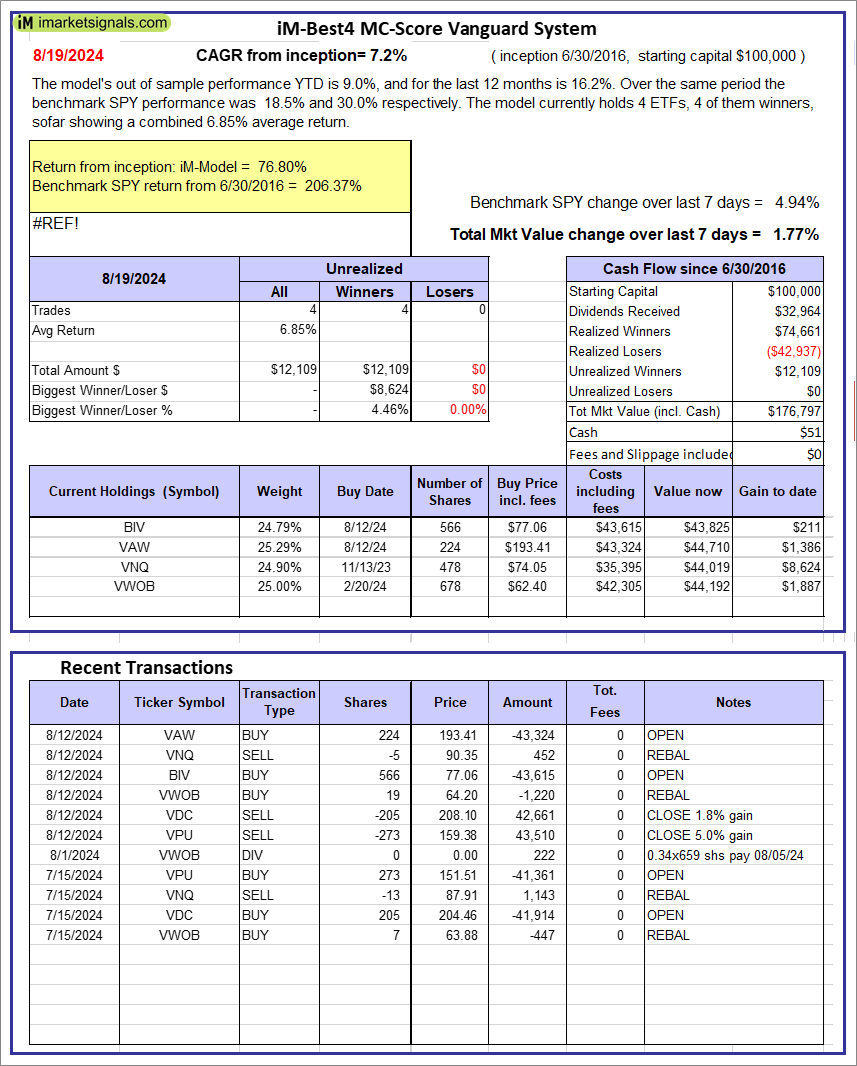 |
iM-Best4 MC-Score Vanguard System: The model’s out of sample performance YTD is 9.0%, and for the last 12 months is 16.2%. Over the same period the benchmark SPY performance was 18.5% and 30.0% respectively. Over the previous week the market value of the iM-Best4 MC-Score Vanguard System gained 1.77% at a time when SPY gained 4.94%. A starting capital of $100,000 at inception on 6/30/2016 would have grown to $176,797 which includes $51 cash and excludes $00 spent on fees and slippage. |
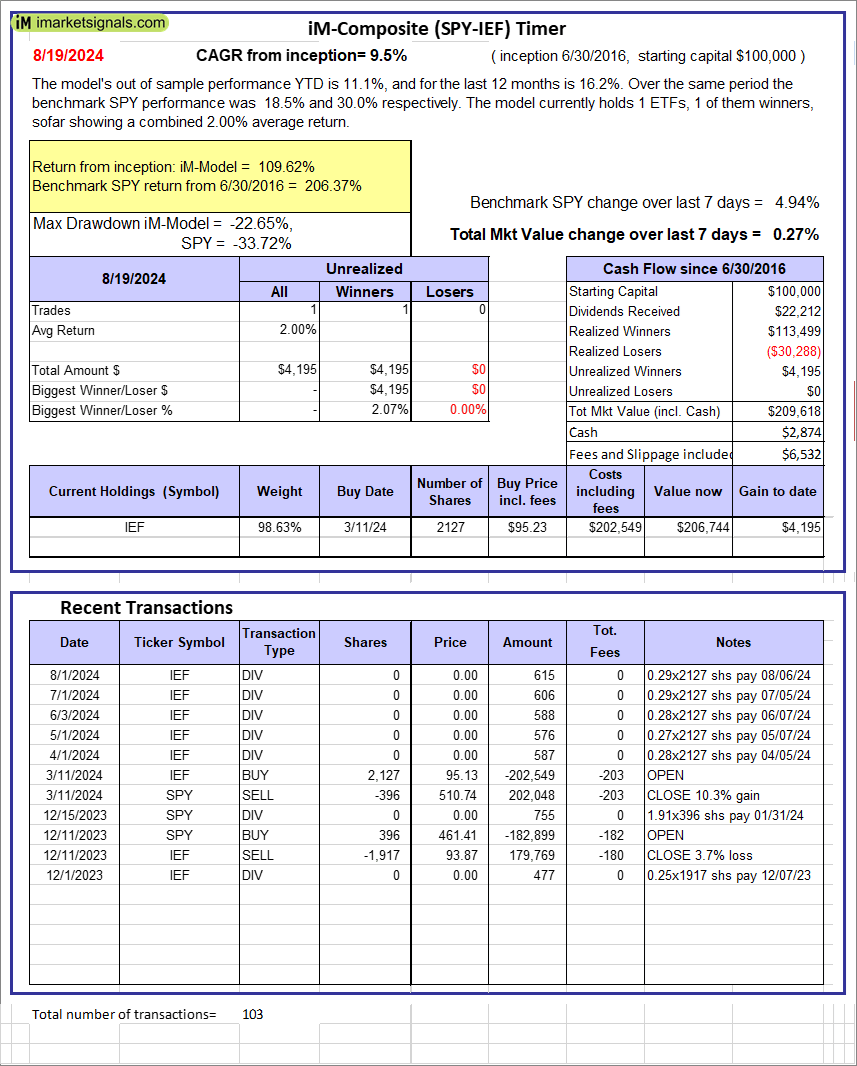 |
iM-Composite (SPY-IEF) Timer: The model’s out of sample performance YTD is 11.1%, and for the last 12 months is 16.2%. Over the same period the benchmark SPY performance was 18.5% and 30.0% respectively. Over the previous week the market value of the iM-Composite (SPY-IEF) Timer gained 0.27% at a time when SPY gained 4.94%. A starting capital of $100,000 at inception on 6/30/2016 would have grown to $209,618 which includes $2,874 cash and excludes $6,532 spent on fees and slippage. |
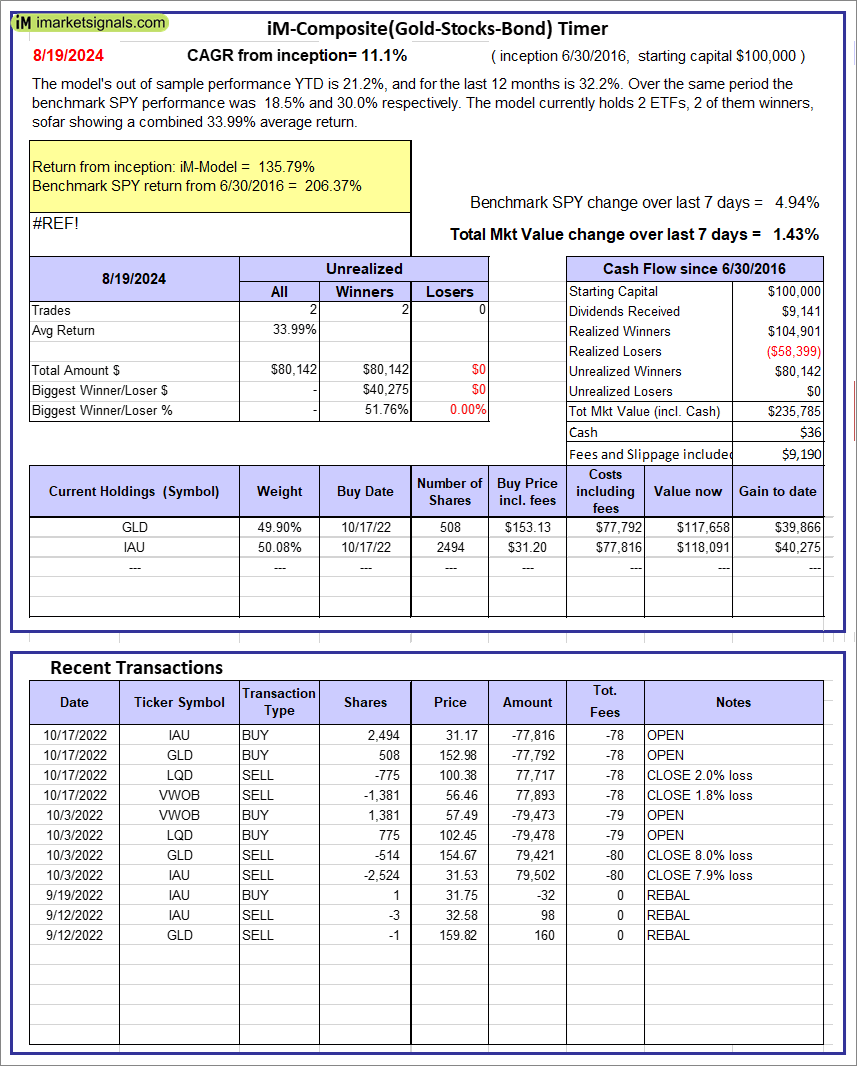 |
iM-Composite(Gold-Stocks-Bond) Timer: The model’s out of sample performance YTD is 21.2%, and for the last 12 months is 32.2%. Over the same period the benchmark SPY performance was 18.5% and 30.0% respectively. Over the previous week the market value of the iM-Composite(Gold-Stocks-Bond) Timer gained 1.43% at a time when SPY gained 4.94%. A starting capital of $100,000 at inception on 6/30/2016 would have grown to $235,785 which includes $36 cash and excludes $9,190 spent on fees and slippage. |
iM-Best Reports – 8/19/2024
Posted in pmp SPY-SH
Leave a Reply
You must be logged in to post a comment.