
  |
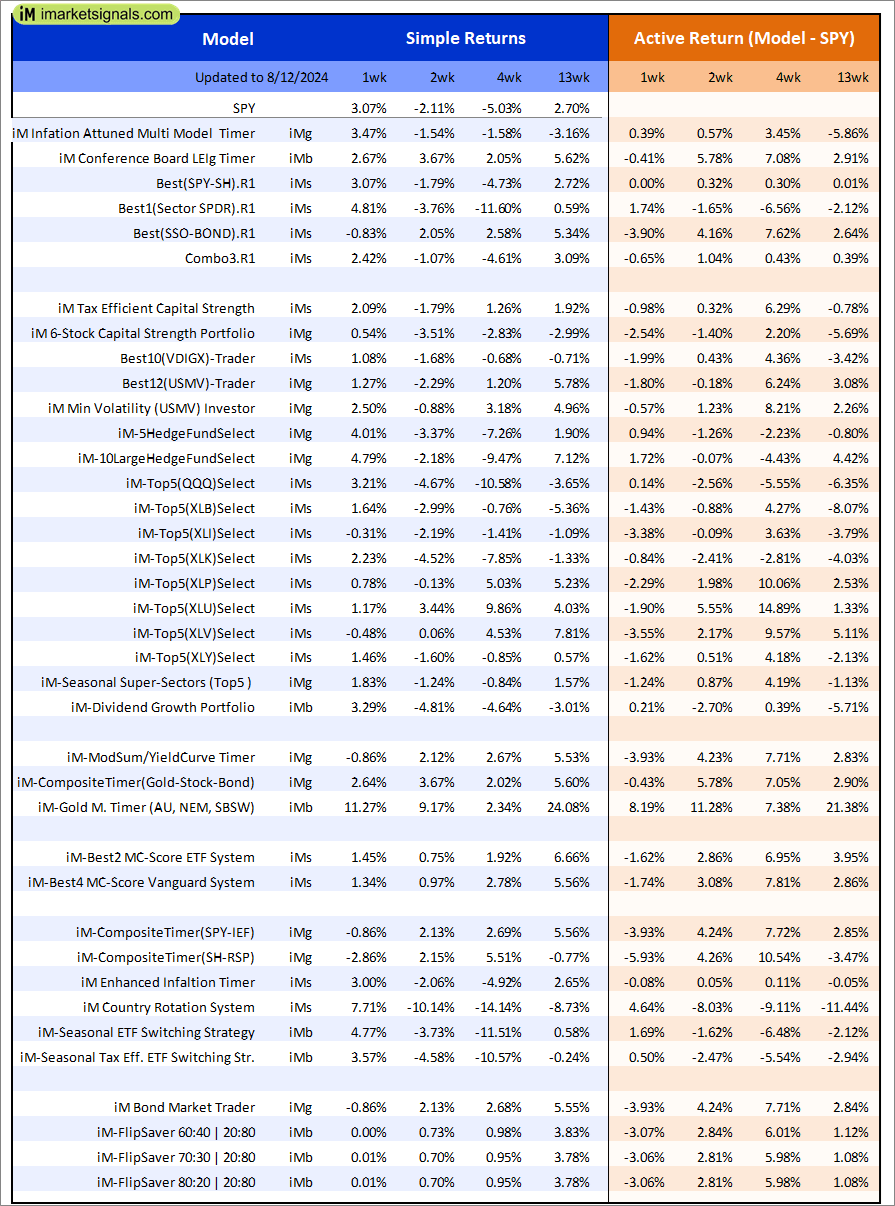
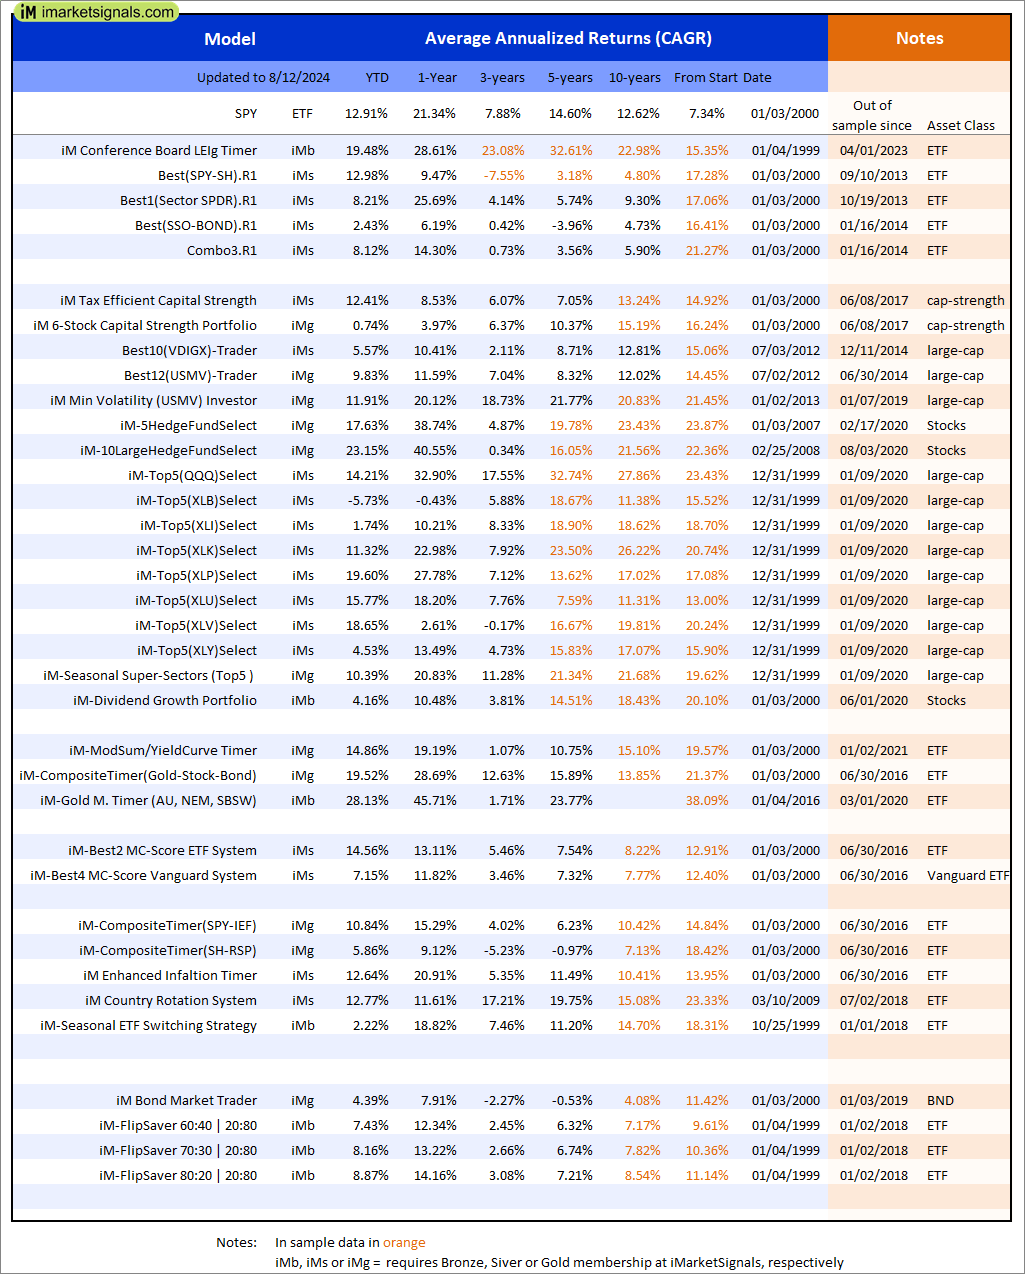
Out of sample performance summary of our models for the past 1, 2, 4 and 13 week periods. The active active return indicates how the models over- or underperformed the benchmark ETF SPY. Also the YTD, and the 1-, 3-, 5- and 10-year annualized returns are shown in the second table |
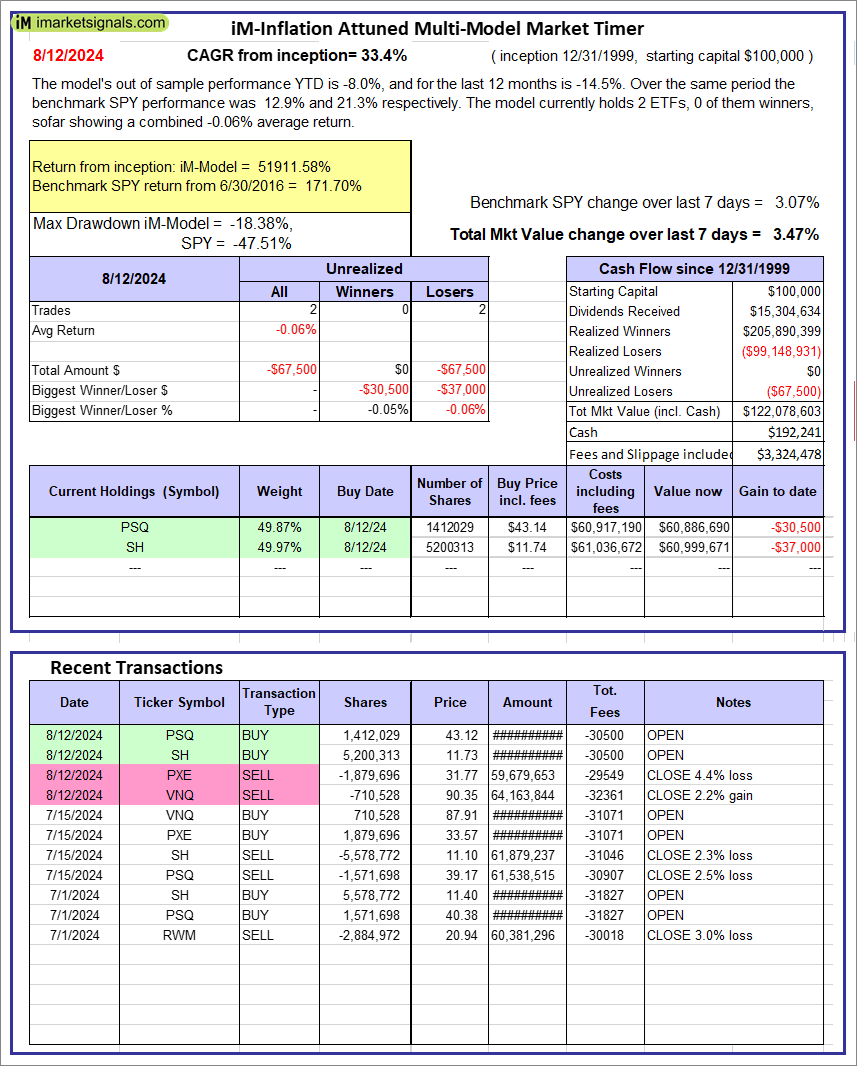 |
iM-Inflation Attuned Multi-Model Market Timer: The model’s out of sample performance YTD is -8.0%, and for the last 12 months is -14.5%. Over the same period the benchmark SPY performance was 12.9% and 21.3% respectively. Over the previous week the market value of the iM-Inflation Attuned Multi-Model Market Timer gained 3.47% at a time when SPY gained 3.07%. A starting capital of $100,000 at inception on 3/24/2017 would have grown to $122,078,603 which includes $192,241 cash and excludes $3,324,478 spent on fees and slippage. |
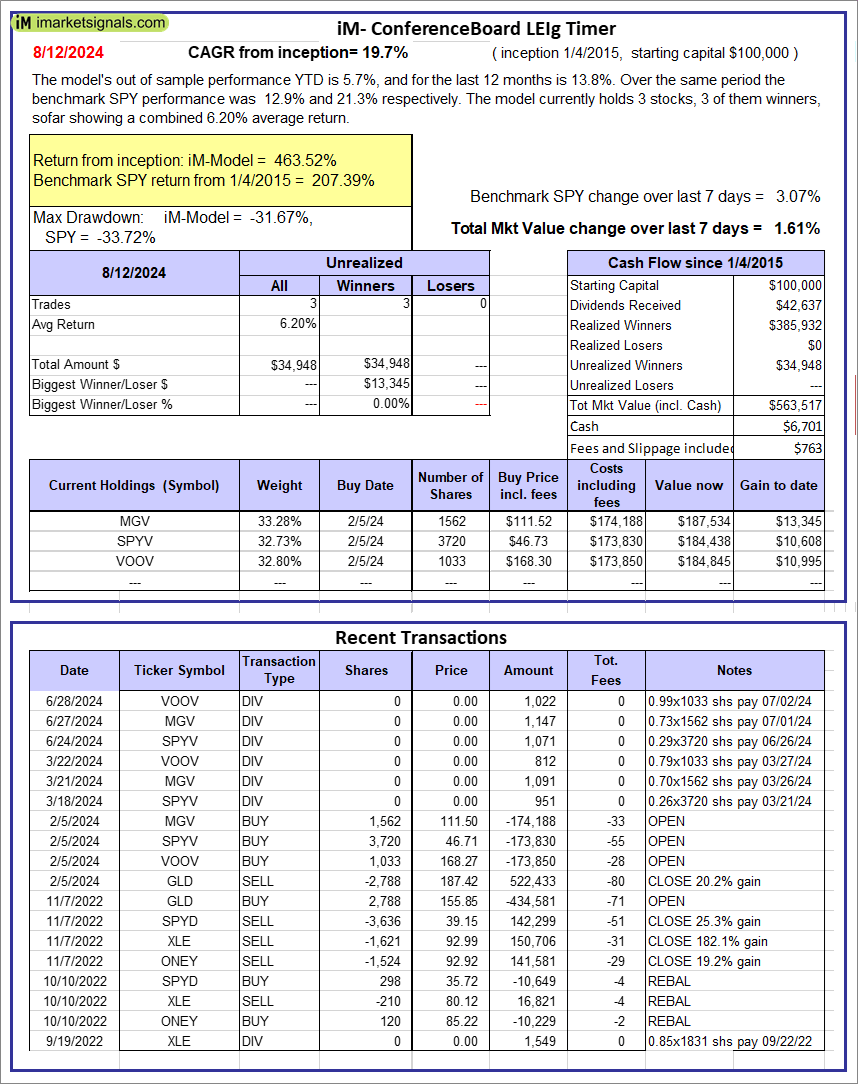 |
iM-Conference Board LEIg Timer: The model’s performance YTD is 14.3%, and for the last 12 months is 7.3%. Over the same period the benchmark SPY performance was 20.1% and 9.4% respectively. Over the previous week the market value of the iM-Conference Board LEIg Timer gained 1.61% at a time when SPY gained 3.07%. A starting capital of $100,000 at inception on 4/5/2017 would have grown to $563,517 which includes $6,701 cash and excludes $763 spent on fees and slippage. |
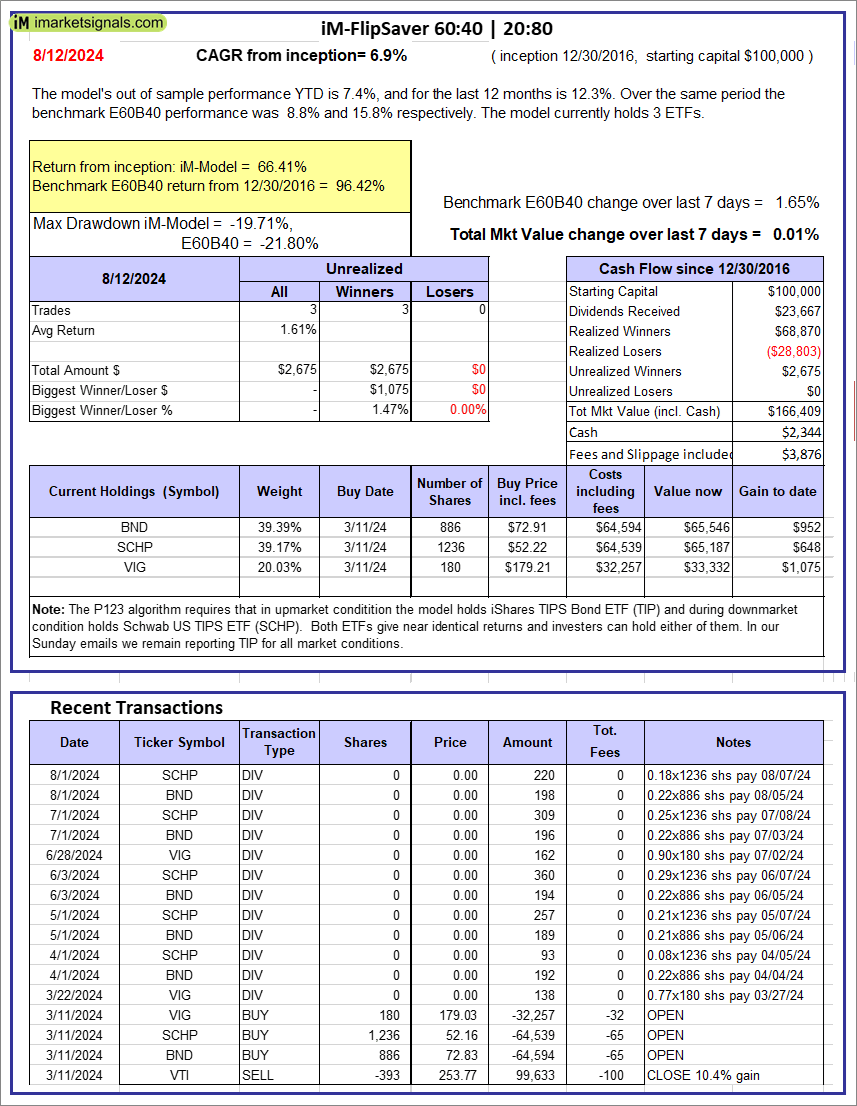 |
iM-FlipSaver 60:40 | 20:80 – 2017: The model’s out of sample performance YTD is 7.4%, and for the last 12 months is 12.3%. Over the same period the benchmark E60B40 performance was 8.8% and 15.8% respectively. Over the previous week the market value of iM-FlipSaver 80:20 | 20:80 gained 0.01% at a time when SPY gained 1.65%. A starting capital of $100,000 at inception on 7/16/2015 would have grown to $166,409 which includes $2,344 cash and excludes $3,876 spent on fees and slippage. |
 |
iM-FlipSaver 70:30 | 20:80 – 2017: The model’s out of sample performance YTD is 8.2%, and for the last 12 months is 13.2%. Over the same period the benchmark E60B40 performance was 8.8% and 15.8% respectively. Over the previous week the market value of iM-FlipSaver 70:30 | 20:80 gained 0.01% at a time when SPY gained 1.65%. A starting capital of $100,000 at inception on 7/15/2015 would have grown to $173,388 which includes $2,362 cash and excludes $4,076 spent on fees and slippage. |
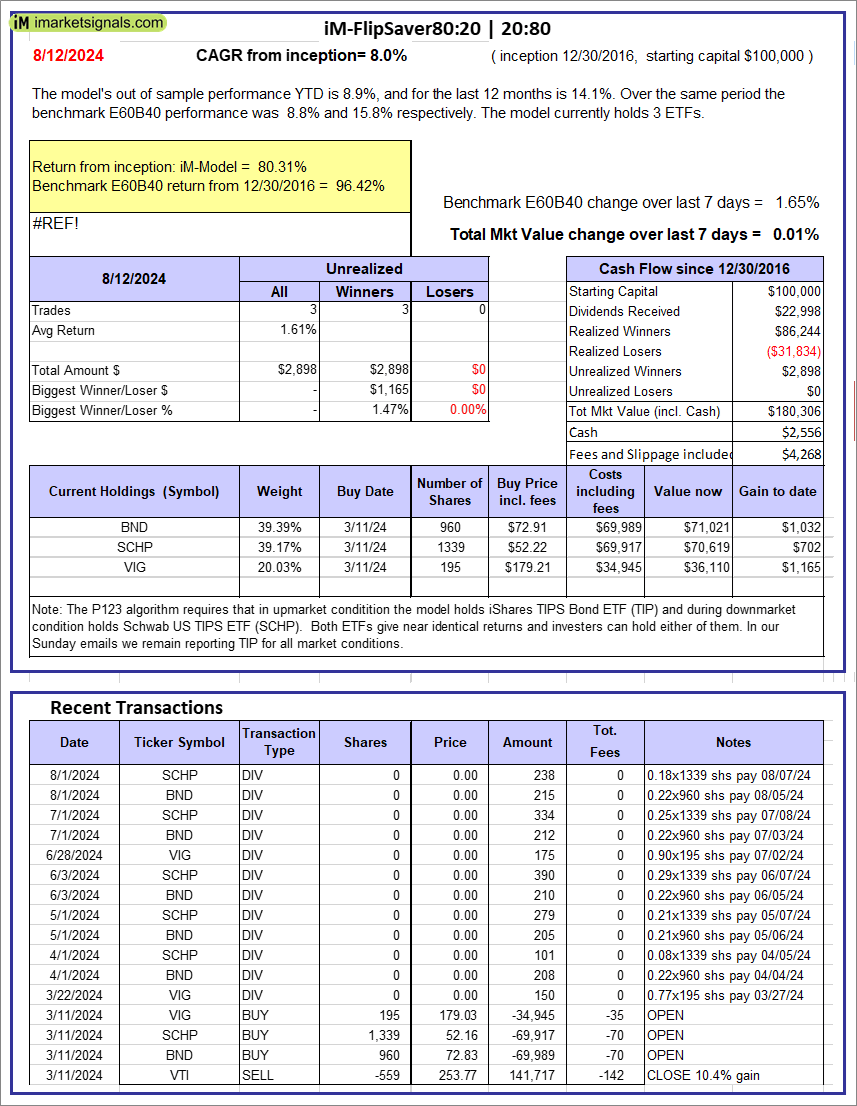 |
iM-FlipSaver 80:20 | 20:80 – 2017: The model’s out of sample performance YTD is 8.9%, and for the last 12 months is 14.1%. Over the same period the benchmark E60B40 performance was 8.8% and 15.8% respectively. Over the previous week the market value of iM-FlipSaver 80:20 | 20:80 gained 0.01% at a time when SPY gained 1.65%. A starting capital of $100,000 at inception on 1/2/2017 would have grown to $180,306 which includes $2,556 cash and excludes $4,268 spent on fees and slippage. |
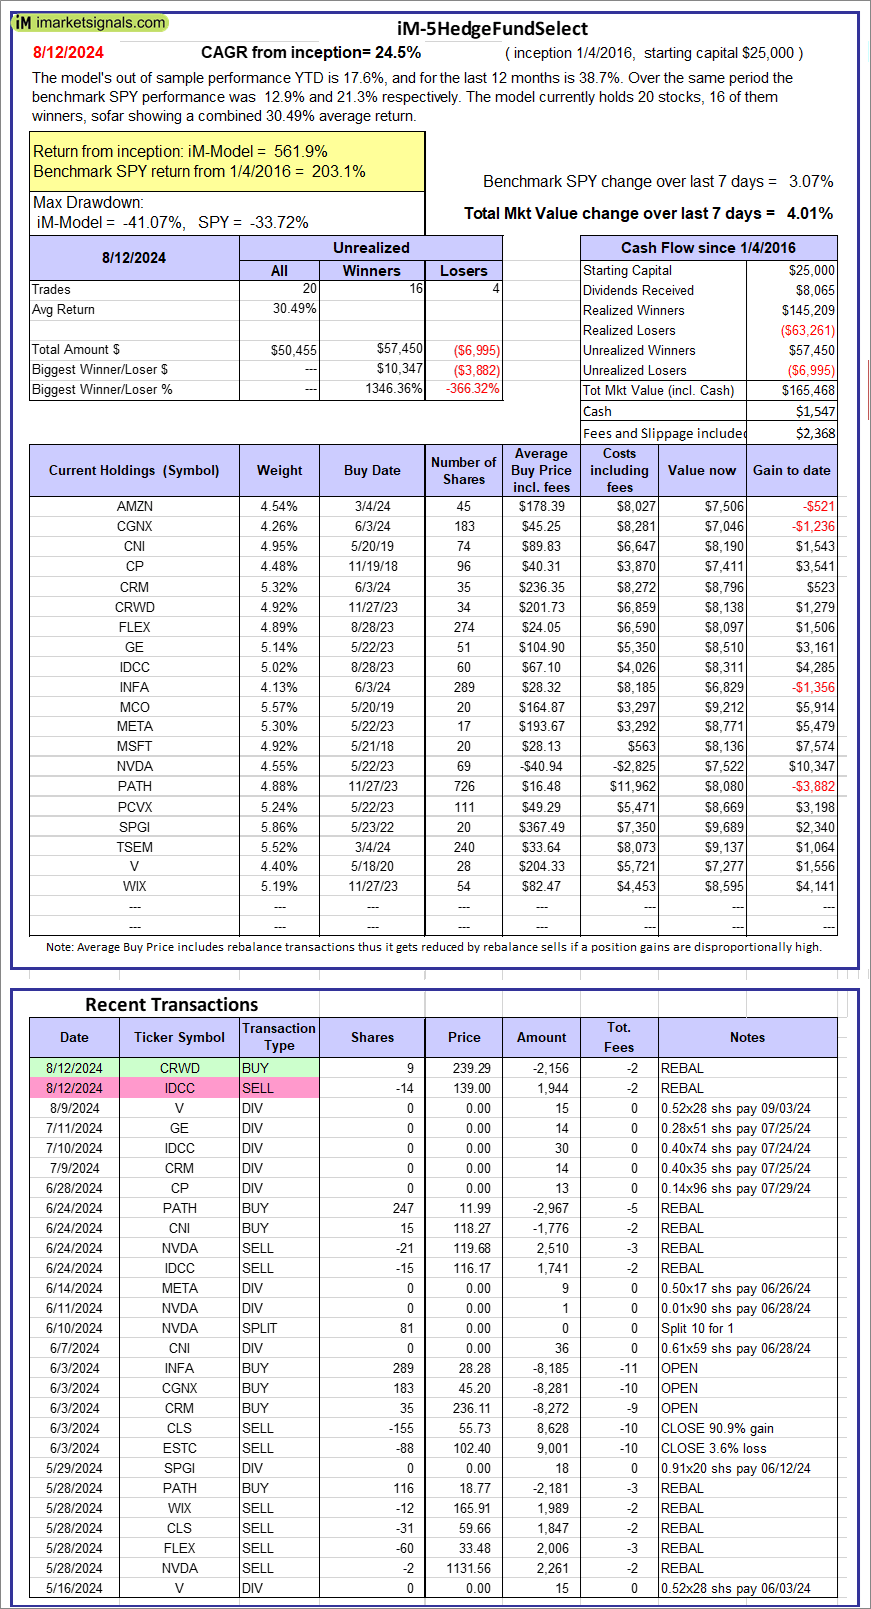 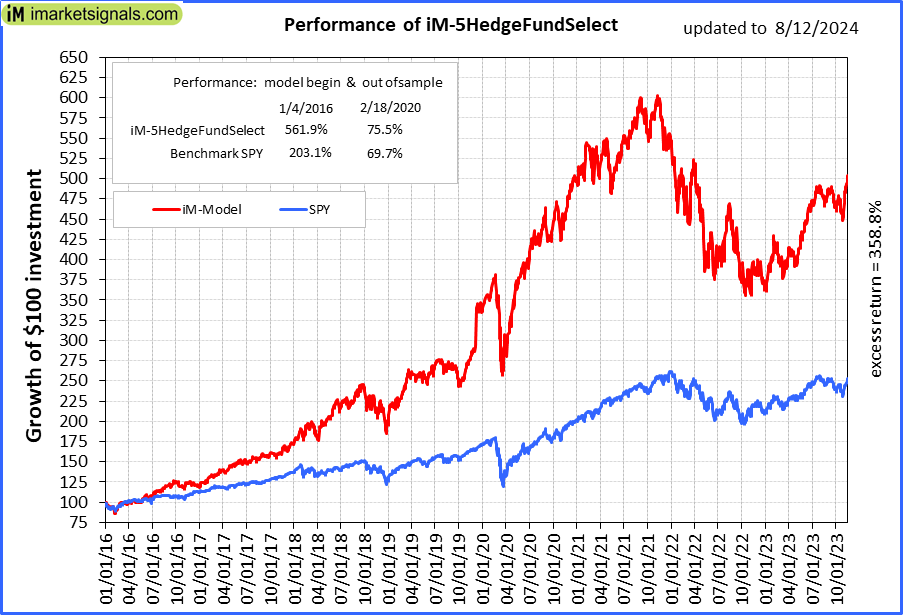 |
iM-5HedgeFundSelect: Since inception, on 1/5/2016, the model gained 561.87% while the benchmark SPY gained 203.09% over the same period. Over the previous week the market value of iM-5HedgeFundSelect gained 4.01% at a time when SPY gained 3.07%. A starting capital of $25,000 at inception on 1/5/2016 would have grown to $165,468 which includes $1,547 cash and excludes $2,368 spent on fees and slippage. |
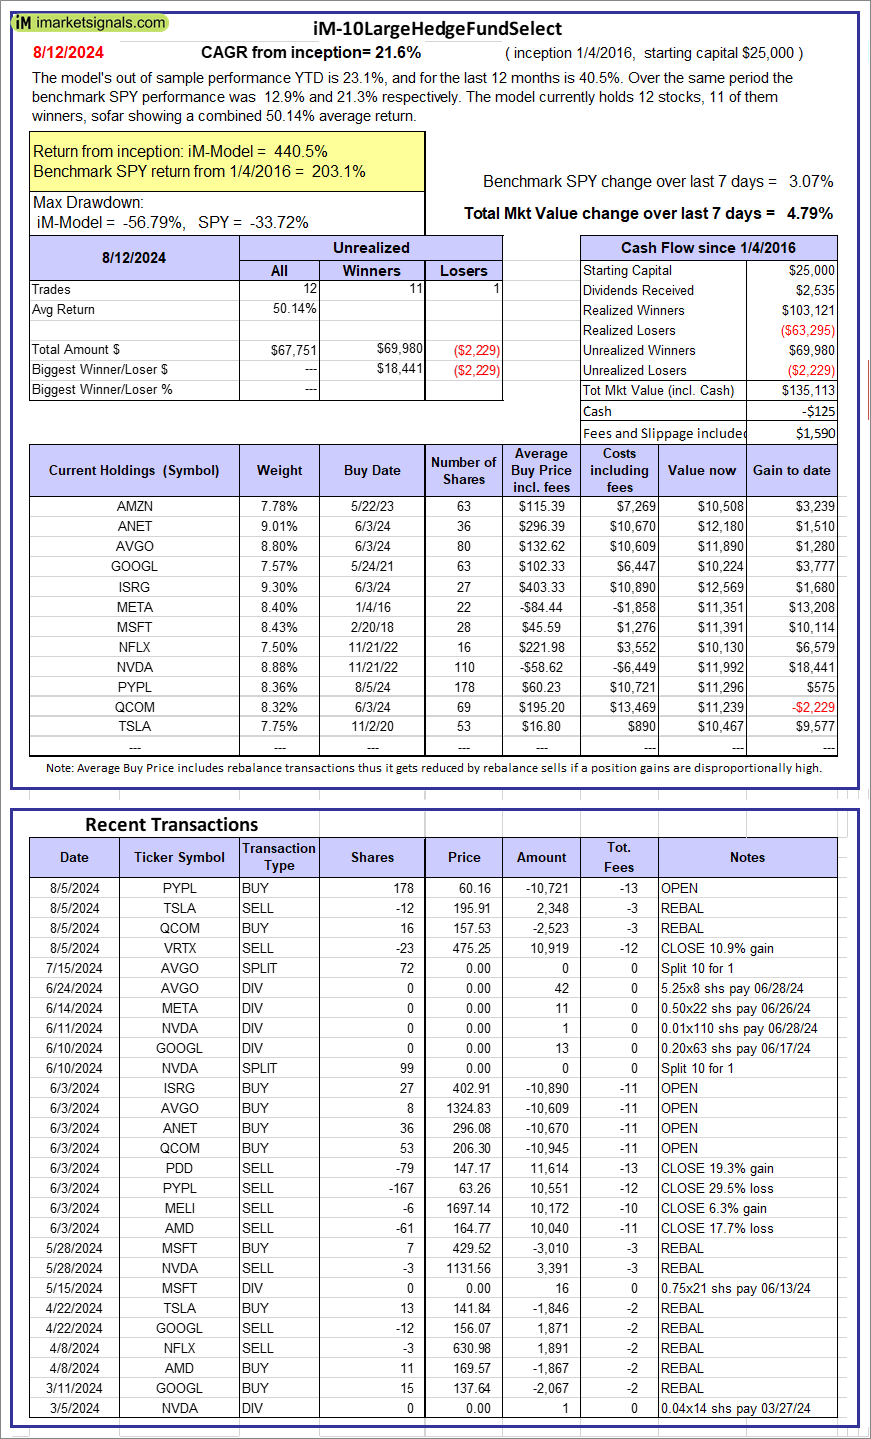 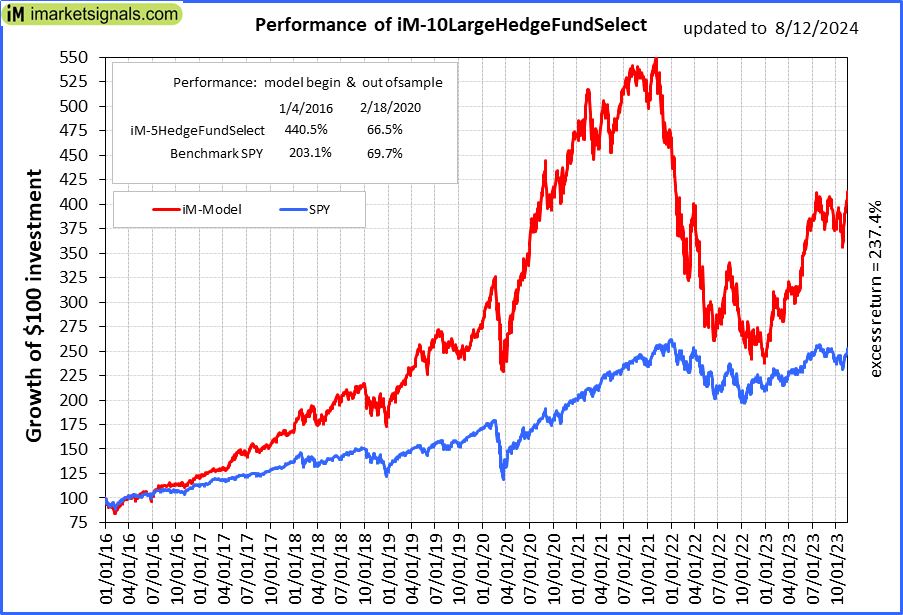 |
iM-10LargeHedgeFundSelect: Since inception, on 1/5/2016, the model gained 440.45% while the benchmark SPY gained 203.09% over the same period. Over the previous week the market value of iM-10LargeHedgeFundSelect gained 4.79% at a time when SPY gained 3.07%. A starting capital of $25,000 at inception on 1/5/2016 would have grown to $135,113 which includes -$125 cash and excludes $1,590 spent on fees and slippage. |
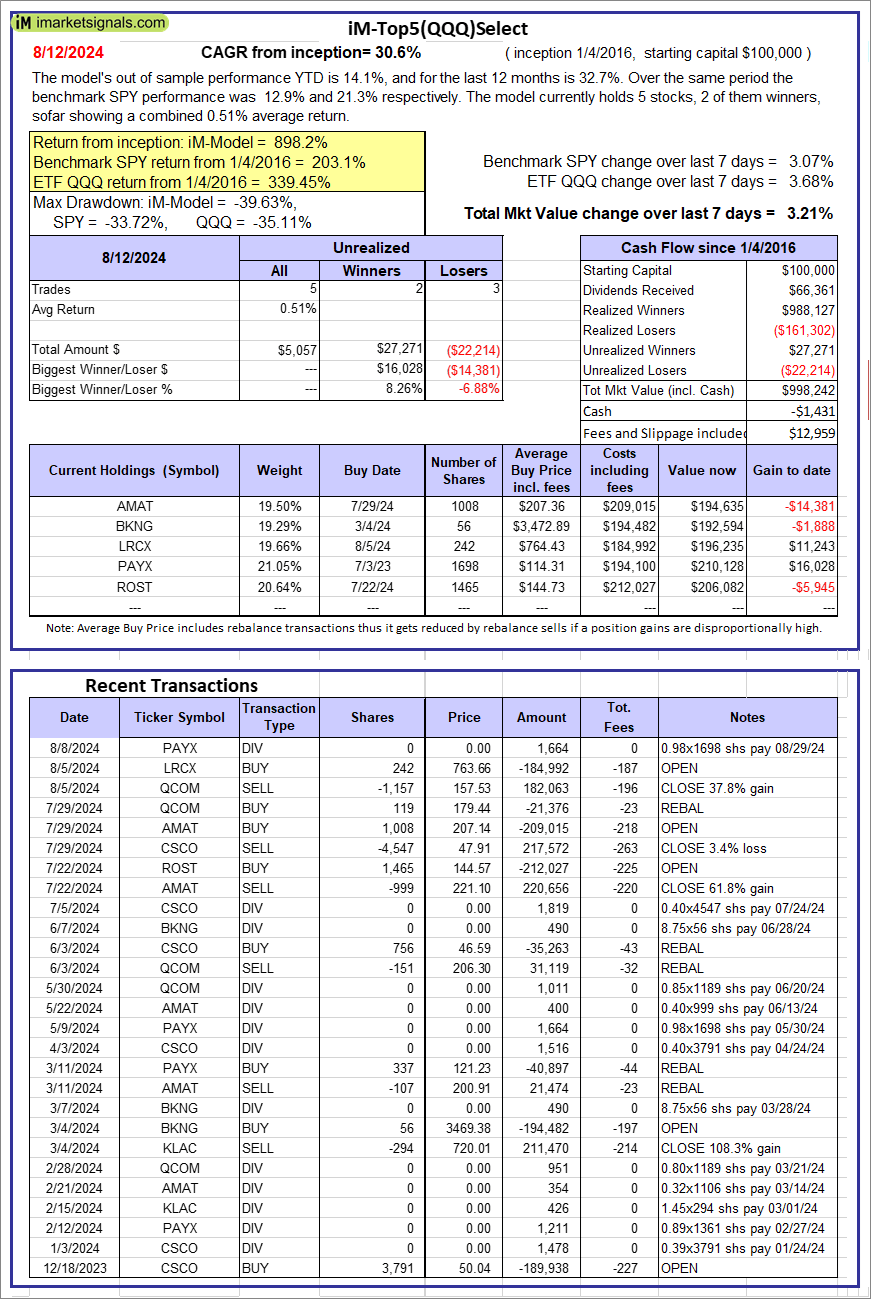 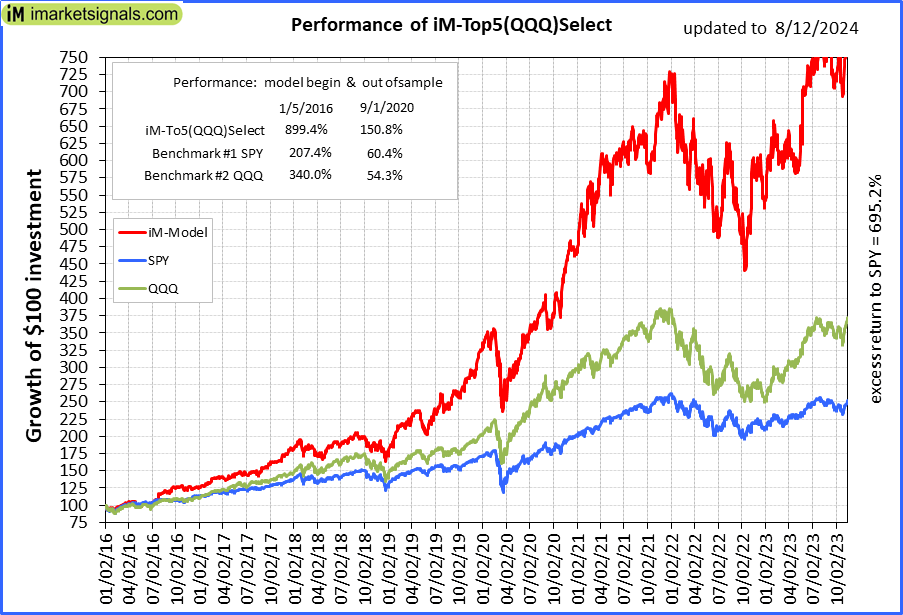 |
iM-Top5(QQQ)Select: Since inception, on 1/5/2016, the model gained 898.24% while the benchmark SPY gained 203.09% over the same period. Over the previous week the market value of iM-Top5(QQQ)Select gained 3.21% at a time when SPY gained 3.07%. A starting capital of $100,000 at inception on 1/5/2016 would have grown to $998,242 which includes -$1,431 cash and excludes $12,959 spent on fees and slippage. |
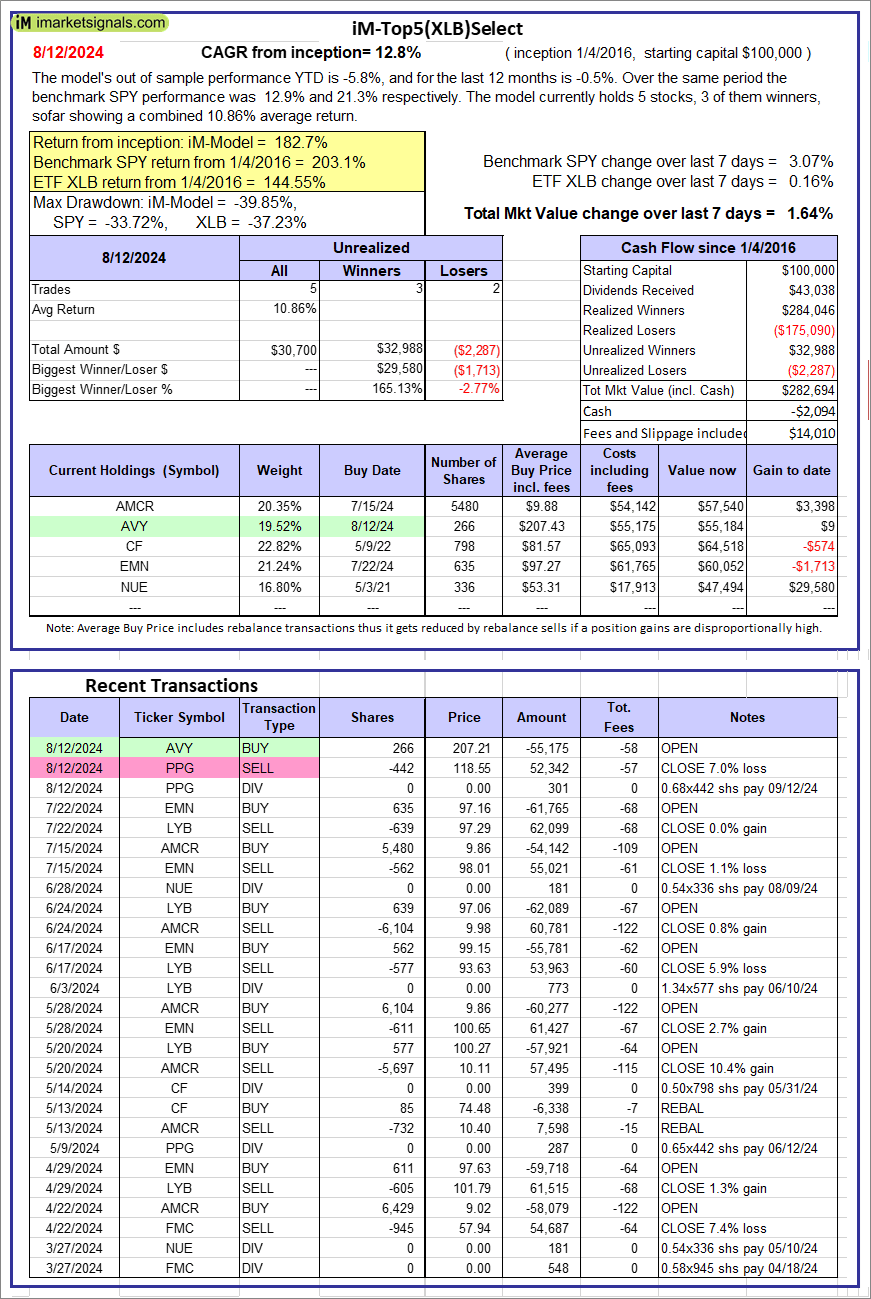 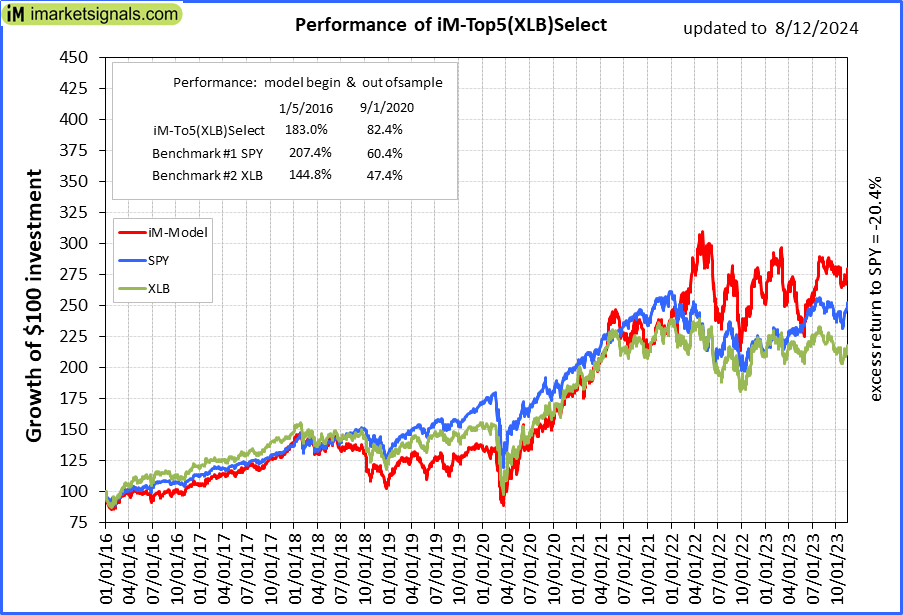 |
iM-Top5(XLB)Select: Since inception, on 1/5/2016, the model gained 182.69% while the benchmark SPY gained 203.09% over the same period. Over the previous week the market value of iM-Top5(XLB)Select gained 1.64% at a time when SPY gained 3.07%. A starting capital of $100,000 at inception on 1/5/2016 would have grown to $282,694 which includes -$2,094 cash and excludes $14,010 spent on fees and slippage. |
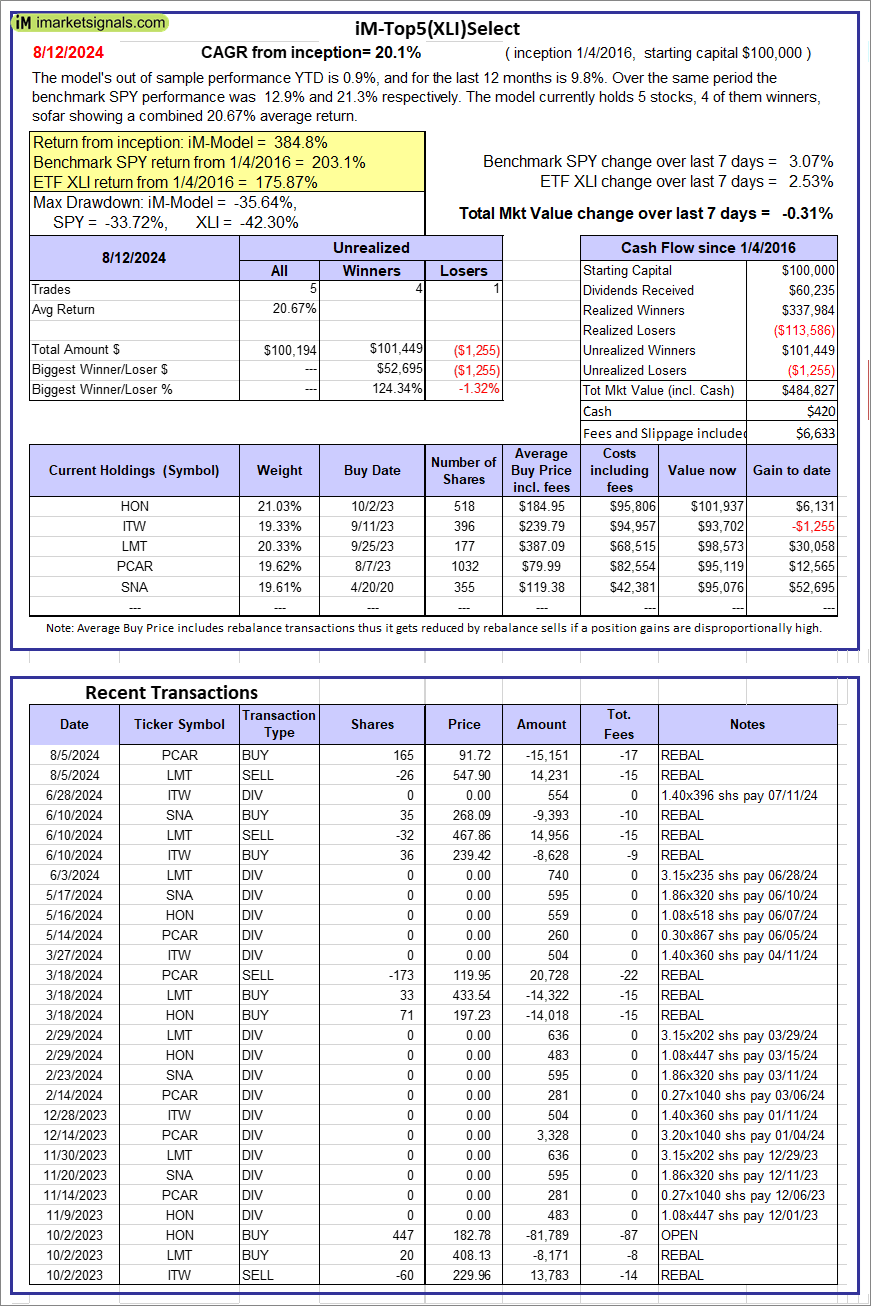 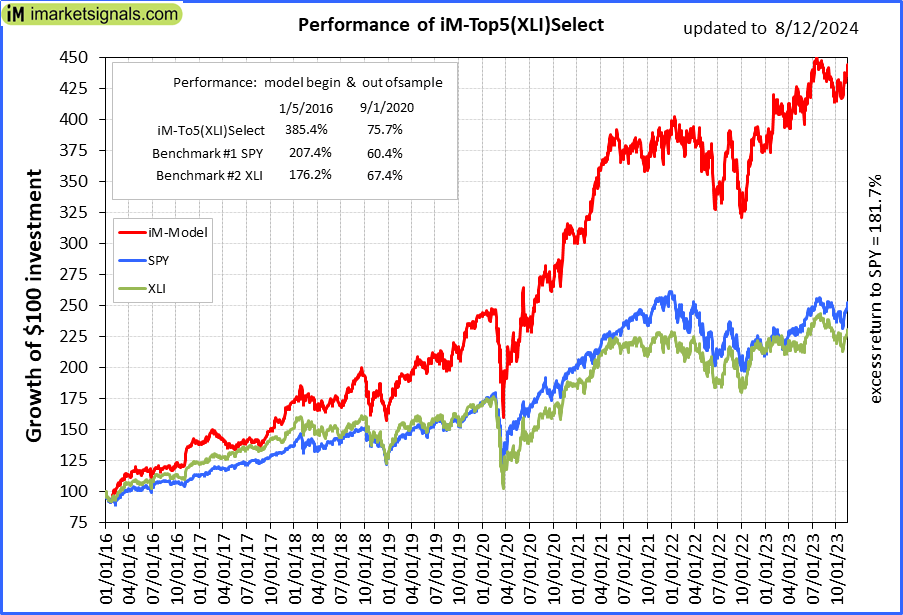 |
iM-Top5(XLI)Select: Since inception, on 1/5/2016, the model gained 384.83% while the benchmark SPY gained 203.09% over the same period. Over the previous week the market value of iM-Top5(XLI)Select gained -0.31% at a time when SPY gained 3.07%. A starting capital of $100,000 at inception on 1/5/2016 would have grown to $484,827 which includes $420 cash and excludes $6,633 spent on fees and slippage. |
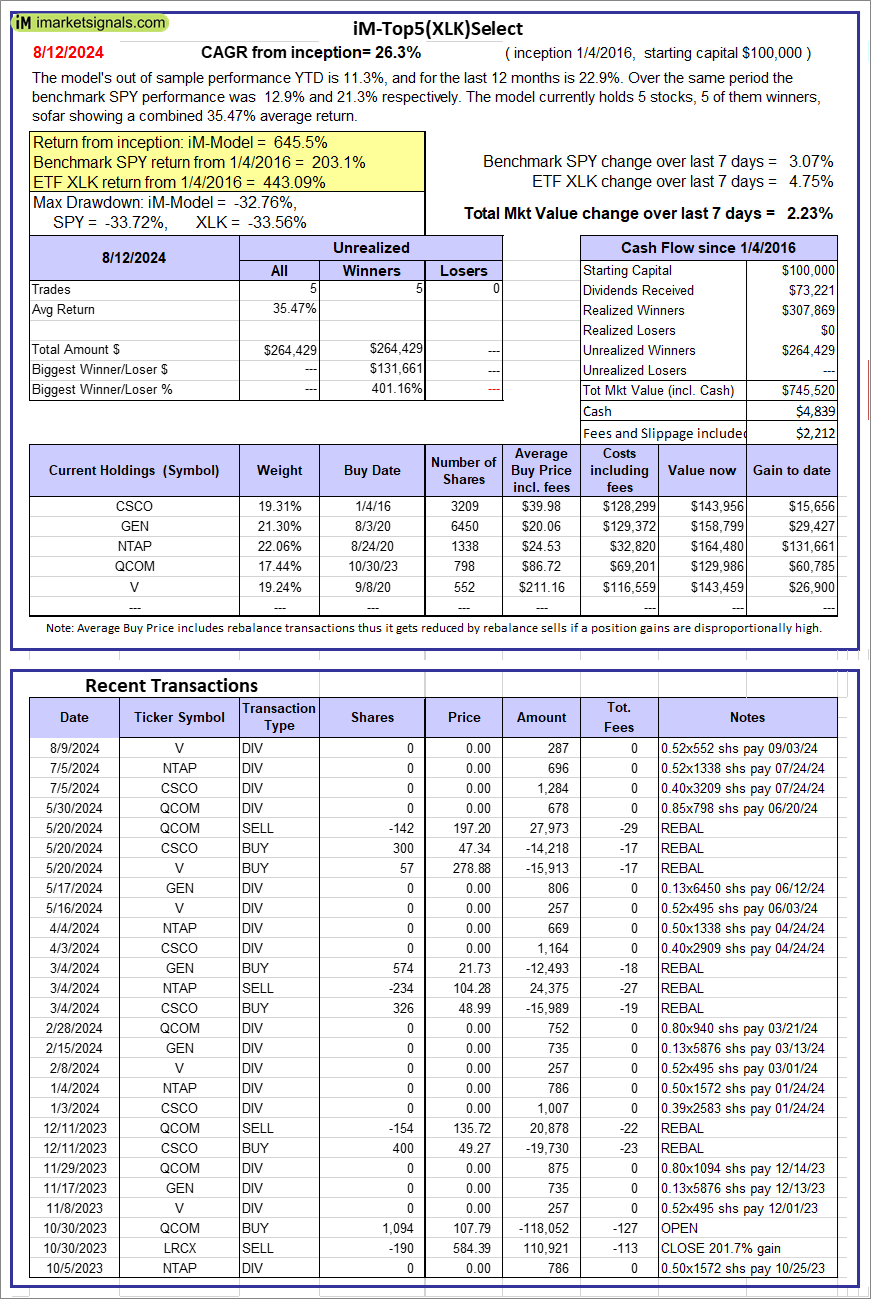 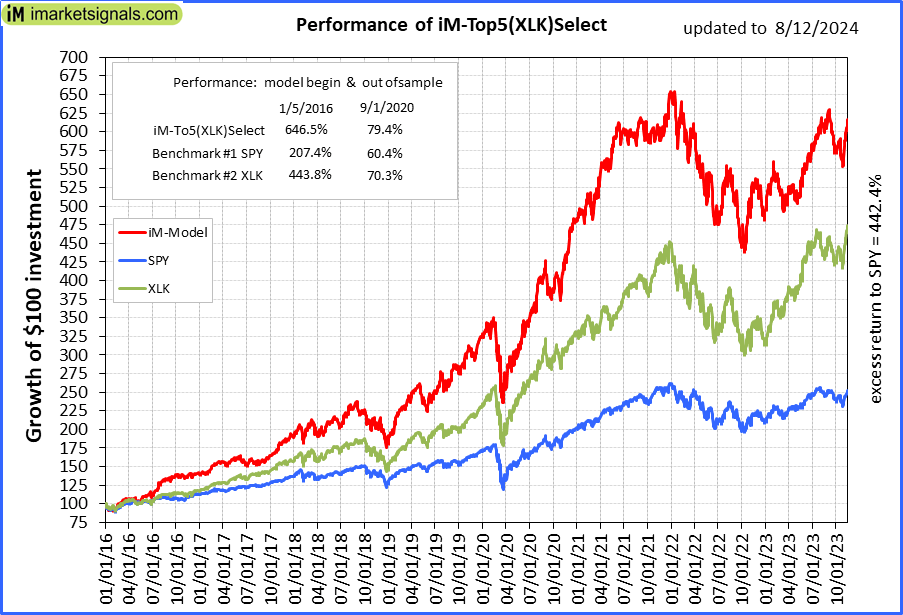 |
iM-Top5(XLK)Select: Since inception, on 1/5/2016, the model gained 645.52% while the benchmark SPY gained 203.09% over the same period. Over the previous week the market value of iM-Top5(XLK)Select gained 2.23% at a time when SPY gained 3.07%. A starting capital of $100,000 at inception on 1/5/2016 would have grown to $745,520 which includes $4,839 cash and excludes $2,212 spent on fees and slippage. |
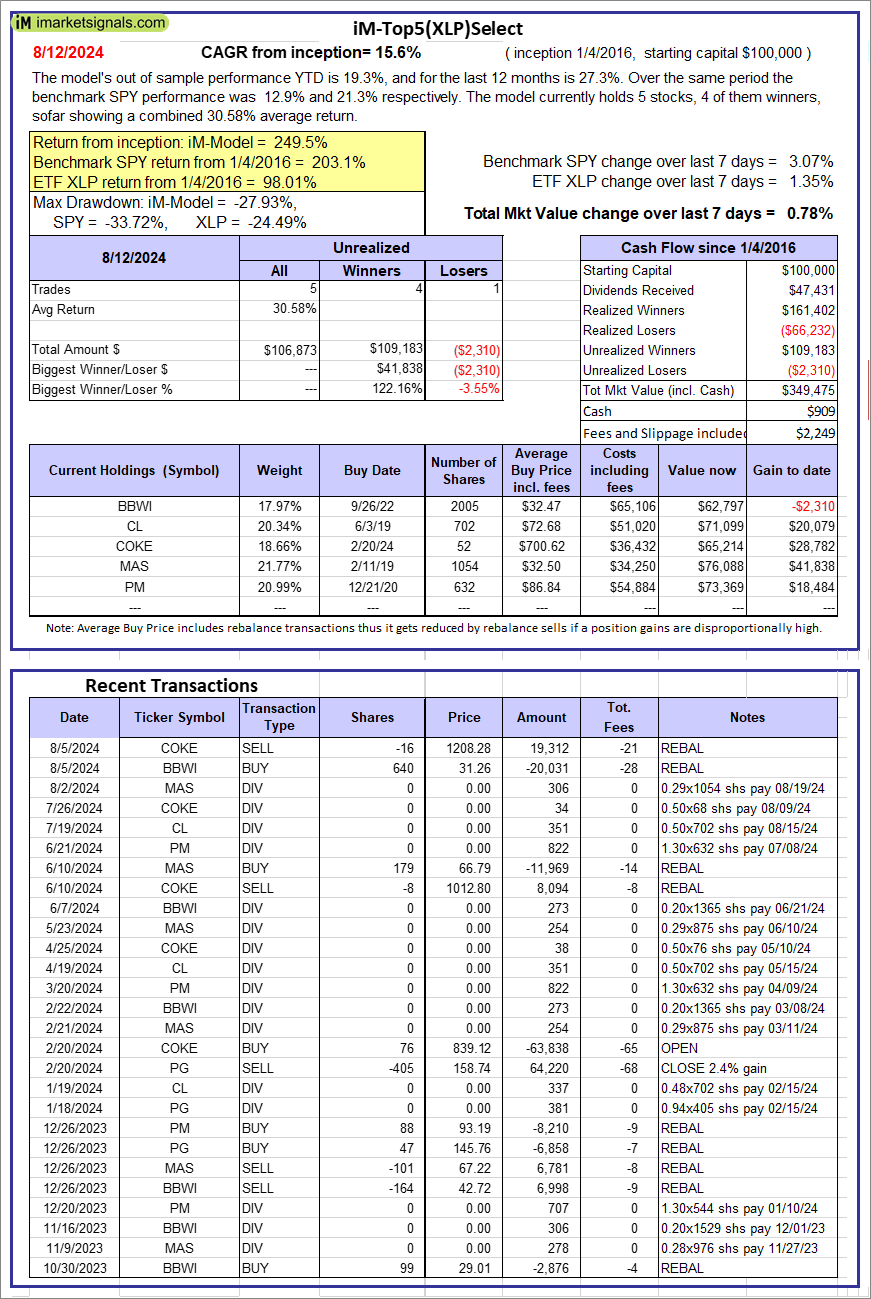 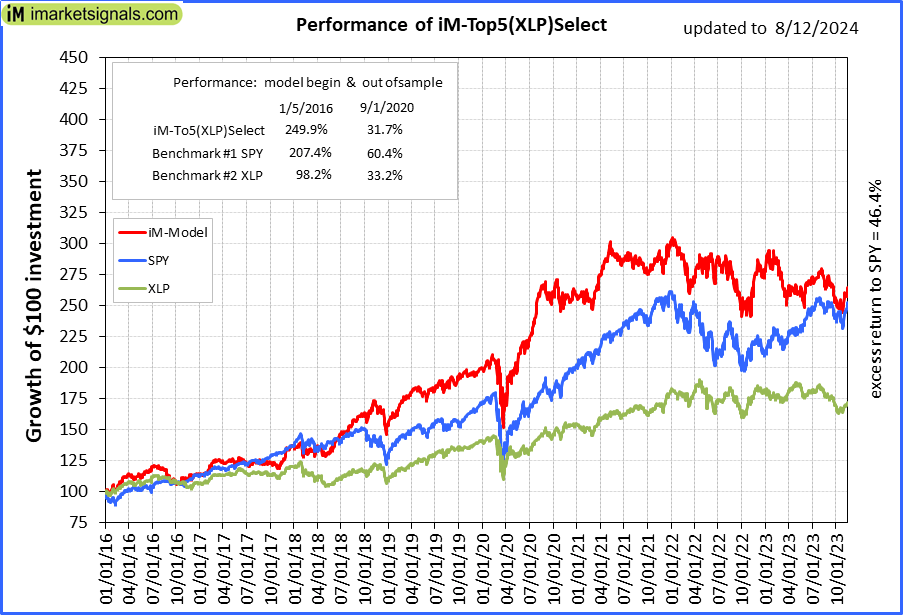 |
iM-Top5(XLP)Select: Since inception, on 1/5/2016, the model gained 249.47% while the benchmark SPY gained 203.09% over the same period. Over the previous week the market value of iM-Top5(XLP)Select gained 0.78% at a time when SPY gained 3.07%. A starting capital of $100,000 at inception on 1/5/2016 would have grown to $349,475 which includes $909 cash and excludes $2,249 spent on fees and slippage. |
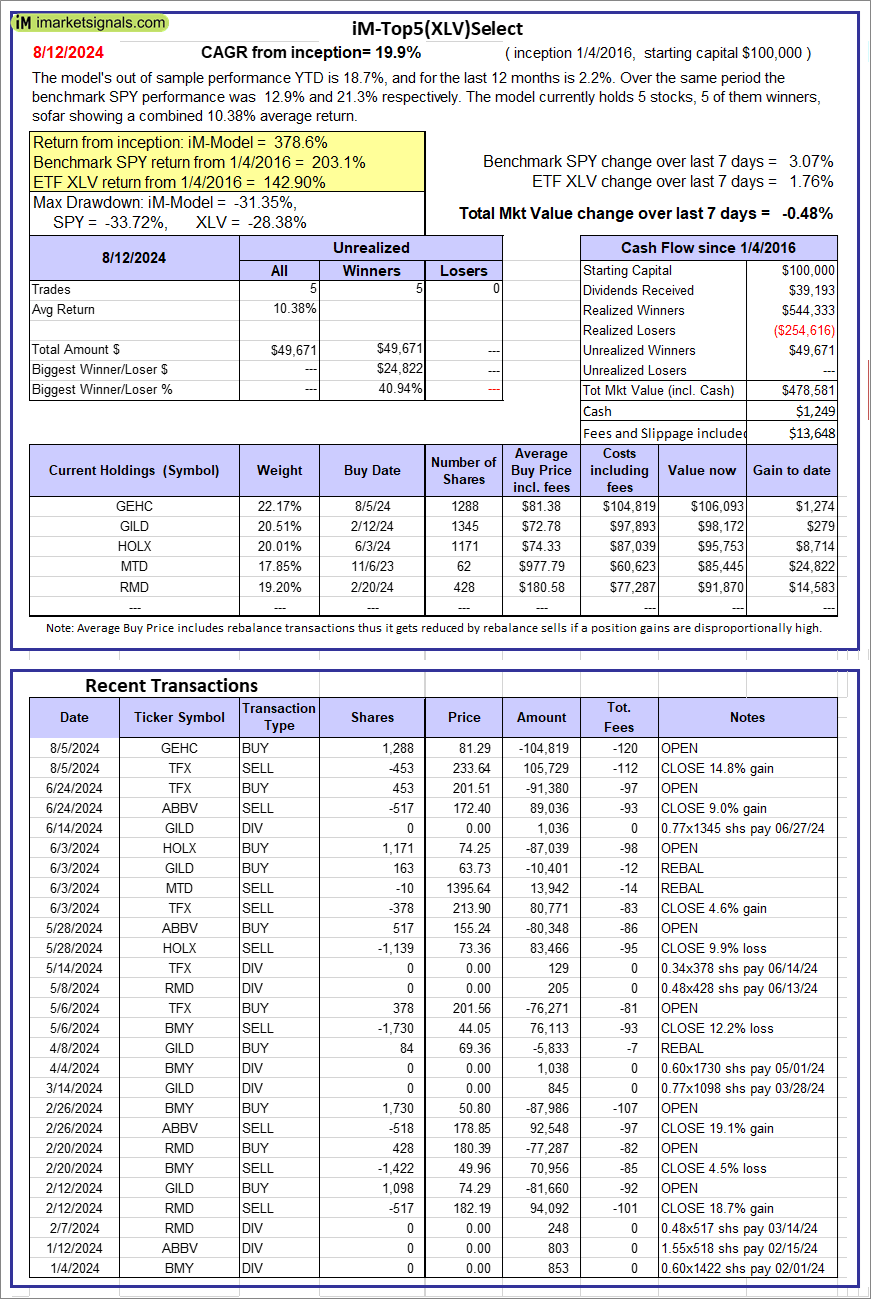 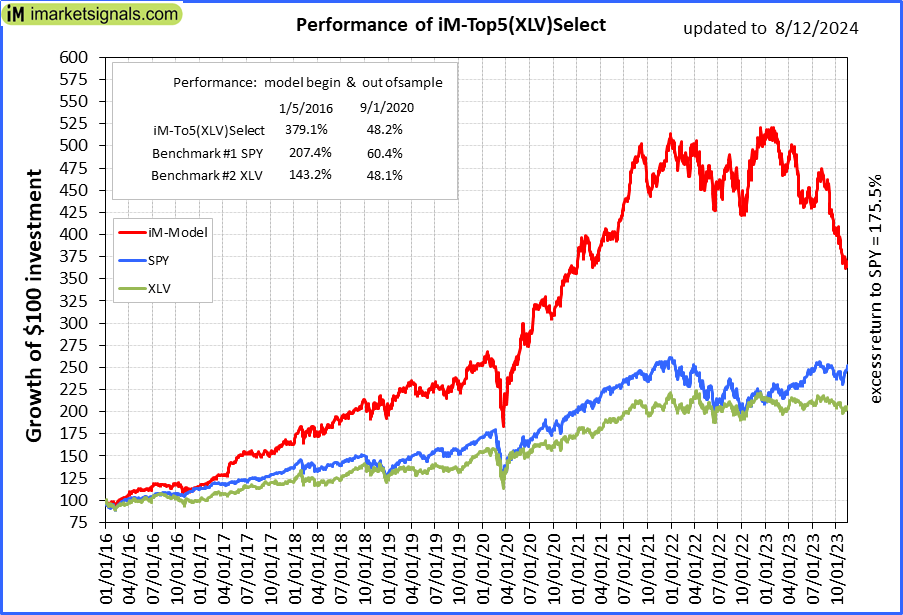 |
iM-Top5(XLV)Select: Since inception, on 1/5/2016, the model gained 378.58% while the benchmark SPY gained 203.09% over the same period. Over the previous week the market value of iM-Top5(XLV)Select gained -0.48% at a time when SPY gained 3.07%. A starting capital of $100,000 at inception on 1/5/2016 would have grown to $478,581 which includes $1,249 cash and excludes $13,648 spent on fees and slippage. |
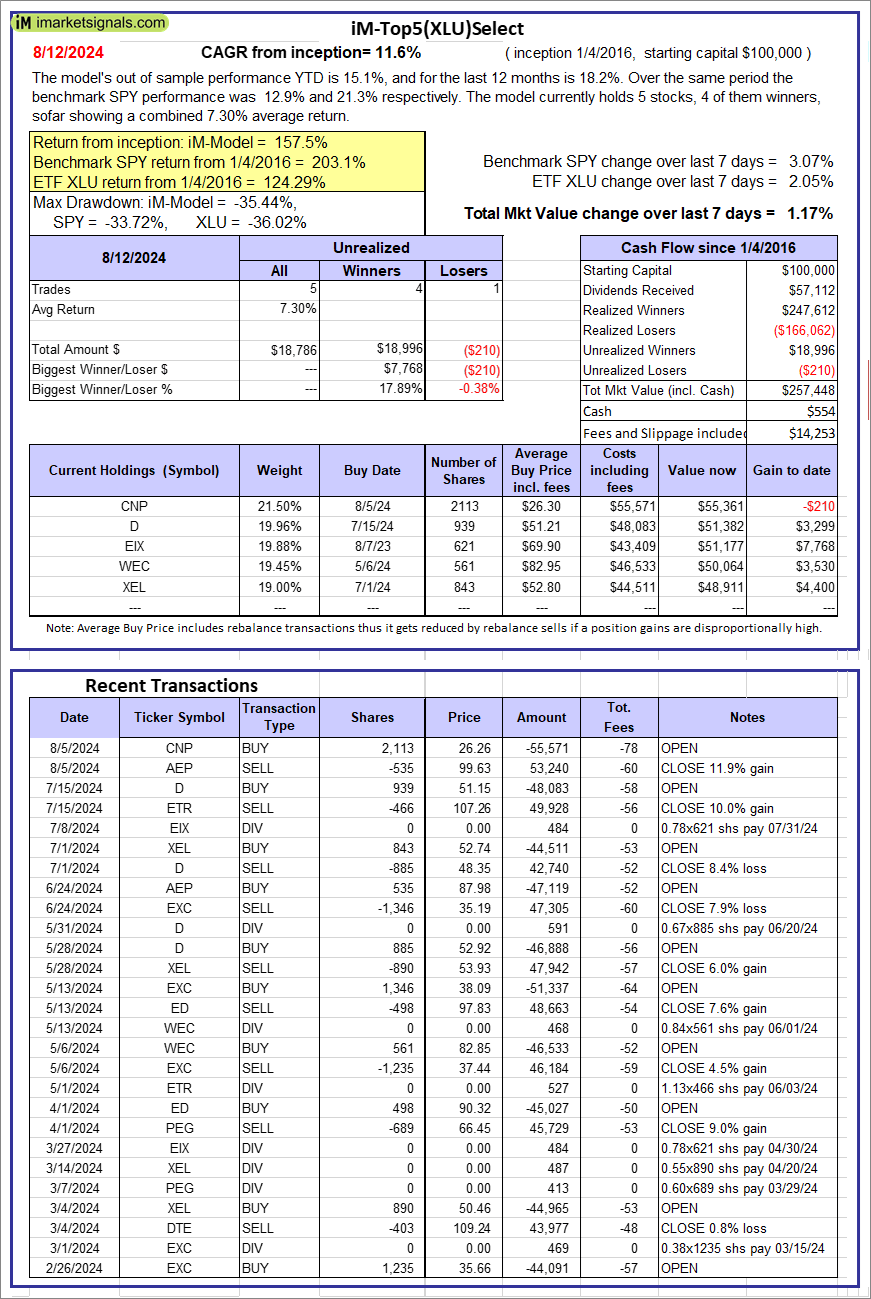 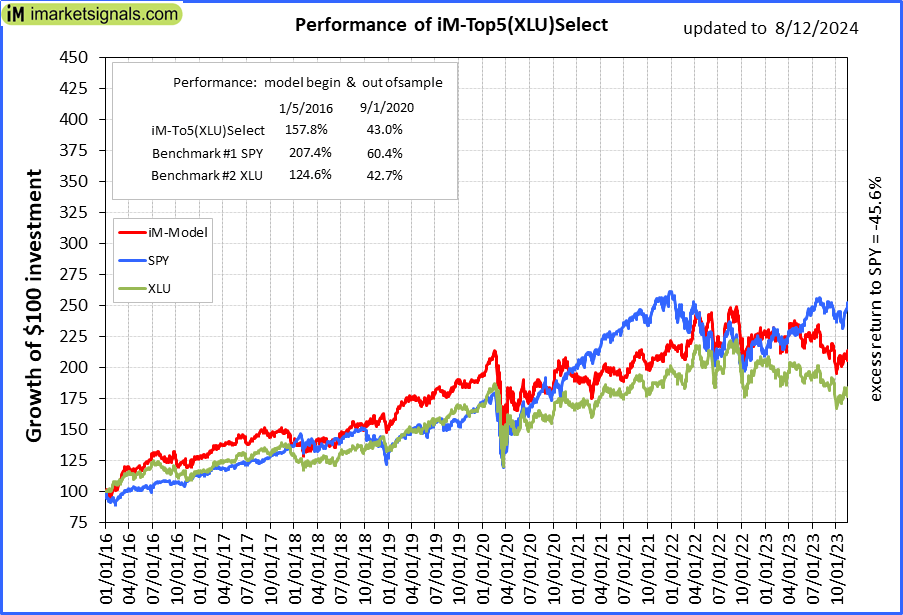 |
iM-Top5(XLU)Select: Since inception, on 1/5/2016, the model gained 157.45% while the benchmark SPY gained 203.09% over the same period. Over the previous week the market value of iM-Top5(XLU)Select gained 1.17% at a time when SPY gained 3.07%. A starting capital of $100,000 at inception on 1/5/2016 would have grown to $257,448 which includes $554 cash and excludes $14,253 spent on fees and slippage. |
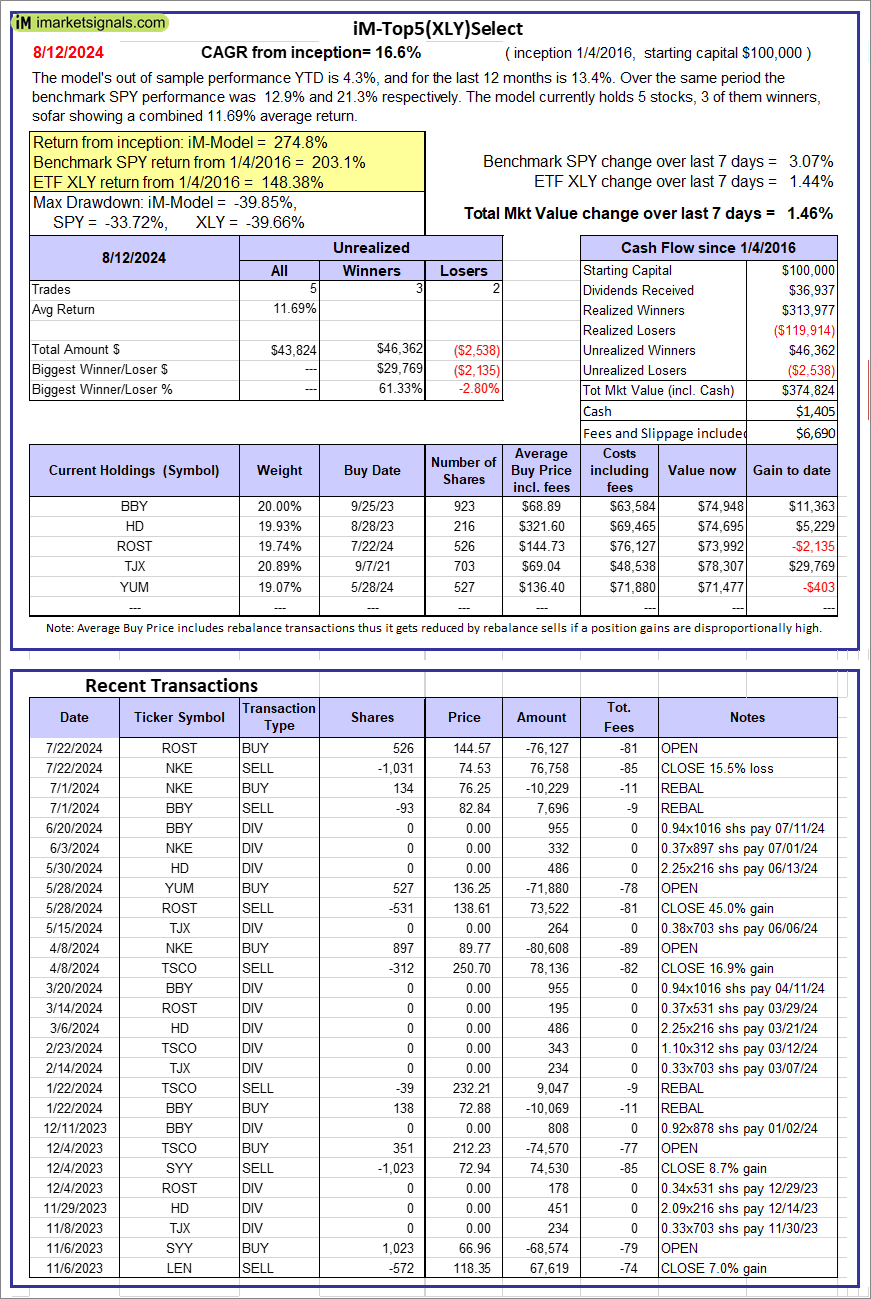 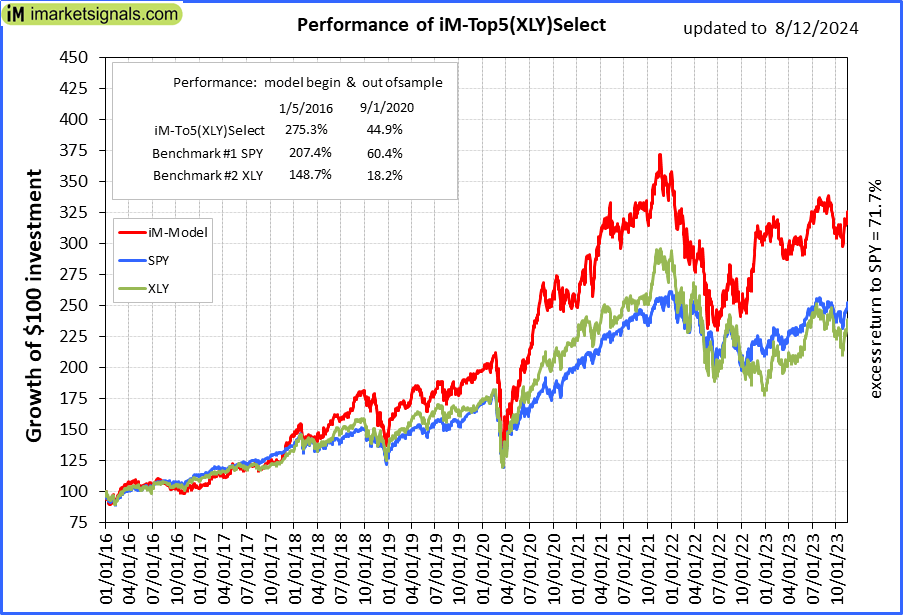 |
iM-Top5(XLY)Select: Since inception, on 1/5/2016, the model gained 274.82% while the benchmark SPY gained 203.09% over the same period. Over the previous week the market value of iM-Top5(XLY)Select gained 1.46% at a time when SPY gained 3.07%. A starting capital of $100,000 at inception on 1/5/2016 would have grown to $374,824 which includes $1,405 cash and excludes $6,690 spent on fees and slippage. |
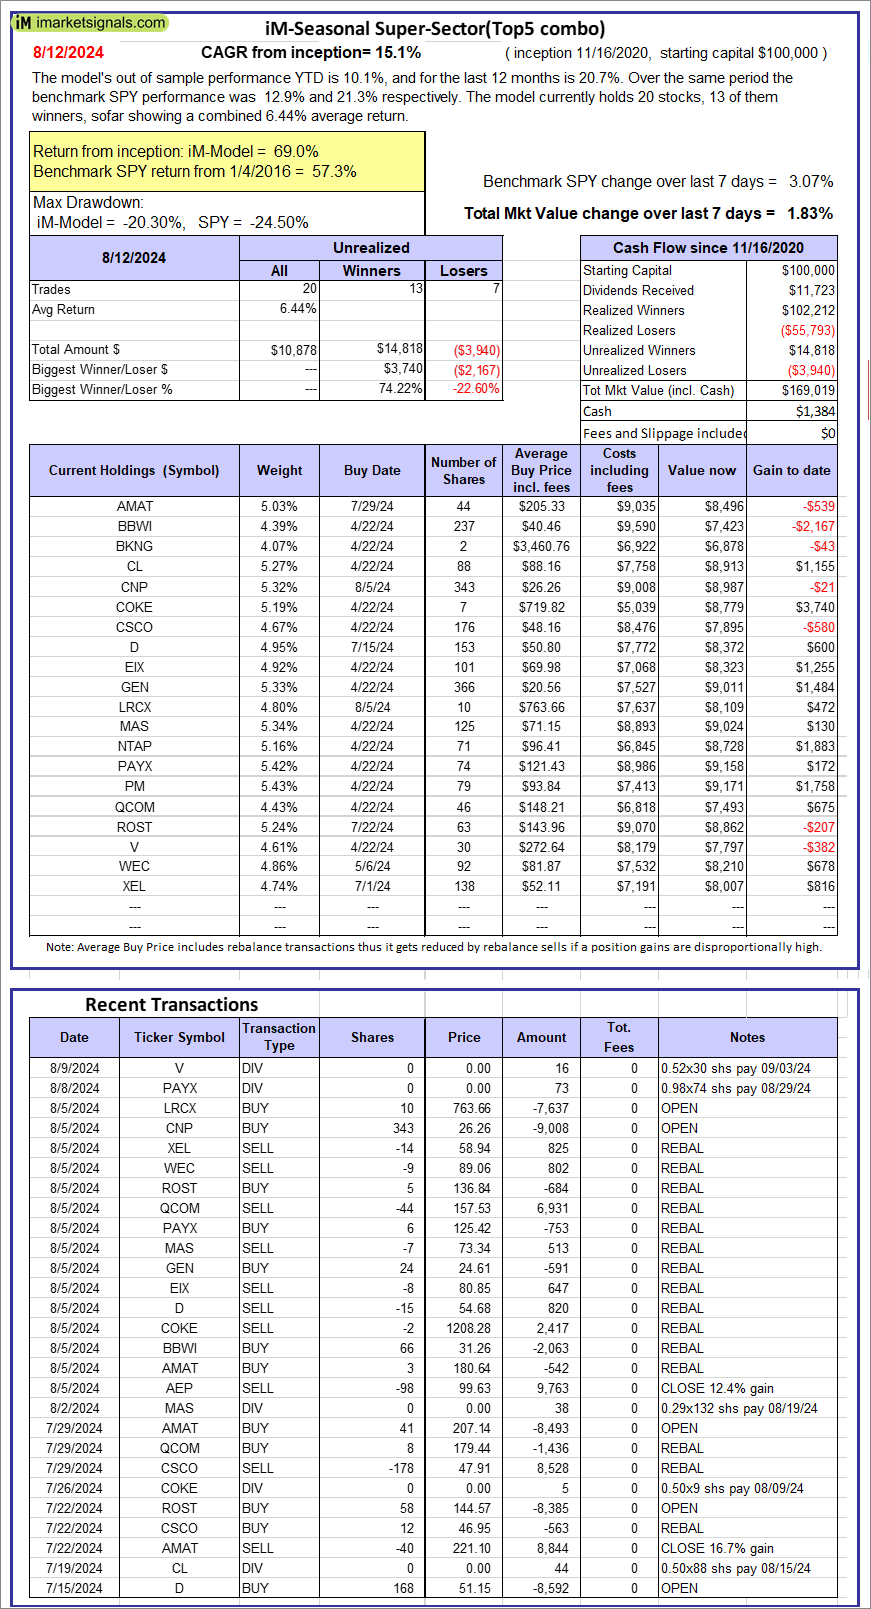 |
iM-Seasonal Super-Sectors (Top5 combo) : Since inception, on 11/17/2020, the model gained 69.02% while the benchmark SPY gained 57.34% over the same period. Over the previous week the market value of iM-Seasonal Super-Sectors (Top5 combo) gained 1.83% at a time when SPY gained 3.07%. A starting capital of $100,000 at inception on 11/17/2020 would have grown to $169,019 which includes $1,384 cash and excludes $00 spent on fees and slippage. |
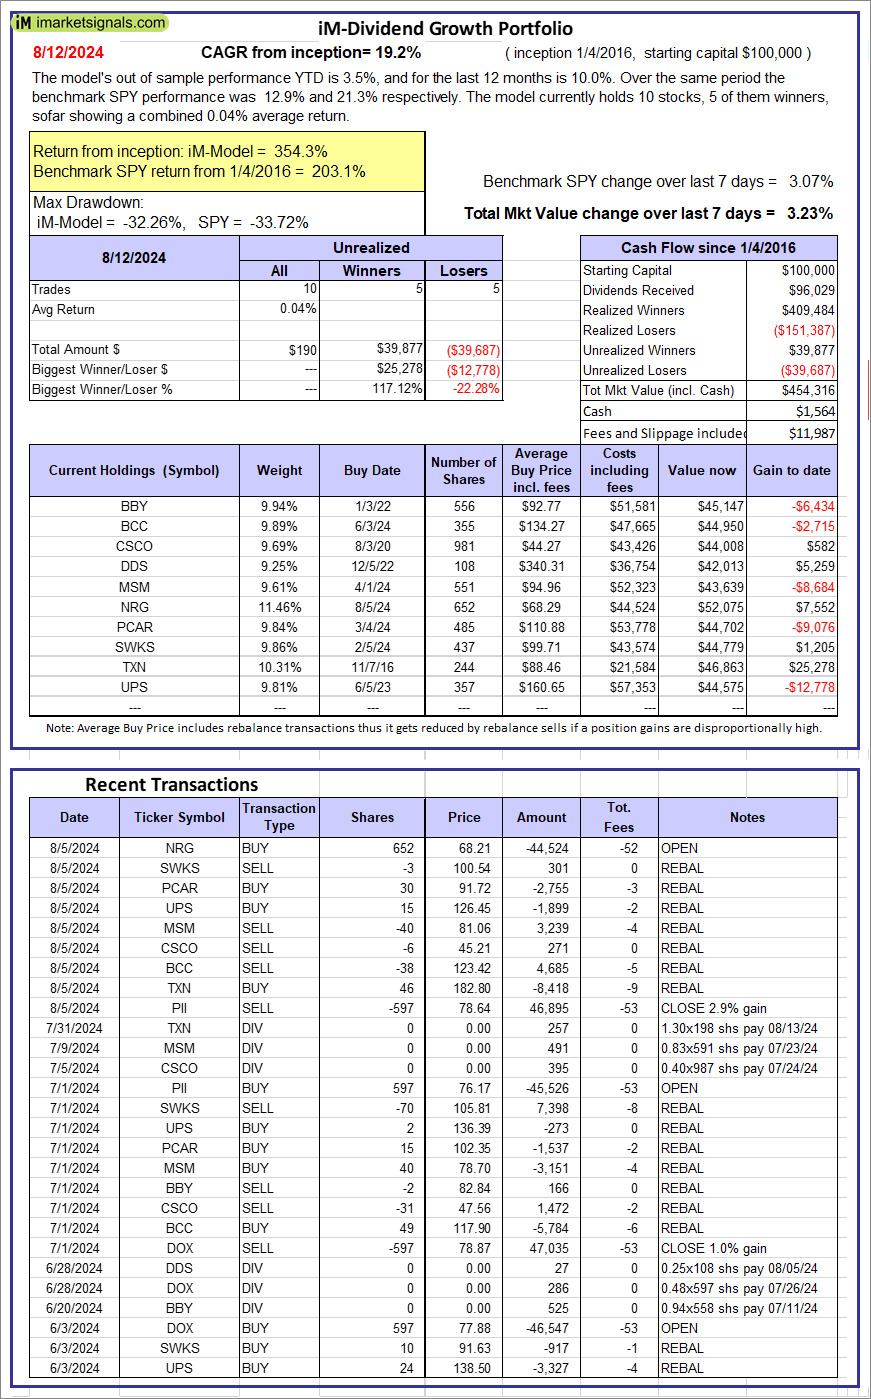 |
iM-Dividend Growth Portfolio: The model’s out of sample performance YTD is 3.5%, and for the last 12 months is 10.0%. Over the same period the benchmark SPY performance was 12.9% and 21.3% respectively. Over the previous week the market value of the iM-Dividend Growth Portfolio gained 3.23% at a time when SPY gained 3.07%. A starting capital of $100,000 at inception on 6/30/2016 would have grown to $454,316 which includes $1,564 cash and excludes $11,987 spent on fees and slippage. |
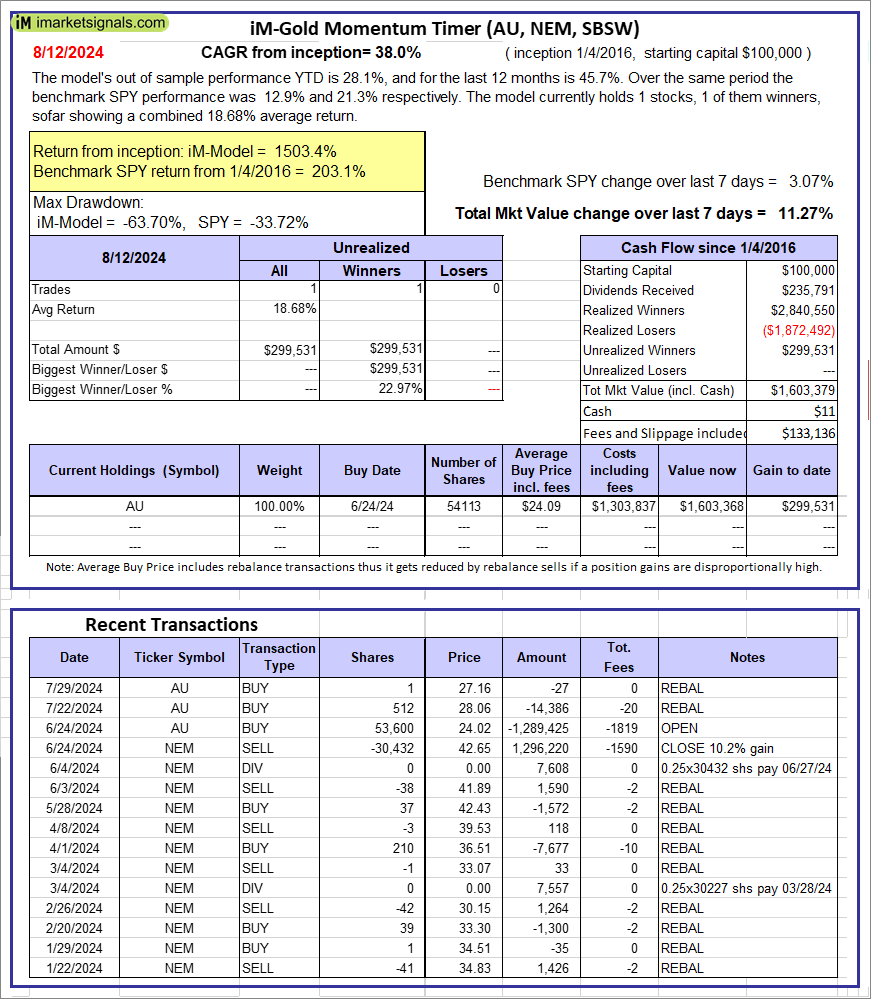 |
iM-Gold Momentum Timer (AU, NEM, SBSW): The model’s out of sample performance YTD is 28.1%, and for the last 12 months is 45.7%. Over the same period the benchmark SPY performance was 12.9% and 21.3% respectively. Over the previous week the market value of iM-Gold Momentum Timer (AU, NEM, SBSW) gained 11.27% at a time when SPY gained 3.07%. A starting capital of $100,000 at inception on 6/30/2016 would have grown to $11 which includes $133,136 cash and excludes Gain to date spent on fees and slippage. |
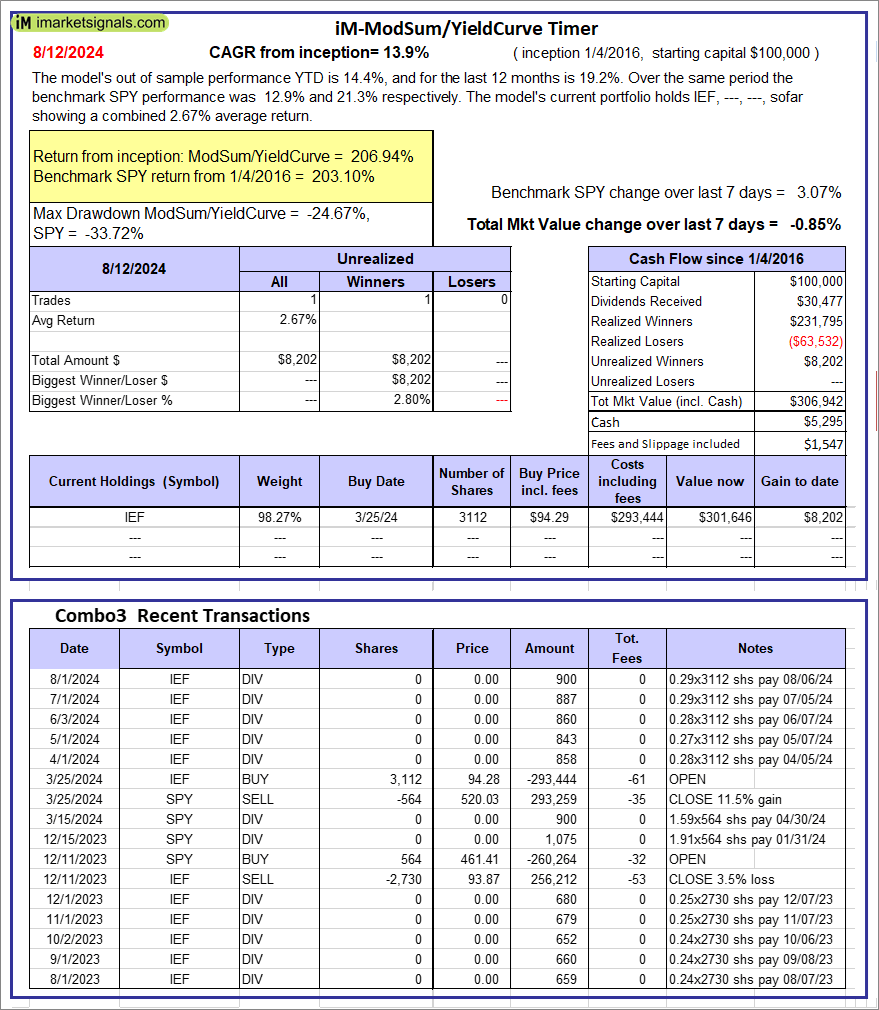 |
iM-ModSum/YieldCurve Timer: The model’s out of sample performance YTD is 14.4%, and for the last 12 months is 19.2%. Over the same period the benchmark SPY performance was 12.9% and 21.3% respectively. Over the previous week the market value of iM-PortSum/YieldCurve Timer gained -0.85% at a time when SPY gained 3.07%. A starting capital of $100,000 at inception on 1/1/2016 would have grown to $306,942 which includes $5,295 cash and excludes $1,547 spent on fees and slippage. |
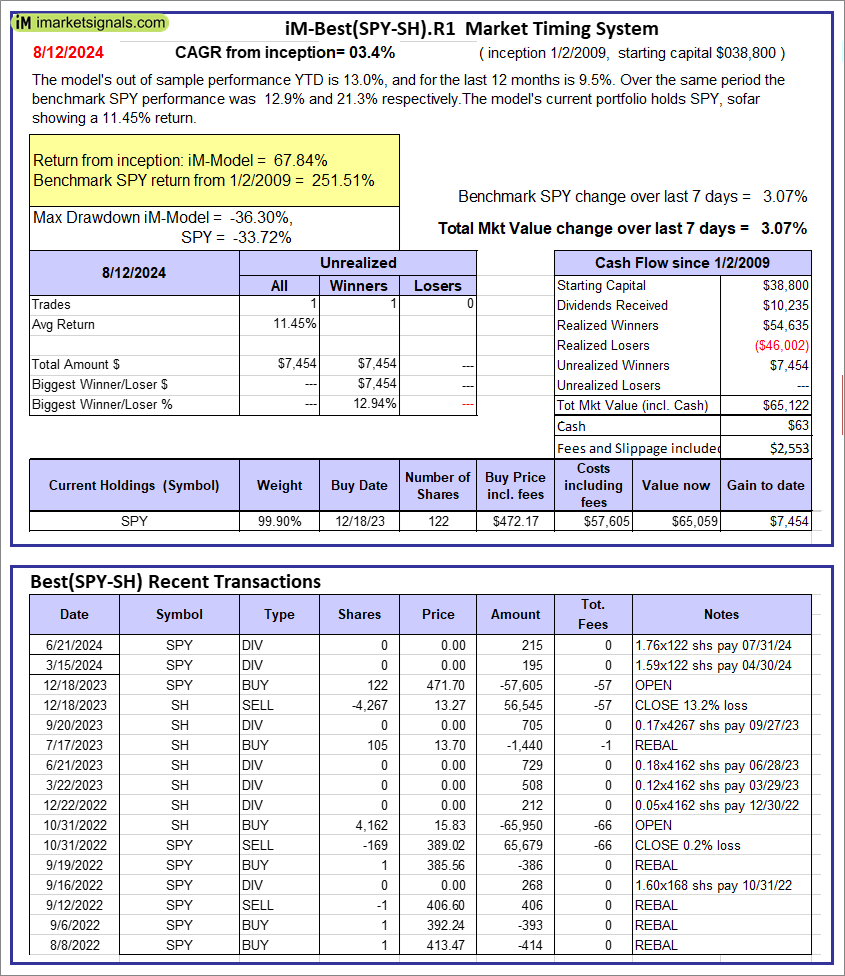 |
iM-Best(SPY-SH).R1: The model’s out of sample performance YTD is 13.0%, and for the last 12 months is 9.5%. Over the same period the benchmark SPY performance was 12.9% and 21.3% respectively. Over the previous week the market value of Best(SPY-SH) gained 3.07% at a time when SPY gained 3.07%. A starting capital of $100,000 at inception on 1/2/2009 would have grown to $65,122 which includes $63 cash and excludes $2,553 spent on fees and slippage. |
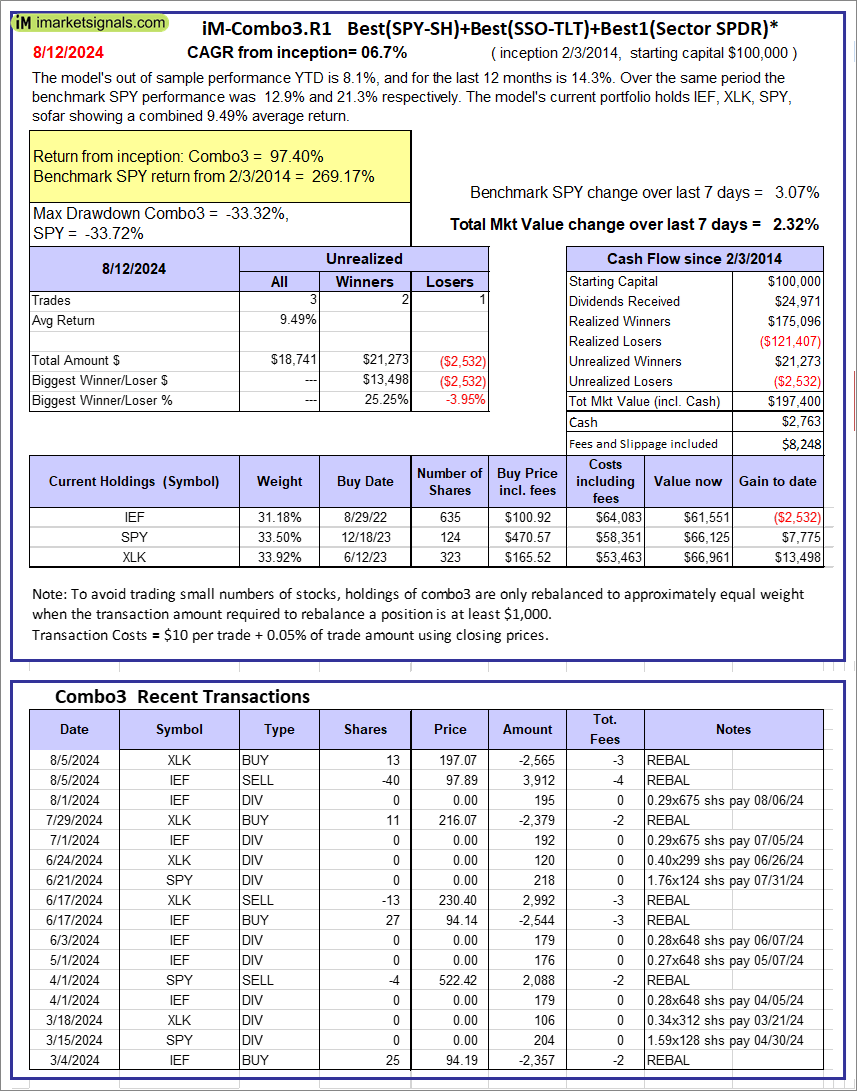 |
iM-Combo3.R1: The model’s out of sample performance YTD is 8.1%, and for the last 12 months is 14.3%. Over the same period the benchmark SPY performance was 12.9% and 21.3% respectively. Over the previous week the market value of iM-Combo3.R1 gained 2.32% at a time when SPY gained 3.07%. A starting capital of $100,000 at inception on 2/3/2014 would have grown to $197,400 which includes $2,763 cash and excludes $8,248 spent on fees and slippage. |
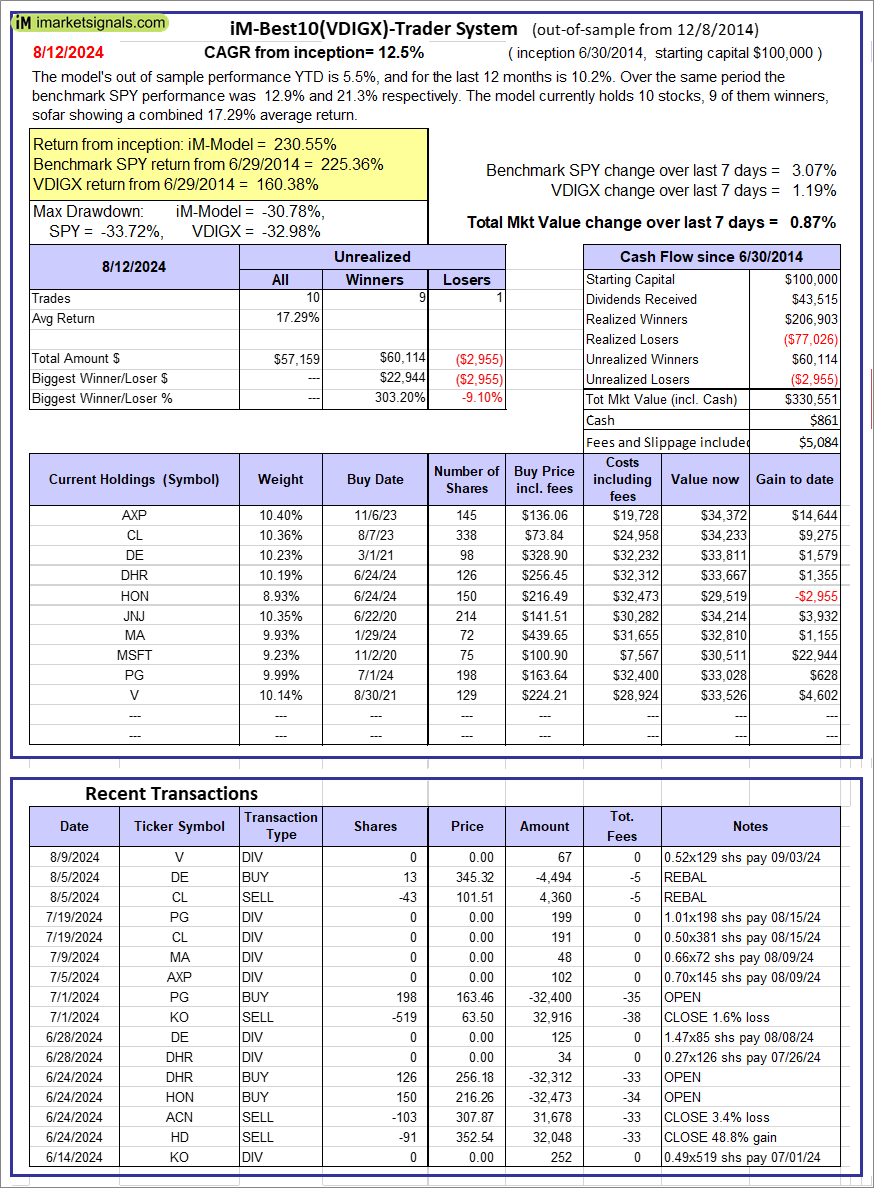 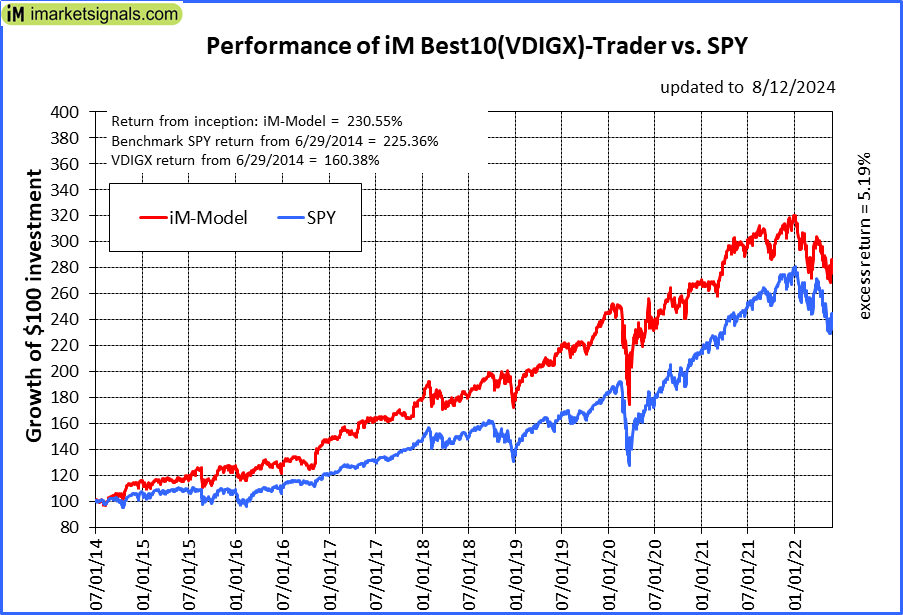 |
iM-Best10(VDIGX)-Trader: The model’s out of sample performance YTD is 5.5%, and for the last 12 months is 10.2%. Over the same period the benchmark SPY performance was 12.9% and 21.3% respectively. Since inception, on 7/1/2014, the model gained 230.55% while the benchmark SPY gained 225.36% and VDIGX gained 160.38% over the same period. Over the previous week the market value of iM-Best10(VDIGX) gained 0.87% at a time when SPY gained 3.07%. A starting capital of $100,000 at inception on 7/1/2014 would have grown to $330,551 which includes $861 cash and excludes $5,084 spent on fees and slippage. |
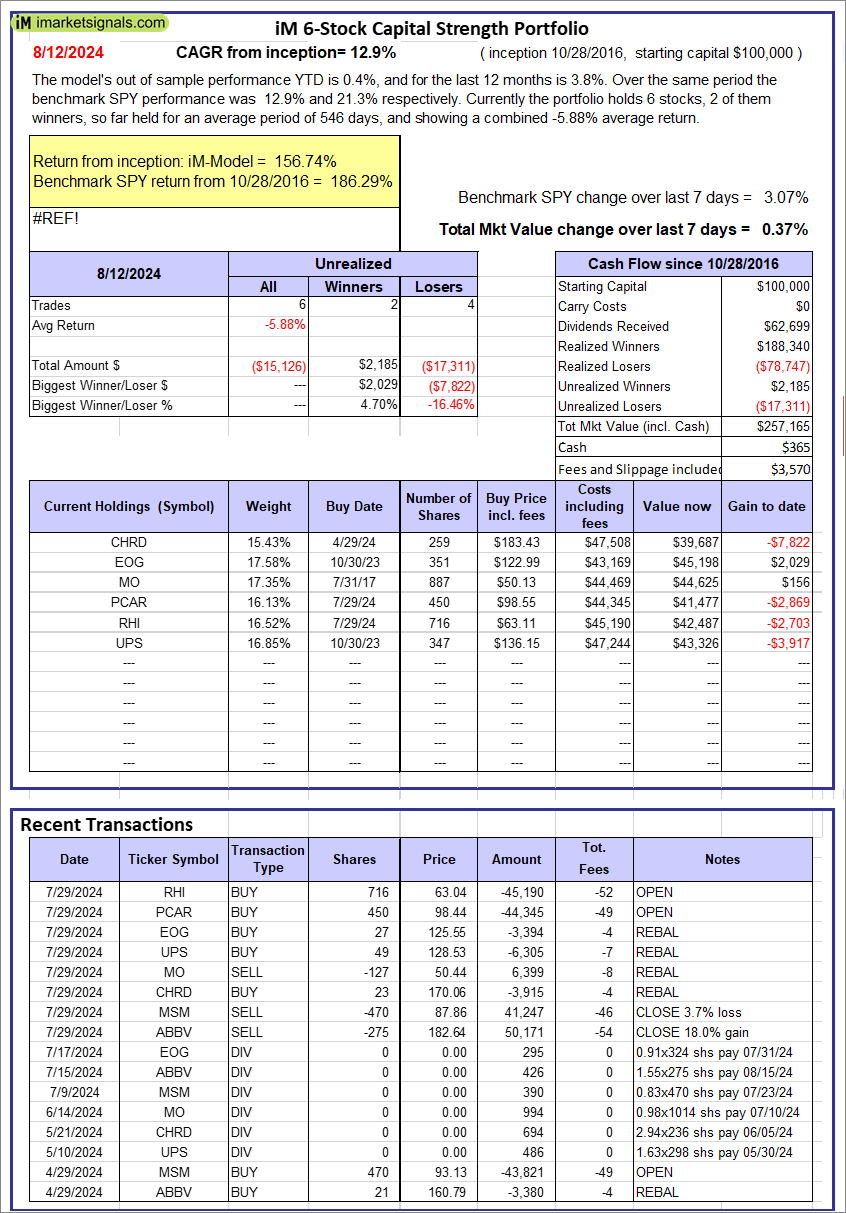 |
iM 6-Stock Capital Strength Portfolio: The model’s out of sample performance YTD is 0.4%, and for the last 12 months is 3.8%. Over the same period the benchmark SPY performance was 12.9% and 21.3% respectively. Over the previous week the market value of the iM 6-Stock Capital Strength Portfolio gained 0.37% at a time when SPY gained 3.07%. A starting capital of $100,000 at inception on 10/28/2016 would have grown to $257,165 which includes $365 cash and excludes $3,570 spent on fees and slippage. |
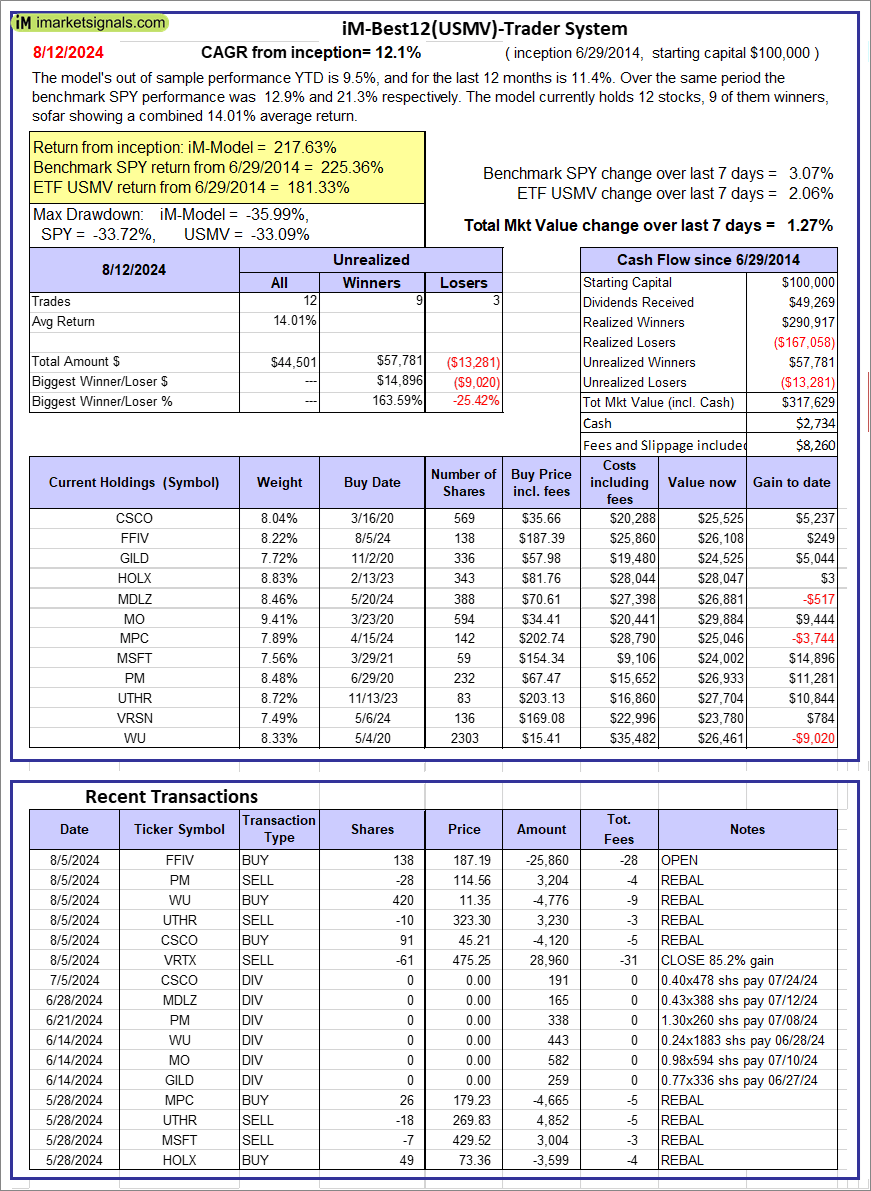 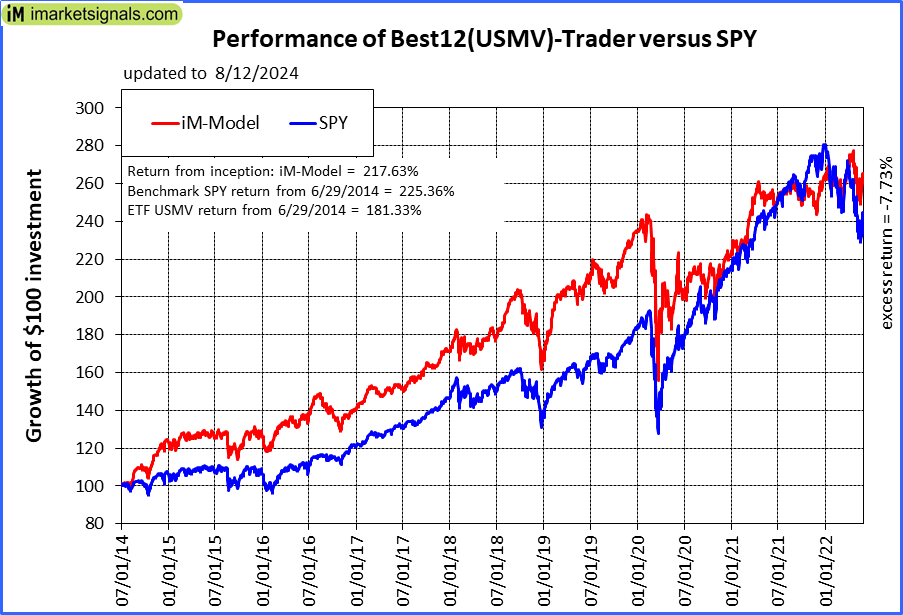 |
iM-Best12(USMV)-Trader: The model’s out of sample performance YTD is 9.5%, and for the last 12 months is 11.4%. Over the same period the benchmark SPY performance was 12.9% and 21.3% respectively. Since inception, on 6/30/2014, the model gained 217.63% while the benchmark SPY gained 225.36% and the ETF USMV gained 181.33% over the same period. Over the previous week the market value of iM-Best12(USMV)-Trader gained 1.27% at a time when SPY gained 3.07%. A starting capital of $100,000 at inception on 6/30/2014 would have grown to $317,629 which includes $2,734 cash and excludes $8,260 spent on fees and slippage. |
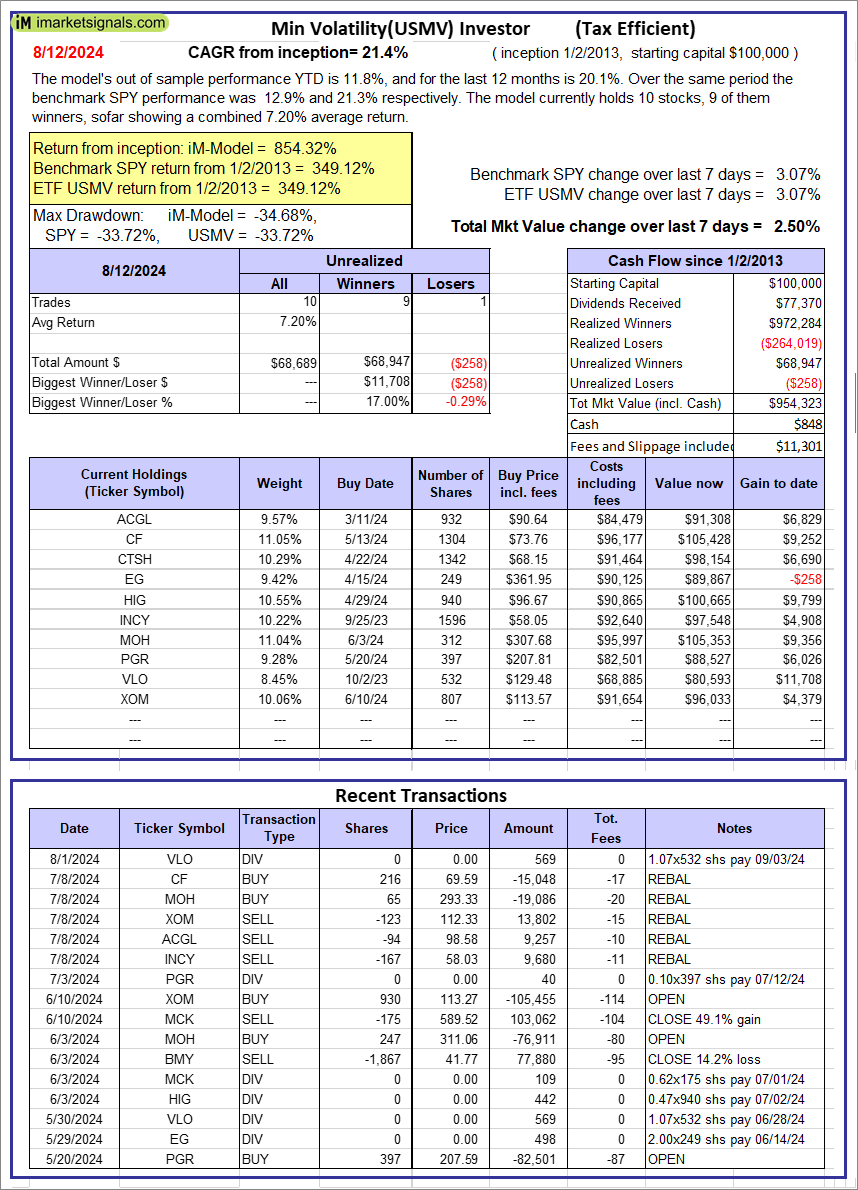 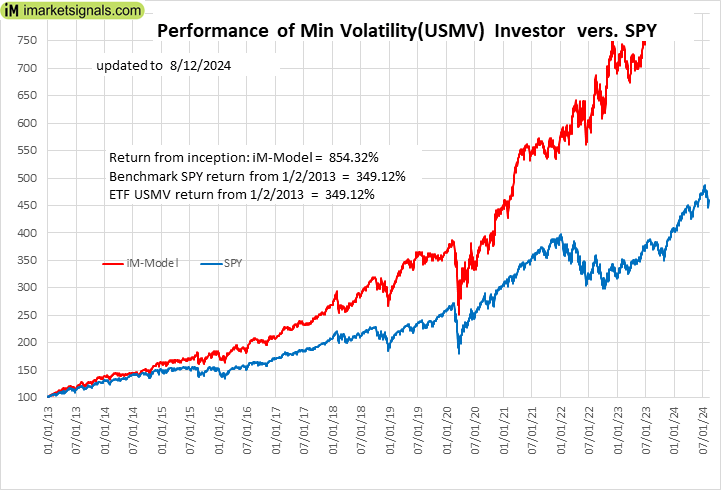 |
iM-Min Volatility(USMV) Investor (Tax Efficient): The model’s out of sample performance YTD is 11.8%, and for the last 12 months is 20.1%. Over the same period the benchmark SPY performance was 12.9% and 21.3% respectively. Since inception, on 1/3/2013, the model gained 854.32% while the benchmark SPY gained 349.12% and the ETF USMV gained 349.12% over the same period. Over the previous week the market value of iM-Best12(USMV)Q1 gained 2.50% at a time when SPY gained 3.07%. A starting capital of $100,000 at inception on 1/3/2013 would have grown to $954,323 which includes $848 cash and excludes $11,301 spent on fees and slippage. |
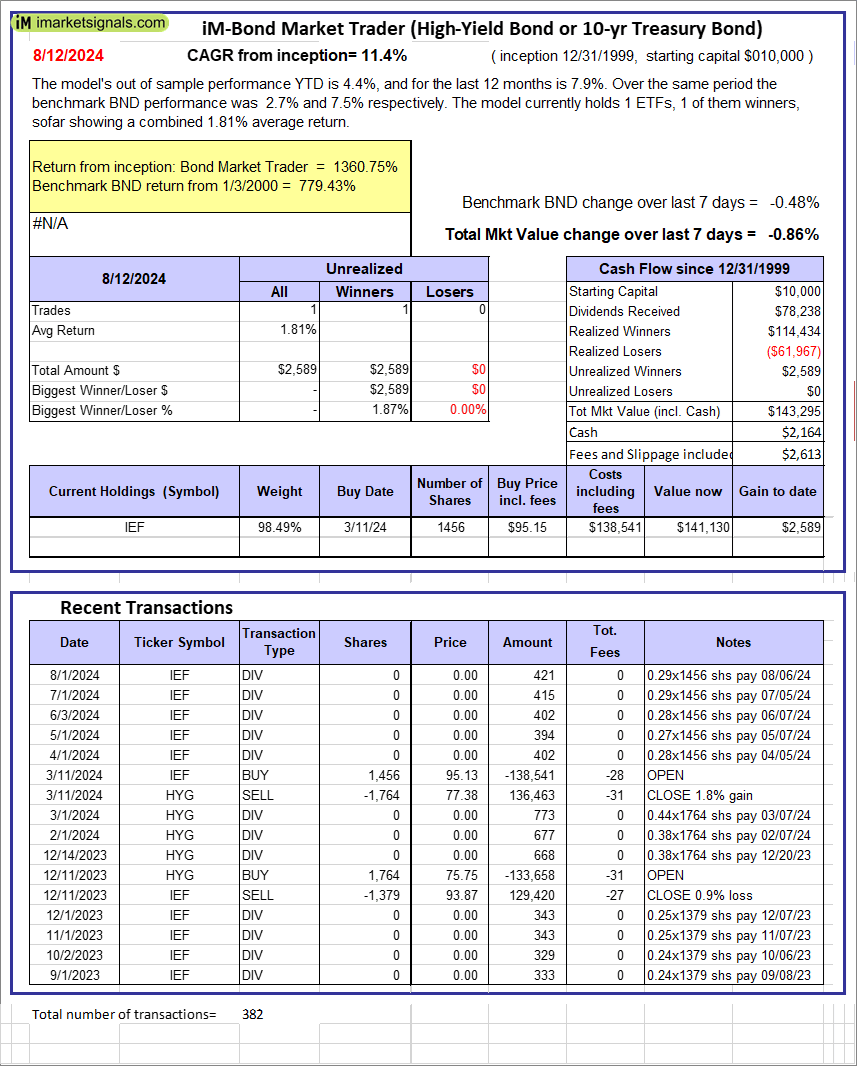 |
iM-Bond Market Trader (High-Yield Bond or 10-yr Treasury Bond): The model’s out of sample performance YTD is 4.4%, and for the last 12 months is 7.9%. Over the same period the benchmark BND performance was 2.7% and 7.5% respectively. Over the previous week the market value of the iM-Bond Market Trader (High-Yield Bond or 10-yr Treasury Bond) gained -0.86% at a time when BND gained -0.48%. A starting capital of $10,000 at inception on 1/3/2000 would have grown to $143,295 which includes $2,164 cash and excludes $2,613 spent on fees and slippage. |
|
|
iM-ModSum/YieldCurve Timer: The model’s out of sample performance YTD is 14.4%, and for the last 12 months is 19.2%. Over the same period the benchmark SPY performance was 12.9% and 21.3% respectively. Over the previous week the market value of iM-PortSum/YieldCurve Timer gained -0.85% at a time when SPY gained 3.07%. A starting capital of $100,000 at inception on 1/1/2016 would have grown to $306,942 which includes $5,295 cash and excludes $1,547 spent on fees and slippage. |
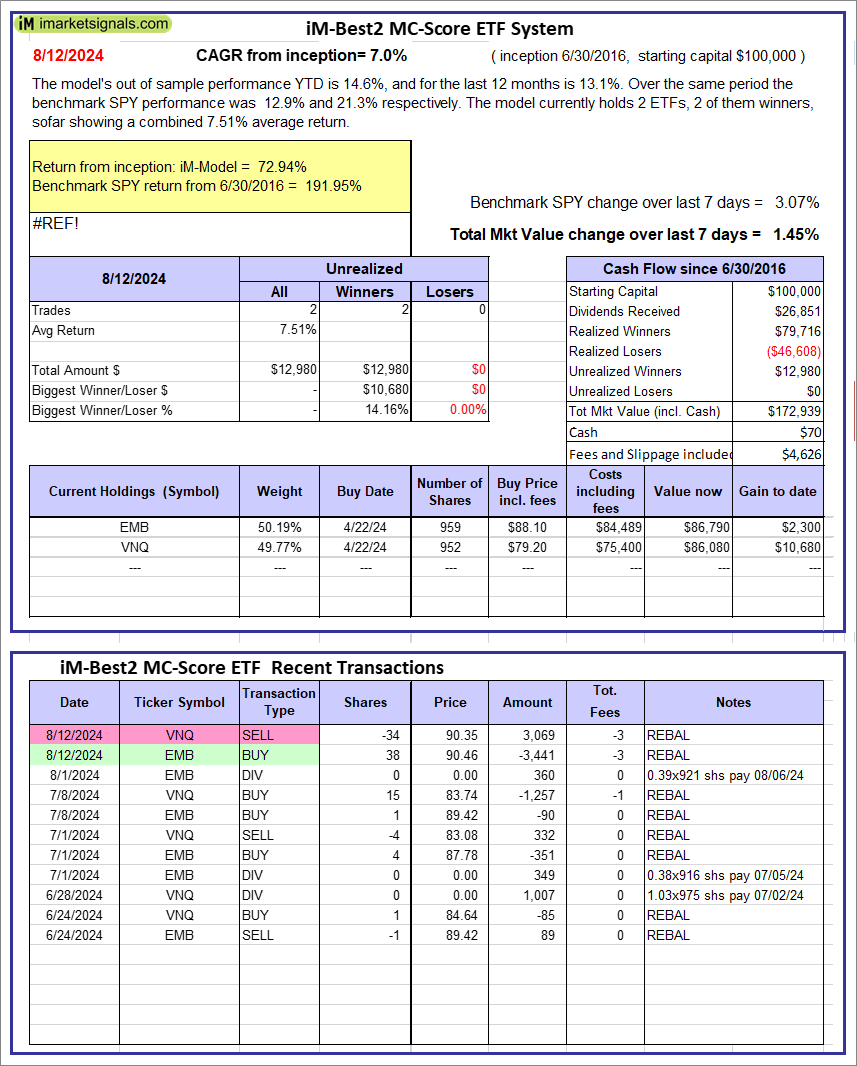 |
iM-Best2 MC-Score ETF System: The model’s out of sample performance YTD is 14.6%, and for the last 12 months is 13.1%. Over the same period the benchmark SPY performance was 12.9% and 21.3% respectively. Over the previous week the market value of the iM-Best2 MC-Score ETF System gained 1.45% at a time when SPY gained 3.07%. A starting capital of $100,000 at inception on 6/30/2016 would have grown to $172,939 which includes $70 cash and excludes $4,626 spent on fees and slippage. |
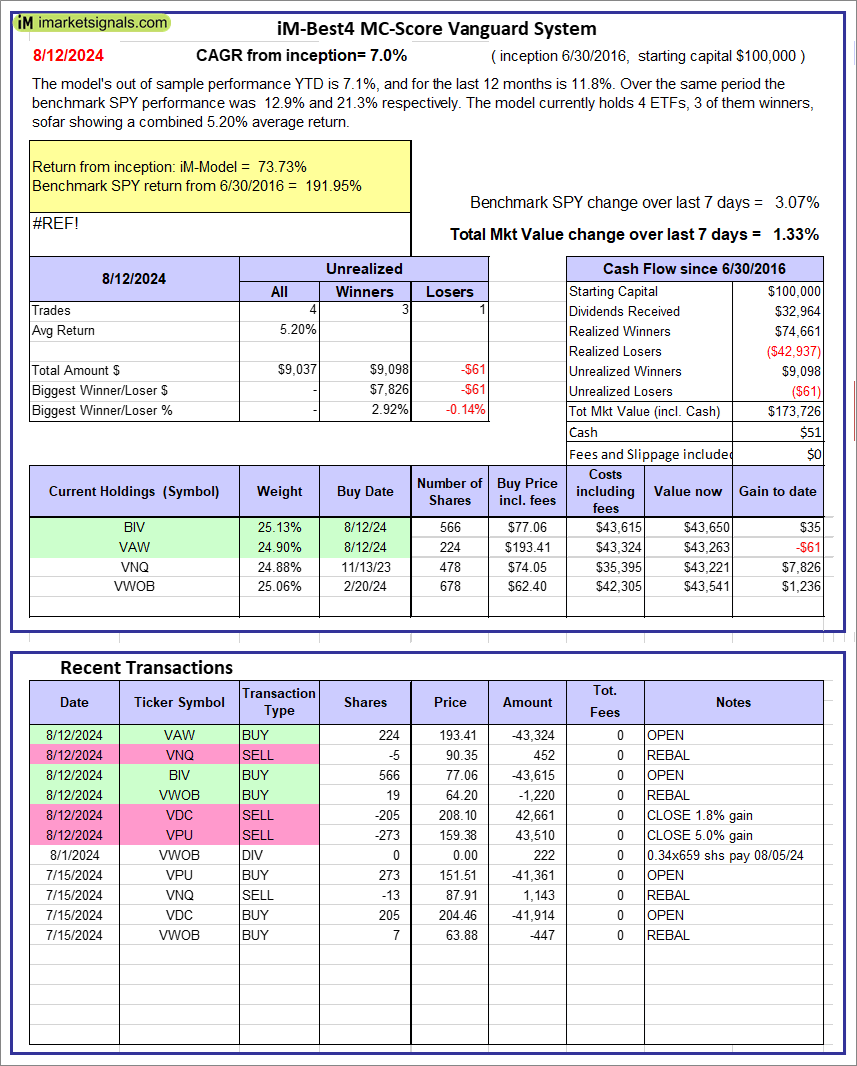 |
iM-Best4 MC-Score Vanguard System: The model’s out of sample performance YTD is 7.1%, and for the last 12 months is 11.8%. Over the same period the benchmark SPY performance was 12.9% and 21.3% respectively. Over the previous week the market value of the iM-Best4 MC-Score Vanguard System gained 1.33% at a time when SPY gained 3.07%. A starting capital of $100,000 at inception on 6/30/2016 would have grown to $173,726 which includes $51 cash and excludes $00 spent on fees and slippage. |
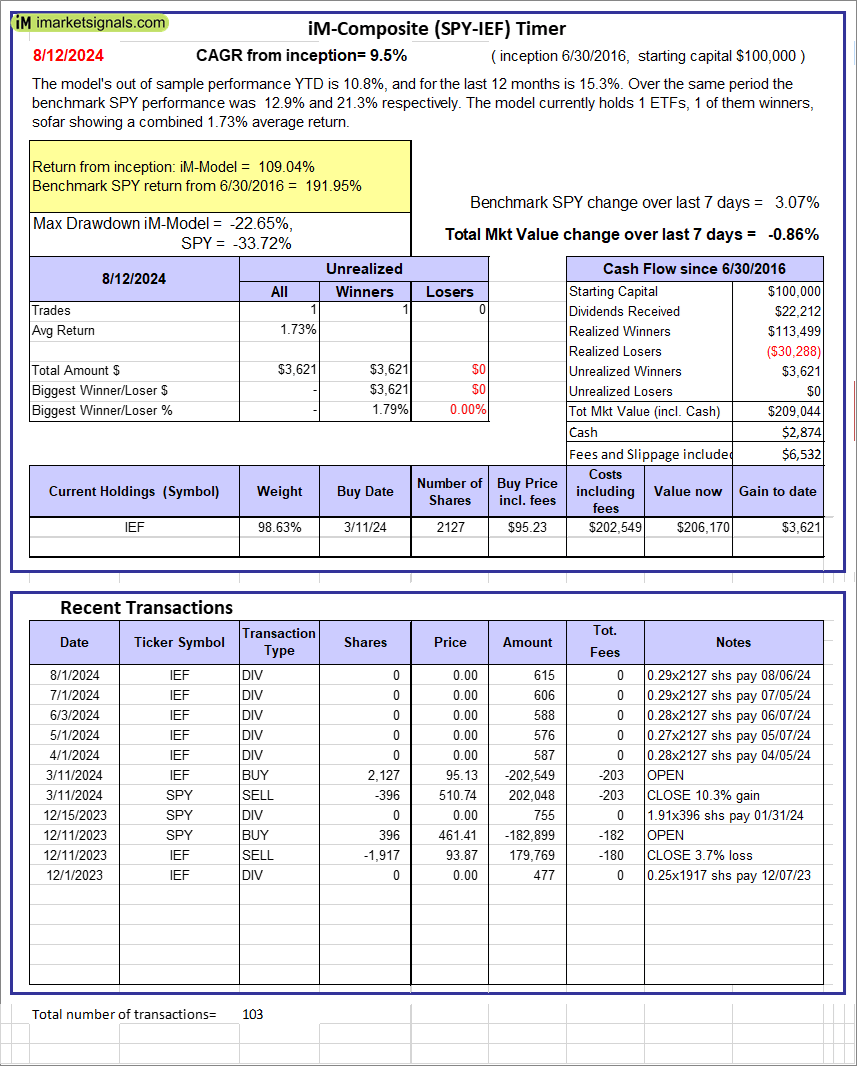 |
iM-Composite (SPY-IEF) Timer: The model’s out of sample performance YTD is 10.8%, and for the last 12 months is 15.3%. Over the same period the benchmark SPY performance was 12.9% and 21.3% respectively. Over the previous week the market value of the iM-Composite (SPY-IEF) Timer gained -0.86% at a time when SPY gained 3.07%. A starting capital of $100,000 at inception on 6/30/2016 would have grown to $209,044 which includes $2,874 cash and excludes $6,532 spent on fees and slippage. |
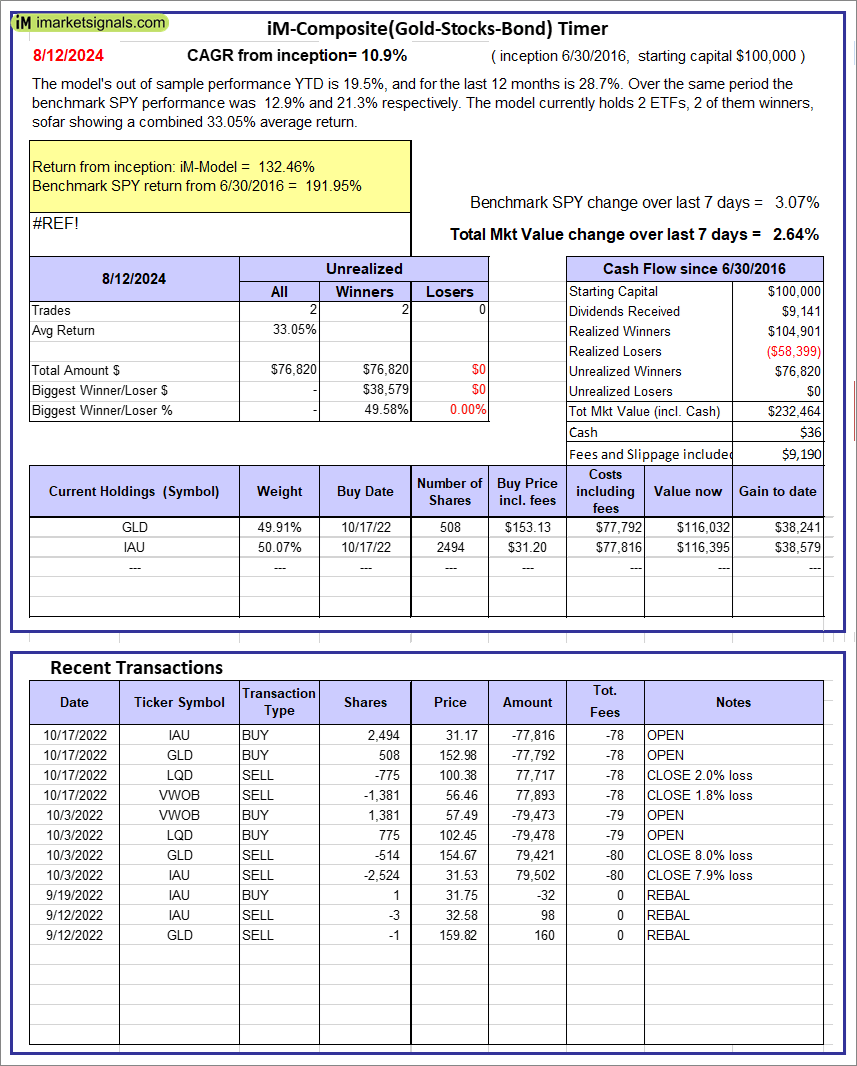 |
iM-Composite(Gold-Stocks-Bond) Timer: The model’s out of sample performance YTD is 19.5%, and for the last 12 months is 28.7%. Over the same period the benchmark SPY performance was 12.9% and 21.3% respectively. Over the previous week the market value of the iM-Composite(Gold-Stocks-Bond) Timer gained 2.64% at a time when SPY gained 3.07%. A starting capital of $100,000 at inception on 6/30/2016 would have grown to $232,464 which includes $36 cash and excludes $9,190 spent on fees and slippage. |
iM-Best Reports – 8/12/2024
Posted in pmp SPY-SH
Leave a Reply
You must be logged in to post a comment.