
  |
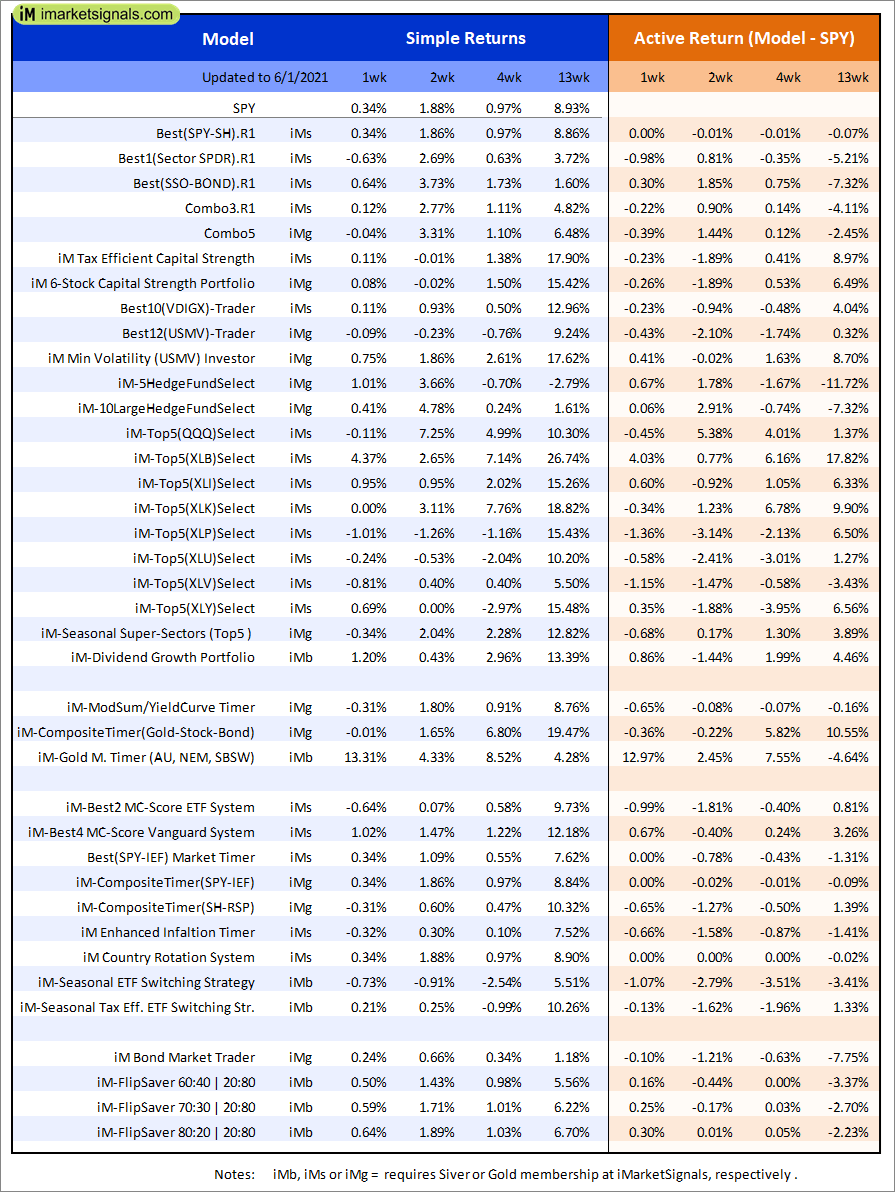
Out of sample performance summary of our models for the past 1, 2, 4 and 13 week periods. The active active return indicates how the models over- or underperformed the benchmark ETF SPY. Also the YTD, and the 1-, 3-, 5- and 10-year annualized returns are shown in the second table |
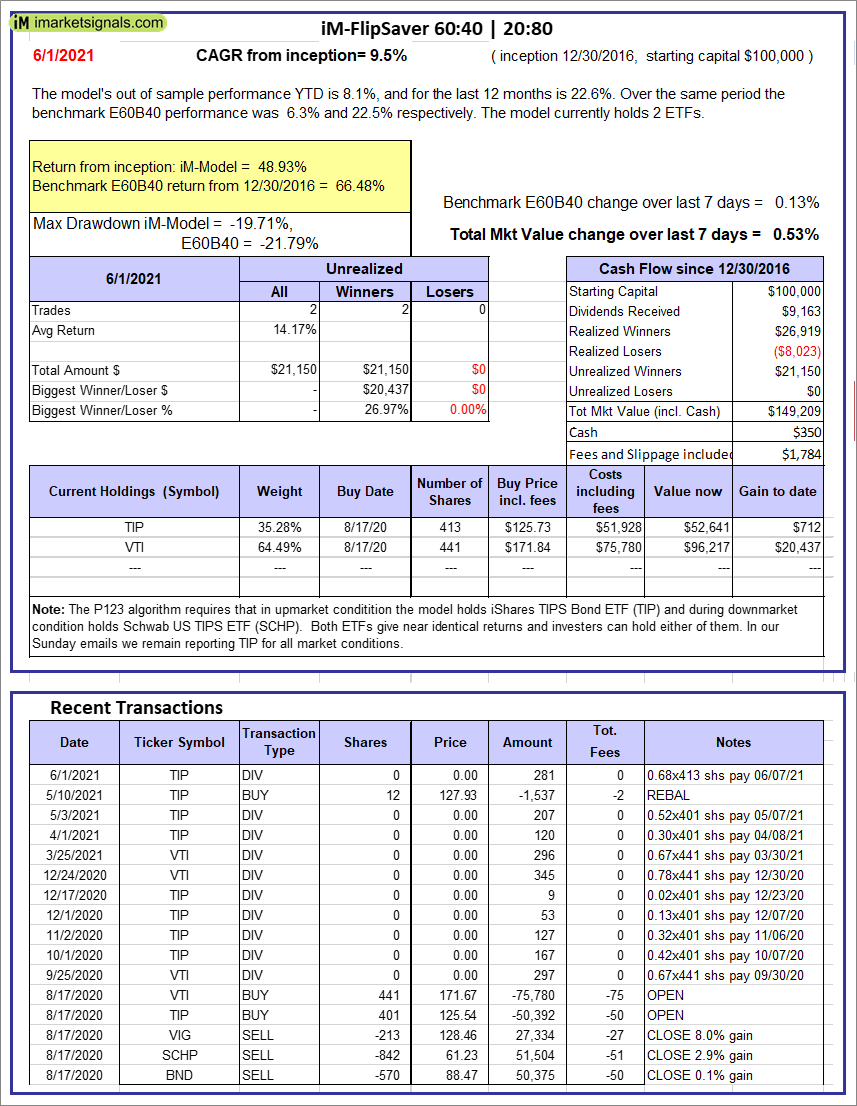 |
iM-FlipSaver 60:40 | 20:80 – 2017: The model’s out of sample performance YTD is 8.1%, and for the last 12 months is 22.6%. Over the same period the benchmark E60B40 performance was 6.3% and 22.5% respectively. Over the previous week the market value of iM-FlipSaver 80:20 | 20:80 gained 0.53% at a time when SPY gained 0.13%. A starting capital of $100,000 at inception on 7/16/2015 would have grown to $149,209 which includes $350 cash and excludes $1,784 spent on fees and slippage. |
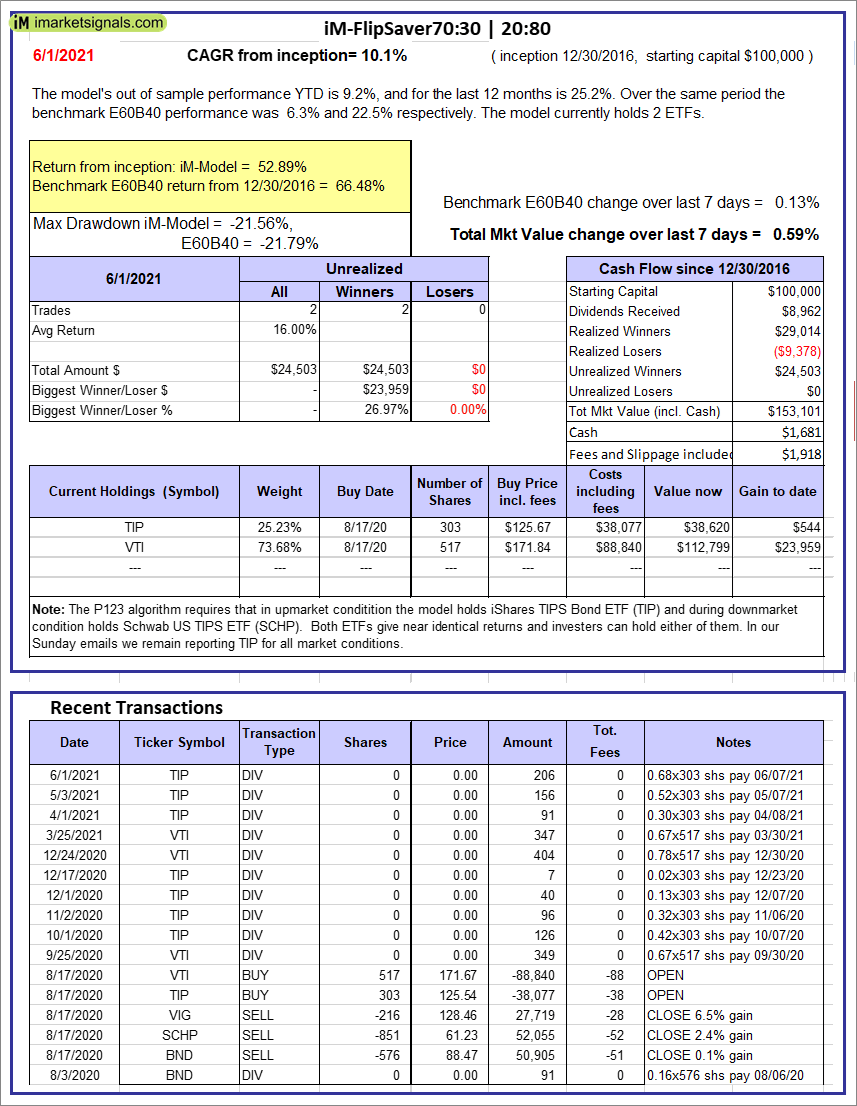 |
iM-FlipSaver 70:30 | 20:80 – 2017: The model’s out of sample performance YTD is 9.2%, and for the last 12 months is 25.2%. Over the same period the benchmark E60B40 performance was 6.3% and 22.5% respectively. Over the previous week the market value of iM-FlipSaver 70:30 | 20:80 gained 0.59% at a time when SPY gained 0.13%. A starting capital of $100,000 at inception on 7/15/2015 would have grown to $153,101 which includes $1,681 cash and excludes $1,918 spent on fees and slippage. |
 |
iM-FlipSaver 80:20 | 20:80 – 2017: The model’s out of sample performance YTD is 10.3%, and for the last 12 months is 27.8%. Over the same period the benchmark E60B40 performance was 6.3% and 22.5% respectively. Over the previous week the market value of iM-FlipSaver 80:20 | 20:80 gained 0.64% at a time when SPY gained 0.13%. A starting capital of $100,000 at inception on 1/2/2017 would have grown to $156,896 which includes $1,769 cash and excludes $2,045 spent on fees and slippage. |
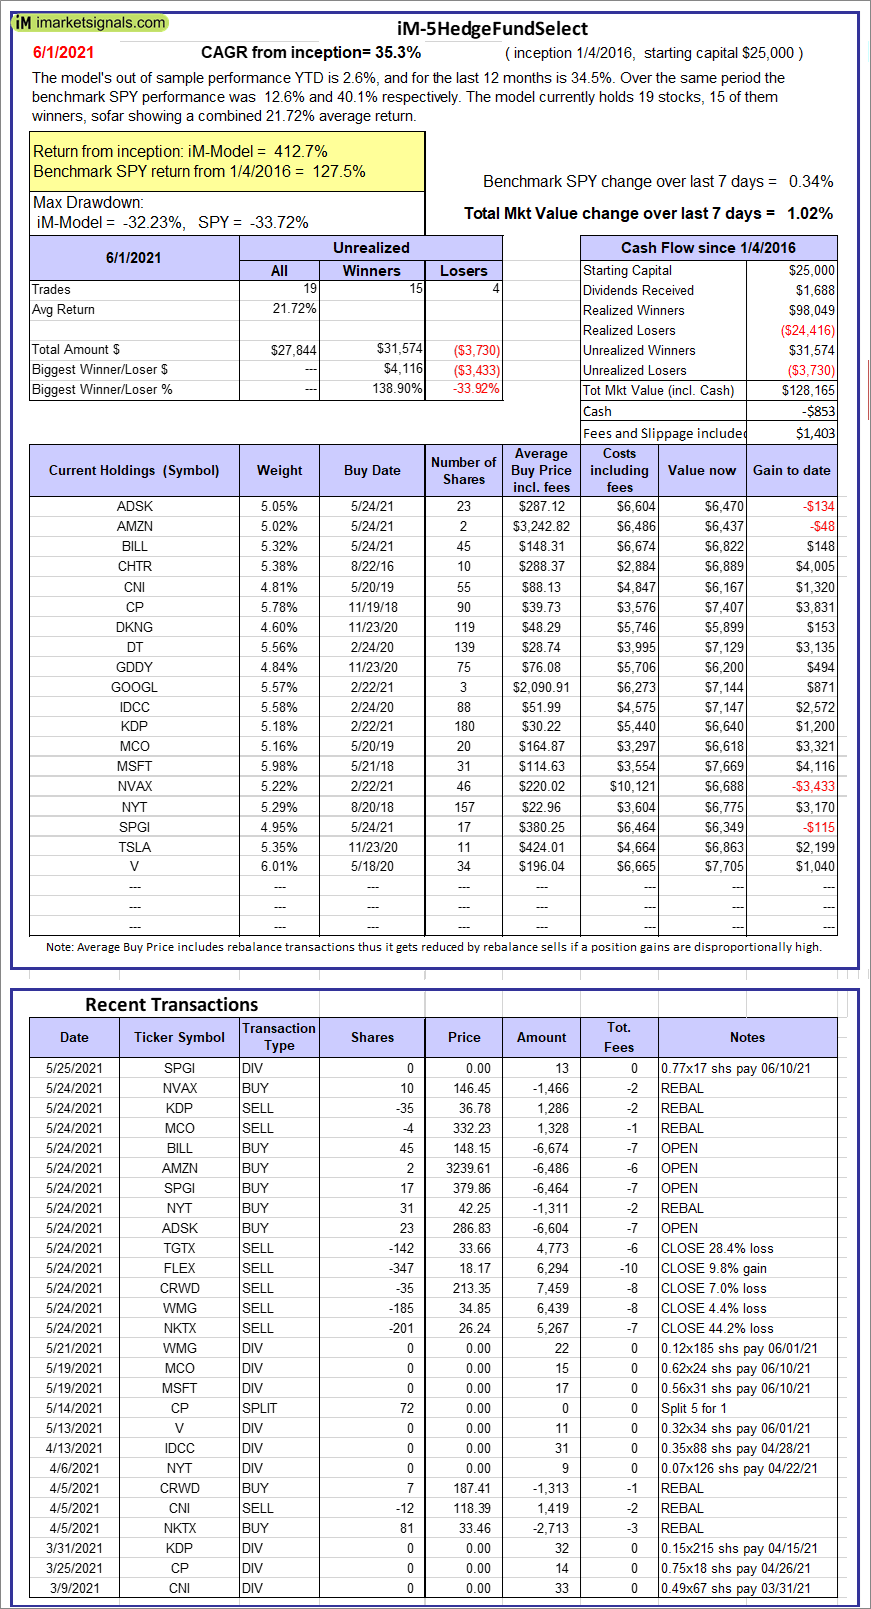 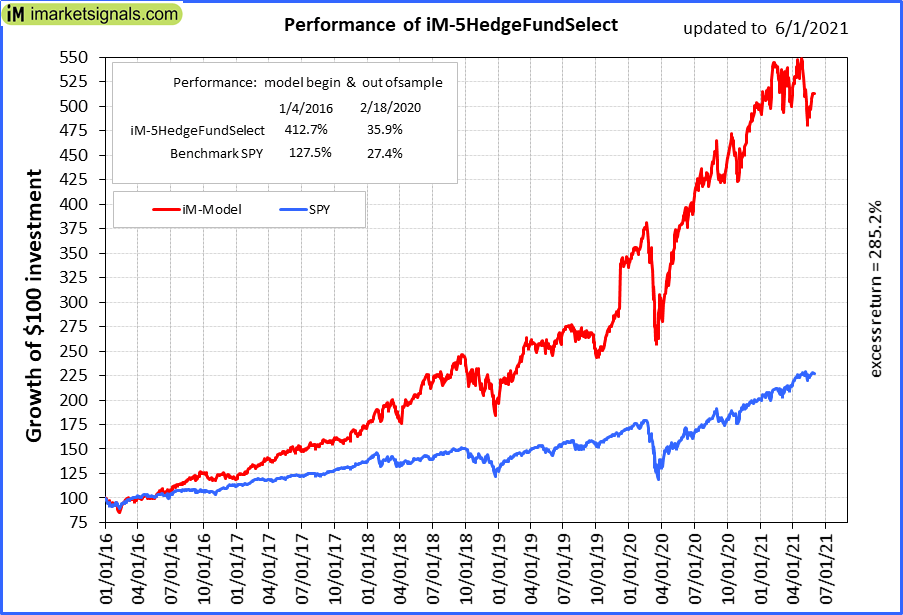 |
iM-5HedgeFundSelect: Since inception, on 1/5/2016, the model gained 412.66% while the benchmark SPY gained 127.47% over the same period. Over the previous week the market value of iM-5HedgeFundSelect gained 1.02% at a time when SPY gained 0.34%. A starting capital of $25,000 at inception on 1/5/2016 would have grown to $128,165 which includes -$853 cash and excludes $1,403 spent on fees and slippage. |
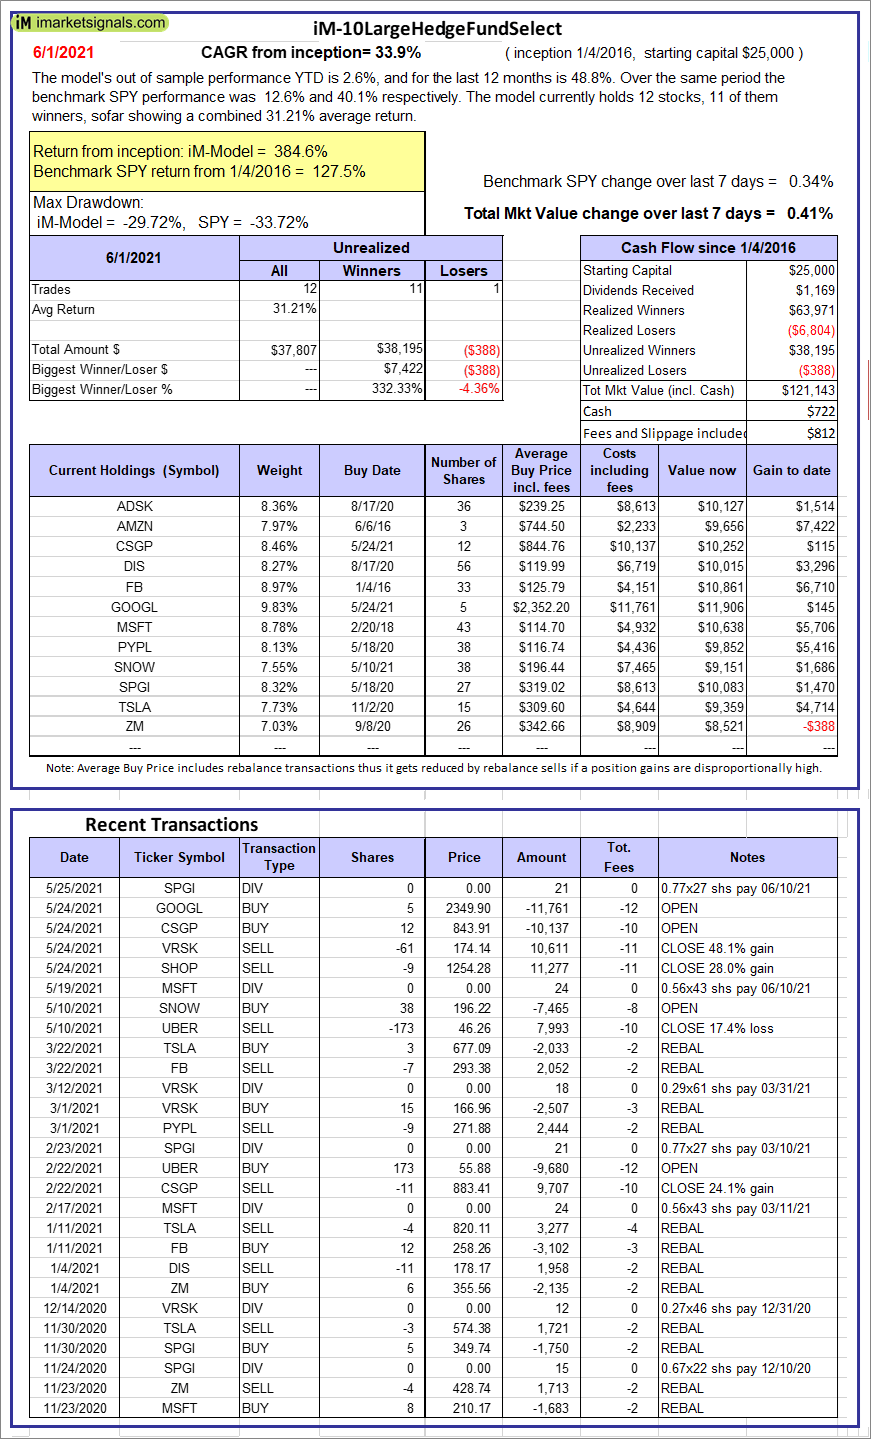 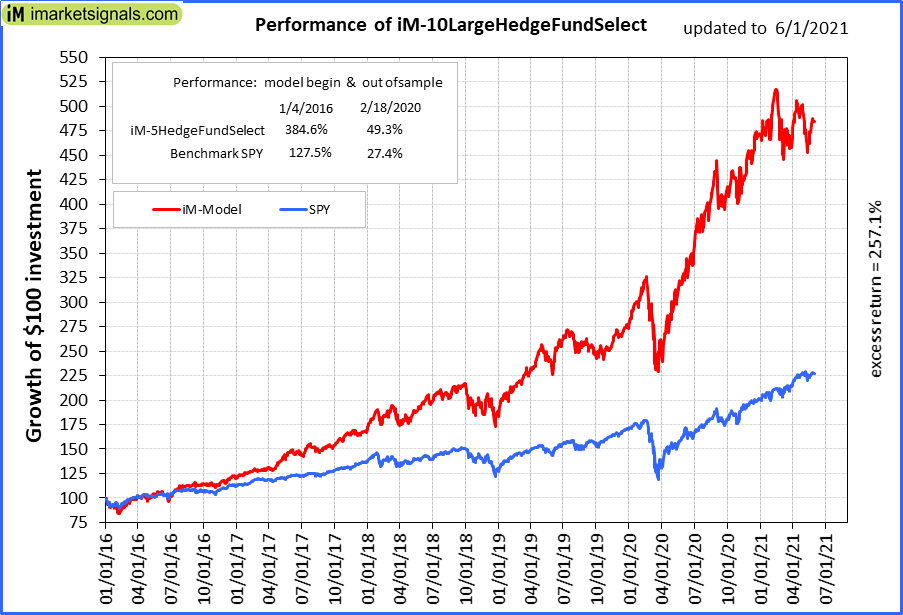 |
iM-10LargeHedgeFundSelect: Since inception, on 1/5/2016, the model gained 384.57% while the benchmark SPY gained 127.47% over the same period. Over the previous week the market value of iM-10LargeHedgeFundSelect gained 0.41% at a time when SPY gained 0.34%. A starting capital of $25,000 at inception on 1/5/2016 would have grown to $121,143 which includes $722 cash and excludes $812 spent on fees and slippage. |
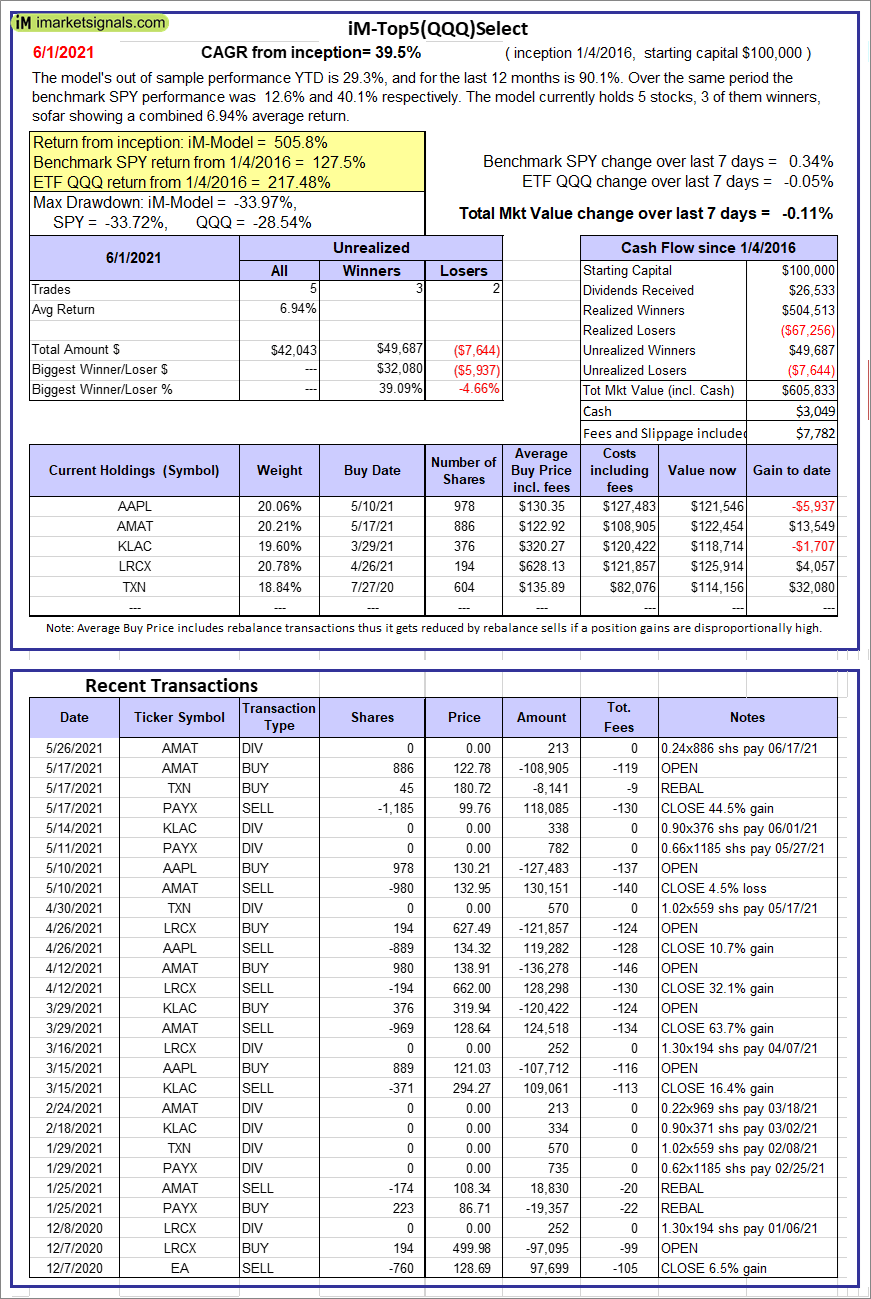 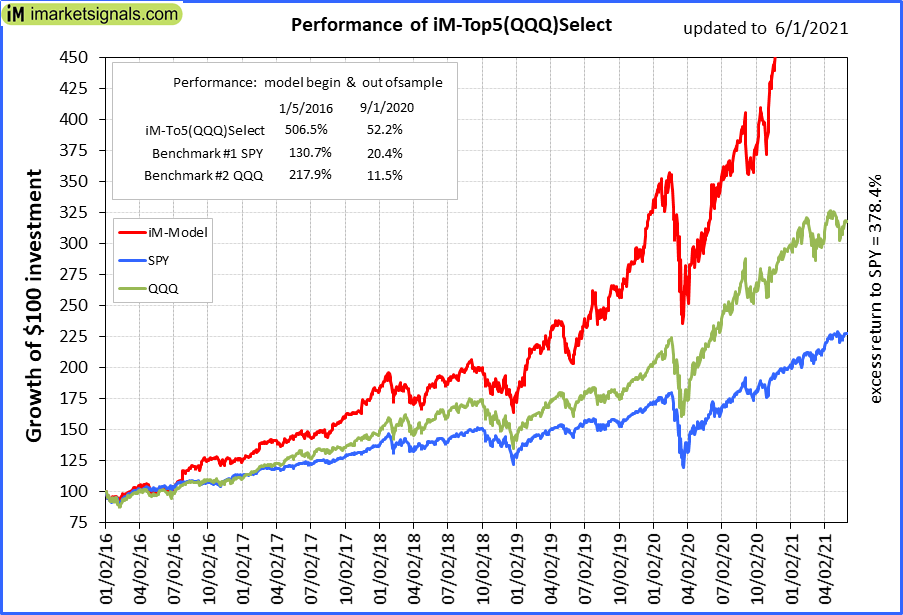 |
iM-Top5(QQQ)Select: Since inception, on 1/5/2016, the model gained 505.83% while the benchmark SPY gained 127.47% over the same period. Over the previous week the market value of iM-Top5(QQQ)Select gained -0.11% at a time when SPY gained 0.34%. A starting capital of $100,000 at inception on 1/5/2016 would have grown to $605,833 which includes $3,049 cash and excludes $7,782 spent on fees and slippage. |
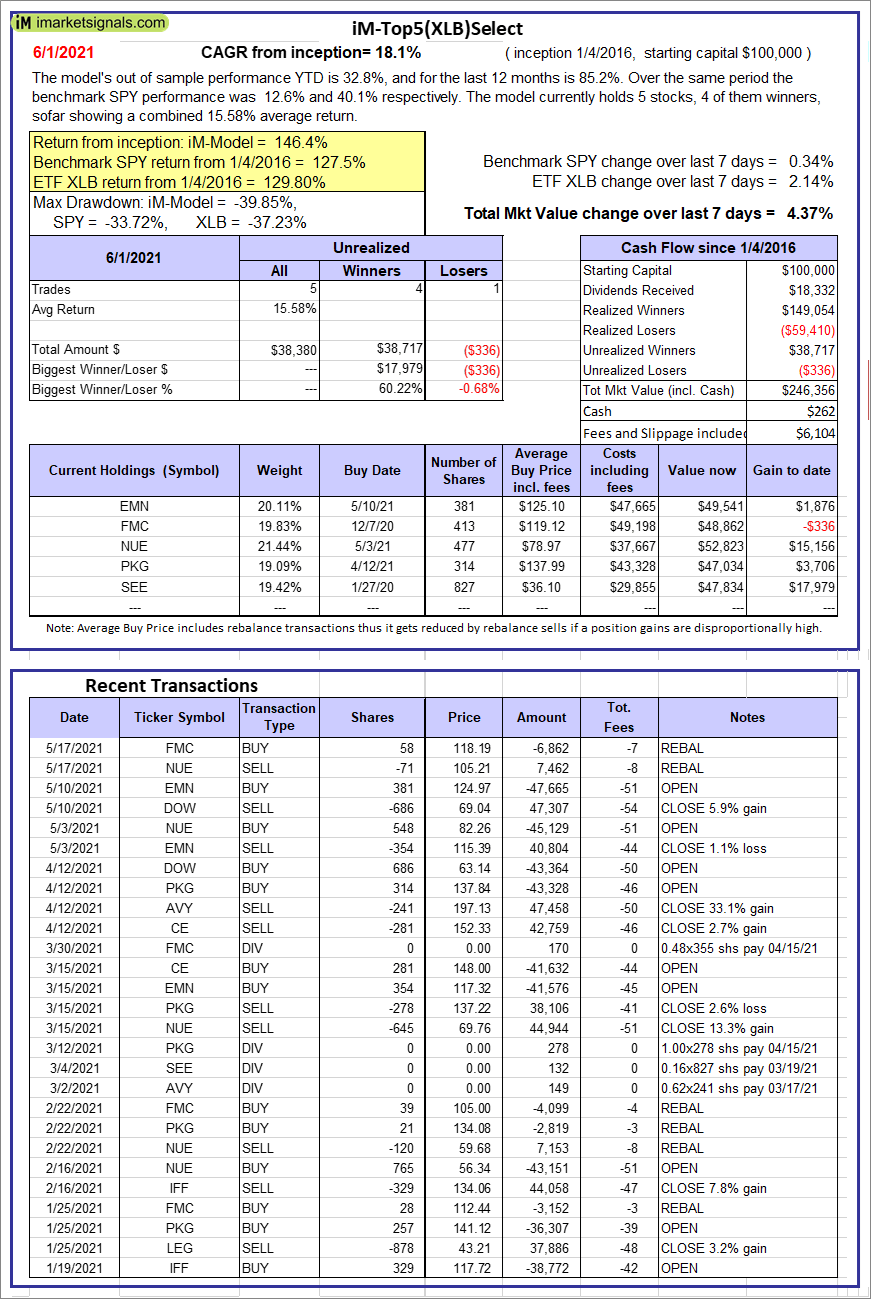  |
iM-Top5(XLB)Select: Since inception, on 1/5/2016, the model gained 146.36% while the benchmark SPY gained 127.47% over the same period. Over the previous week the market value of iM-Top5(XLB)Select gained 4.37% at a time when SPY gained 0.34%. A starting capital of $100,000 at inception on 1/5/2016 would have grown to $246,356 which includes $262 cash and excludes $6,104 spent on fees and slippage. |
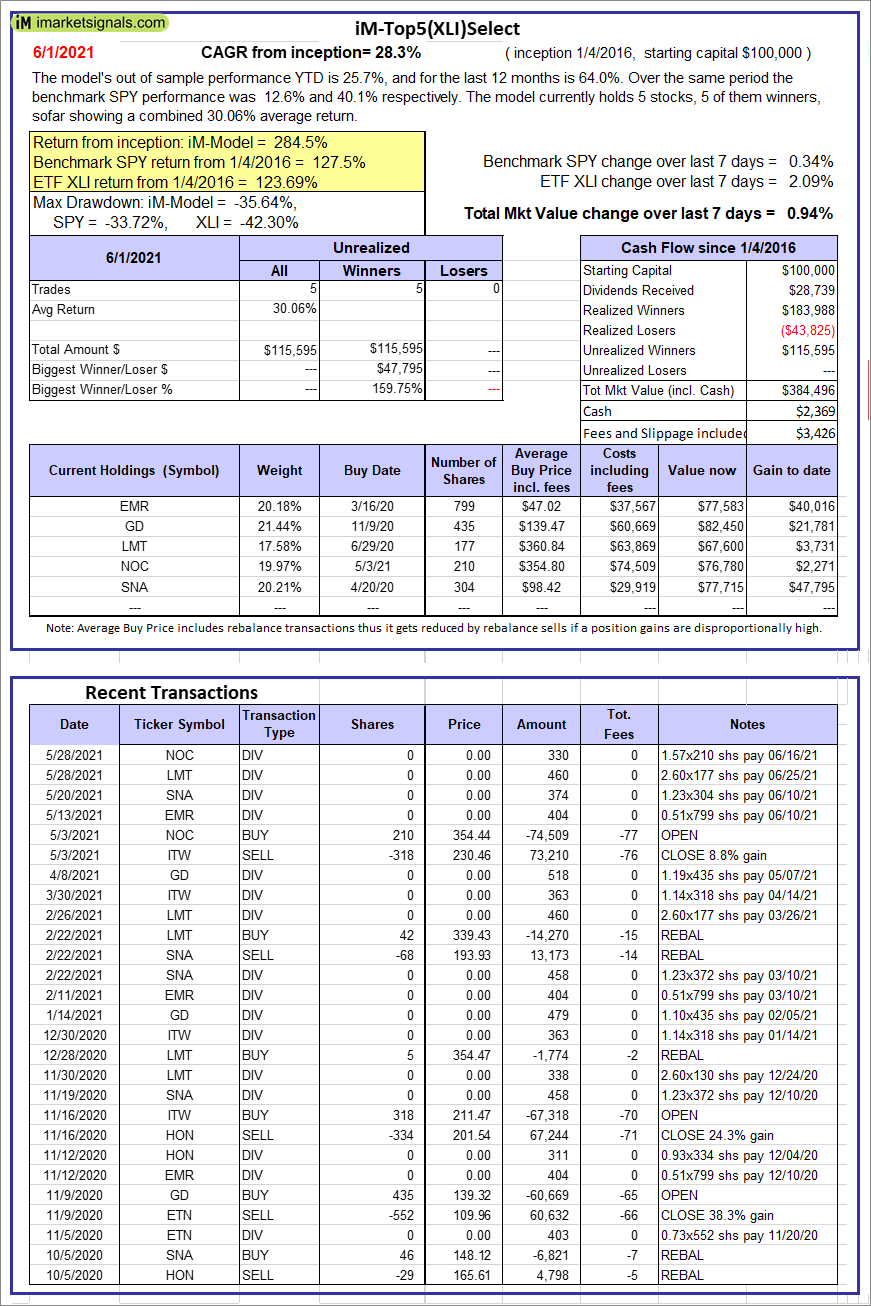 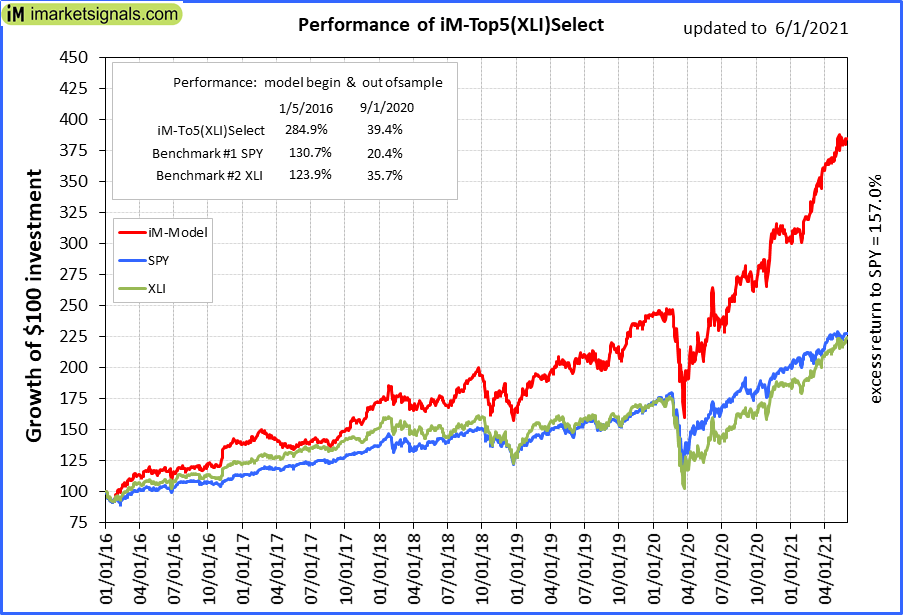 |
iM-Top5(XLI)Select: Since inception, on 1/5/2016, the model gained 284.50% while the benchmark SPY gained 127.47% over the same period. Over the previous week the market value of iM-Top5(XLI)Select gained 0.94% at a time when SPY gained 0.34%. A starting capital of $100,000 at inception on 1/5/2016 would have grown to $384,496 which includes $2,369 cash and excludes $3,426 spent on fees and slippage. |
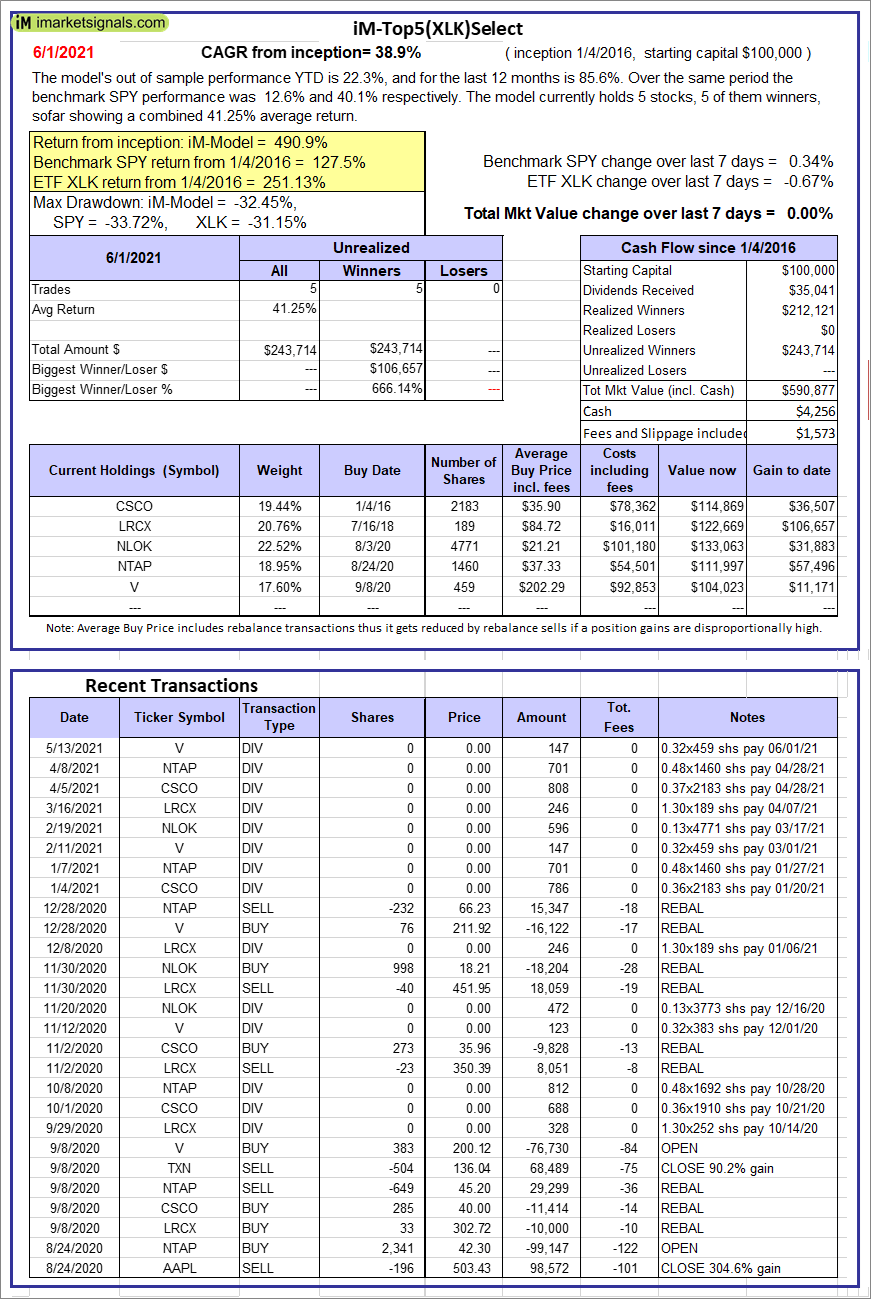 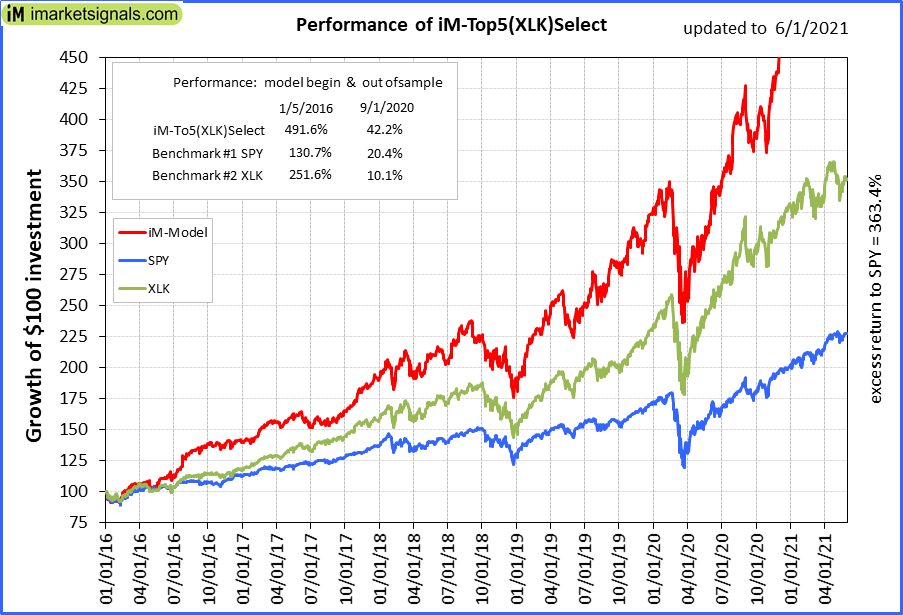 |
iM-Top5(XLK)Select: Since inception, on 1/5/2016, the model gained 490.88% while the benchmark SPY gained 127.47% over the same period. Over the previous week the market value of iM-Top5(XLK)Select gained 0.00% at a time when SPY gained 0.34%. A starting capital of $100,000 at inception on 1/5/2016 would have grown to $590,877 which includes $4,256 cash and excludes $1,573 spent on fees and slippage. |
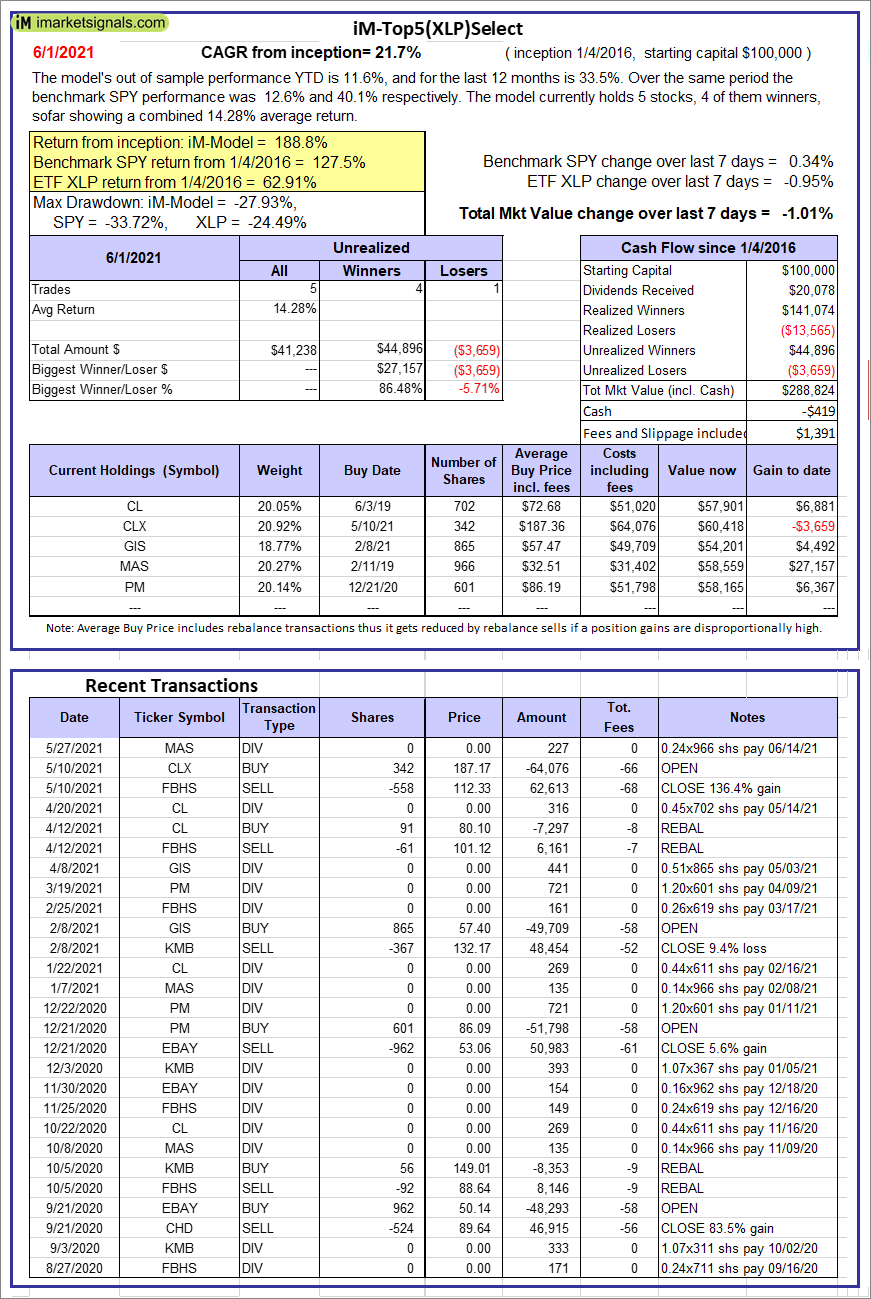 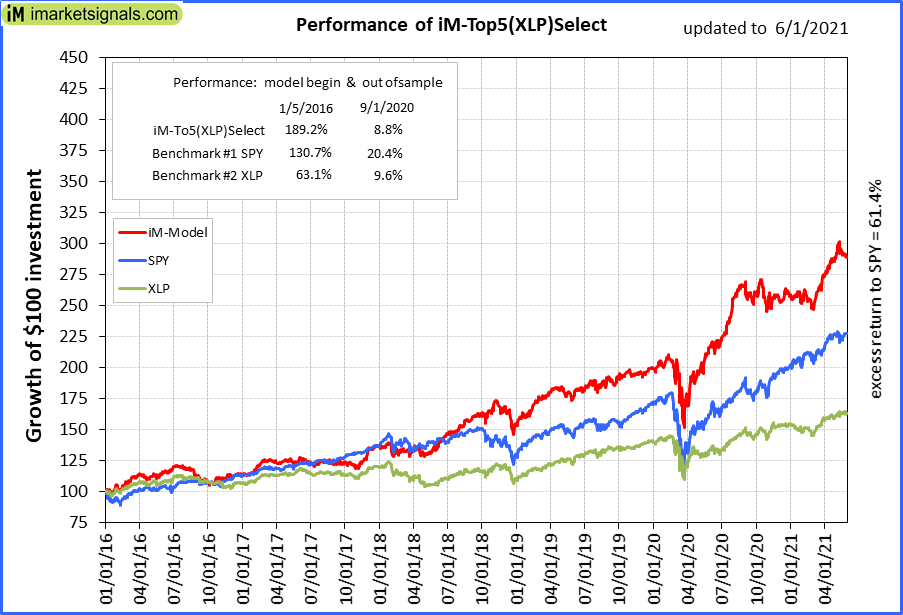 |
iM-Top5(XLP)Select: Since inception, on 1/5/2016, the model gained 188.82% while the benchmark SPY gained 127.47% over the same period. Over the previous week the market value of iM-Top5(XLP)Select gained -1.01% at a time when SPY gained 0.34%. A starting capital of $100,000 at inception on 1/5/2016 would have grown to $288,824 which includes -$419 cash and excludes $1,391 spent on fees and slippage. |
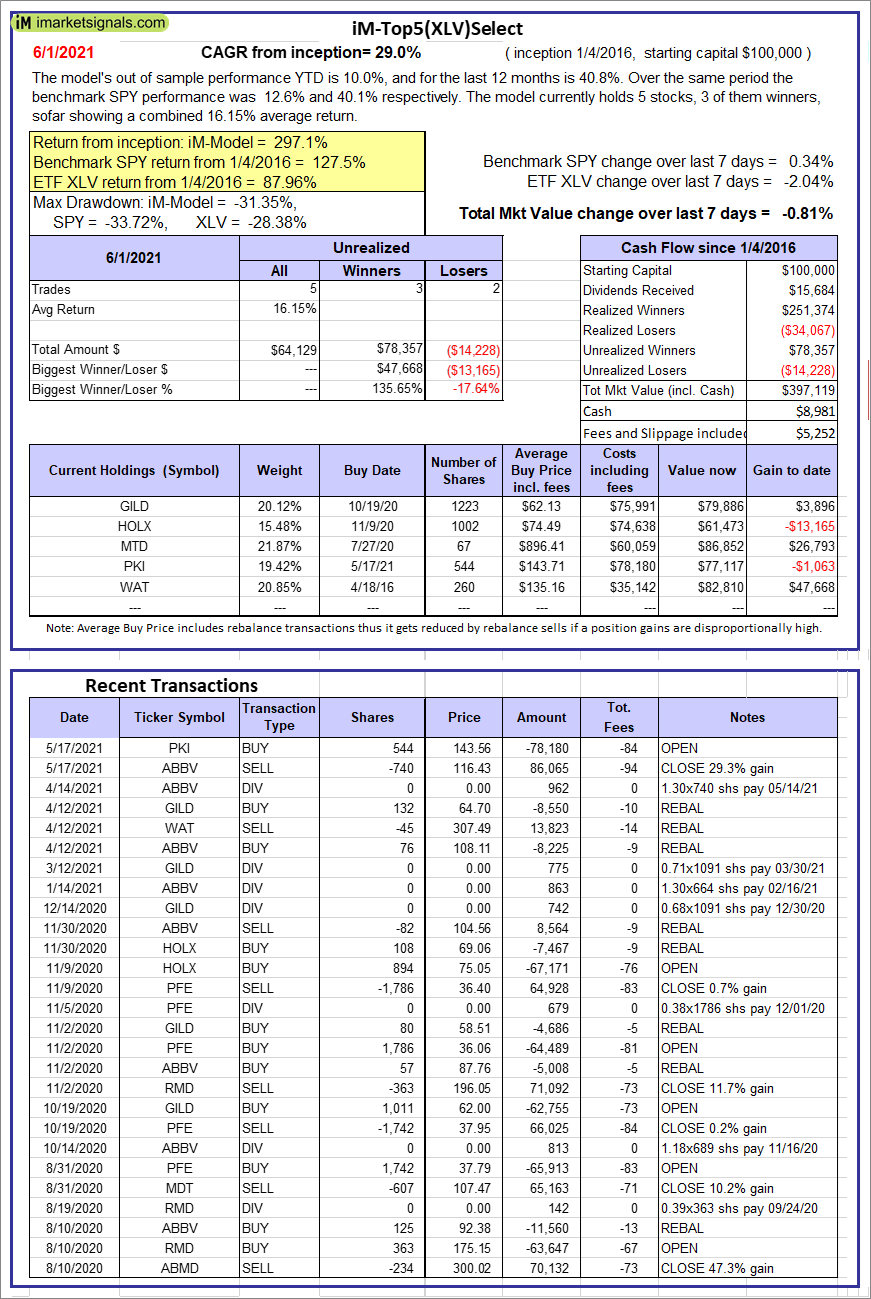 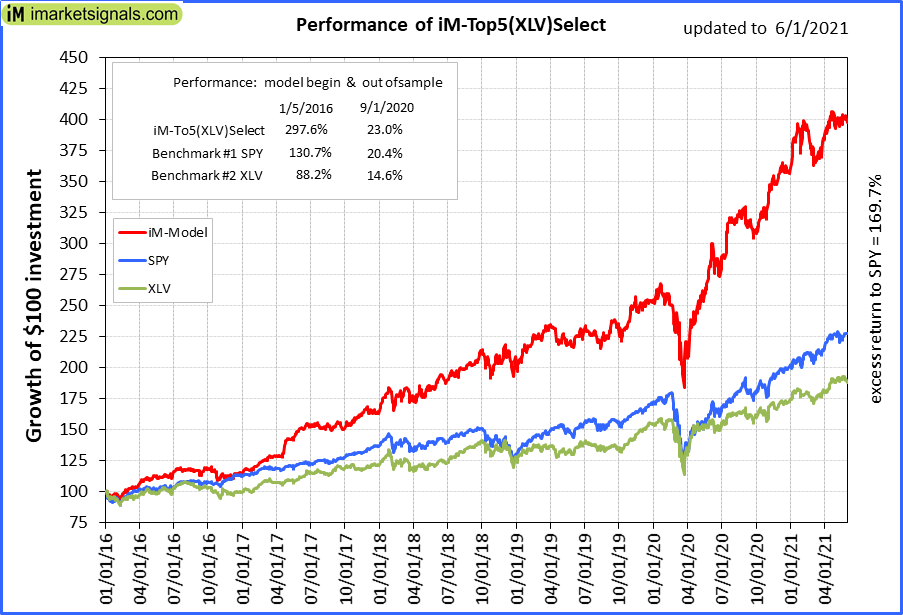 |
iM-Top5(XLV)Select: Since inception, on 1/5/2016, the model gained 297.12% while the benchmark SPY gained 127.47% over the same period. Over the previous week the market value of iM-Top5(XLV)Select gained -0.81% at a time when SPY gained 0.34%. A starting capital of $100,000 at inception on 1/5/2016 would have grown to $397,119 which includes $8,981 cash and excludes $5,252 spent on fees and slippage. |
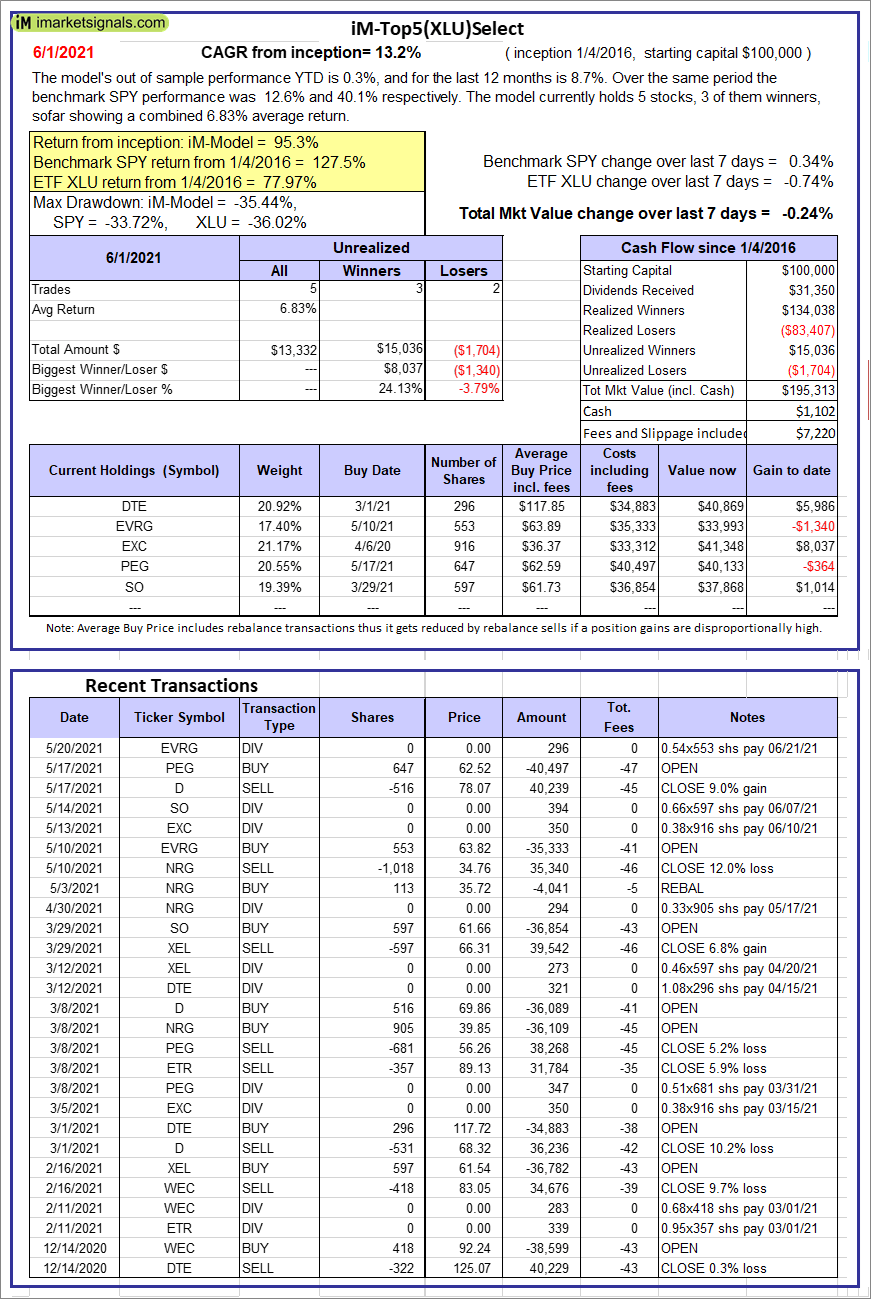  |
iM-Top5(XLU)Select: Since inception, on 1/5/2016, the model gained 95.31% while the benchmark SPY gained 127.47% over the same period. Over the previous week the market value of iM-Top5(XLU)Select gained -0.24% at a time when SPY gained 0.34%. A starting capital of $100,000 at inception on 1/5/2016 would have grown to $195,313 which includes $1,102 cash and excludes $7,220 spent on fees and slippage. |
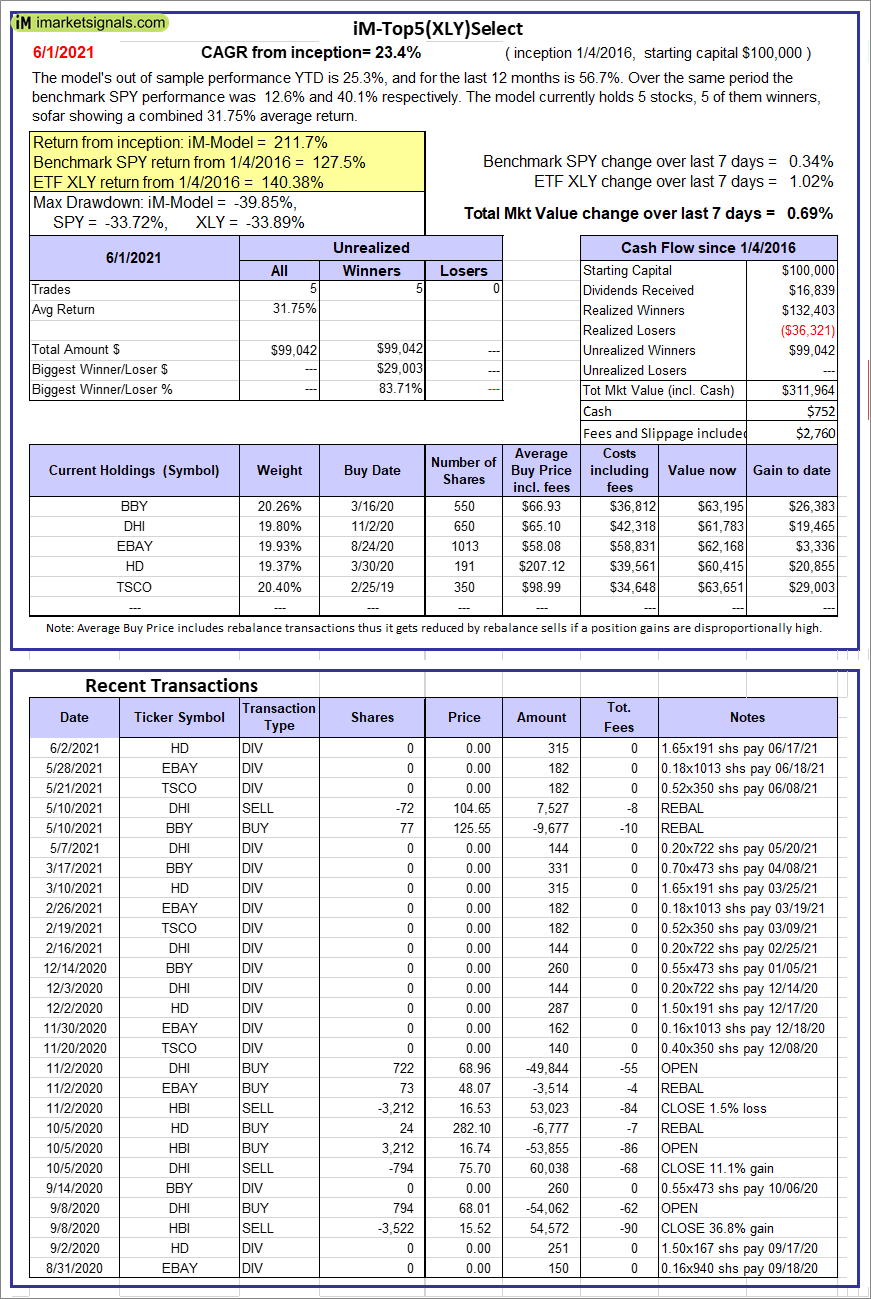 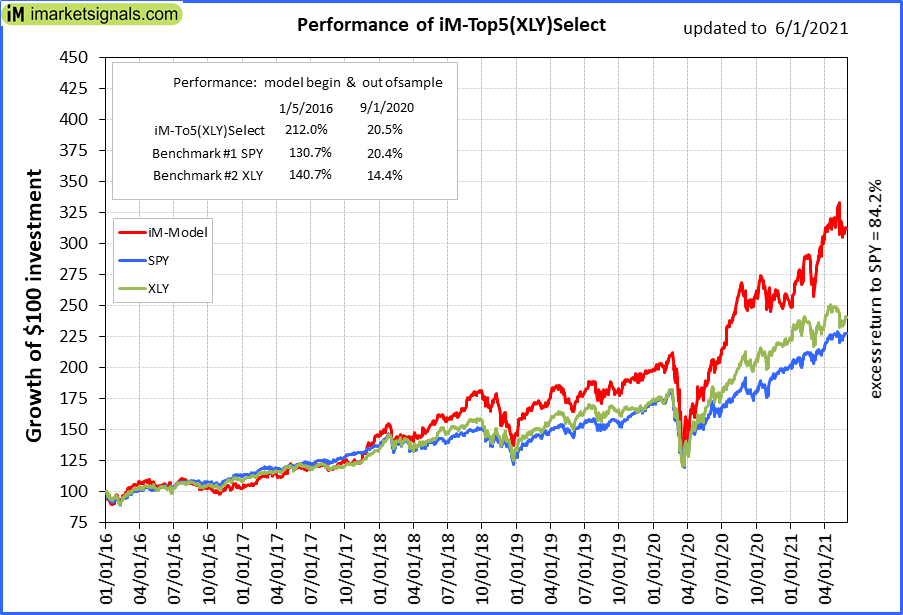 |
iM-Top5(XLY)Select: Since inception, on 1/5/2016, the model gained 211.65% while the benchmark SPY gained 127.47% over the same period. Over the previous week the market value of iM-Top5(XLY)Select gained 0.69% at a time when SPY gained 0.34%. A starting capital of $100,000 at inception on 1/5/2016 would have grown to $311,964 which includes $752 cash and excludes $2,760 spent on fees and slippage. |
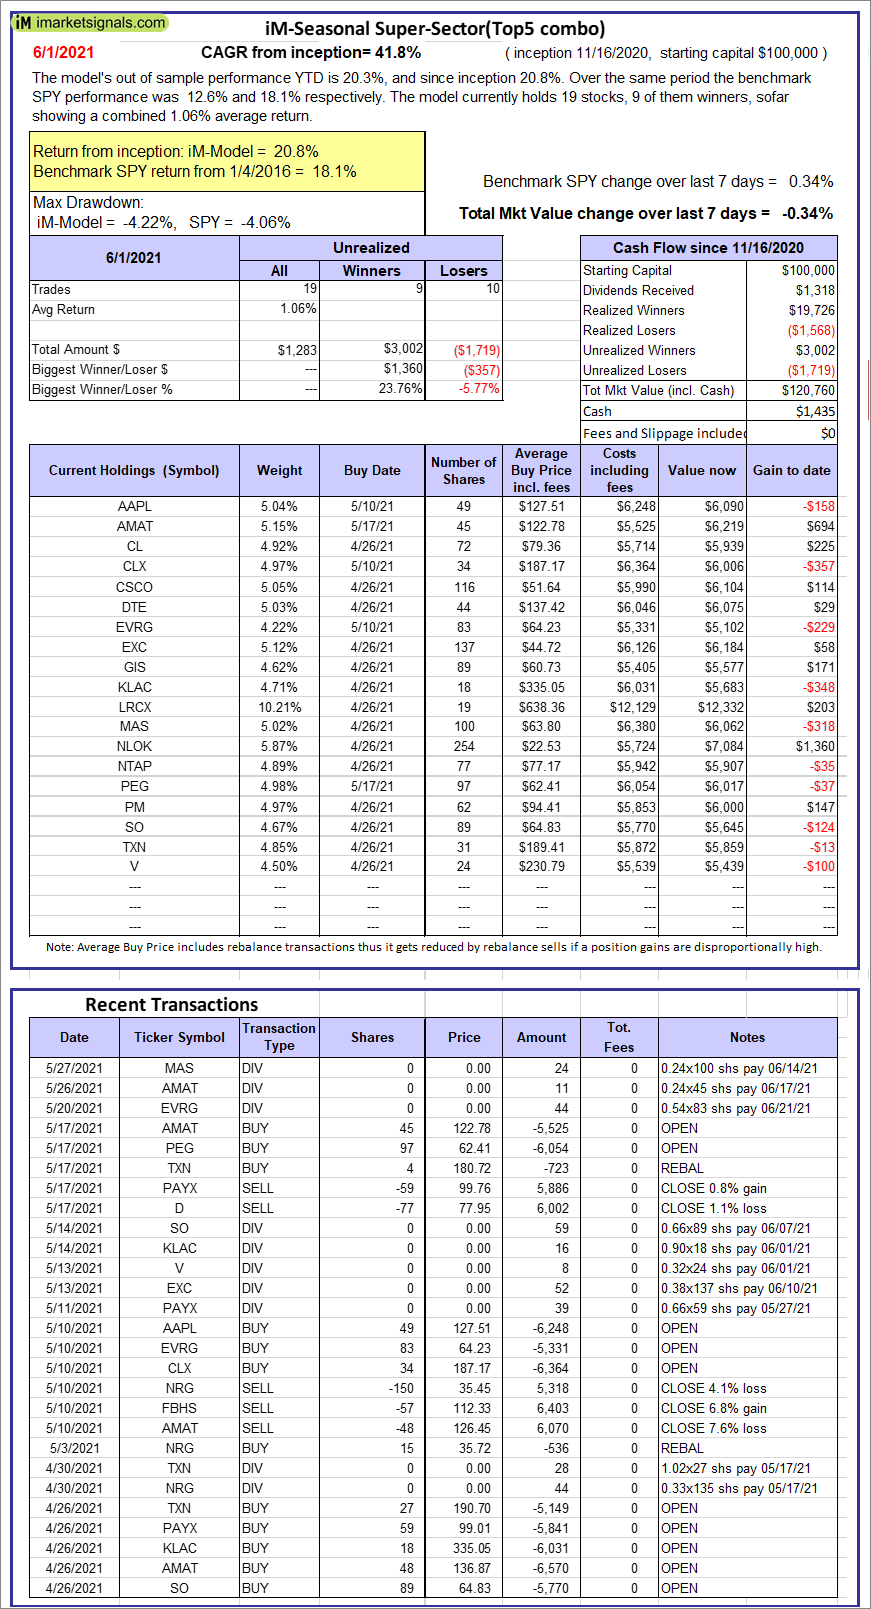 |
iM-Seasonal Super-Sectors (Top5 combo) : Since inception, on 11/17/2020, the model gained 20.76% while the benchmark SPY gained 18.08% over the same period. Over the previous week the market value of iM-Seasonal Super-Sectors (Top5 combo) gained -0.34% at a time when SPY gained 0.34%. A starting capital of $100,000 at inception on 11/17/2020 would have grown to $120,760 which includes $1,435 cash and excludes $00 spent on fees and slippage. |
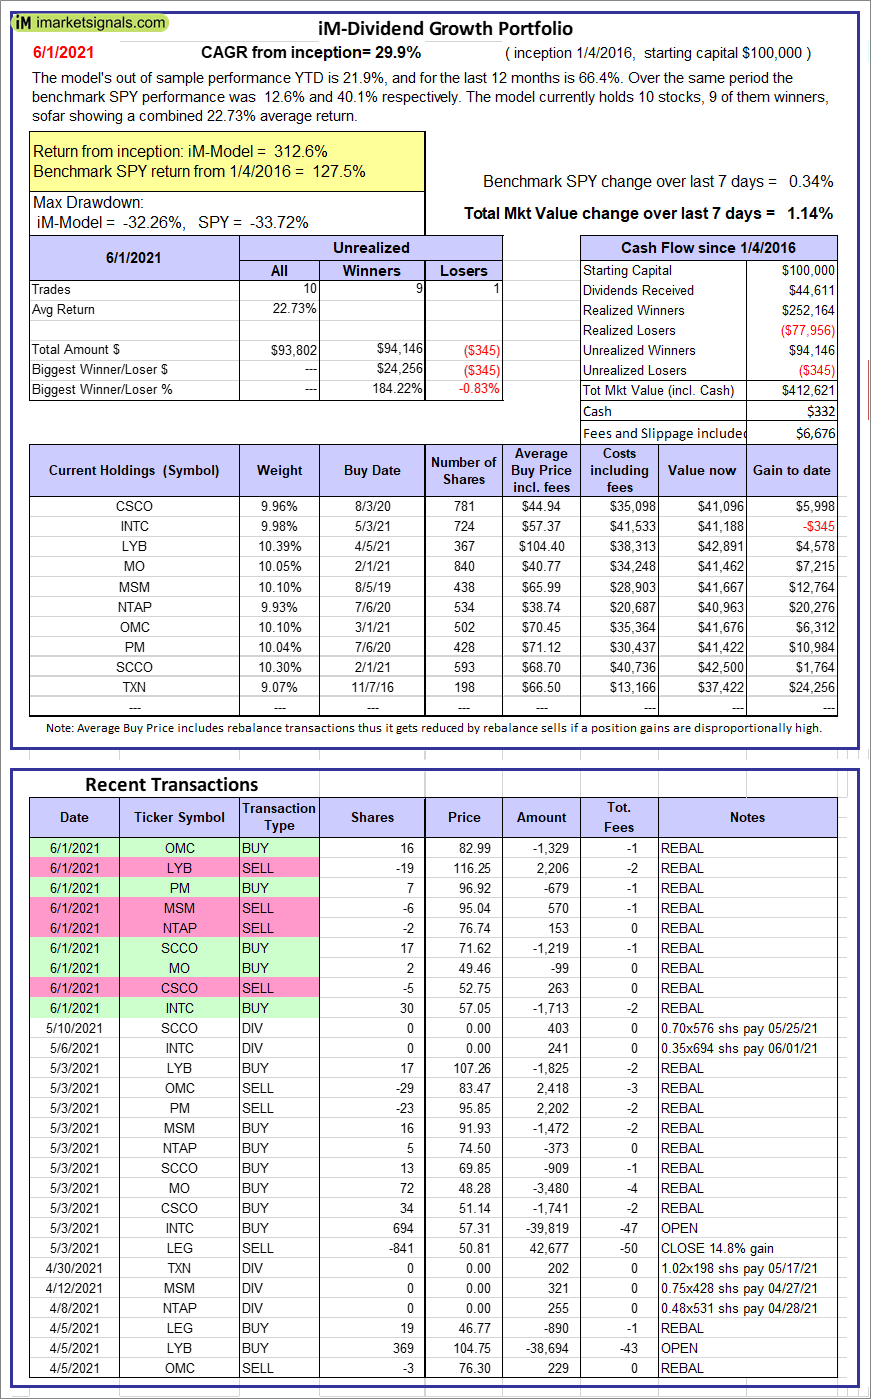 |
iM-Dividend Growth Portfolio: The model’s out of sample performance YTD is 21.9%, and for the last 12 months is 66.4%. Over the same period the benchmark SPY performance was 12.6% and 40.1% respectively. Over the previous week the market value of the iM-Dividend Growth Portfolio gained 1.14% at a time when SPY gained 0.34%. A starting capital of $100,000 at inception on 6/30/2016 would have grown to $412,621 which includes $332 cash and excludes $6,676 spent on fees and slippage. |
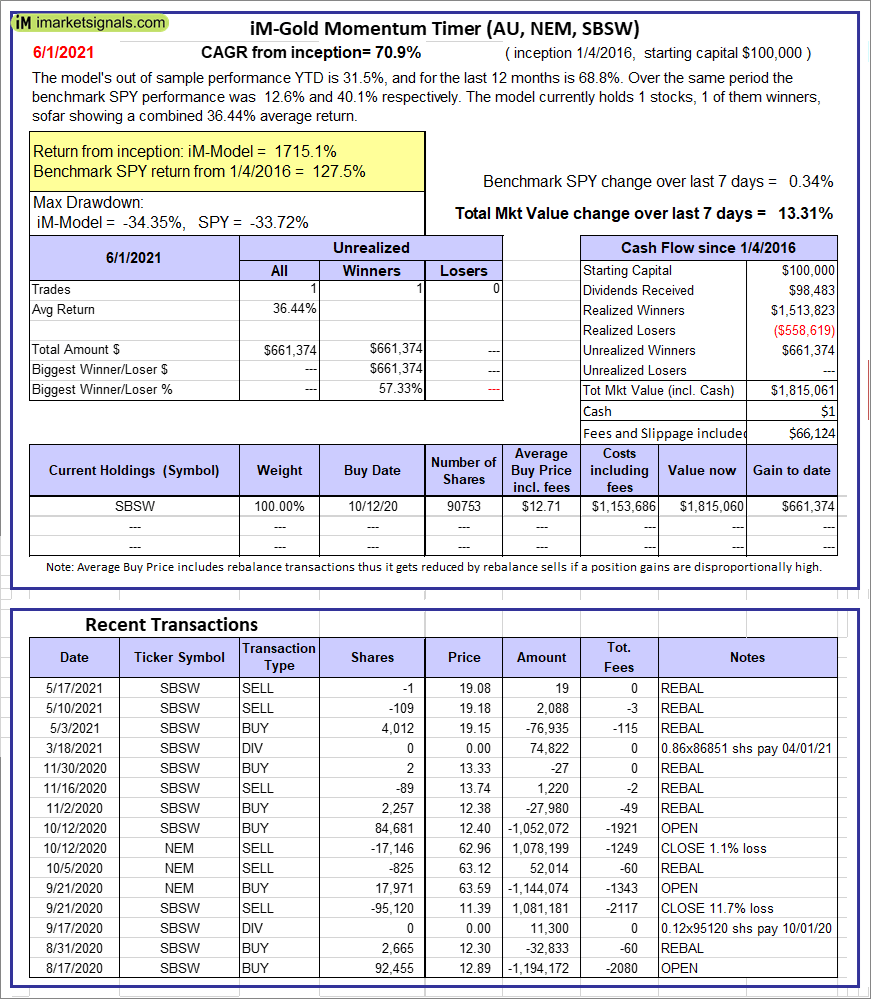 |
iM-Gold Momentum Timer (AU, NEM, SBSW): The model’s out of sample performance YTD is 31.5%, and for the last 12 months is 68.8%. Over the same period the benchmark SPY performance was 12.6% and 40.1% respectively. Over the previous week the market value of iM-Gold Momentum Timer (AU, NEM, SBSW) gained 13.31% at a time when SPY gained 0.34%. A starting capital of $100,000 at inception on 6/30/2016 would have grown to $01 which includes $66,124 cash and excludes Gain to date spent on fees and slippage. |
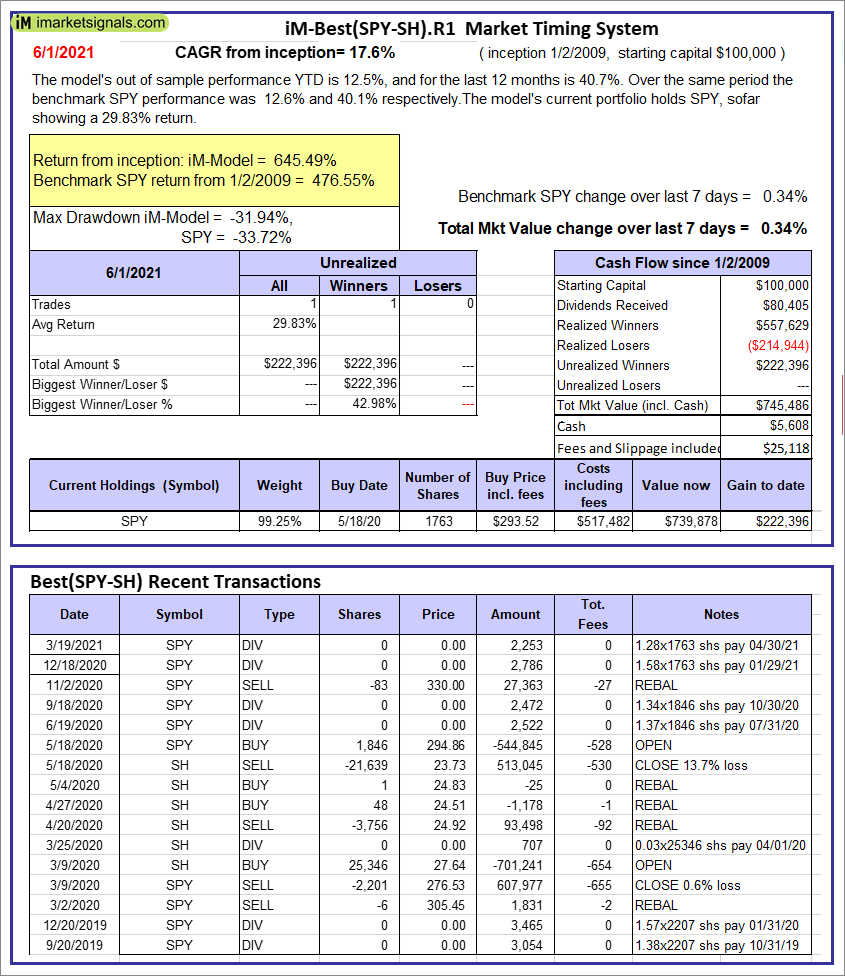 |
iM-Best(SPY-SH).R1: The model’s out of sample performance YTD is 12.5%, and for the last 12 months is 40.7%. Over the same period the benchmark SPY performance was 12.6% and 40.1% respectively. Over the previous week the market value of Best(SPY-SH) gained 0.34% at a time when SPY gained 0.34%. A starting capital of $100,000 at inception on 1/2/2009 would have grown to $745,486 which includes $5,608 cash and excludes $25,118 spent on fees and slippage. |
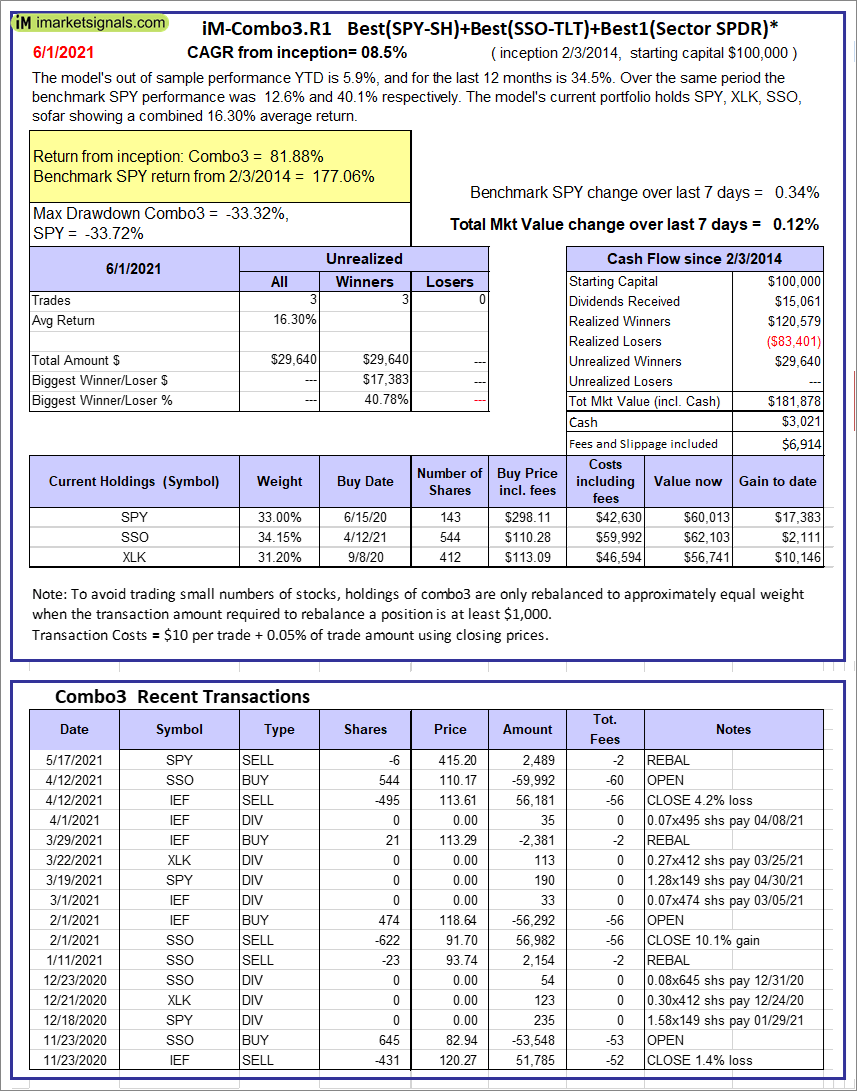 |
iM-Combo3.R1: The model’s out of sample performance YTD is 5.9%, and for the last 12 months is 34.5%. Over the same period the benchmark SPY performance was 12.6% and 40.1% respectively. Over the previous week the market value of iM-Combo3.R1 gained 0.12% at a time when SPY gained 0.34%. A starting capital of $100,000 at inception on 2/3/2014 would have grown to $181,878 which includes $3,021 cash and excludes $6,914 spent on fees and slippage. |
 |
iM-Combo5: The model’s out of sample performance YTD is 10.0%, and for the last 12 months is 49.7%. Over the same period the benchmark SPY performance was 12.6% and 40.1% respectively. Over the previous week the market value of iM-Combo5 gained -0.04% at a time when SPY gained 0.34%. A starting capital of $100,000 at inception on 2/22/2016 would have grown to $195,367 which includes $663 cash and excludes $0 spent on fees and slippage. |
 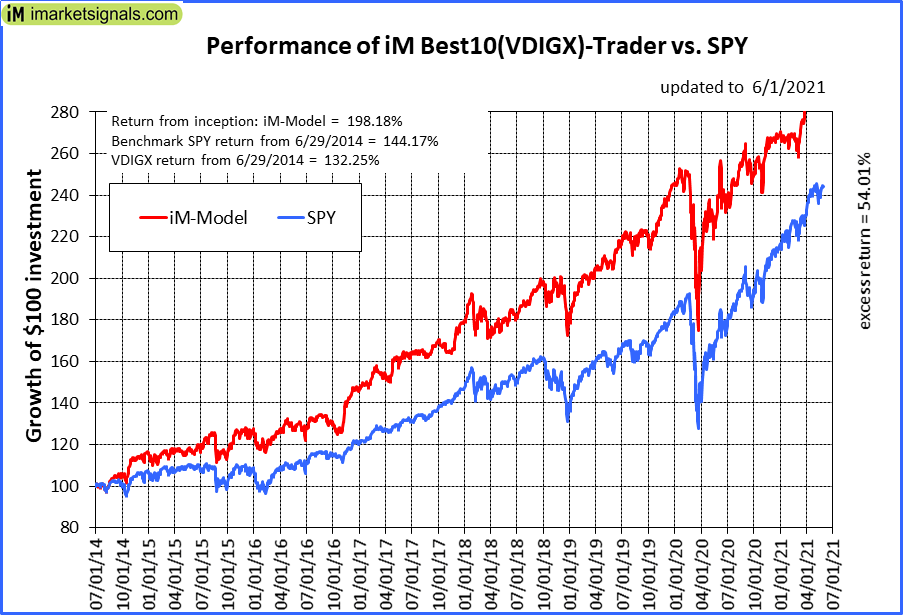 |
iM-Best10(VDIGX)-Trader: The model’s out of sample performance YTD is 10.2%, and for the last 12 months is 25.1%. Over the same period the benchmark SPY performance was 12.6% and 40.1% respectively. Since inception, on 7/1/2014, the model gained 198.18% while the benchmark SPY gained 144.17% and VDIGX gained 132.25% over the same period. Over the previous week the market value of iM-Best10(VDIGX) gained -0.05% at a time when SPY gained 0.34%. A starting capital of $100,000 at inception on 7/1/2014 would have grown to $298,344 which includes $1,302 cash and excludes $3,880 spent on fees and slippage. |
 |
iM 6-Stock Capital Strength Portfolio: The model’s out of sample performance YTD is 15.0%, and for the last 12 months is 55.3%. Over the same period the benchmark SPY performance was 12.6% and 40.1% respectively. Over the previous week the market value of the iM 6-Stock Capital Strength Portfolio gained 0.08% at a time when SPY gained 0.34%. A starting capital of $100,000 at inception on 10/28/2016 would have grown to $216,376 which includes $37,866 cash and excludes $1,764 spent on fees and slippage. |
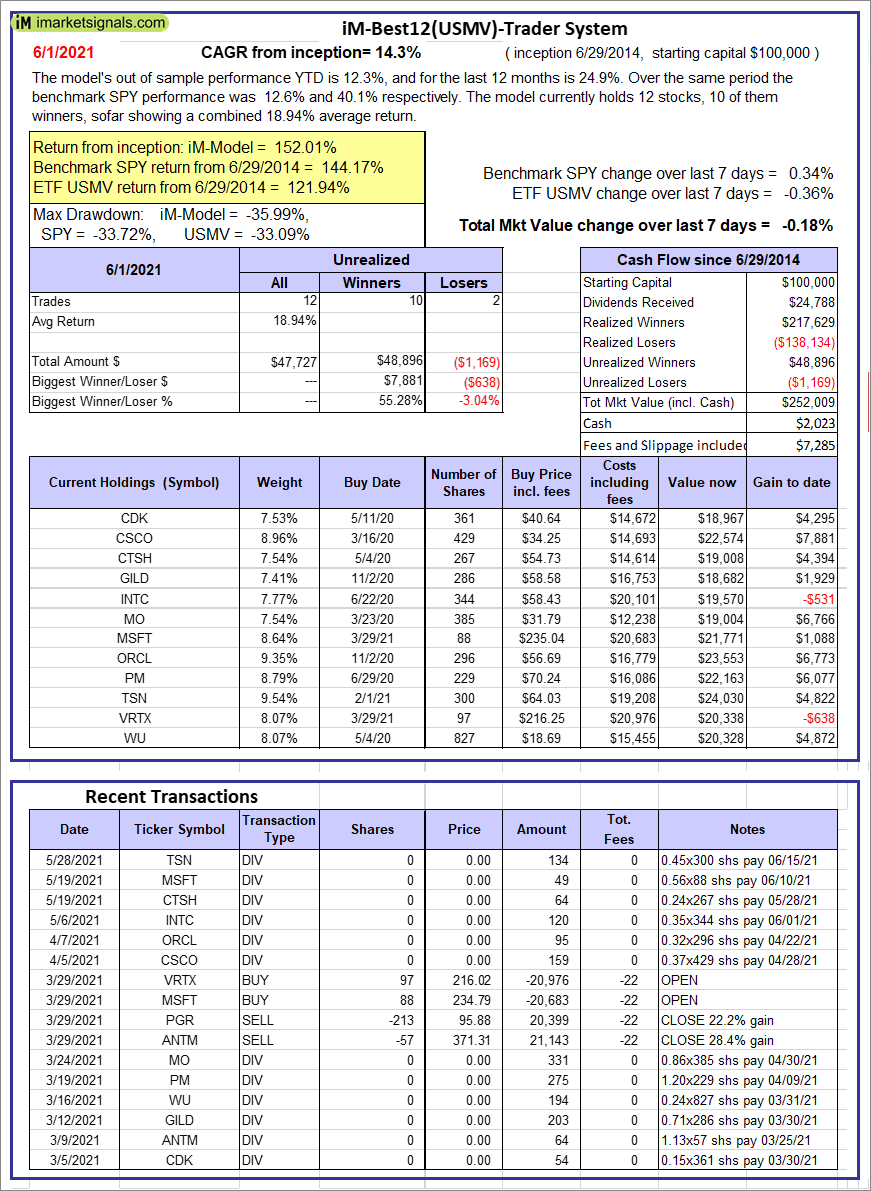 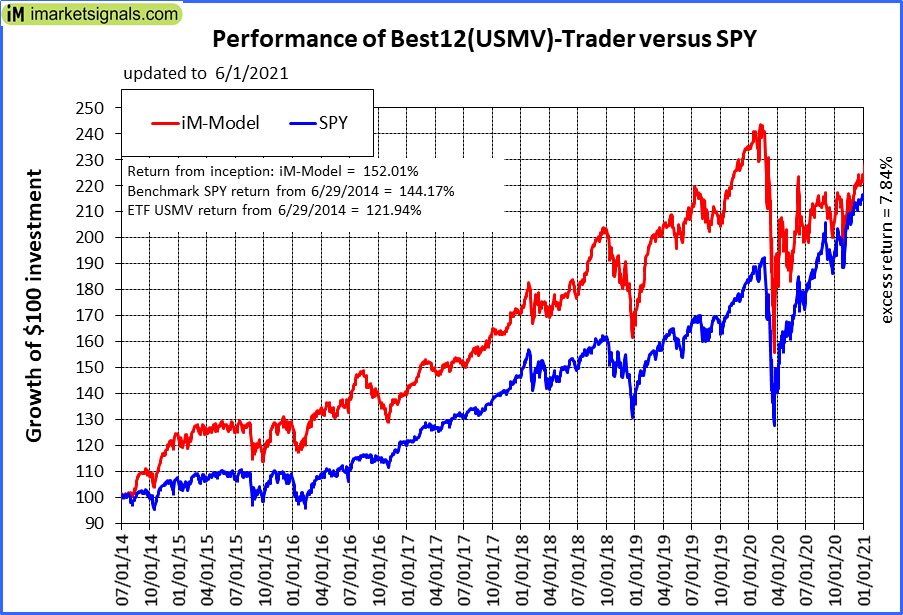 |
iM-Best12(USMV)-Trader: The model’s out of sample performance YTD is 12.3%, and for the last 12 months is 24.9%. Over the same period the benchmark SPY performance was 12.6% and 40.1% respectively. Since inception, on 6/30/2014, the model gained 152.01% while the benchmark SPY gained 144.17% and the ETF USMV gained 121.94% over the same period. Over the previous week the market value of iM-Best12(USMV)-Trader gained -0.18% at a time when SPY gained 0.34%. A starting capital of $100,000 at inception on 6/30/2014 would have grown to $252,009 which includes $2,023 cash and excludes $7,285 spent on fees and slippage. |
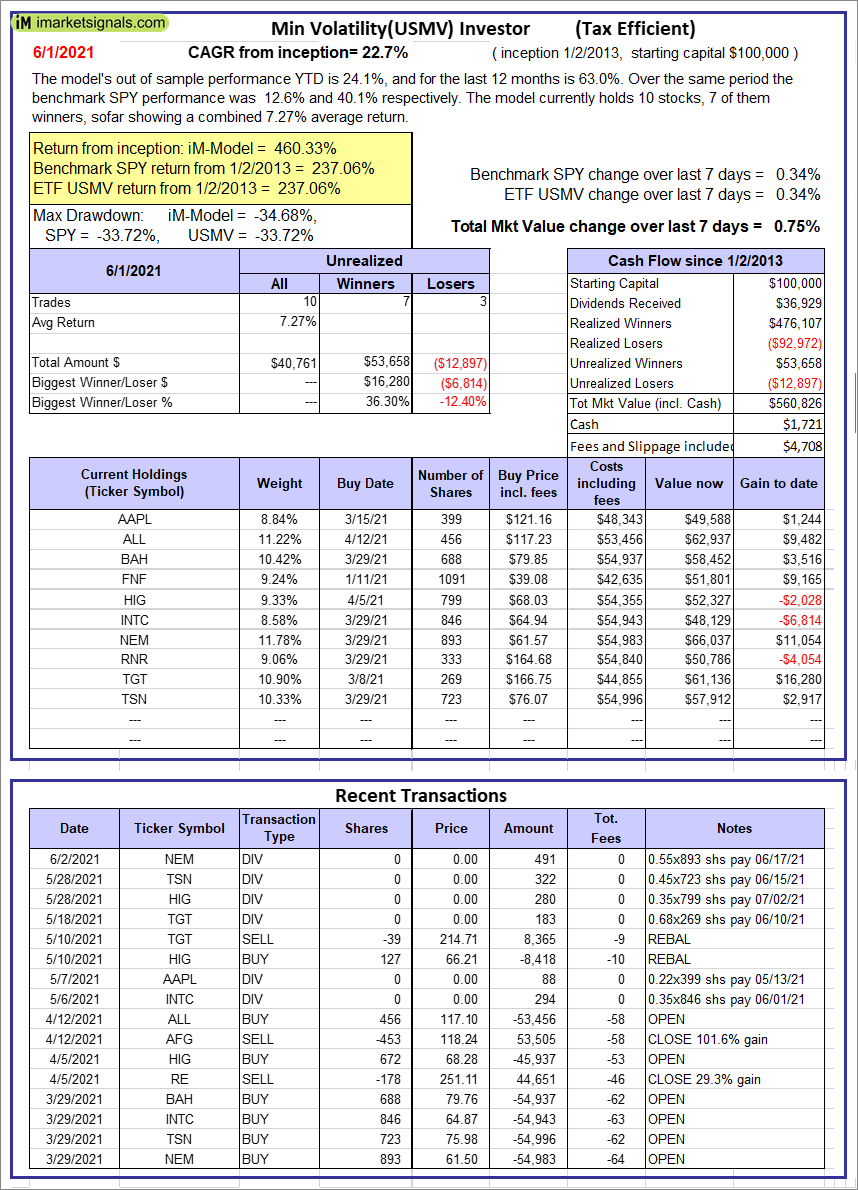 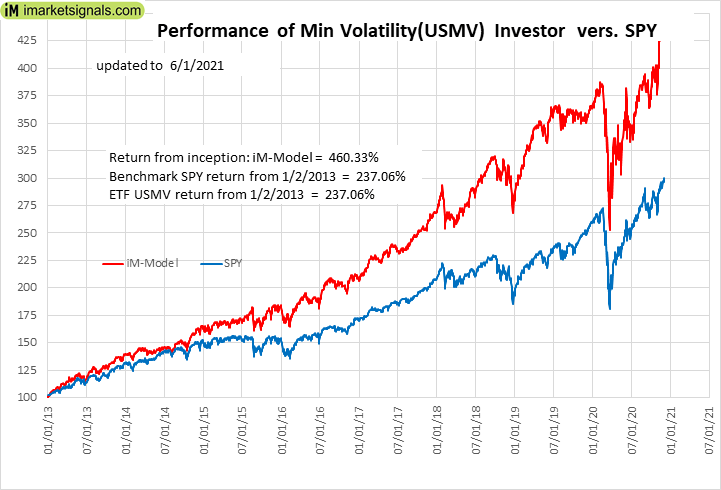 |
iM-Min Volatility(USMV) Investor (Tax Efficient): The model’s out of sample performance YTD is 24.1%, and for the last 12 months is 63.0%. Over the same period the benchmark SPY performance was 12.6% and 40.1% respectively. Since inception, on 1/3/2013, the model gained 460.33% while the benchmark SPY gained 237.06% and the ETF USMV gained 237.06% over the same period. Over the previous week the market value of iM-Best12(USMV)Q1 gained 0.75% at a time when SPY gained 0.34%. A starting capital of $100,000 at inception on 1/3/2013 would have grown to $560,826 which includes $1,721 cash and excludes $4,708 spent on fees and slippage. |
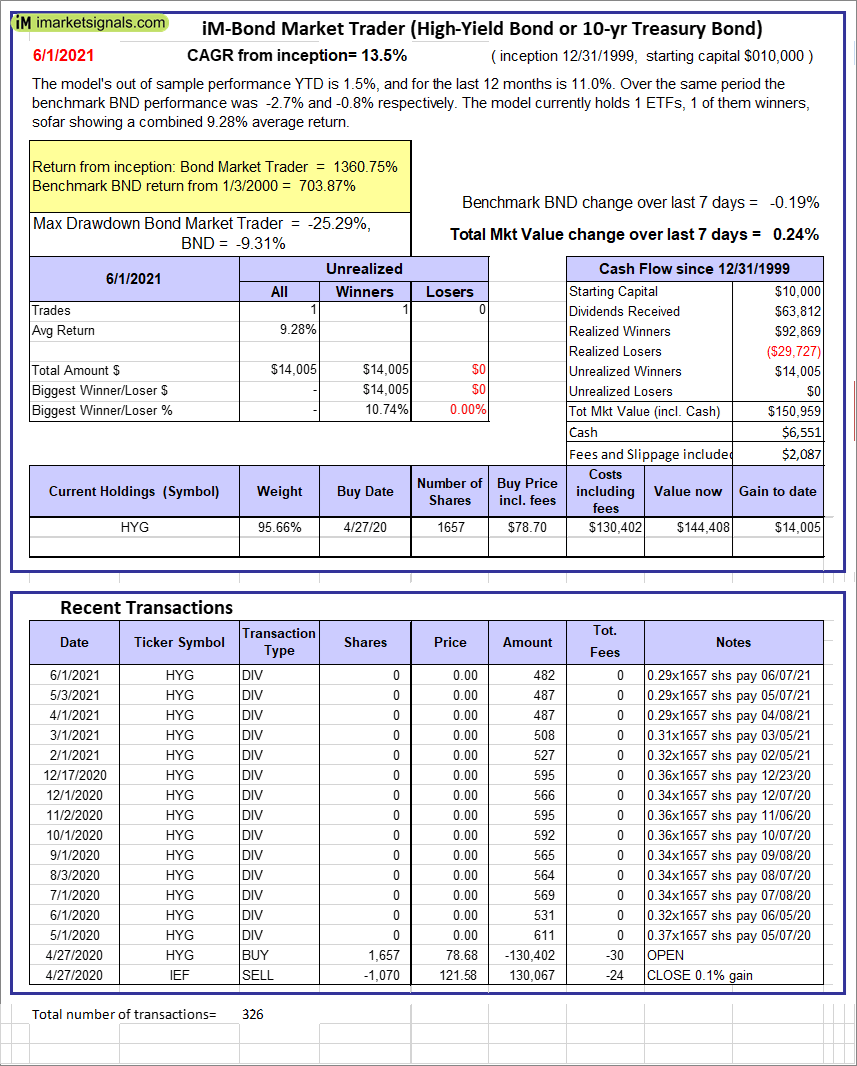 |
iM-Bond Market Trader (High-Yield Bond or 10-yr Treasury Bond): The model’s out of sample performance YTD is 1.5%, and for the last 12 months is 11.0%. Over the same period the benchmark BND performance was -2.7% and -0.8% respectively. Over the previous week the market value of the iM-Bond Market Trader (High-Yield Bond or 10-yr Treasury Bond) gained 0.24% at a time when BND gained -0.19%. A starting capital of $10,000 at inception on 1/3/2000 would have grown to $150,959 which includes $6,551 cash and excludes $2,087 spent on fees and slippage. |
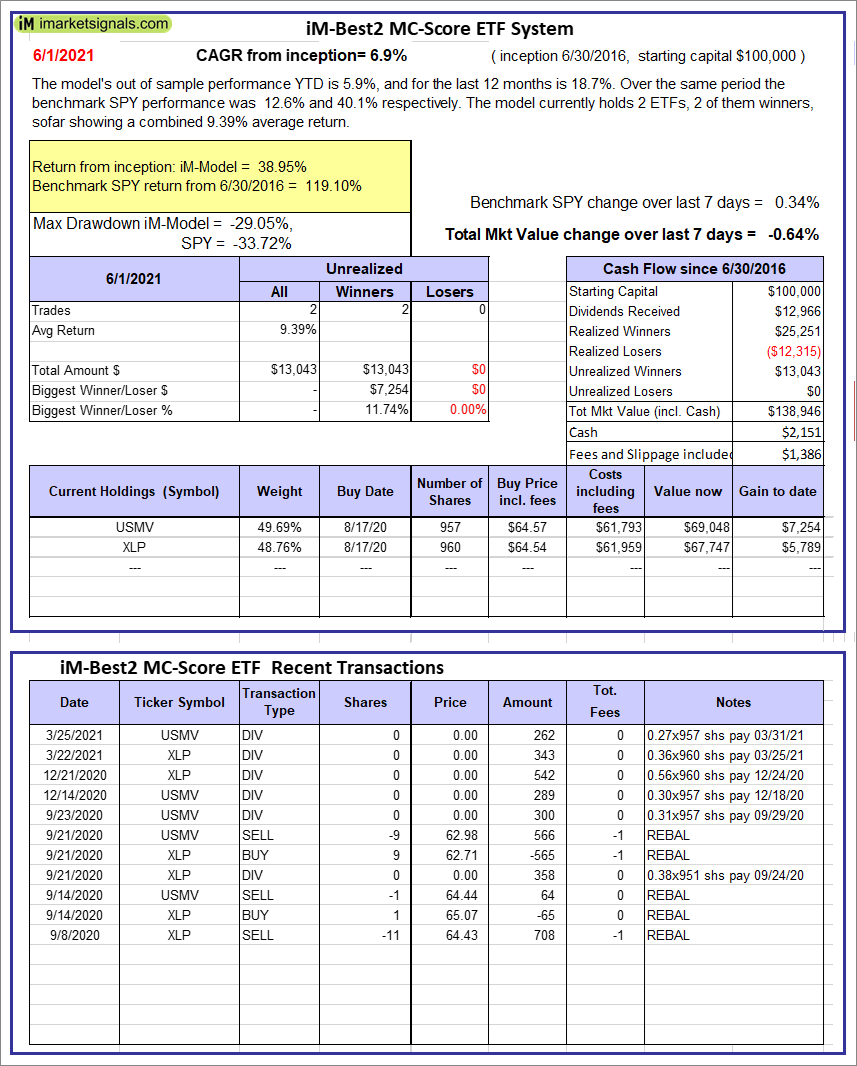 |
iM-Best2 MC-Score ETF System: The model’s out of sample performance YTD is 5.9%, and for the last 12 months is 18.7%. Over the same period the benchmark SPY performance was 12.6% and 40.1% respectively. Over the previous week the market value of the iM-Best2 MC-Score ETF System gained -0.64% at a time when SPY gained 0.34%. A starting capital of $100,000 at inception on 6/30/2016 would have grown to $138,946 which includes $2,151 cash and excludes $1,386 spent on fees and slippage. |
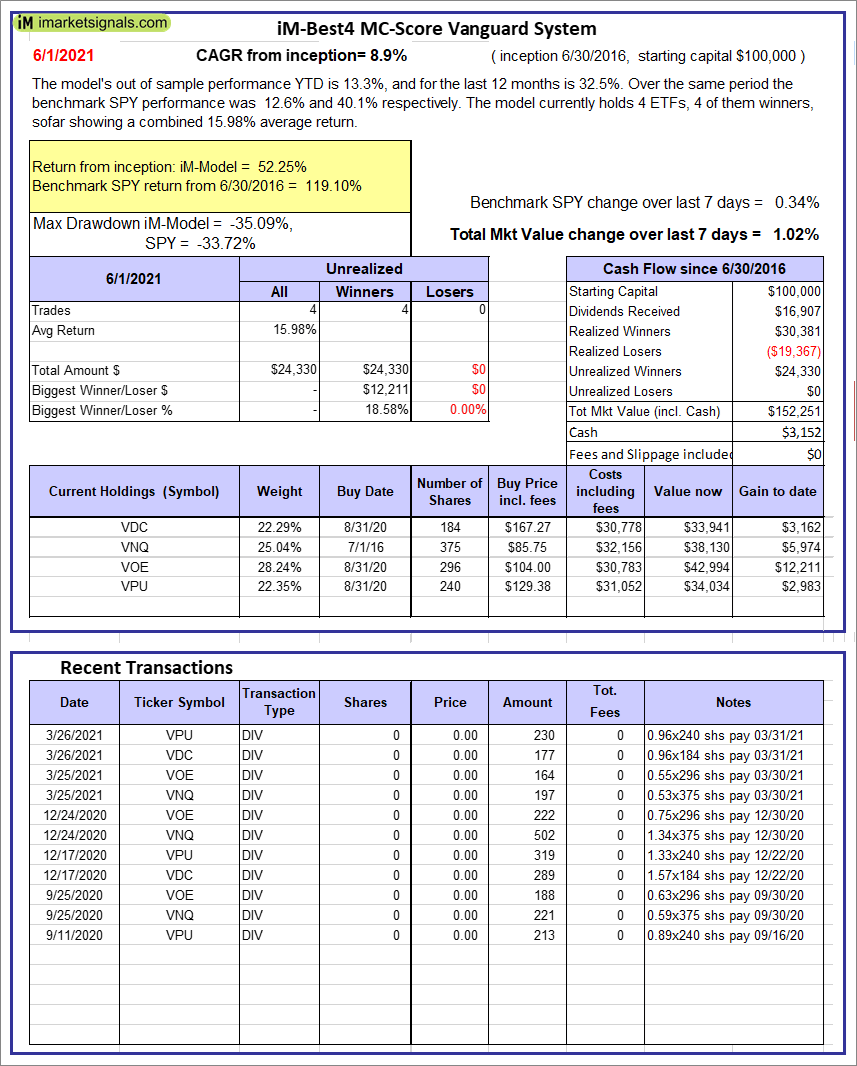 |
iM-Best4 MC-Score Vanguard System: The model’s out of sample performance YTD is 13.3%, and for the last 12 months is 32.5%. Over the same period the benchmark SPY performance was 12.6% and 40.1% respectively. Over the previous week the market value of the iM-Best4 MC-Score Vanguard System gained 1.02% at a time when SPY gained 0.34%. A starting capital of $100,000 at inception on 6/30/2016 would have grown to $152,251 which includes $3,152 cash and excludes $00 spent on fees and slippage. |
 |
iM-Composite (SPY-IEF) Timer: The model’s out of sample performance YTD is 12.5%, and for the last 12 months is 25.3%. Over the same period the benchmark SPY performance was 12.6% and 40.1% respectively. Over the previous week the market value of the iM-Composite (SPY-IEF) Timer gained 0.34% at a time when SPY gained 0.34%. A starting capital of $100,000 at inception on 6/30/2016 would have grown to $176,374 which includes $1,792 cash and excludes $3,984 spent on fees and slippage. |
 |
iM-Composite(Gold-Stocks-Bond) Timer: The model’s out of sample performance YTD is 8.2%, and for the last 12 months is 26.0%. Over the same period the benchmark SPY performance was 12.6% and 40.1% respectively. Over the previous week the market value of the iM-Composite(Gold-Stocks-Bond) Timer gained -0.01% at a time when SPY gained 0.34%. A starting capital of $100,000 at inception on 6/30/2016 would have grown to $179,937 which includes $9 cash and excludes $6,876 spent on fees and slippage. |
iM-Best Reports – 6/1/21
Posted in pmp SPY-SH
Leave a Reply
You must be logged in to post a comment.