  |
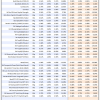
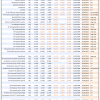
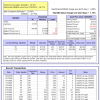
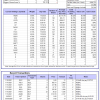
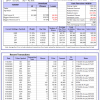
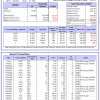
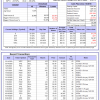
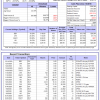
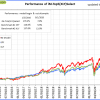
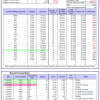
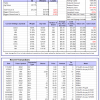
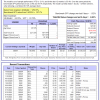
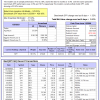
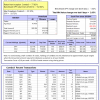
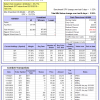
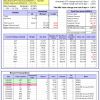
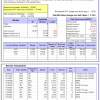
Out of sample performance summary of our models for the past 1, 2, 4 and 13 week periods. The active active return indicates how the models over- or underperformed the benchmark ETF SPY. Also the YTD, and the 1-, 3-, 5- and 10-year annualized returns are shown in the second table |
|
|
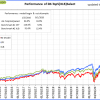
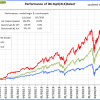
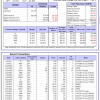
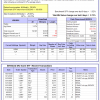
iM-FlipSaver 60:40 | 20:80 – 2017: The model’s out of sample performance YTD is 2.3%, and for the last 12 months is 7.2%. Over the same period the benchmark E60B40 performance was 1.4% and 15.0% respectively. Over the previous week the market value of iM-FlipSaver 80:20 | 20:80 gained 1.00% at a time when SPY gained 0.96%. A starting capital of $100,000 at inception on 7/16/2015 would have grown to $141,195 which includes $983 cash and excludes $1,783 spent on fees and slippage. |
|
|
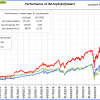
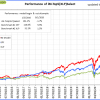
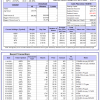
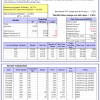
iM-FlipSaver 70:30 | 20:80 – 2017: The model’s out of sample performance YTD is 2.6%, and for the last 12 months is 6.5%. Over the same period the benchmark E60B40 performance was 1.4% and 15.0% respectively. Over the previous week the market value of iM-FlipSaver 70:30 | 20:80 gained 1.08% at a time when SPY gained 0.96%. A starting capital of $100,000 at inception on 7/15/2015 would have grown to $143,850 which includes $881 cash and excludes $1,918 spent on fees and slippage. |
|
|
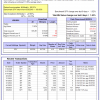
iM-FlipSaver 80:20 | 20:80 – 2017: The model’s out of sample performance YTD is 2.9%, and for the last 12 months is 5.8%. Over the same period the benchmark E60B40 performance was 1.4% and 15.0% respectively. Over the previous week the market value of iM-FlipSaver 80:20 | 20:80 gained 1.15% at a time when SPY gained 0.96%. A starting capital of $100,000 at inception on 1/2/2017 would have grown to $146,410 which includes $1,068 cash and excludes $2,045 spent on fees and slippage. |
|
|
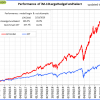
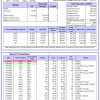
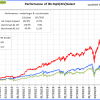
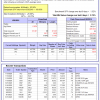
iM-5HedgeFundSelect: Since inception, on 1/5/2016, the model gained 418.94% while the benchmark SPY gained 107.66% over the same period. Over the previous week the market value of iM-5HedgeFundSelect gained 2.44% at a time when SPY gained 1.52%. A starting capital of $25,000 at inception on 1/5/2016 would have grown to $129,735 which includes $7,998 cash and excludes $1,216 spent on fees and slippage. |
|
|
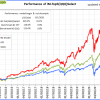
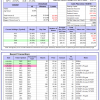
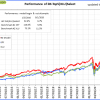
iM-10LargeHedgeFundSelect: Since inception, on 1/5/2016, the model gained 386.48% while the benchmark SPY gained 107.66% over the same period. Over the previous week the market value of iM-10LargeHedgeFundSelect gained 1.79% at a time when SPY gained 1.52%. A starting capital of $25,000 at inception on 1/5/2016 would have grown to $121,620 which includes $112 cash and excludes $718 spent on fees and slippage. |
|
|
iM-Top5(QQQ)Select: Since inception, on 1/5/2016, the model gained 429.67% while the benchmark SPY gained 107.66% over the same period. Over the previous week the market value of iM-Top5(QQQ)Select gained -0.31% at a time when SPY gained 1.52%. A starting capital of $100,000 at inception on 1/5/2016 would have grown to $529,668 which includes $443 cash and excludes $6,231 spent on fees and slippage. |
|
|
iM-Top5(XLB)Select: Since inception, on 1/5/2016, the model gained 83.84% while the benchmark SPY gained 107.66% over the same period. Over the previous week the market value of iM-Top5(XLB)Select gained -0.31% at a time when SPY gained 1.52%. A starting capital of $100,000 at inception on 1/5/2016 would have grown to $183,836 which includes -$893 cash and excludes $5,400 spent on fees and slippage. |
|
|
iM-Top5(XLI)Select: Since inception, on 1/5/2016, the model gained 210.92% while the benchmark SPY gained 107.66% over the same period. Over the previous week the market value of iM-Top5(XLI)Select gained -0.31% at a time when SPY gained 1.52%. A starting capital of $100,000 at inception on 1/5/2016 would have grown to $310,923 which includes $997 cash and excludes $3,244 spent on fees and slippage. |
|
|
iM-Top5(XLK)Select: Since inception, on 1/5/2016, the model gained 393.89% while the benchmark SPY gained 107.66% over the same period. Over the previous week the market value of iM-Top5(XLK)Select gained -0.31% at a time when SPY gained 1.52%. A starting capital of $100,000 at inception on 1/5/2016 would have grown to $493,886 which includes $1,611 cash and excludes $1,573 spent on fees and slippage. |
|
|
iM-Top5(XLP)Select: Since inception, on 1/5/2016, the model gained 160.85% while the benchmark SPY gained 107.66% over the same period. Over the previous week the market value of iM-Top5(XLP)Select gained 1.29% at a time when SPY gained 1.52%. A starting capital of $100,000 at inception on 1/5/2016 would have grown to $260,846 which includes $1,569 cash and excludes $1,132 spent on fees and slippage. |
|
|
iM-Top5(XLV)Select: Since inception, on 1/5/2016, the model gained 292.55% while the benchmark SPY gained 107.66% over the same period. Over the previous week the market value of iM-Top5(XLV)Select gained -0.31% at a time when SPY gained 1.52%. A starting capital of $100,000 at inception on 1/5/2016 would have grown to $392,553 which includes $2,311 cash and excludes $5,042 spent on fees and slippage. |
|
|
iM-Top5(XLU)Select: Since inception, on 1/5/2016, the model gained 92.19% while the benchmark SPY gained 107.66% over the same period. Over the previous week the market value of iM-Top5(XLU)Select gained -0.31% at a time when SPY gained 1.52%. A starting capital of $100,000 at inception on 1/5/2016 would have grown to $192,191 which includes $2,358 cash and excludes $6,620 spent on fees and slippage. |
|
|
iM-Top5(XLY)Select: Since inception, on 1/5/2016, the model gained 178.83% while the benchmark SPY gained 107.66% over the same period. Over the previous week the market value of iM-Top5(XLY)Select gained -0.31% at a time when SPY gained 1.52%. A starting capital of $100,000 at inception on 1/5/2016 would have grown to $278,833 which includes $924 cash and excludes $2,742 spent on fees and slippage. |
|
|
iM-Seasonal Super-Sectors (Top5 combo) : Since inception, on 11/17/2020, the model gained 5.51% while the benchmark SPY gained 7.80% over the same period. Over the previous week the market value of iM-Seasonal Super-Sectors (Top5 combo) gained 0.61% at a time when SPY gained 1.52%. A starting capital of $100,000 at inception on 11/17/2020 would have grown to $105,514 which includes $943 cash and excludes $00 spent on fees and slippage. |
|
|
iM-Dividend Growth Portfolio: The model’s out of sample performance YTD is 3.3%, and for the last 12 months is 37.9%. Over the same period the benchmark SPY performance was 2.8% and 19.1% respectively. Over the previous week the market value of the iM-Dividend Growth Portfolio gained -0.35% at a time when SPY gained 1.52%. A starting capital of $100,000 at inception on 6/30/2016 would have grown to $349,662 which includes $1,646 cash and excludes $6,000 spent on fees and slippage. |
|
|
iM-Gold Momentum Timer (AU, NEM, SBSW): The model’s out of sample performance YTD is -2.1%, and for the last 12 months is 55.4%. Over the same period the benchmark SPY performance was 2.8% and 19.1% respectively. Over the previous week the market value of iM-Gold Momentum Timer (AU, NEM, SBSW) gained -5.93% at a time when SPY gained 1.52%. A starting capital of $100,000 at inception on 6/30/2016 would have grown to $07 which includes $66,006 cash and excludes Gain to date spent on fees and slippage. |
|
|
iM-Best(SPY-SH).R1: The model’s out of sample performance YTD is 2.8%, and for the last 12 months is -5.9%. Over the same period the benchmark SPY performance was 2.8% and 19.1% respectively. Over the previous week the market value of Best(SPY-SH) gained 1.51% at a time when SPY gained 1.52%. A starting capital of $100,000 at inception on 1/2/2009 would have grown to $681,035 which includes $3,355 cash and excludes $25,118 spent on fees and slippage. |
|
|
iM-Combo3.R1: The model’s out of sample performance YTD is 3.7%, and for the last 12 months is -2.6%. Over the same period the benchmark SPY performance was 2.8% and 19.1% respectively. Over the previous week the market value of iM-Combo3.R1 gained 2.65% at a time when SPY gained 1.52%. A starting capital of $100,000 at inception on 2/3/2014 would have grown to $178,058 which includes $5,665 cash and excludes $6,682 spent on fees and slippage. |
|
|
iM-Combo5: The model’s out of sample performance YTD is 4.4%, and for the last 12 months is 16.0%. Over the same period the benchmark SPY performance was 2.8% and 19.1% respectively. Over the previous week the market value of iM-Combo5 gained 3.25% at a time when SPY gained 1.52%. A starting capital of $100,000 at inception on 2/22/2016 would have grown to $185,493 which includes $1,212 cash and excludes $0 spent on fees and slippage. |
|
|
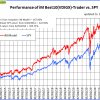
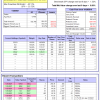
iM-Best10(VDIGX)-Trader: The model’s out of sample performance YTD is -1.0%, and for the last 12 months is 7.7%. Over the same period the benchmark SPY performance was 2.8% and 19.1% respectively. Since inception, on 7/1/2014, the model gained 167.93% while the benchmark SPY gained 122.92% and VDIGX gained 103.71% over the same period. Over the previous week the market value of iM-Best10(VDIGX) gained 0.61% at a time when SPY gained 1.52%. A starting capital of $100,000 at inception on 7/1/2014 would have grown to $267,934 which includes $150 cash and excludes $3,812 spent on fees and slippage. |
|
|
iM 6-Stock Capital Strength Portfolio: The model’s out of sample performance YTD is 0.8%, and for the last 12 months is 6.3%. Over the same period the benchmark SPY performance was 2.8% and 19.1% respectively. Over the previous week the market value of the iM 6-Stock Capital Strength Portfolio gained 0.89% at a time when SPY gained 1.52%. A starting capital of $100,000 at inception on 10/28/2016 would have grown to $189,677 which includes $133 cash and excludes $1,637 spent on fees and slippage. |
|
|
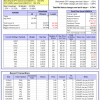
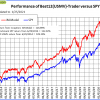
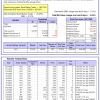
iM-Best12(USMV)-Trader: The model’s out of sample performance YTD is 1.2%, and for the last 12 months is -4.6%. Over the same period the benchmark SPY performance was 2.8% and 19.1% respectively. Since inception, on 6/30/2014, the model gained 126.89% while the benchmark SPY gained 122.92% and the ETF USMV gained 109.10% over the same period. Over the previous week the market value of iM-Best12(USMV)-Trader gained -0.74% at a time when SPY gained 1.52%. A starting capital of $100,000 at inception on 6/30/2014 would have grown to $226,890 which includes $2,883 cash and excludes $7,158 spent on fees and slippage. |
|
|
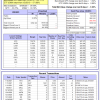
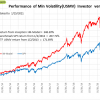
iM-Min Volatility(USMV) Investor (Tax Efficient): The model’s out of sample performance YTD is -0.7%, and for the last 12 months is 18.5%. Over the same period the benchmark SPY performance was 2.8% and 19.1% respectively. Since inception, on 1/3/2013, the model gained 348.30% while the benchmark SPY gained 207.71% and the ETF USMV gained 171.69% over the same period. Over the previous week the market value of iM-Best12(USMV)Q1 gained -1.00% at a time when SPY gained 1.52%. A starting capital of $100,000 at inception on 1/3/2013 would have grown to $448,297 which includes $491 cash and excludes $3,625 spent on fees and slippage. |
|
|
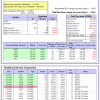
iM-Bond Market Trader (High-Yield Bond or 10-yr Treasury Bond): The model’s out of sample performance YTD is 0.0%, and for the last 12 months is -1.0%. Over the same period the benchmark BND performance was -0.7% and 5.6% respectively. Over the previous week the market value of the iM-Bond Market Trader (High-Yield Bond or 10-yr Treasury Bond) gained -0.04% at a time when BND gained 0.13%. A starting capital of $10,000 at inception on 1/3/2000 would have grown to $148,749 which includes $4,060 cash and excludes $2,087 spent on fees and slippage. |
|
|
iM-Best(Short): The model’s out of sample performance YTD is -4.4%, and for the last 12 months is -22.0%. Over the same period the benchmark SPY performance was 2.8% and 19.1% respectively. Over the previous week the market value of iM-Best(Short) gained -1.89% at a time when SPY gained 1.52%. Over the period 1/2/2009 to 1/25/2021 the starting capital of $100,000 would have grown to $62,795 which includes $124,167 cash and excludes $30,065 spent on fees and slippage. |
|
|
iM-Best2 MC-Score ETF System: The model’s out of sample performance YTD is -1.0%, and for the last 12 months is 1.2%. Over the same period the benchmark SPY performance was 2.8% and 19.1% respectively. Over the previous week the market value of the iM-Best2 MC-Score ETF System gained 0.73% at a time when SPY gained 1.52%. A starting capital of $100,000 at inception on 6/30/2016 would have grown to $129,943 which includes $1,546 cash and excludes $1,386 spent on fees and slippage. |
|
|
iM-Best4 MC-Score Vanguard System: The model’s out of sample performance YTD is 1.3%, and for the last 12 months is 3.6%. Over the same period the benchmark SPY performance was 2.8% and 19.1% respectively. Over the previous week the market value of the iM-Best4 MC-Score Vanguard System gained 0.99% at a time when SPY gained 1.52%. A starting capital of $100,000 at inception on 6/30/2016 would have grown to $136,174 which includes $2,385 cash and excludes $00 spent on fees and slippage. |
|
|
iM-Composite (SPY-IEF) Timer: The model’s out of sample performance YTD is 2.8%, and for the last 12 months is -3.4%. Over the same period the benchmark SPY performance was 2.8% and 19.1% respectively. Over the previous week the market value of the iM-Composite (SPY-IEF) Timer gained 1.50% at a time when SPY gained 1.52%. A starting capital of $100,000 at inception on 6/30/2016 would have grown to $161,166 which includes $1,260 cash and excludes $3,984 spent on fees and slippage. |
|
|
iM-Composite(Gold-Stocks-Bond) Timer: The model’s out of sample performance YTD is -2.2%, and for the last 12 months is 22.0%. Over the same period the benchmark SPY performance was 2.8% and 19.1% respectively. Over the previous week the market value of the iM-Composite(Gold-Stocks-Bond) Timer gained 0.75% at a time when SPY gained 1.52%. A starting capital of $100,000 at inception on 6/30/2016 would have grown to $162,564 which includes $13,893 cash and excludes $5,950 spent on fees and slippage. |
|
|
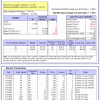
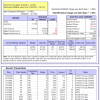
iM-Low Turnover Composite Timer Combo: The model’s out of sample performance YTD is 0.4%, and for the last 12 months is -3.0%. Over the same period the benchmark SPY performance was 2.8% and 19.1% respectively. Over the previous week the market value of the iM-Low Turnover Composite Timer Combo gained 0.18% at a time when SPY gained 1.52%. A starting capital of $100,000 at inception on 3/24/2017 would have grown to $110,981 which includes $2,594 cash and excludes $2,292 spent on fees and slippage. |


Leave a Reply
You must be logged in to post a comment.