  |
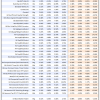
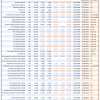
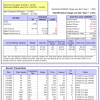
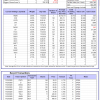
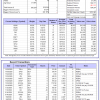
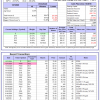
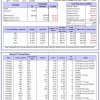
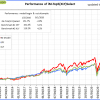
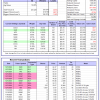
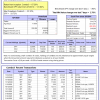
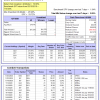
Out of sample performance summary of our models for the past 1, 2, 4 and 13 week periods. The active active return indicates how the models over- or underperformed the benchmark ETF SPY. Also the YTD, and the 1-, 3-, 5- and 10-year annualized returns are shown in the second table |
|
|
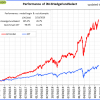
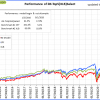
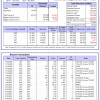
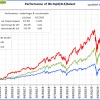
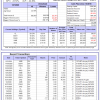
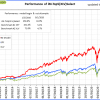
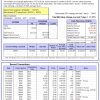
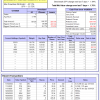
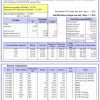
iM-FlipSaver 60:40 | 20:80 – 2017: The model’s out of sample performance YTD is 4.8%, and for the last 12 months is 6.6%. Over the same period the benchmark E60B40 performance was 14.0% and 15.6% respectively. Over the previous week the market value of iM-FlipSaver 80:20 | 20:80 gained 1.58% at a time when SPY gained 1.00%. A starting capital of $100,000 at inception on 7/16/2015 would have grown to $135,718 which includes $629 cash and excludes $1,783 spent on fees and slippage. |
|
|
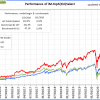
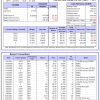
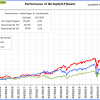
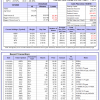
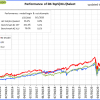
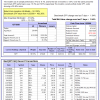
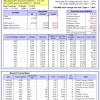
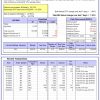
iM-FlipSaver 70:30 | 20:80 – 2017: The model’s out of sample performance YTD is 3.8%, and for the last 12 months is 5.8%. Over the same period the benchmark E60B40 performance was 14.0% and 15.6% respectively. Over the previous week the market value of iM-FlipSaver 70:30 | 20:80 gained 1.81% at a time when SPY gained 1.00%. A starting capital of $100,000 at inception on 7/15/2015 would have grown to $137,701 which includes $470 cash and excludes $1,918 spent on fees and slippage. |
|
|
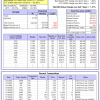
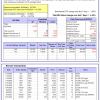
iM-FlipSaver 80:20 | 20:80 – 2017: The model’s out of sample performance YTD is 2.8%, and for the last 12 months is 5.0%. Over the same period the benchmark E60B40 performance was 14.0% and 15.6% respectively. Over the previous week the market value of iM-FlipSaver 80:20 | 20:80 gained 2.03% at a time when SPY gained 1.00%. A starting capital of $100,000 at inception on 1/2/2017 would have grown to $139,594 which includes $600 cash and excludes $2,045 spent on fees and slippage. |
|
|
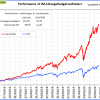
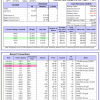
iM-5HedgeFundSelect: Since inception, on 1/5/2016, the model gained 385.21% while the benchmark SPY gained 98.55% over the same period. Over the previous week the market value of iM-5HedgeFundSelect gained 1.25% at a time when SPY gained 1.94%. A starting capital of $25,000 at inception on 1/5/2016 would have grown to $121,302 which includes $12,749 cash and excludes $1,202 spent on fees and slippage. |
|
|
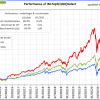
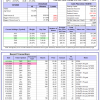
iM-10LargeHedgeFundSelect: Since inception, on 1/5/2016, the model gained 353.45% while the benchmark SPY gained 98.55% over the same period. Over the previous week the market value of iM-10LargeHedgeFundSelect gained -0.33% at a time when SPY gained 1.94%. A starting capital of $25,000 at inception on 1/5/2016 would have grown to $113,363 which includes $103 cash and excludes $707 spent on fees and slippage. |
|
|
iM-Top5(QQQ)Select: Since inception, on 1/5/2016, the model gained 383.31% while the benchmark SPY gained 98.55% over the same period. Over the previous week the market value of iM-Top5(QQQ)Select gained 7.62% at a time when SPY gained 1.94%. A starting capital of $100,000 at inception on 1/5/2016 would have grown to $483,567 which includes $1,099 cash and excludes $6,189 spent on fees and slippage. |
|
|
iM-Top5(XLB)Select: Since inception, on 1/5/2016, the model gained 81.32% while the benchmark SPY gained 98.55% over the same period. Over the previous week the market value of iM-Top5(XLB)Select gained 7.62% at a time when SPY gained 1.94%. A starting capital of $100,000 at inception on 1/5/2016 would have grown to $181,321 which includes -$294 cash and excludes $5,141 spent on fees and slippage. |
|
|
iM-Top5(XLI)Select: Since inception, on 1/5/2016, the model gained 210.19% while the benchmark SPY gained 98.55% over the same period. Over the previous week the market value of iM-Top5(XLI)Select gained 7.62% at a time when SPY gained 1.94%. A starting capital of $100,000 at inception on 1/5/2016 would have grown to $310,191 which includes $1,930 cash and excludes $3,242 spent on fees and slippage. |
|
|
iM-Top5(XLK)Select: Since inception, on 1/5/2016, the model gained 371.24% while the benchmark SPY gained 98.55% over the same period. Over the previous week the market value of iM-Top5(XLK)Select gained 7.62% at a time when SPY gained 1.94%. A starting capital of $100,000 at inception on 1/5/2016 would have grown to $471,484 which includes $900 cash and excludes $1,539 spent on fees and slippage. |
|
|
iM-Top5(XLP)Select: Since inception, on 1/5/2016, the model gained 154.07% while the benchmark SPY gained 98.55% over the same period. Over the previous week the market value of iM-Top5(XLP)Select gained -0.89% at a time when SPY gained 1.94%. A starting capital of $100,000 at inception on 1/5/2016 would have grown to $254,071 which includes $1,258 cash and excludes $1,014 spent on fees and slippage. |
|
|
iM-Top5(XLV)Select: Since inception, on 1/5/2016, the model gained 258.19% while the benchmark SPY gained 98.55% over the same period. Over the previous week the market value of iM-Top5(XLV)Select gained 7.62% at a time when SPY gained 1.94%. A starting capital of $100,000 at inception on 1/5/2016 would have grown to $358,190 which includes $706 cash and excludes $5,042 spent on fees and slippage. |
|
|
iM-Top5(XLU)Select: Since inception, on 1/5/2016, the model gained 96.00% while the benchmark SPY gained 98.55% over the same period. Over the previous week the market value of iM-Top5(XLU)Select gained 7.62% at a time when SPY gained 1.94%. A starting capital of $100,000 at inception on 1/5/2016 would have grown to $195,999 which includes $394 cash and excludes $6,534 spent on fees and slippage. |
|
|
iM-Top5(XLY)Select: Since inception, on 1/5/2016, the model gained 151.41% while the benchmark SPY gained 98.55% over the same period. Over the previous week the market value of iM-Top5(XLY)Select gained 7.62% at a time when SPY gained 1.94%. A starting capital of $100,000 at inception on 1/5/2016 would have grown to $251,410 which includes $664 cash and excludes $2,742 spent on fees and slippage. |
|
|
iM-Dividend Growth Portfolio: The model’s out of sample performance YTD is 33.1%, and for the last 12 months is 37.5%. Over the same period the benchmark SPY performance was 16.3% and 19.5% respectively. Over the previous week the market value of the iM-Dividend Growth Portfolio gained 2.96% at a time when SPY gained 1.94%. A starting capital of $100,000 at inception on 6/30/2016 would have grown to $335,357 which includes $1,892 cash and excludes $5,896 spent on fees and slippage. |
|
|
iM-Gold Momentum Timer (AU, NEM, SBSW): The model’s out of sample performance YTD is 59.3%, and for the last 12 months is 92.0%. Over the same period the benchmark SPY performance was 16.3% and 19.5% respectively. Over the previous week the market value of iM-Gold Momentum Timer (AU, NEM, SBSW) gained 11.37% at a time when SPY gained 1.94%. A starting capital of $100,000 at inception on 6/30/2016 would have grown to $07 which includes $66,006 cash and excludes Gain to date spent on fees and slippage. |
|
|
iM-Best(SPY-SH).R1: The model’s out of sample performance YTD is -8.1%, and for the last 12 months is -5.6%. Over the same period the benchmark SPY performance was 16.3% and 19.5% respectively. Over the previous week the market value of Best(SPY-SH) gained 1.94% at a time when SPY gained 1.94%. A starting capital of $100,000 at inception on 1/2/2009 would have grown to $651,276 which includes $570 cash and excludes $25,118 spent on fees and slippage. |
|
|
iM-Combo3.R1: The model’s out of sample performance YTD is -5.5%, and for the last 12 months is -3.9%. Over the same period the benchmark SPY performance was 16.3% and 19.5% respectively. Over the previous week the market value of iM-Combo3.R1 gained 2.70% at a time when SPY gained 1.94%. A starting capital of $100,000 at inception on 2/3/2014 would have grown to $167,259 which includes $3,099 cash and excludes $6,679 spent on fees and slippage. |
|
|
iM-Combo5: The model’s out of sample performance YTD is 12.1%, and for the last 12 months is 14.9%. Over the same period the benchmark SPY performance was 16.3% and 19.5% respectively. Over the previous week the market value of iM-Combo5 gained 3.09% at a time when SPY gained 1.94%. A starting capital of $100,000 at inception on 2/22/2016 would have grown to $172,683 which includes $1,132 cash and excludes $0 spent on fees and slippage. |
|
|
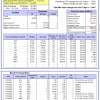
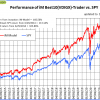
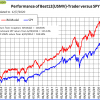
iM-Best10(VDIGX)-Trader: The model’s out of sample performance YTD is 8.9%, and for the last 12 months is 11.5%. Over the same period the benchmark SPY performance was 16.3% and 19.5% respectively. Since inception, on 7/1/2014, the model gained 166.56% while the benchmark SPY gained 113.14% and VDIGX gained 103.86% over the same period. Over the previous week the market value of iM-Best10(VDIGX) gained 0.44% at a time when SPY gained 1.94%. A starting capital of $100,000 at inception on 7/1/2014 would have grown to $266,559 which includes $1,130 cash and excludes $3,800 spent on fees and slippage. |
|
|
iM 6-Stock Capital Strength Portfolio: The model’s out of sample performance YTD is 4.6%, and for the last 12 months is 8.3%. Over the same period the benchmark SPY performance was 16.3% and 19.5% respectively. Over the previous week the market value of the iM 6-Stock Capital Strength Portfolio gained 1.70% at a time when SPY gained 1.94%. A starting capital of $100,000 at inception on 10/28/2016 would have grown to $185,782 which includes $31,382 cash and excludes $1,592 spent on fees and slippage. |
|
|
iM-Best12(USMV)-Trader: The model’s out of sample performance YTD is -6.8%, and for the last 12 months is -4.1%. Over the same period the benchmark SPY performance was 16.3% and 19.5% respectively. Since inception, on 6/30/2014, the model gained 118.81% while the benchmark SPY gained 113.14% and the ETF USMV gained 104.59% over the same period. Over the previous week the market value of iM-Best12(USMV)-Trader gained 2.65% at a time when SPY gained 1.94%. A starting capital of $100,000 at inception on 6/30/2014 would have grown to $218,813 which includes $665 cash and excludes $7,158 spent on fees and slippage. |
|
|
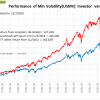
iM-Min Volatility(USMV) Investor (Tax Efficient): The model’s out of sample performance YTD is 20.0%, and for the last 12 months is 22.7%. Over the same period the benchmark SPY performance was 16.3% and 19.5% respectively. Since inception, on 1/3/2013, the model gained 337.14% while the benchmark SPY gained 194.22% and the ETF USMV gained 165.82% over the same period. Over the previous week the market value of iM-Best12(USMV)Q1 gained 1.31% at a time when SPY gained 1.94%. A starting capital of $100,000 at inception on 1/3/2013 would have grown to $437,143 which includes $1,288 cash and excludes $3,529 spent on fees and slippage. |
|
|
iM-Bond Market Trader (High-Yield Bond or 10-yr Treasury Bond): The model’s out of sample performance YTD is -36.6%, and for the last 12 months is -32.3%. Over the same period the benchmark SPY performance was 3.0% and 11.7% respectively. Over the previous week the market value of the iM-Bond Market Trader (High-Yield Bond or 10-yr Treasury Bond) gained 0.94% at a time when BND gained -0.40%. A starting capital of $100,000 at inception on 10/30/2016 would have grown to $147,309 which includes $3,465 cash and excludes $2,087 spent on fees and slippage. |
|
|
iM-Best(Short): The model’s out of sample performance YTD is -17.9%, and for the last 12 months is -19.1%. Over the same period the benchmark SPY performance was 16.3% and 19.5% respectively. Over the previous week the market value of iM-Best(Short) gained -4.40% at a time when SPY gained 1.94%. Over the period 1/2/2009 to 12/7/2020 the starting capital of $100,000 would have grown to $66,019 which includes $91,883 cash and excludes $29,493 spent on fees and slippage. |
|
|
iM-Best2 MC-Score ETF System: The model’s out of sample performance YTD is 3.1%, and for the last 12 months is 4.6%. Over the same period the benchmark SPY performance was 16.3% and 19.5% respectively. Over the previous week the market value of the iM-Best2 MC-Score ETF System gained 0.66% at a time when SPY gained 1.94%. A starting capital of $100,000 at inception on 6/30/2016 would have grown to $129,576 which includes $715 cash and excludes $1,386 spent on fees and slippage. |
|
|
iM-Best4 MC-Score Vanguard System: The model’s out of sample performance YTD is 2.7%, and for the last 12 months is 4.7%. Over the same period the benchmark SPY performance was 16.3% and 19.5% respectively. Over the previous week the market value of the iM-Best4 MC-Score Vanguard System gained 1.40% at a time when SPY gained 1.94%. A starting capital of $100,000 at inception on 6/30/2016 would have grown to $133,233 which includes $1,053 cash and excludes $00 spent on fees and slippage. |
|
|
iM-Composite (SPY-IEF) Timer: The model’s out of sample performance YTD is -5.6%, and for the last 12 months is -3.1%. Over the same period the benchmark SPY performance was 16.3% and 19.5% respectively. Over the previous week the market value of the iM-Composite (SPY-IEF) Timer gained 1.93% at a time when SPY gained 1.94%. A starting capital of $100,000 at inception on 6/30/2016 would have grown to $154,144 which includes $603 cash and excludes $3,984 spent on fees and slippage. |
|
|
iM-Composite(Gold-Stocks-Bond) Timer: The model’s out of sample performance YTD is 25.4%, and for the last 12 months is 27.6%. Over the same period the benchmark SPY performance was 16.3% and 19.5% respectively. Over the previous week the market value of the iM-Composite(Gold-Stocks-Bond) Timer gained 4.45% at a time when SPY gained 1.94%. A starting capital of $100,000 at inception on 6/30/2016 would have grown to $163,259 which includes $13,893 cash and excludes $5,950 spent on fees and slippage. |
|
|
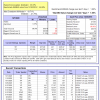
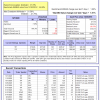
iM-Low Turnover Composite Timer Combo: The model’s out of sample performance YTD is -3.0%, and for the last 12 months is -1.4%. Over the same period the benchmark SPY performance was 16.3% and 19.5% respectively. Over the previous week the market value of the iM-Low Turnover Composite Timer Combo gained 2.57% at a time when SPY gained 1.94%. A starting capital of $100,000 at inception on 3/24/2017 would have grown to $109,229 which includes $2,295 cash and excludes $2,292 spent on fees and slippage. |


Leave a Reply
You must be logged in to post a comment.