  |
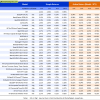
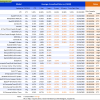
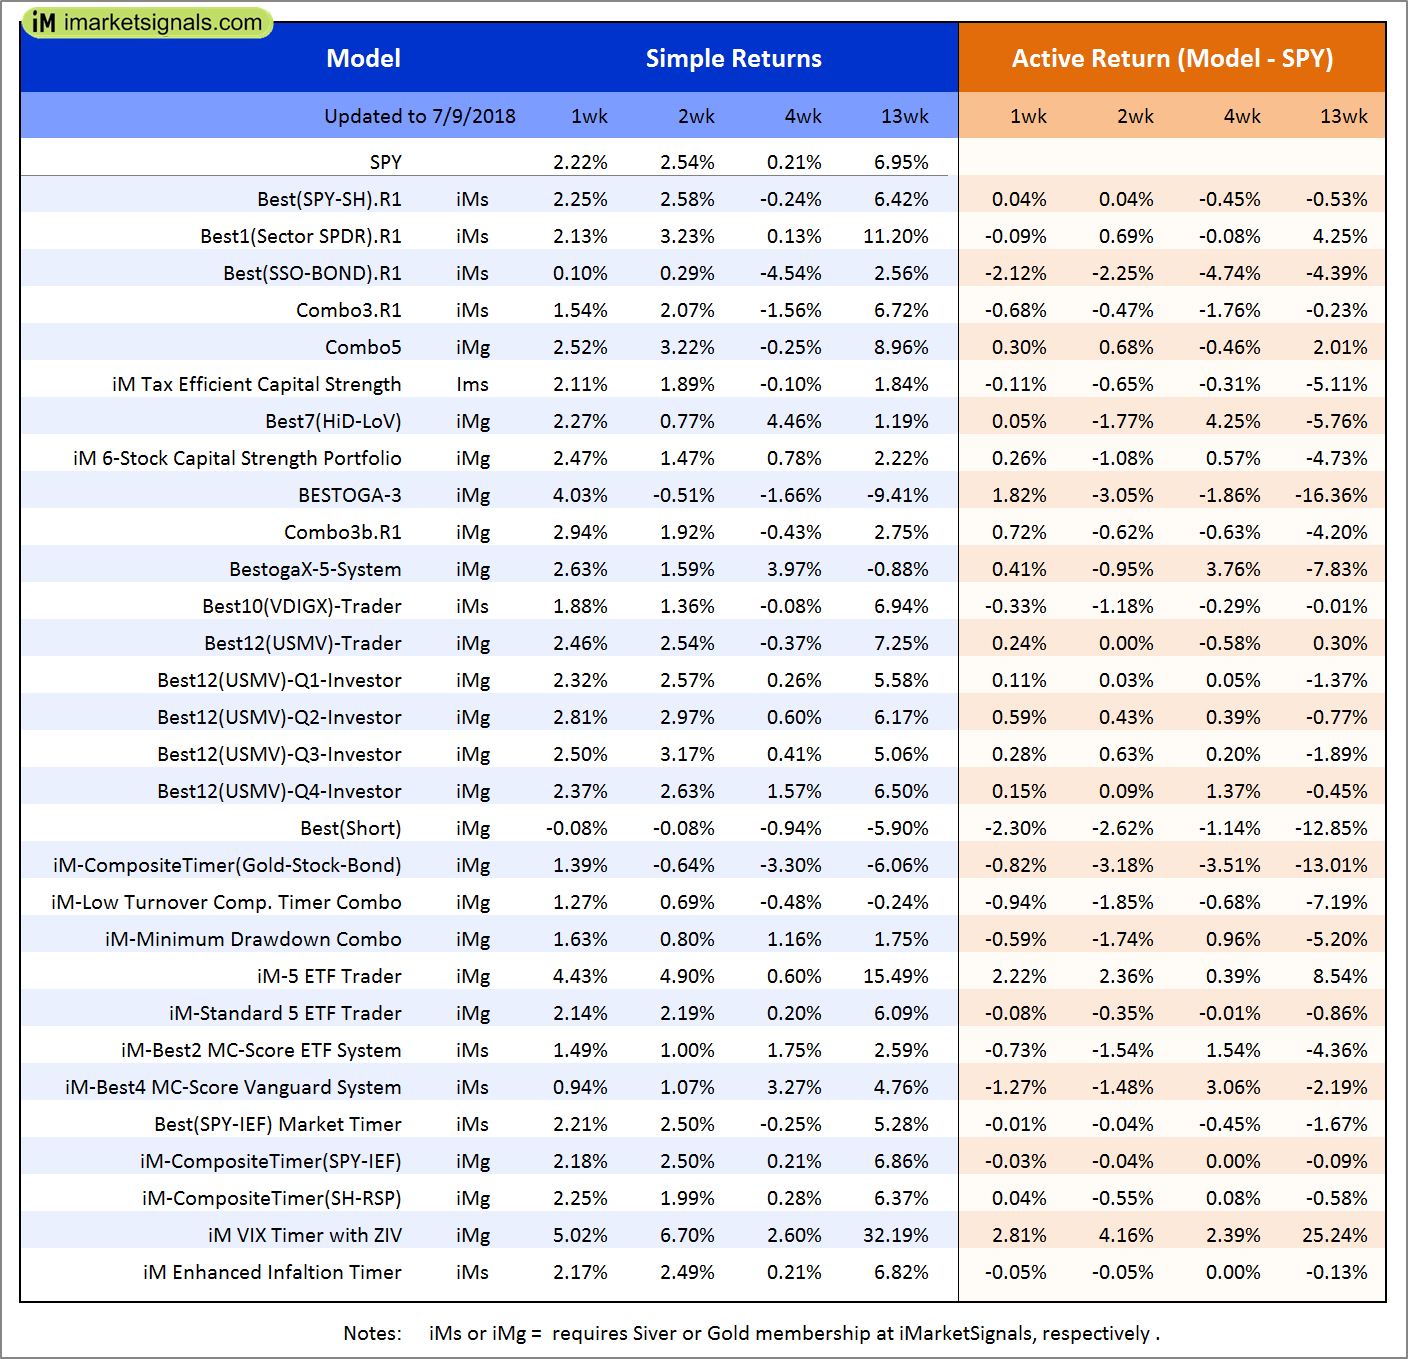
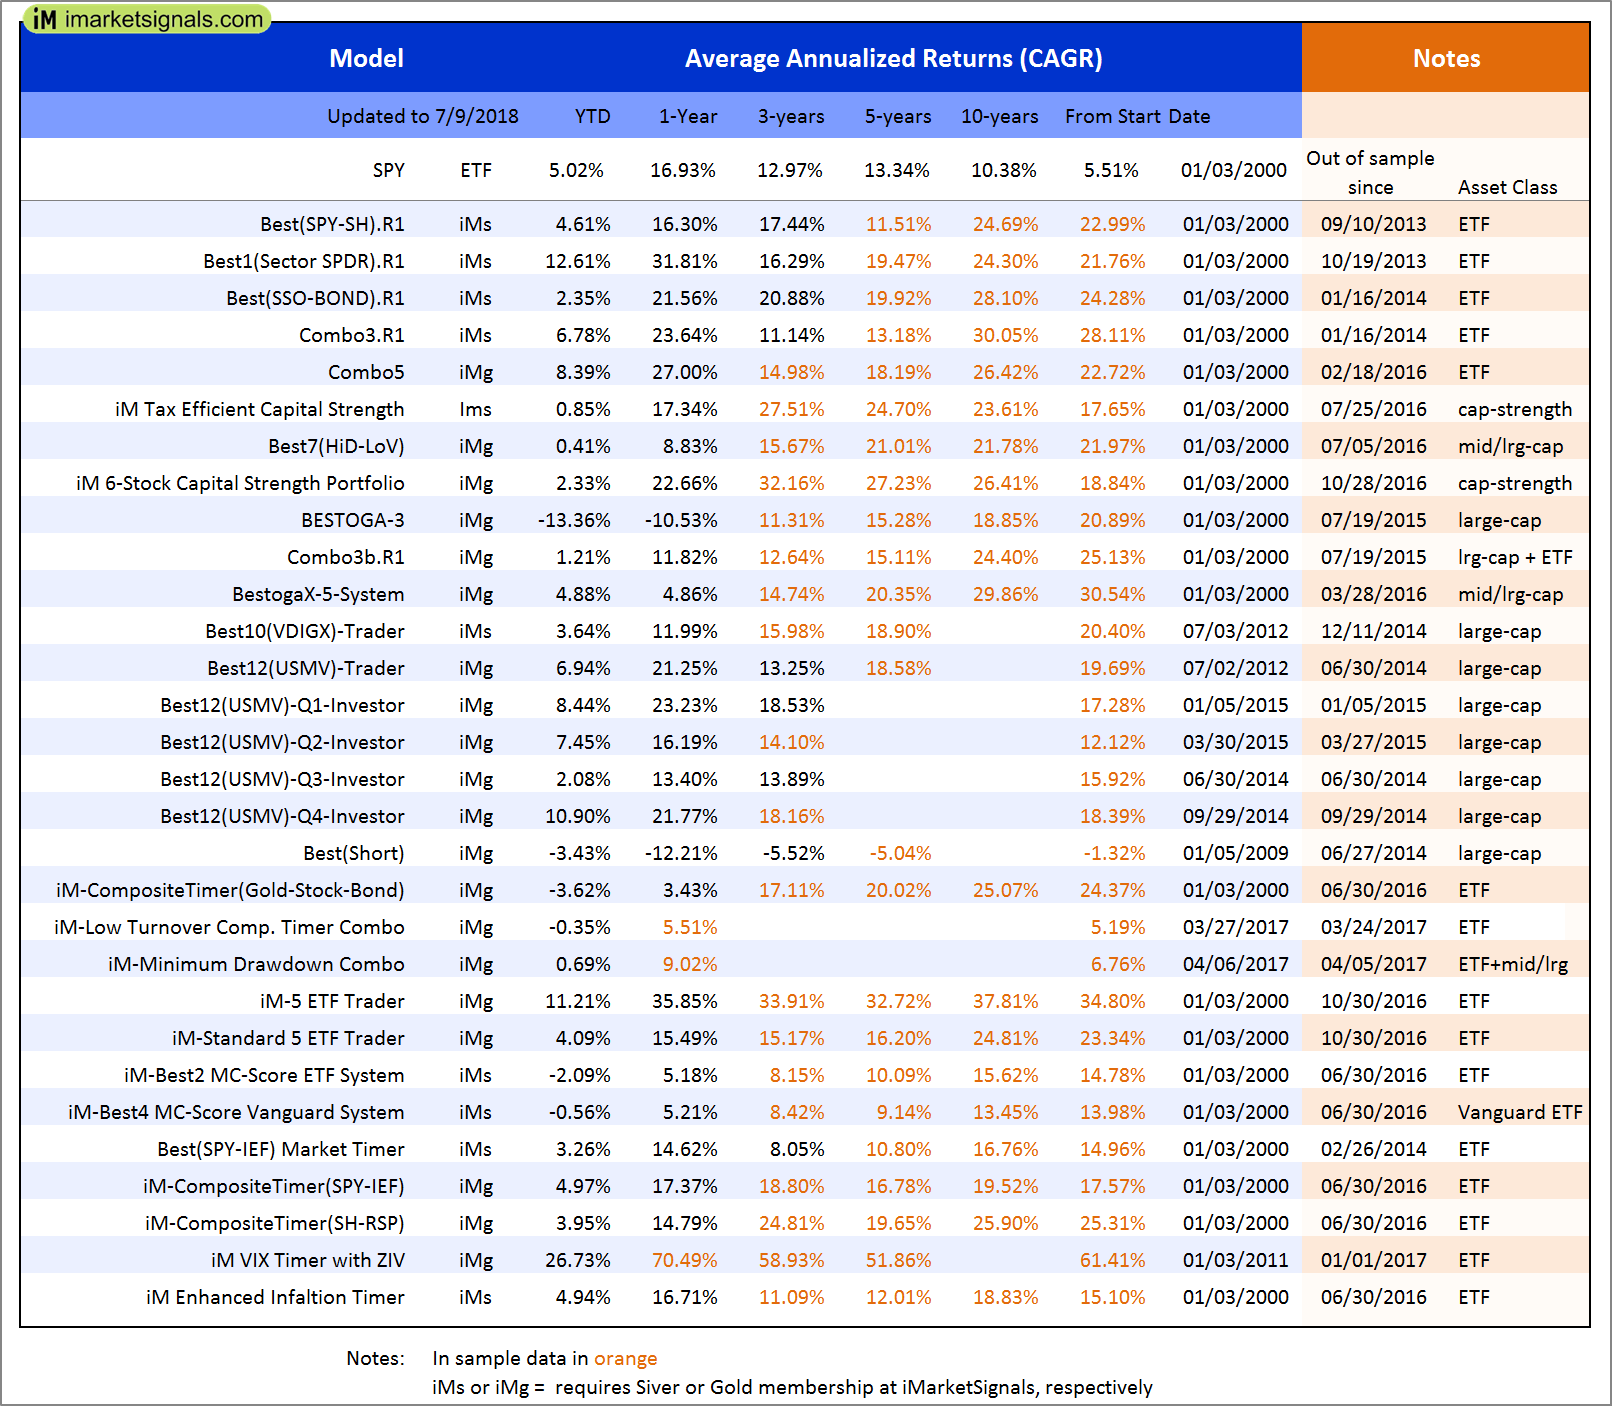
Out of sample performance summary of our models for the past 1, 2, 4 and 13 week periods. The active active return indicates how the models over- or underperformed the benchmark ETF SPY. Also the YTD, and the 1-, 3-, 5- and 10-year annualized returns are shown in the second table |
|
|
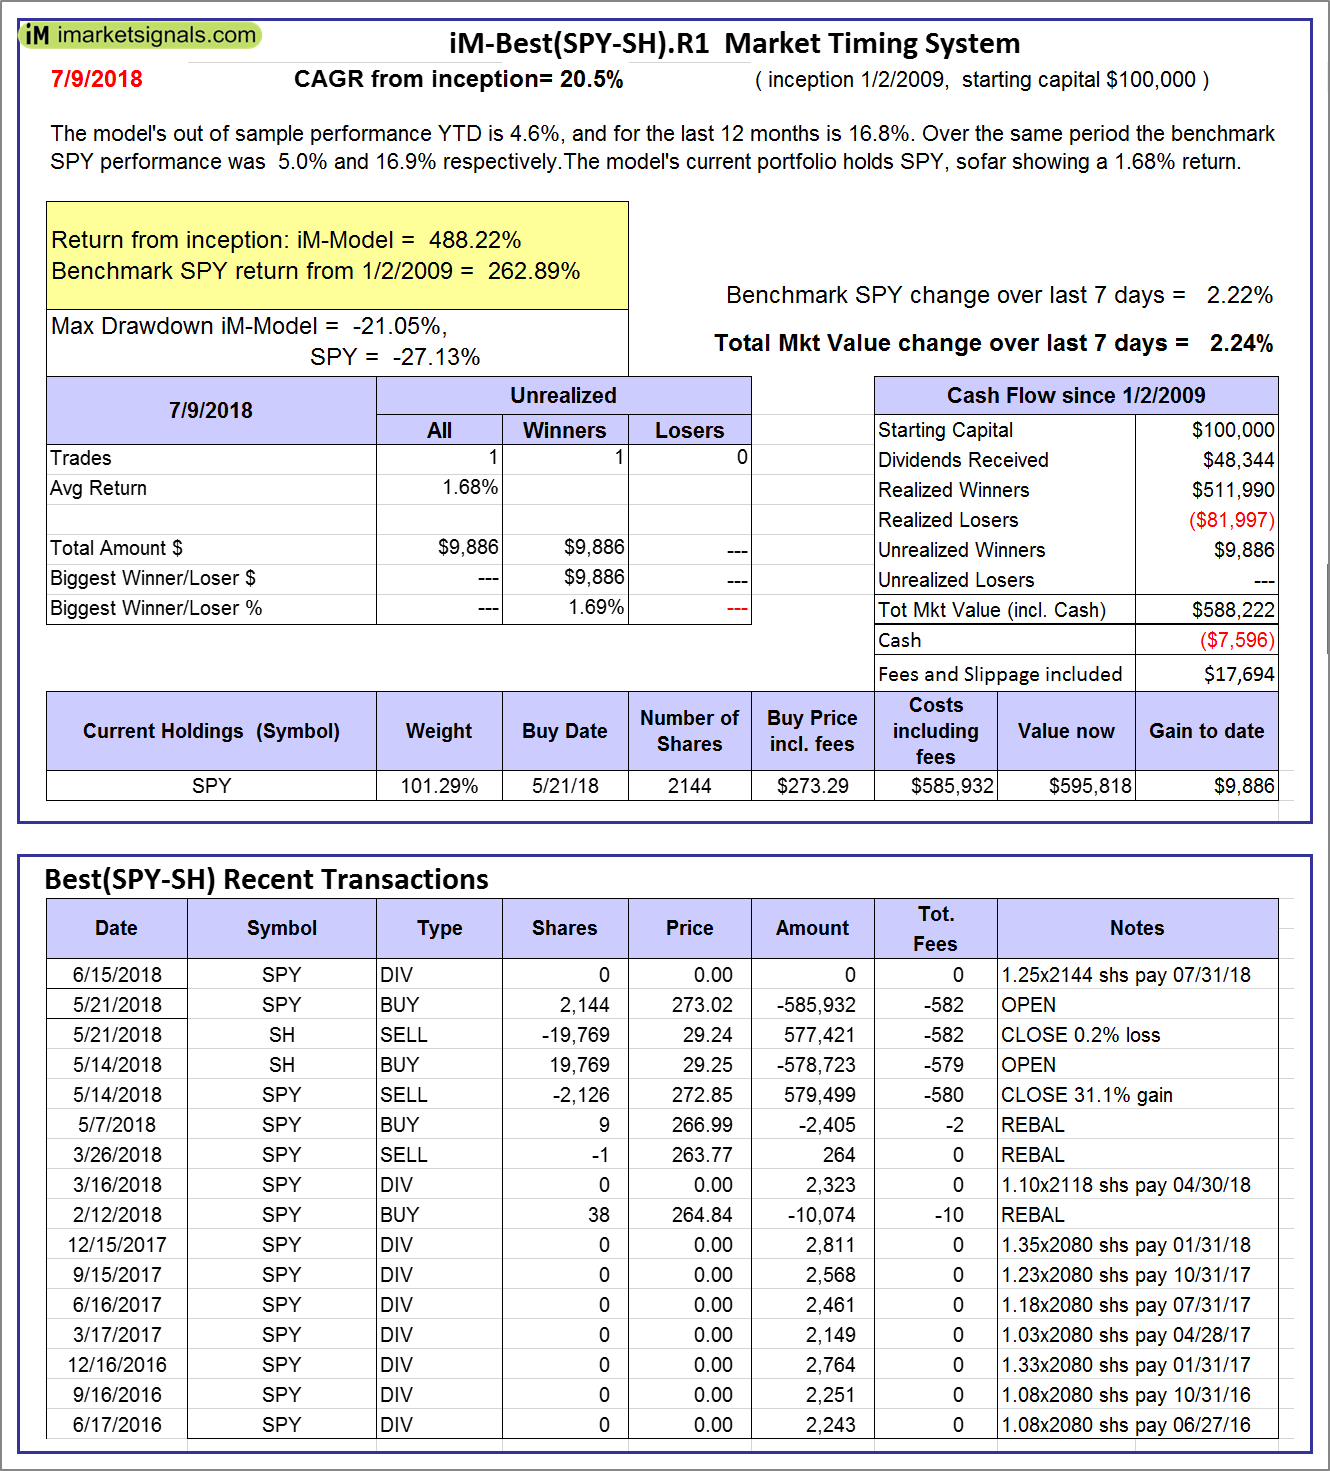
iM-Best(SPY-SH).R1: The model’s out of sample performance YTD is 4.6%, and for the last 12 months is 16.8%. Over the same period the benchmark SPY performance was 5.0% and 16.9% respectively. Over the previous week the market value of Best(SPY-SH) gained 2.24% at a time when SPY gained 2.22%. A starting capital of $100,000 at inception on 1/2/2009 would have grown to $588,222 which includes -$7,596 cash and excludes $17,694 spent on fees and slippage. |
|
|
iM-Combo3.R1: The model’s out of sample performance YTD is 6.7%, and for the last 12 months is 23.8%. Over the same period the benchmark SPY performance was 5.0% and 16.9% respectively. Over the previous week the market value of iM-Combo3.R1 gained 1.47% at a time when SPY gained 2.22%. A starting capital of $100,000 at inception on 2/3/2014 would have grown to $168,362 which includes $331 cash and excludes $4,006 spent on fees and slippage. |
|
|
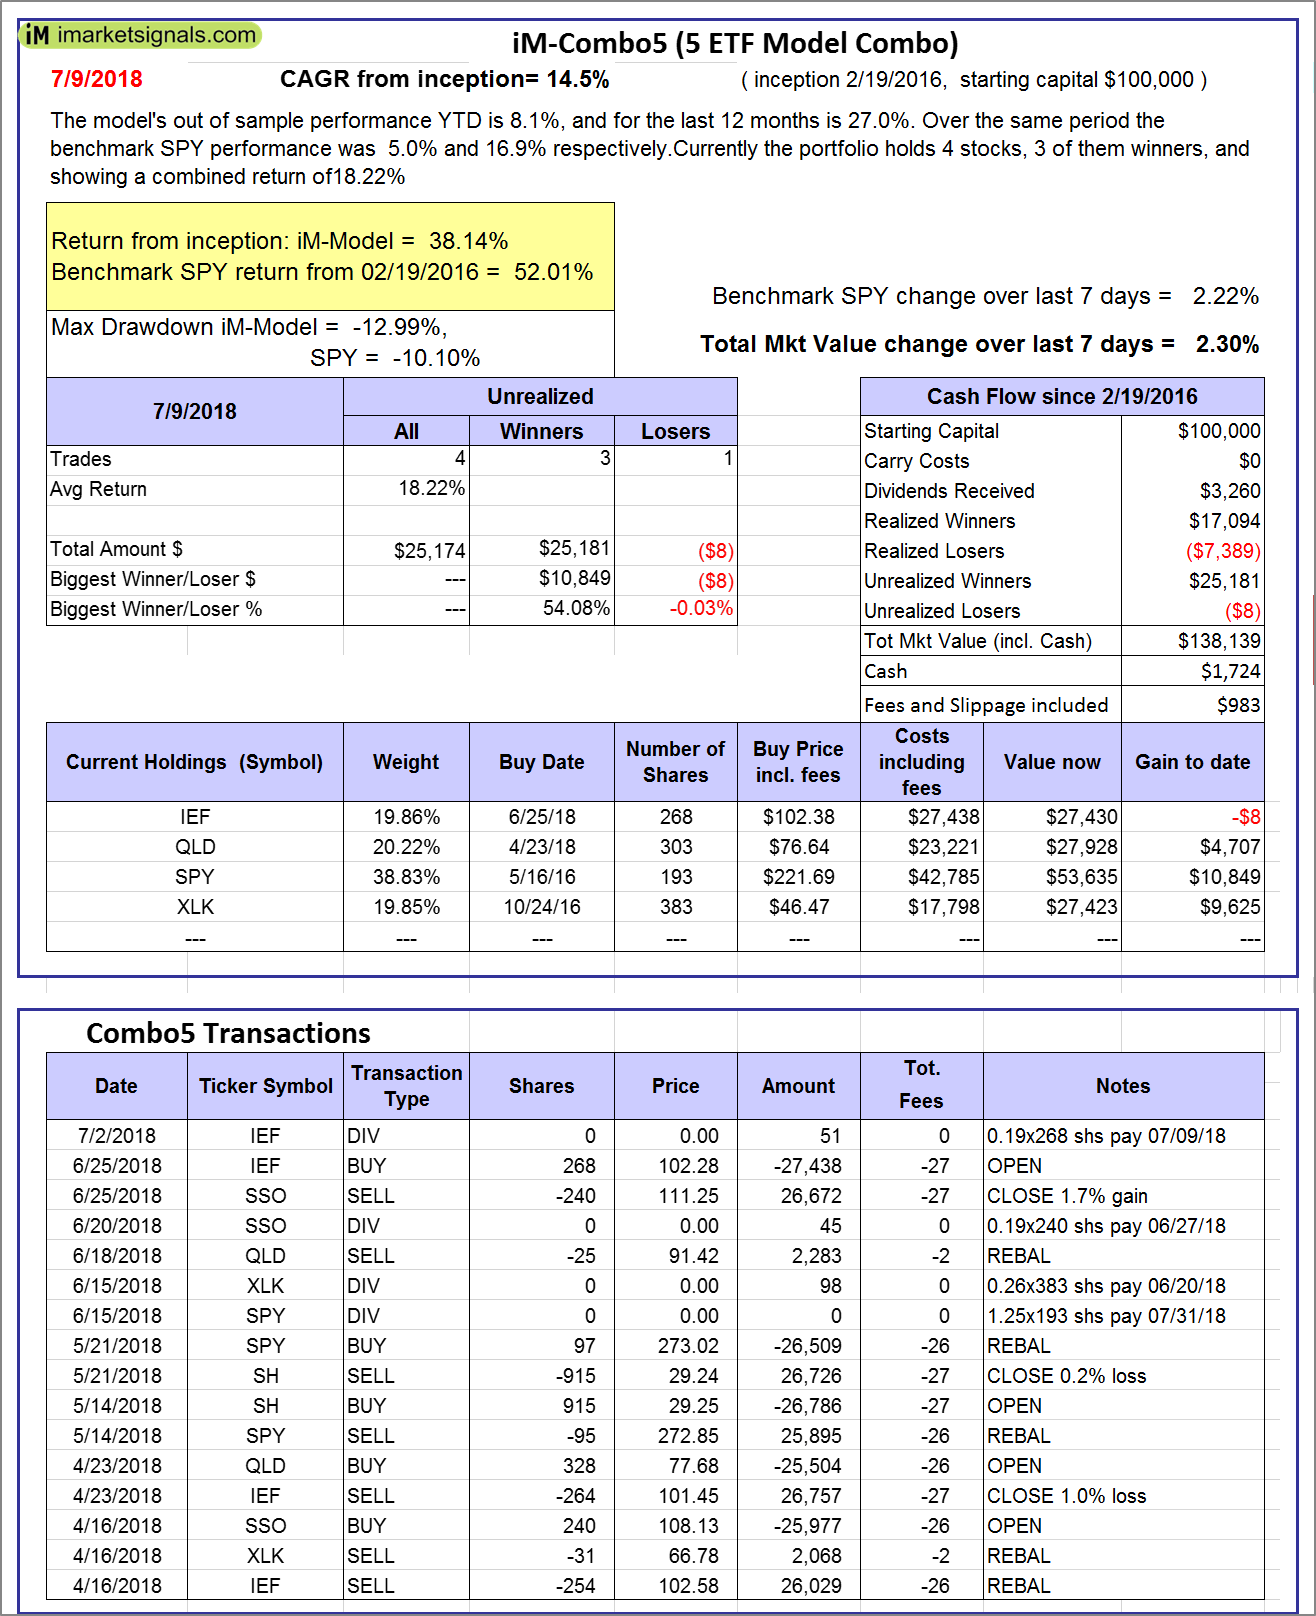
iM-Combo5: The model’s out of sample performance YTD is 8.1%, and for the last 12 months is 27.0%. Over the same period the benchmark SPY performance was 5.0% and 16.9% respectively. Over the previous week the market value of iM-Combo5 gained 2.30% at a time when SPY gained 2.22%. A starting capital of $100,000 at inception on 2/22/2016 would have grown to $138,139 which includes $1,724 cash and excludes $983 spent on fees and slippage. |
|
|
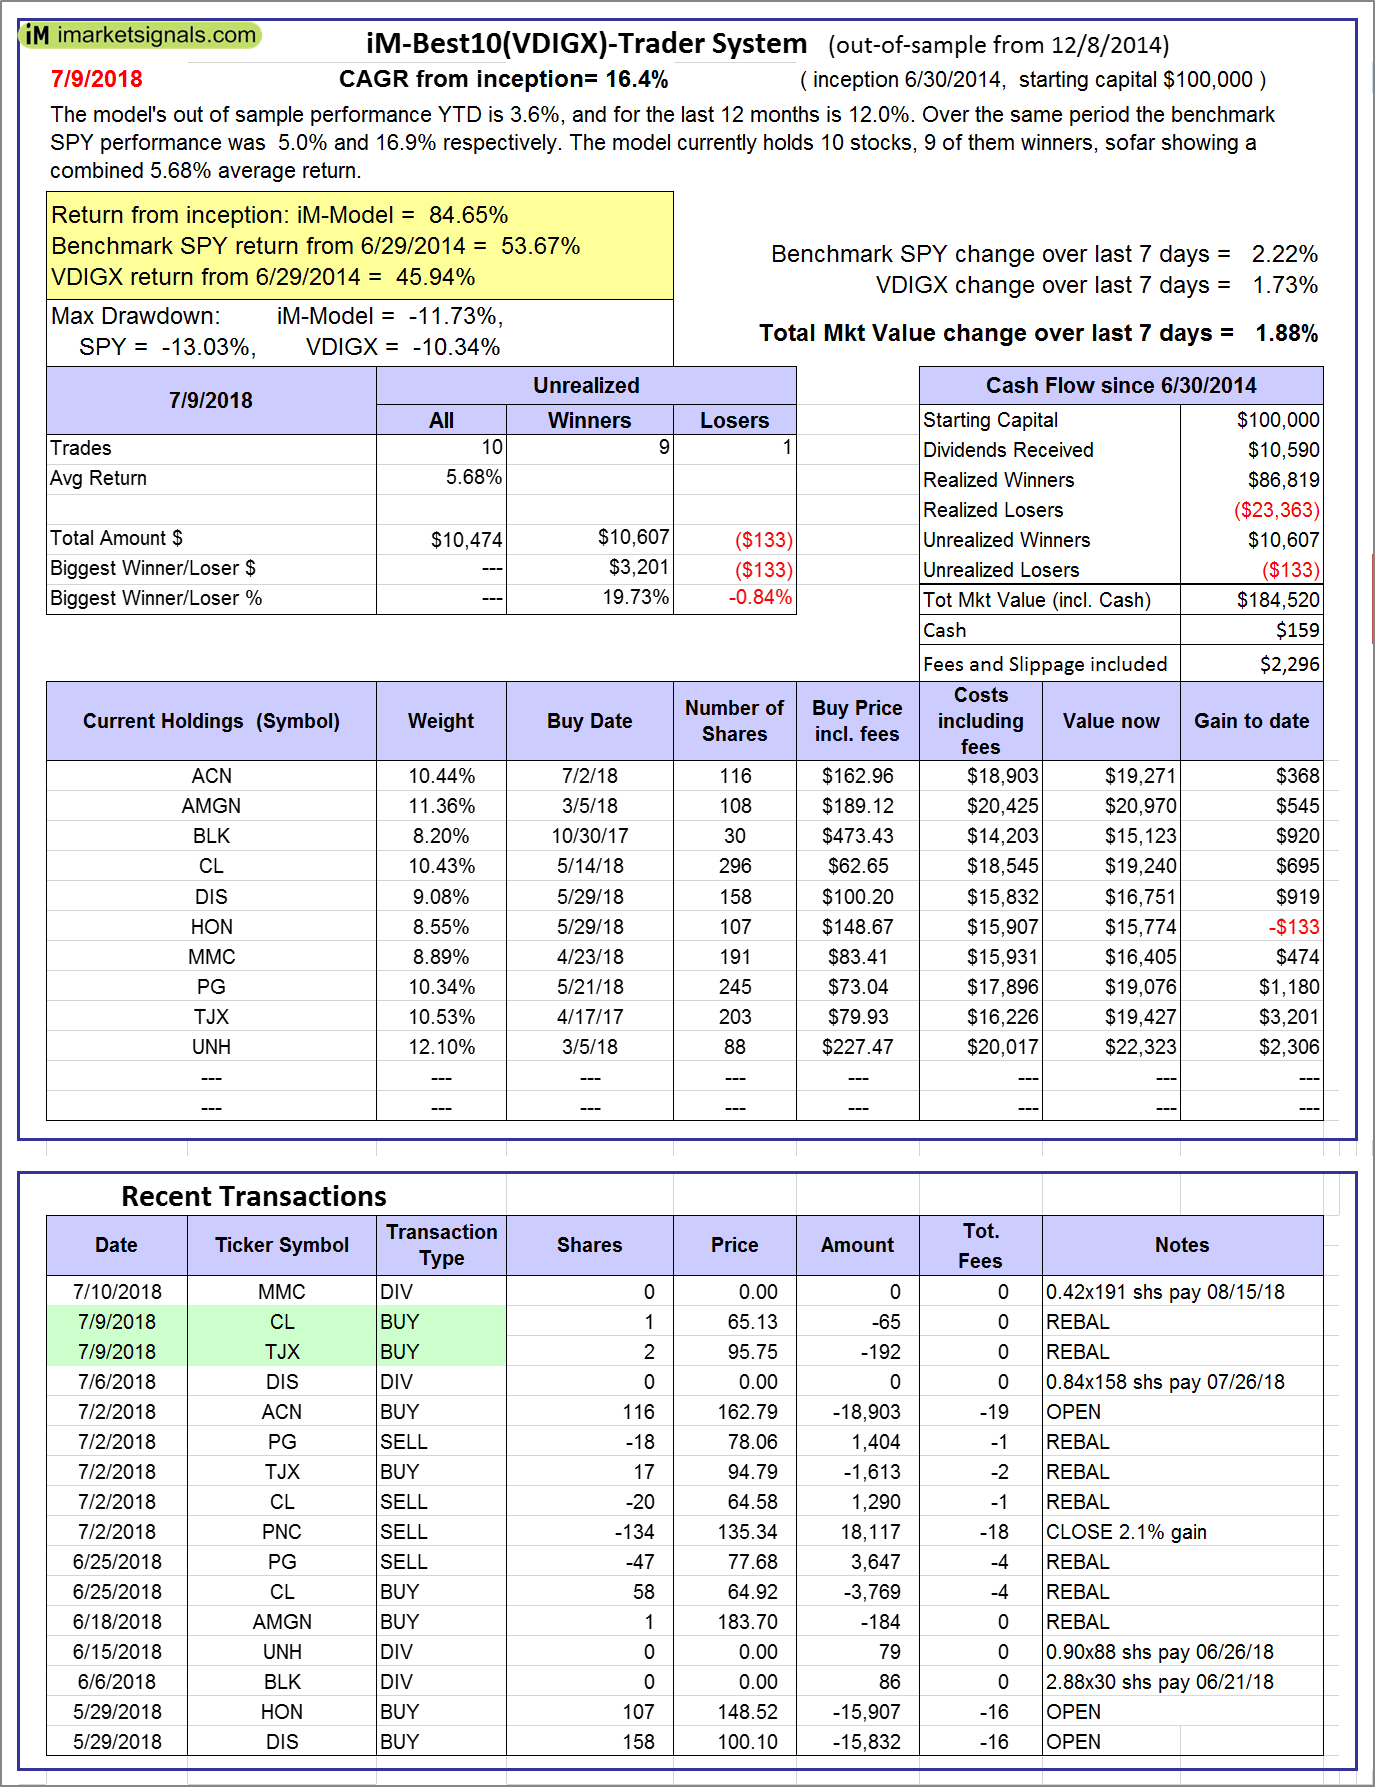
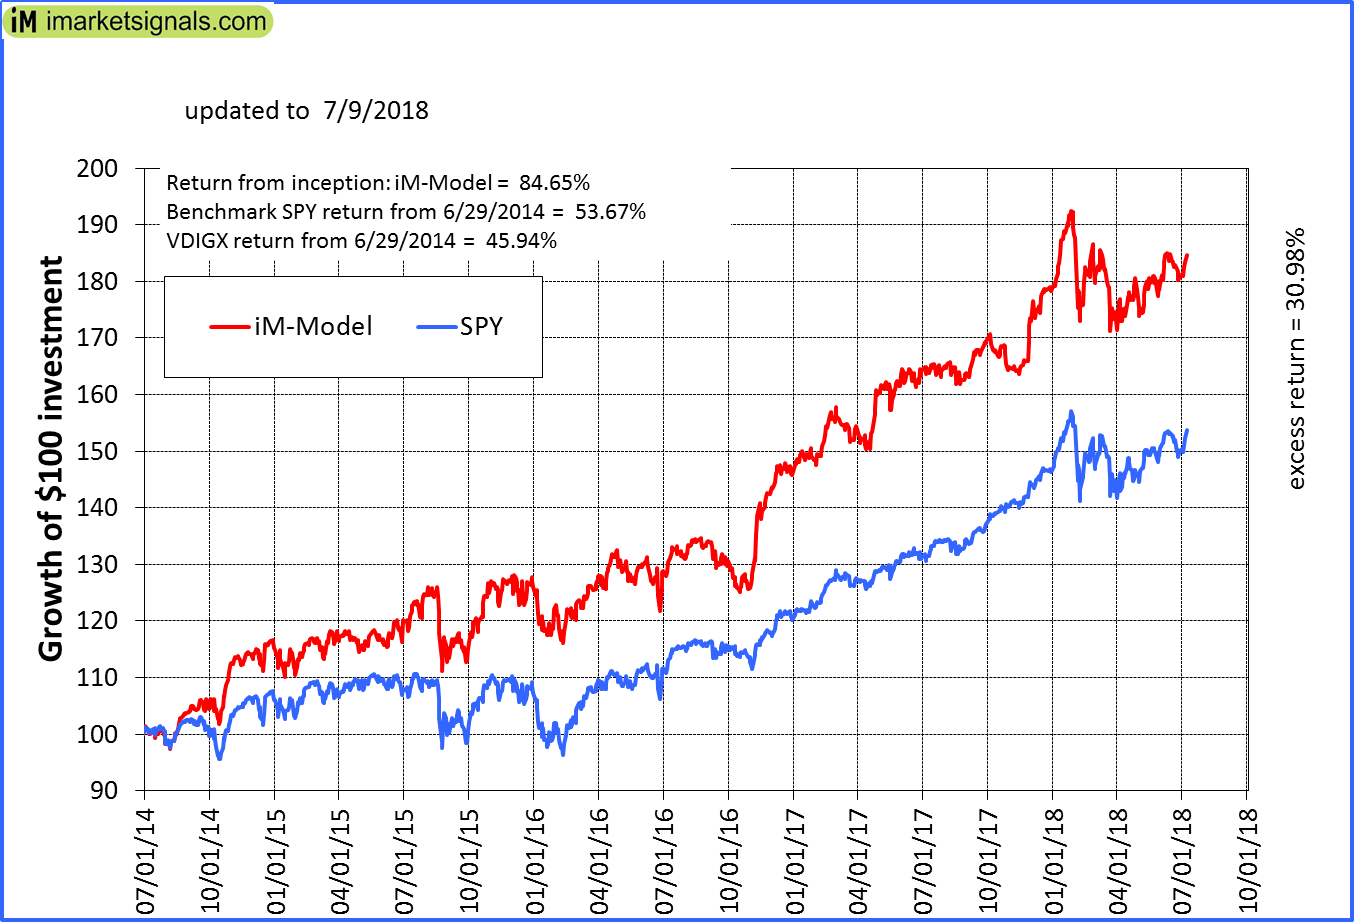
iM-Best10(VDIGX)-Trader: The model’s out of sample performance YTD is 3.6%, and for the last 12 months is 12.0%. Over the same period the benchmark SPY performance was 5.0% and 16.9% respectively. Since inception, on 7/1/2014, the model gained 84.65% while the benchmark SPY gained 53.67% and VDIGX gained 45.94% over the same period. Over the previous week the market value of iM-Best10(VDIGX) gained 1.88% at a time when SPY gained 2.22%. A starting capital of $100,000 at inception on 7/1/2014 would have grown to $184,520 which includes $159 cash and excludes $2,296 spent on fees and slippage. |
|
|
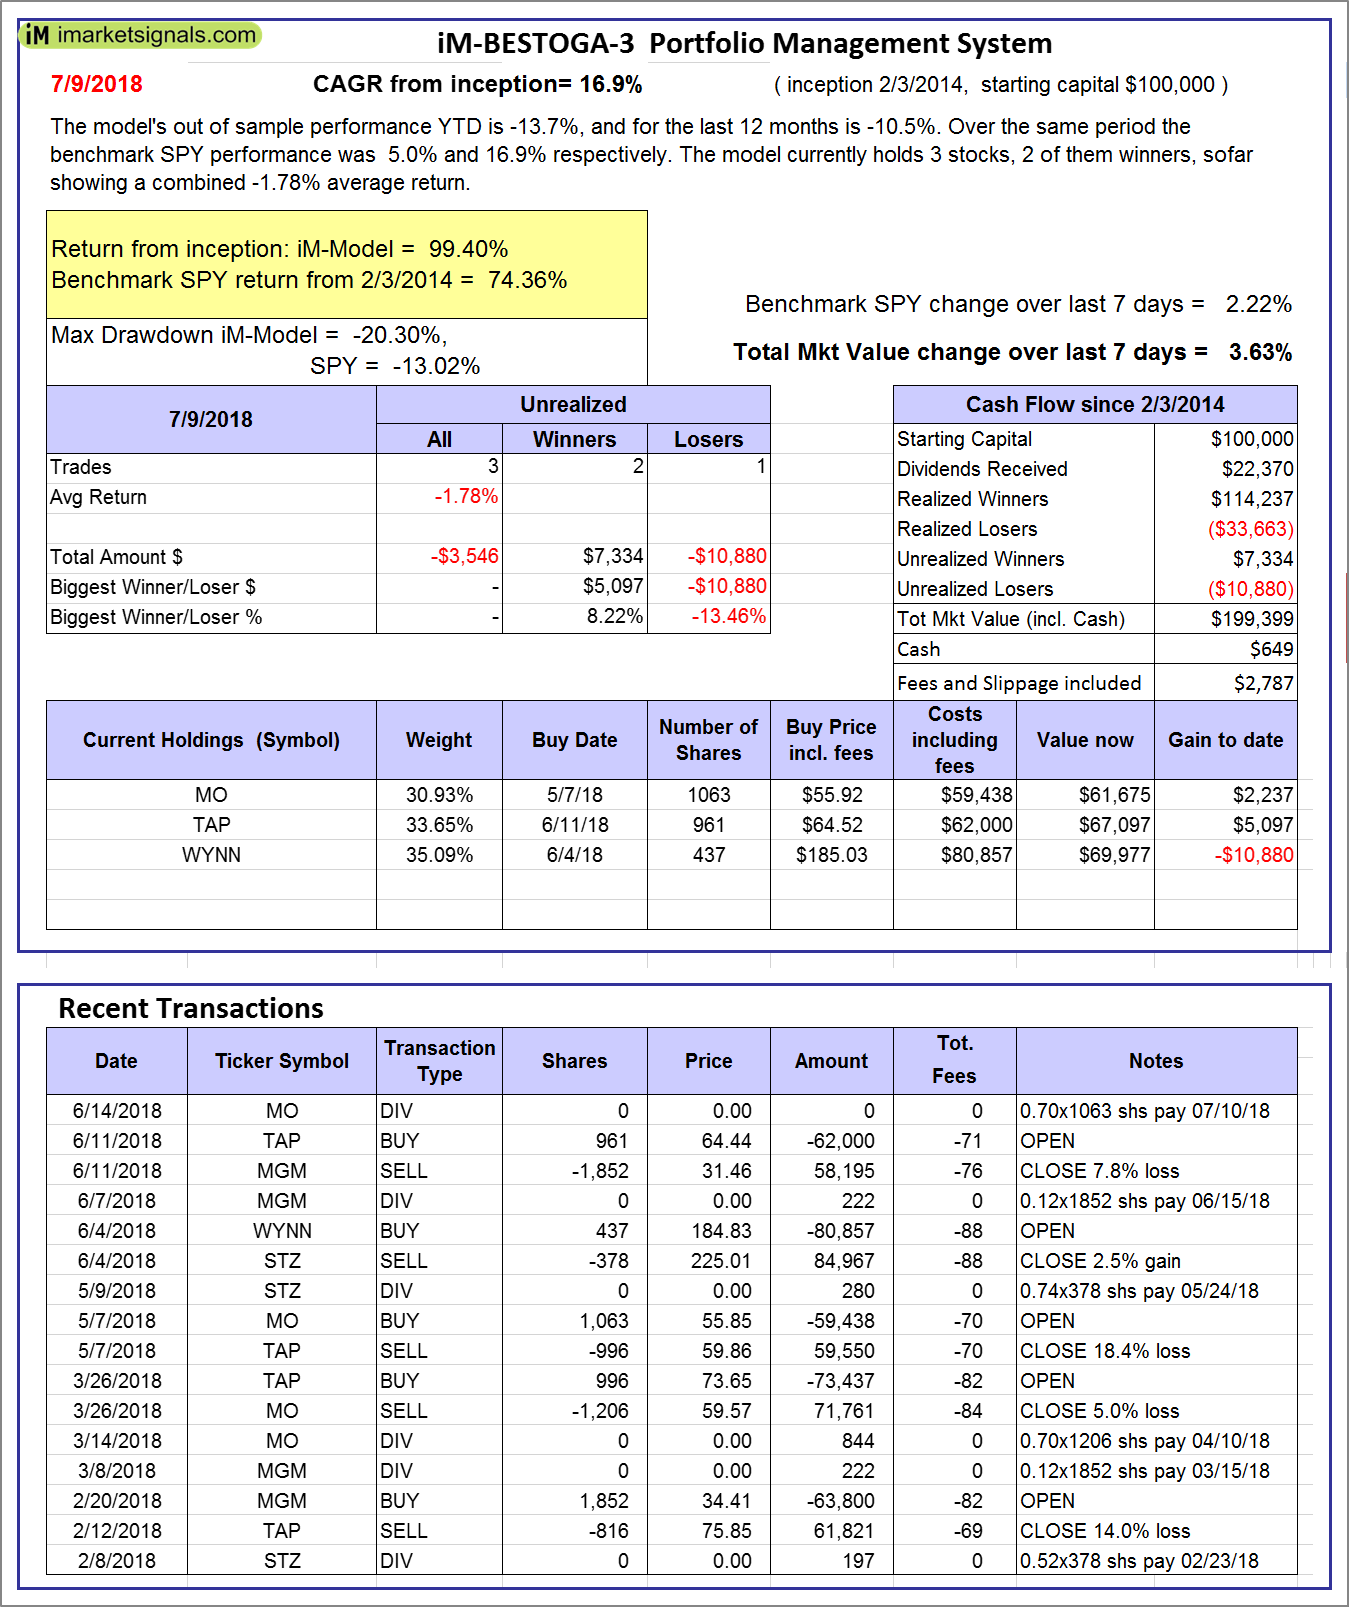
iM-BESTOGA-3: The model’s out of sample performance YTD is -13.7%, and for the last 12 months is -10.5%. Over the same period the benchmark SPY performance was 5.0% and 16.9% respectively. Over the previous week the market value of iM-BESTOGA-3 gained 3.63% at a time when SPY gained 2.22%. A starting capital of $100,000 at inception on 2/3/2014 would have grown to $199,399 which includes $649 cash and excludes $2,787 spent on fees and slippage. |
|
|
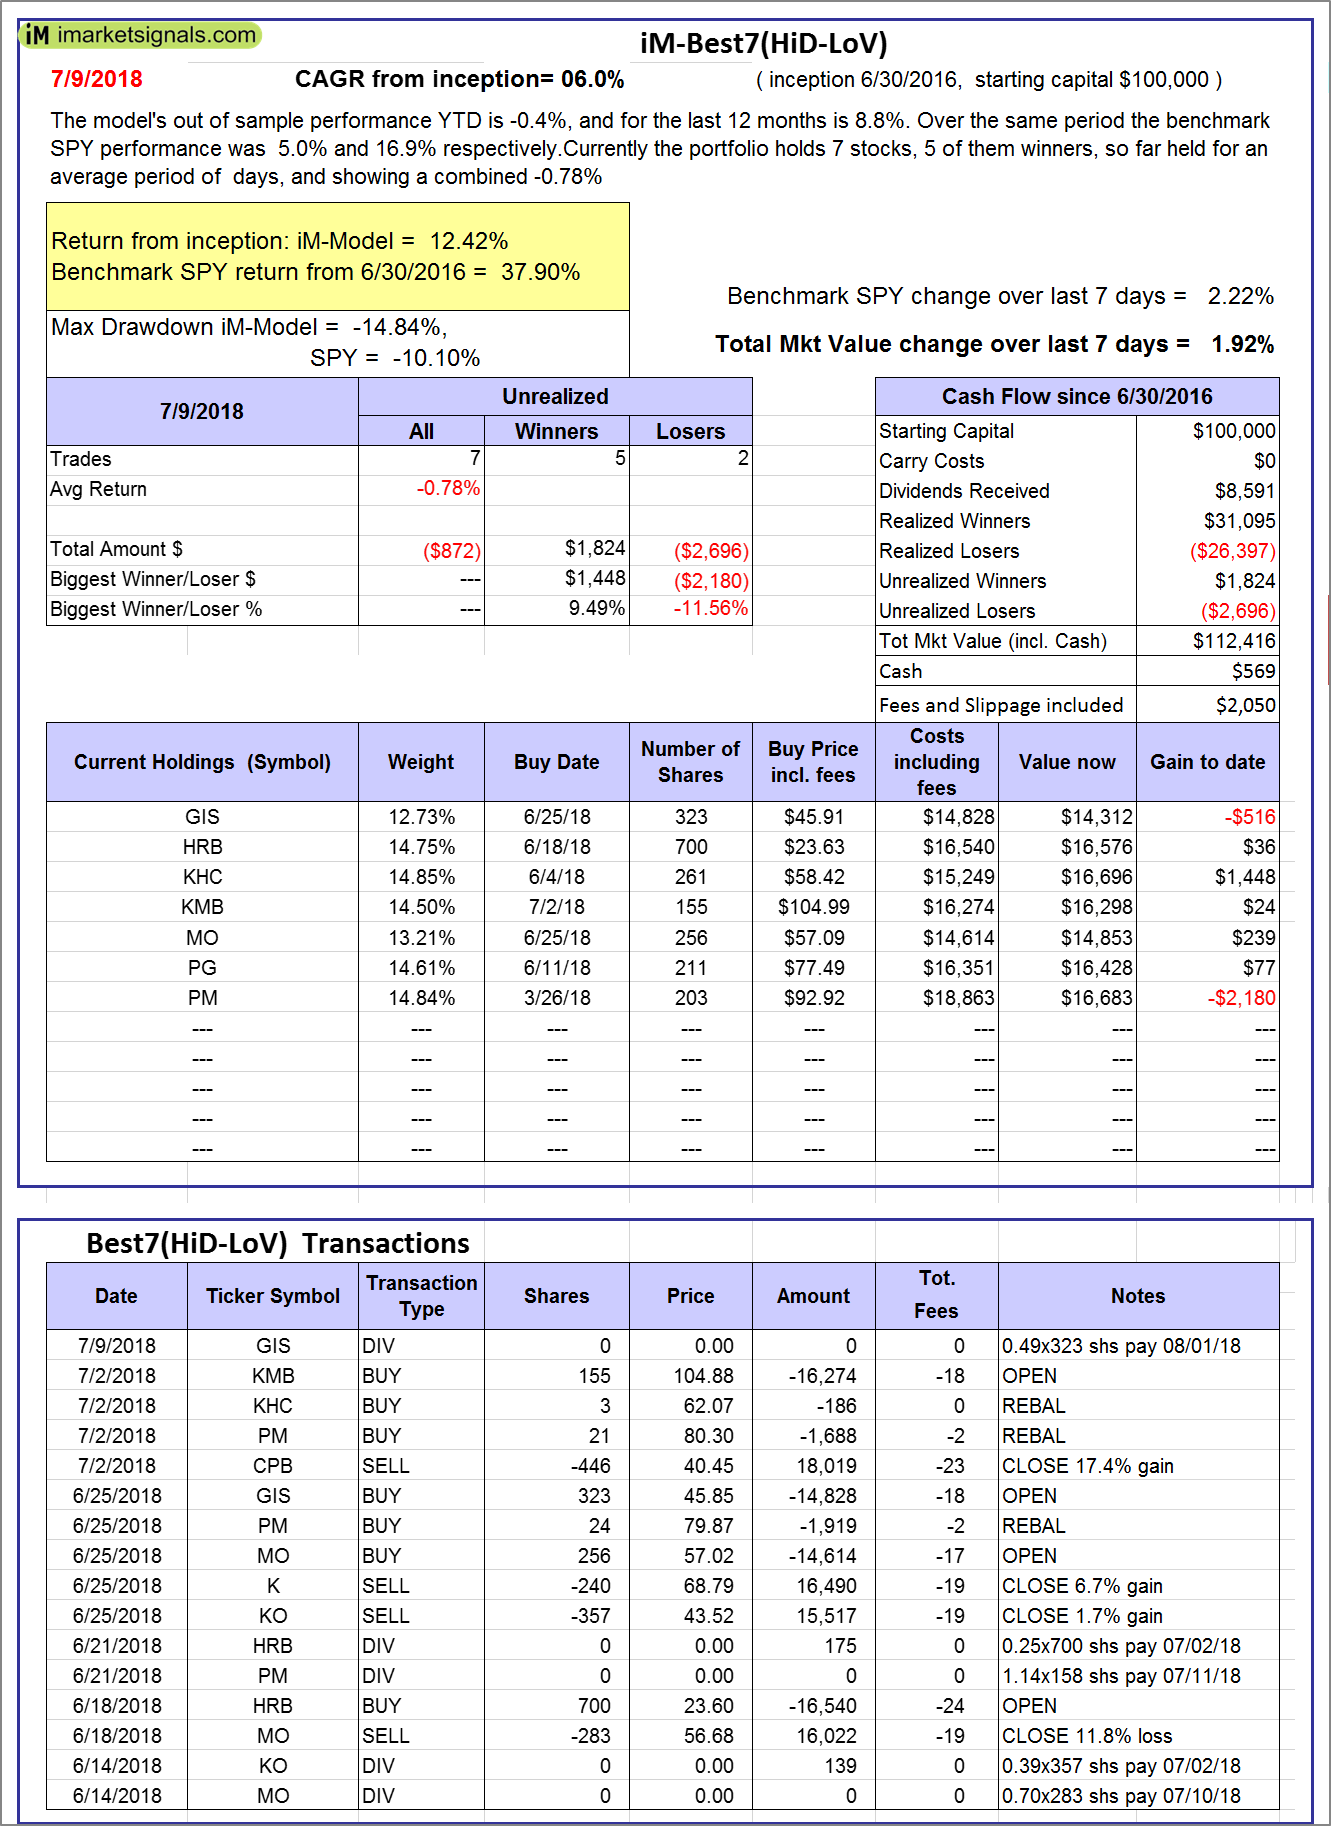
iM-Best7(HiD-LoV): The model’s out of sample performance YTD is -0.4%, and for the last 12 months is 8.8%. Over the same period the benchmark SPY performance was 5.0% and 16.9% respectively. Over the previous week the market value of iM-BESTOGA-3 gained 1.92% at a time when SPY gained 2.22%. A starting capital of $100,000 at inception on 6/30/2016 would have grown to $112,416 which includes $569 cash and excludes $2,050 spent on fees and slippage. |
|
|
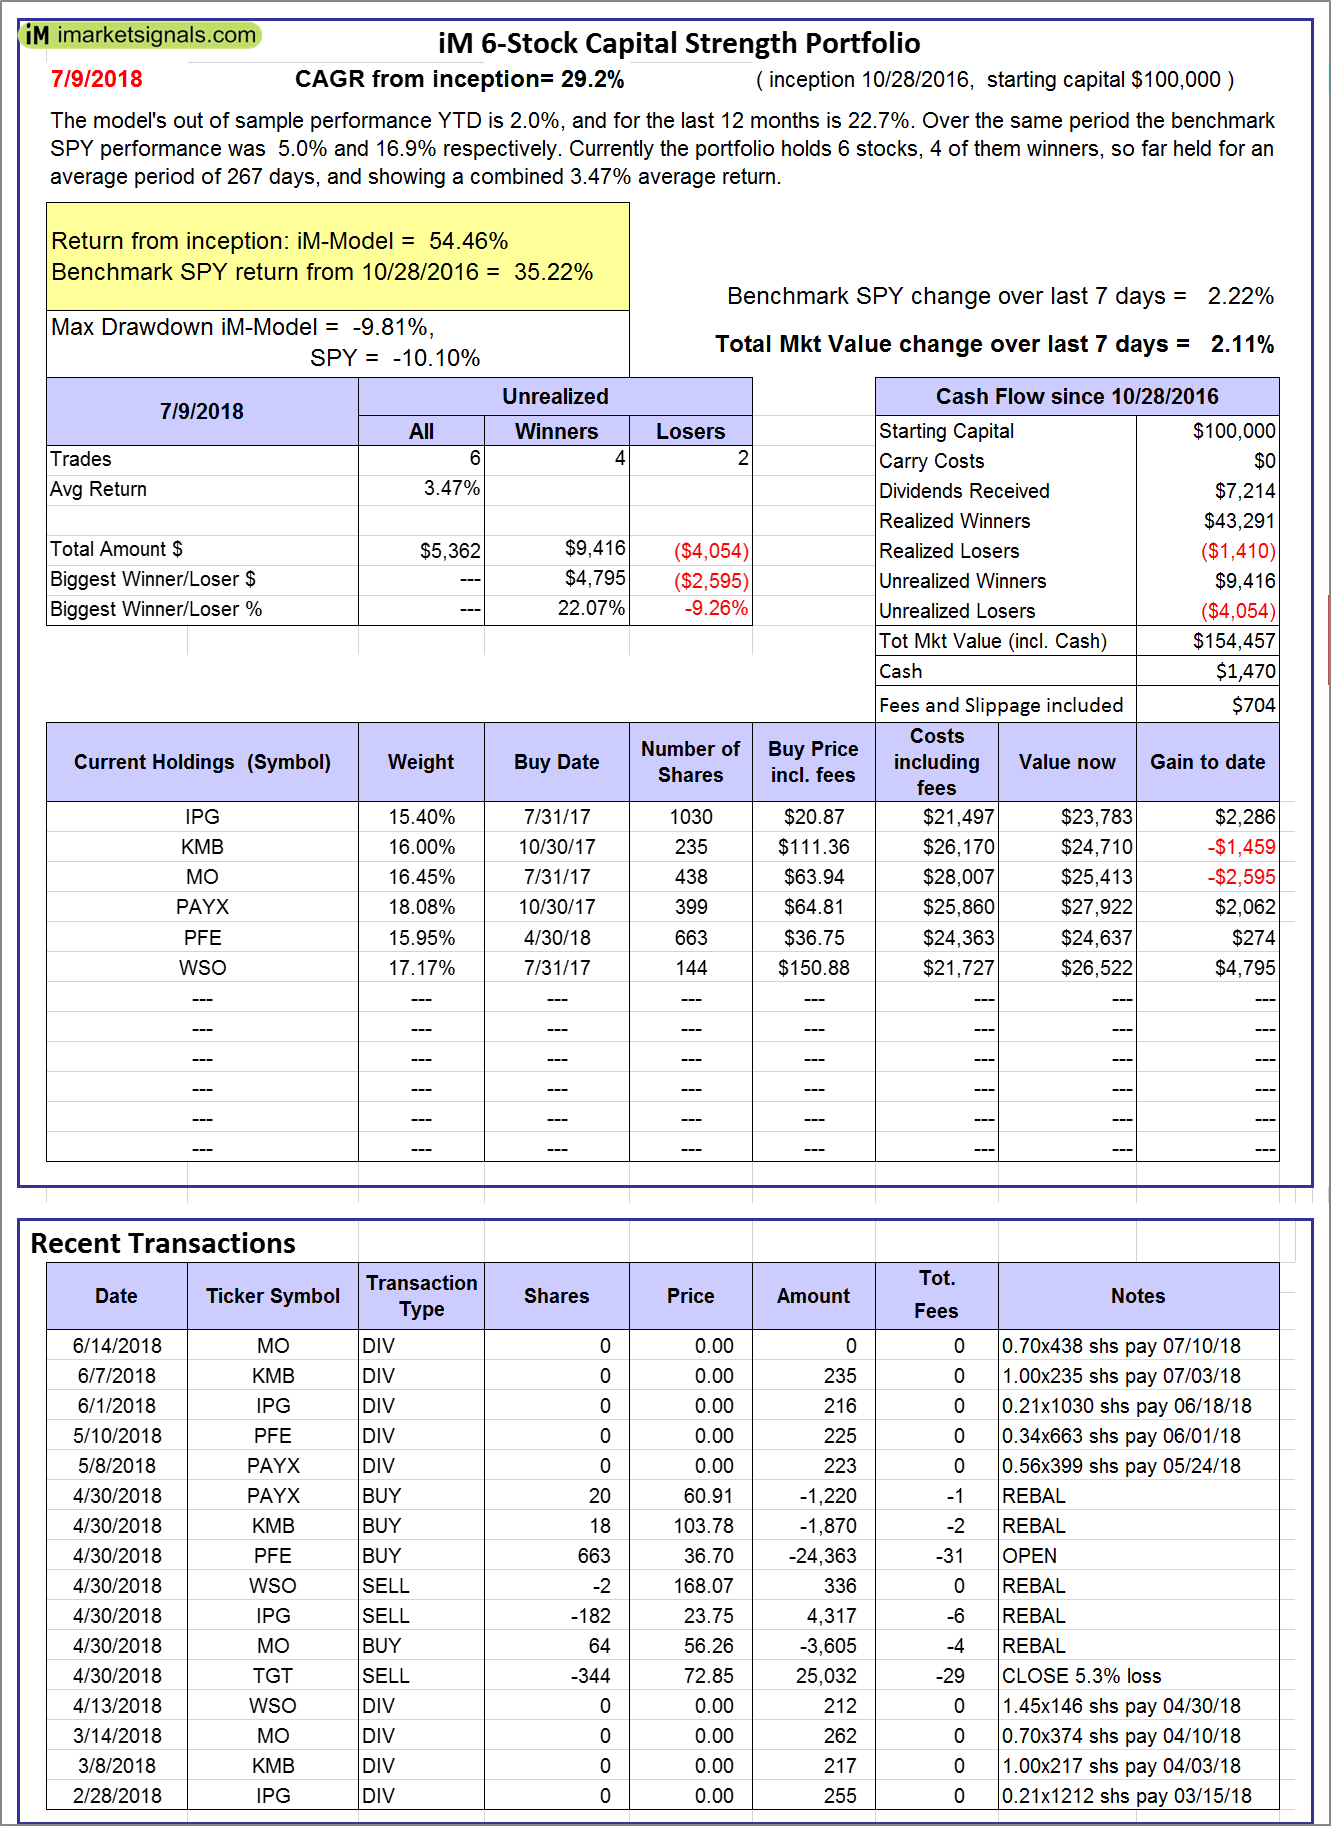
iM 6-Stock Capital Strength Portfolio: The model’s out of sample performance YTD is 2.0%, and for the last 12 months is 22.7%. Over the same period the benchmark SPY performance was 5.0% and 16.9% respectively. Over the previous week the market value of the iM 6-Stock Capital Strength Portfolio gained 2.11% at a time when SPY gained 2.22%. A starting capital of $100,000 at inception on 10/28/2016 would have grown to $154,457 which includes $1,470 cash and excludes $704 spent on fees and slippage. |
|
|
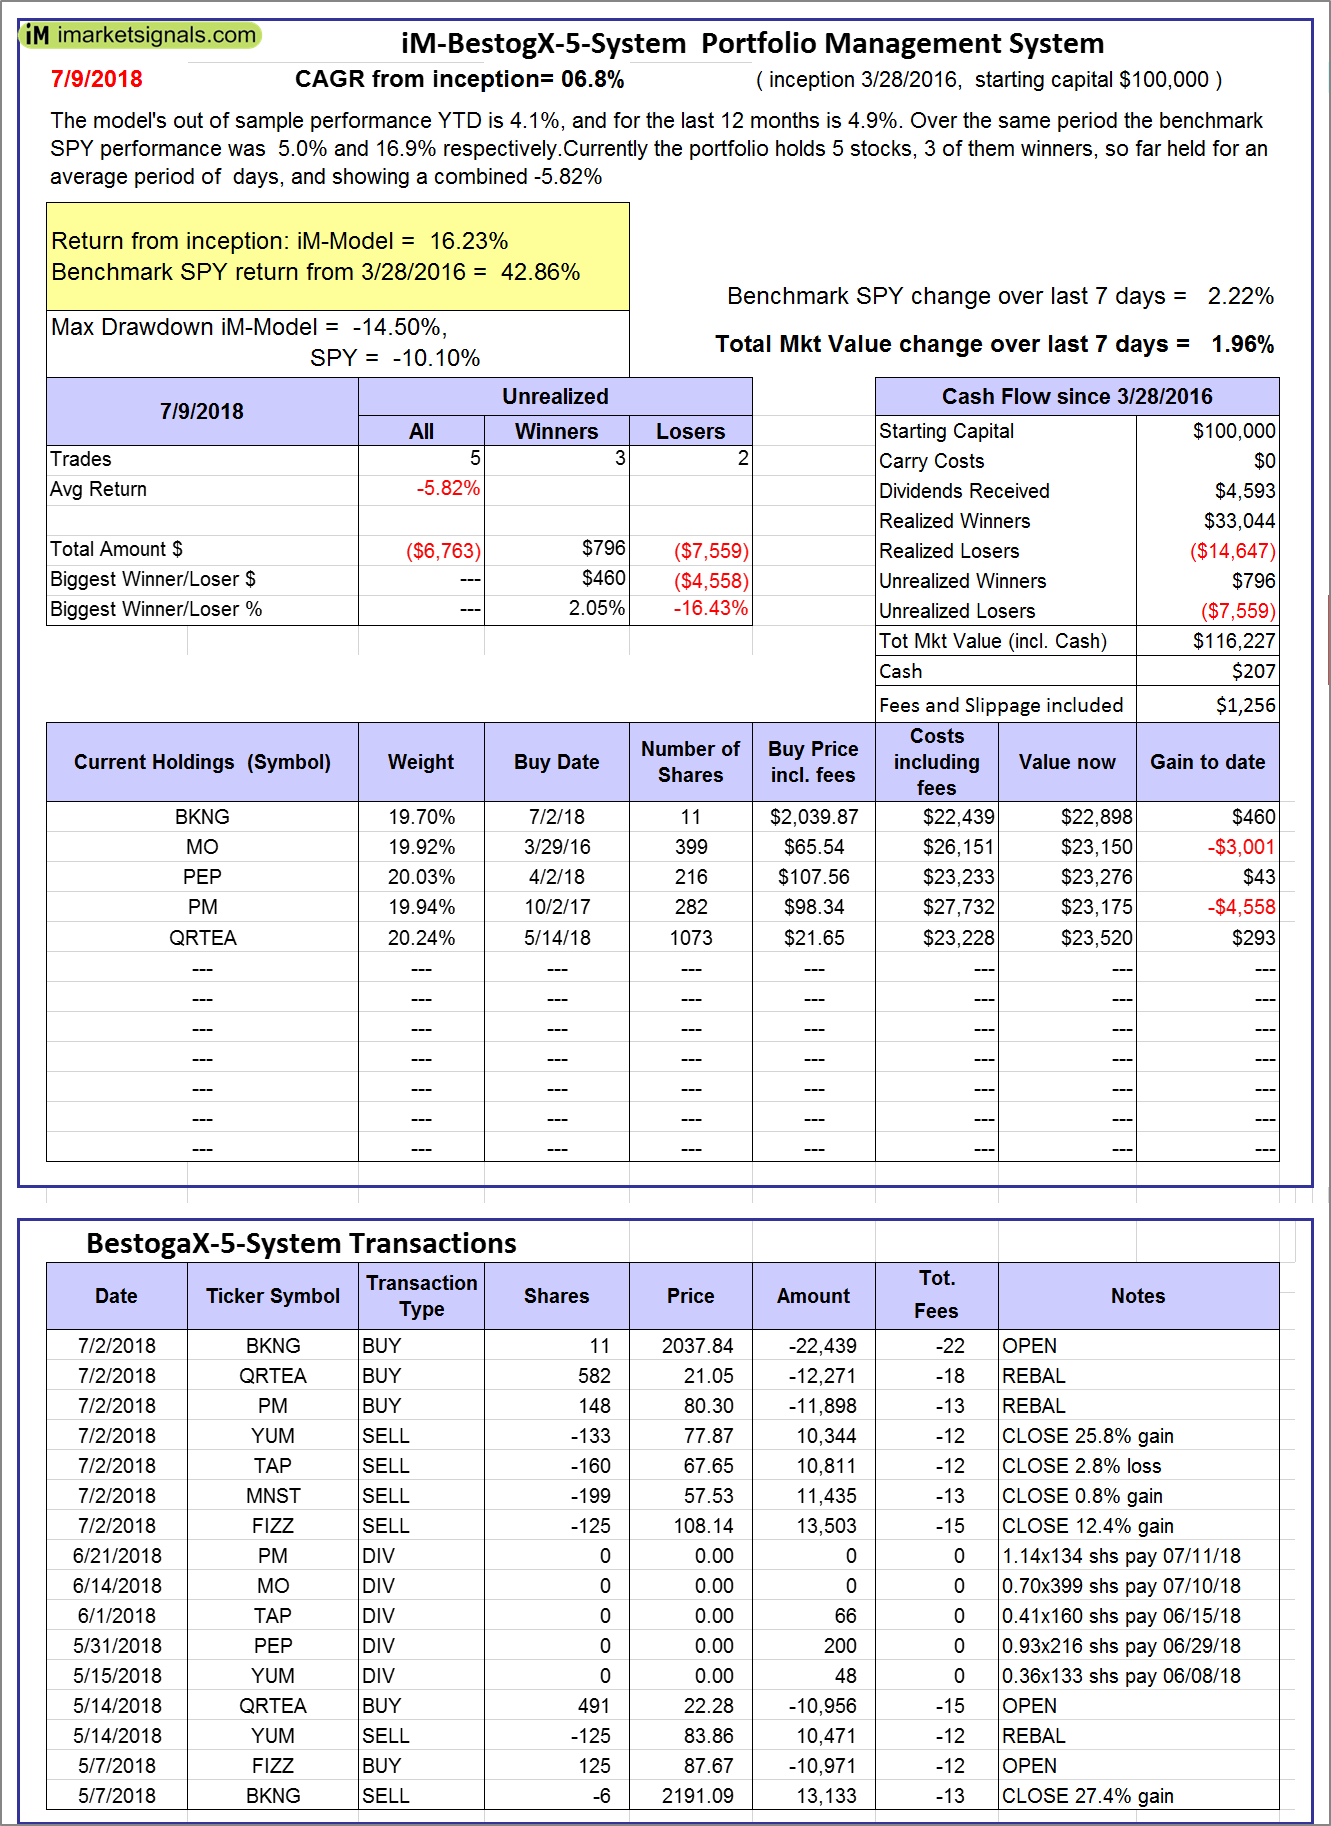
iM-BestogaX5-System: The model’s out of sample performance YTD is 4.1%, and for the last 12 months is 4.9%. Over the same period the benchmark SPY performance was 5.0% and 16.9% respectively. Over the previous week the market value of iM-BestogaX5-System gained 1.96% at a time when SPY gained 2.22%. A starting capital of $100,000 at inception on 3/28/2016 would have grown to $116,227 which includes $207 cash and excludes $1,256 spent on fees and slippage. |
|
|
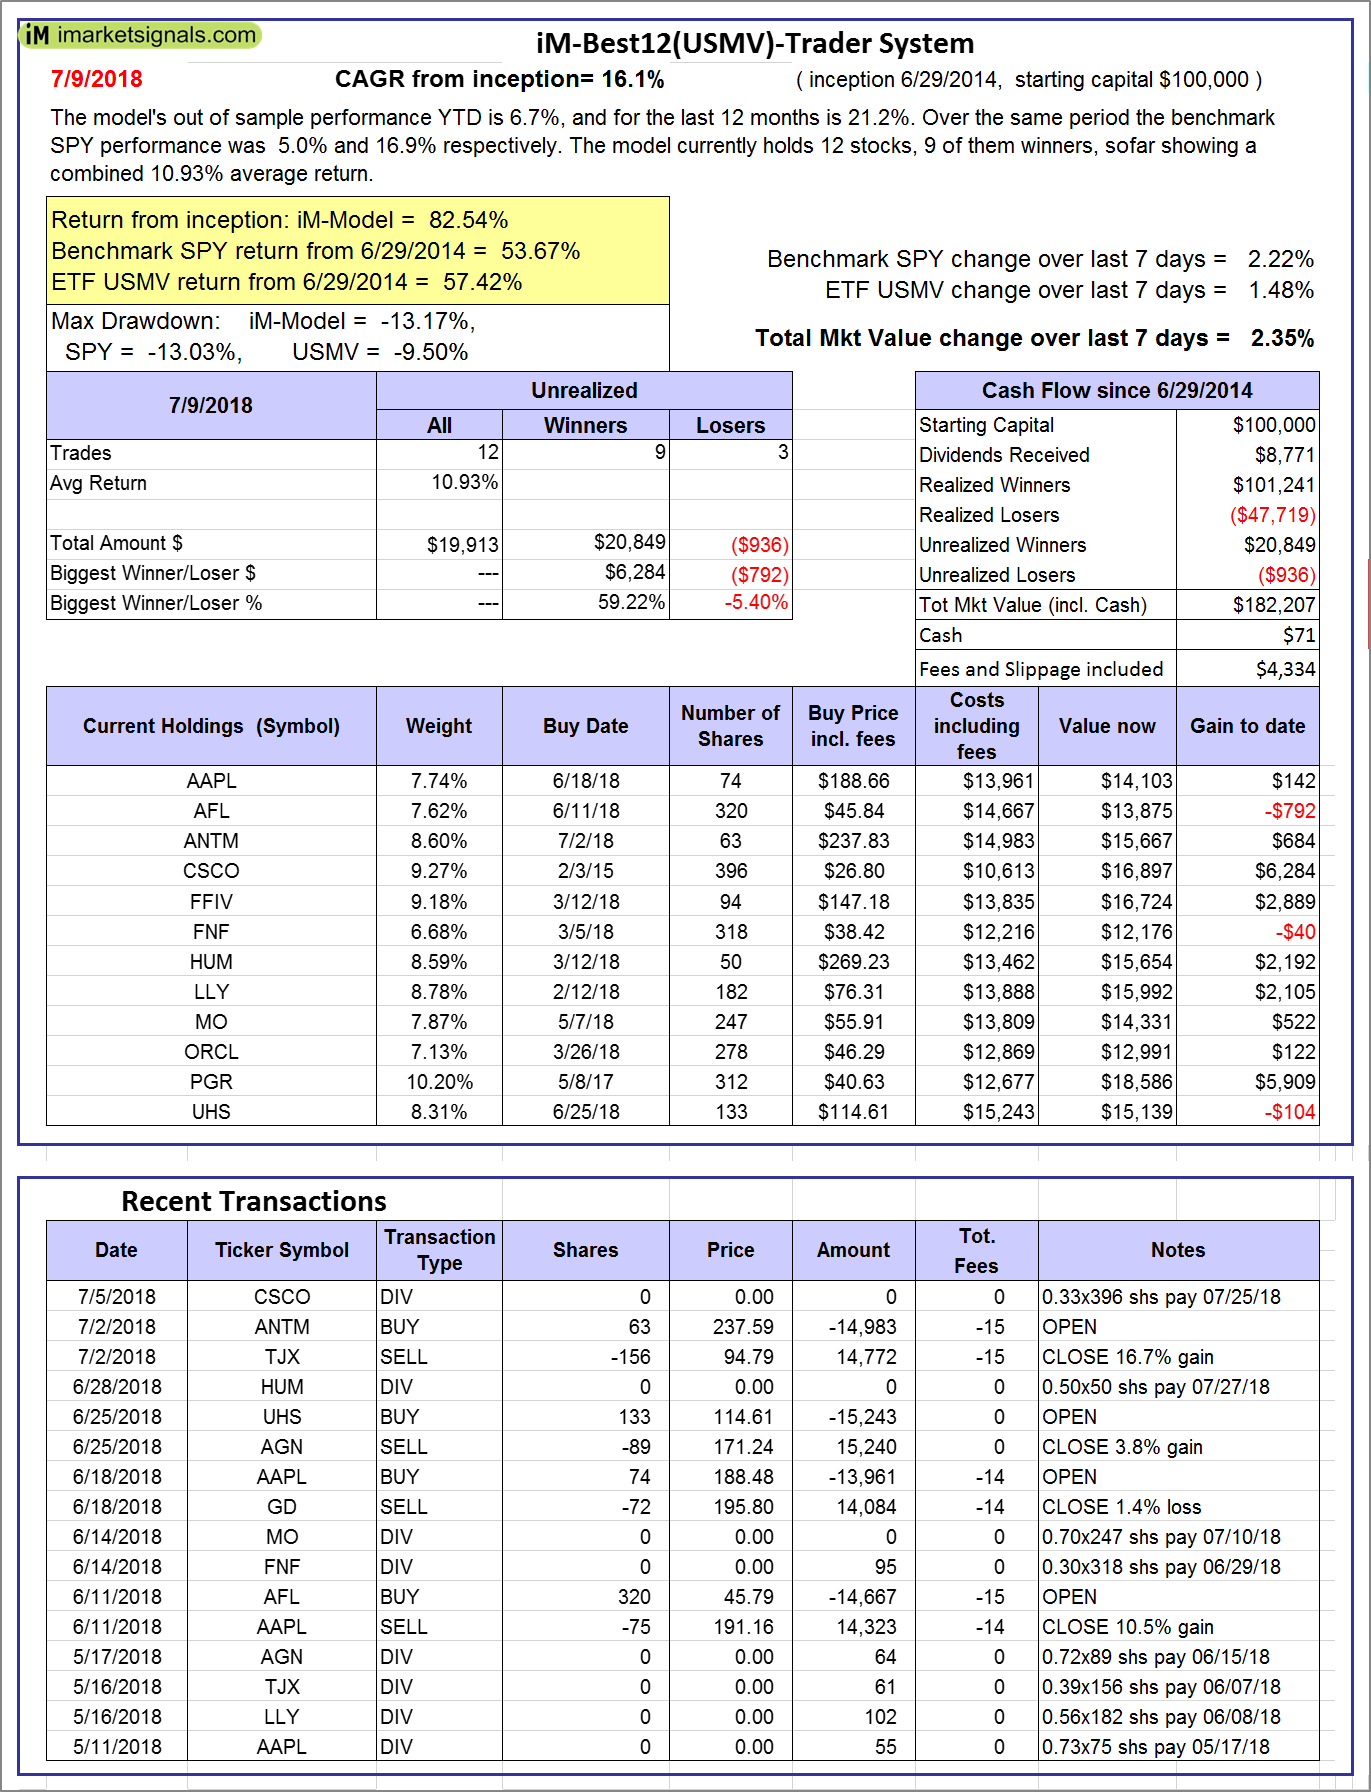
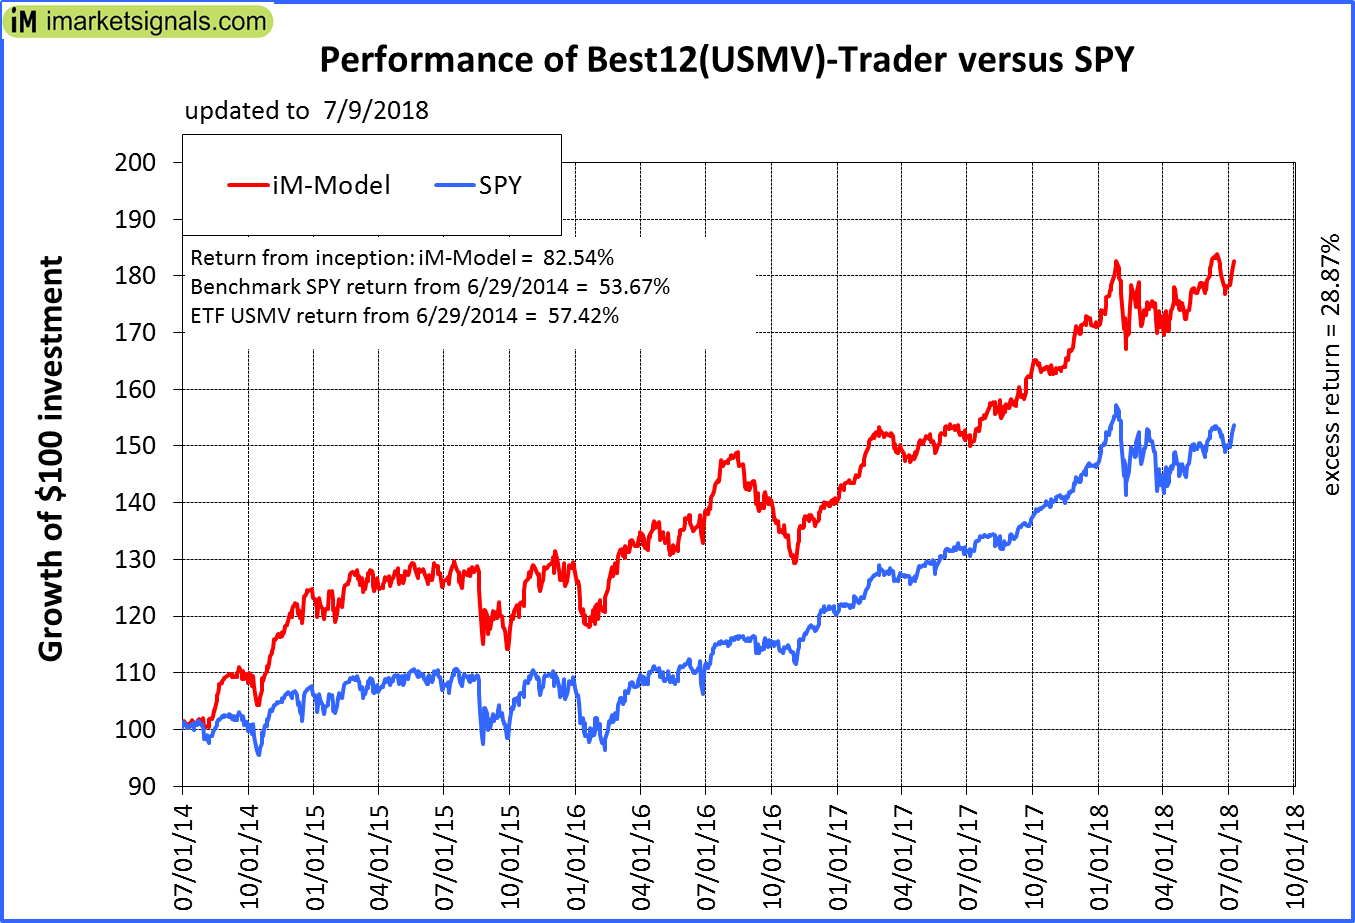
iM-Best12(USMV)-Trader: The model’s out of sample performance YTD is 6.7%, and for the last 12 months is 21.2%. Over the same period the benchmark SPY performance was 5.0% and 16.9% respectively. Since inception, on 6/30/2014, the model gained 82.54% while the benchmark SPY gained 53.67% and the ETF USMV gained 57.42% over the same period. Over the previous week the market value of iM-Best12(USMV)-Trader gained 2.35% at a time when SPY gained 2.22%. A starting capital of $100,000 at inception on 6/30/2014 would have grown to $182,207 which includes $71 cash and excludes $4,334 spent on fees and slippage. |
|
|
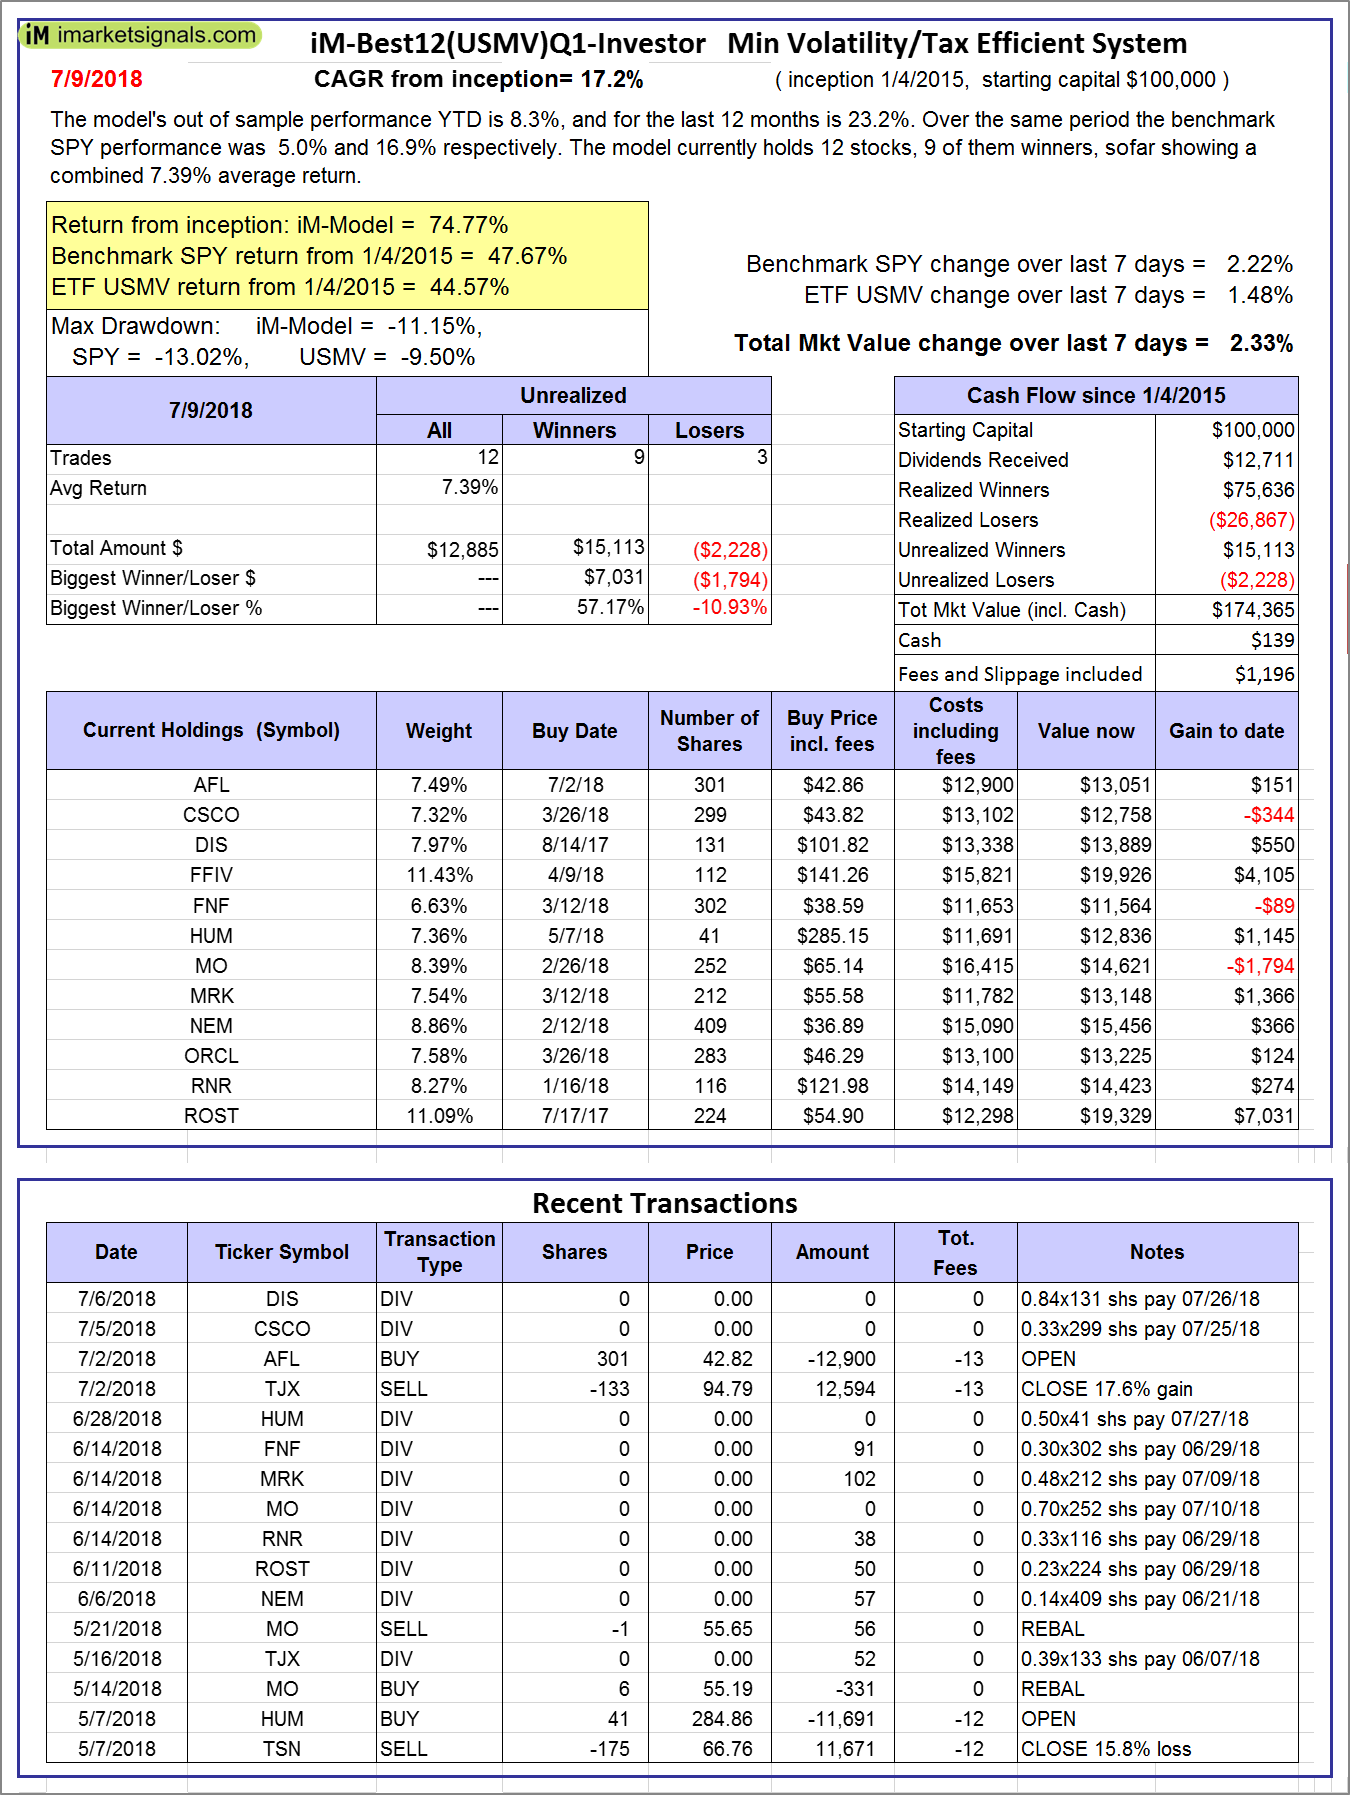
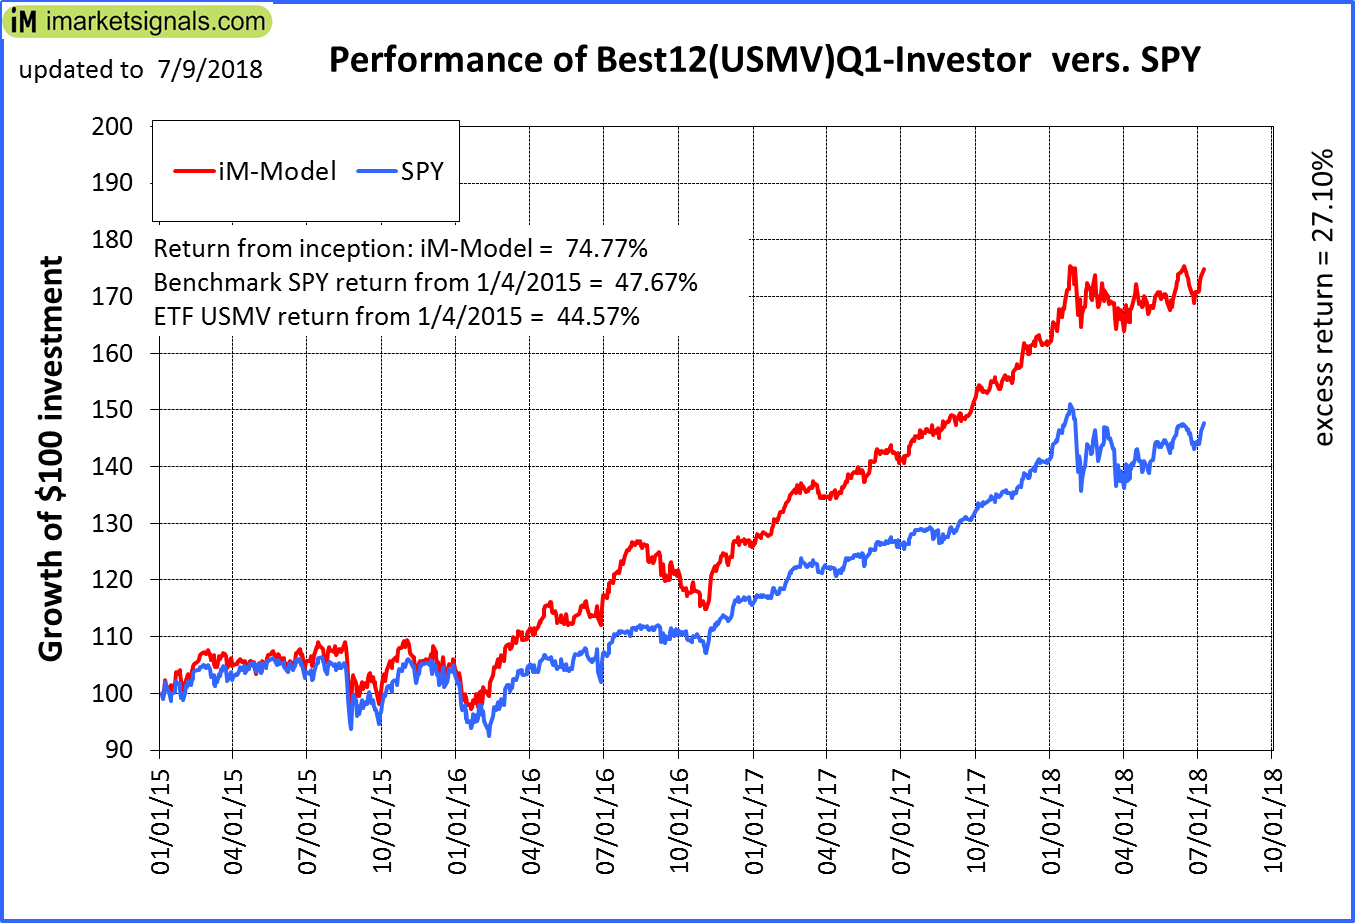
iM-Best12(USMV)Q1-Investor: The model’s out of sample performance YTD is 8.3%, and for the last 12 months is 23.2%. Over the same period the benchmark SPY performance was 5.0% and 16.9% respectively. Since inception, on 1/5/2015, the model gained 74.77% while the benchmark SPY gained 47.67% and the ETF USMV gained 44.57% over the same period. Over the previous week the market value of iM-Best12(USMV)Q1 gained 2.33% at a time when SPY gained 2.22%. A starting capital of $100,000 at inception on 1/5/2015 would have grown to $174,365 which includes $139 cash and excludes $1,196 spent on fees and slippage. |
|
|
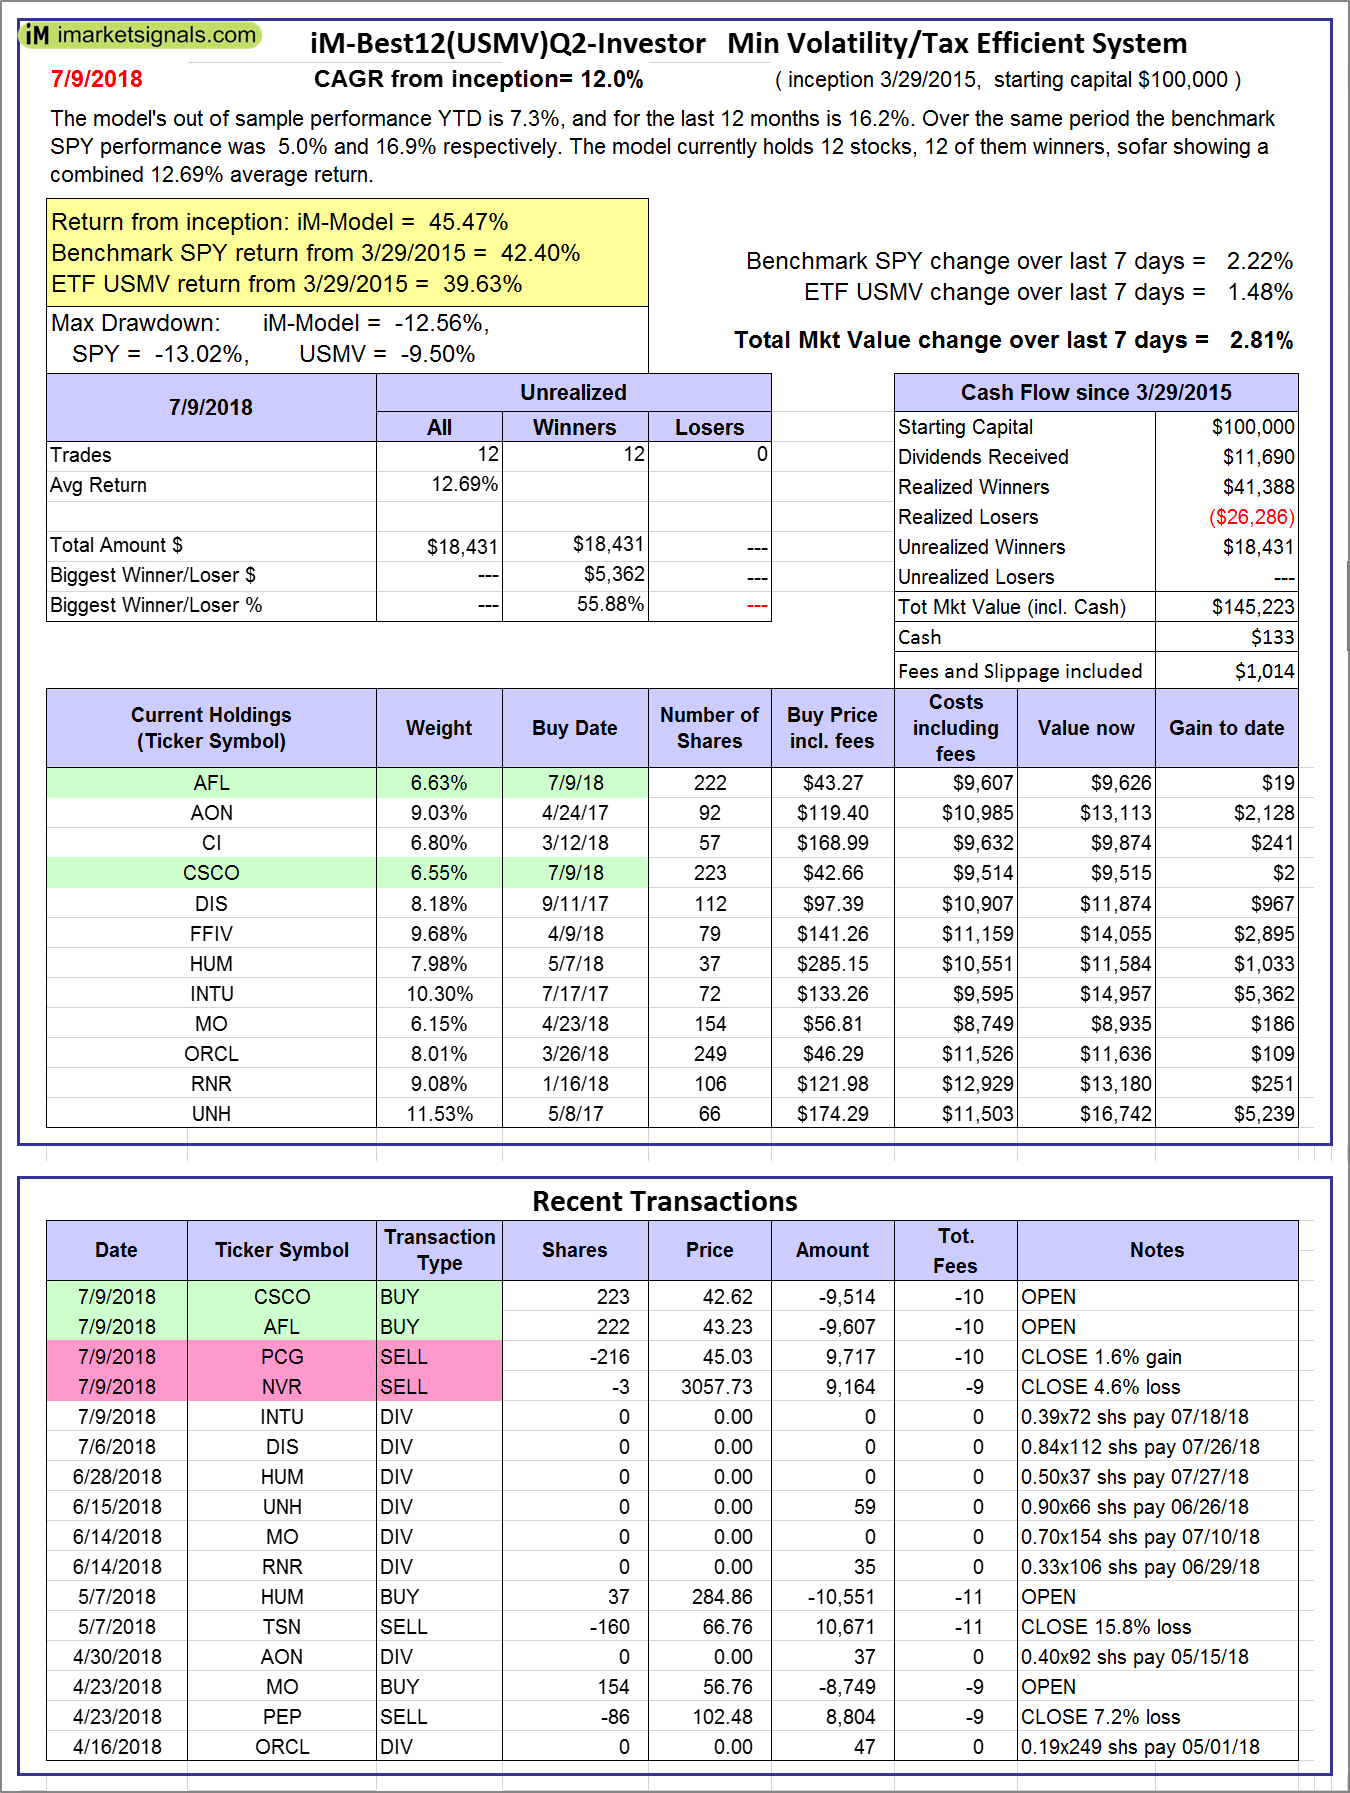
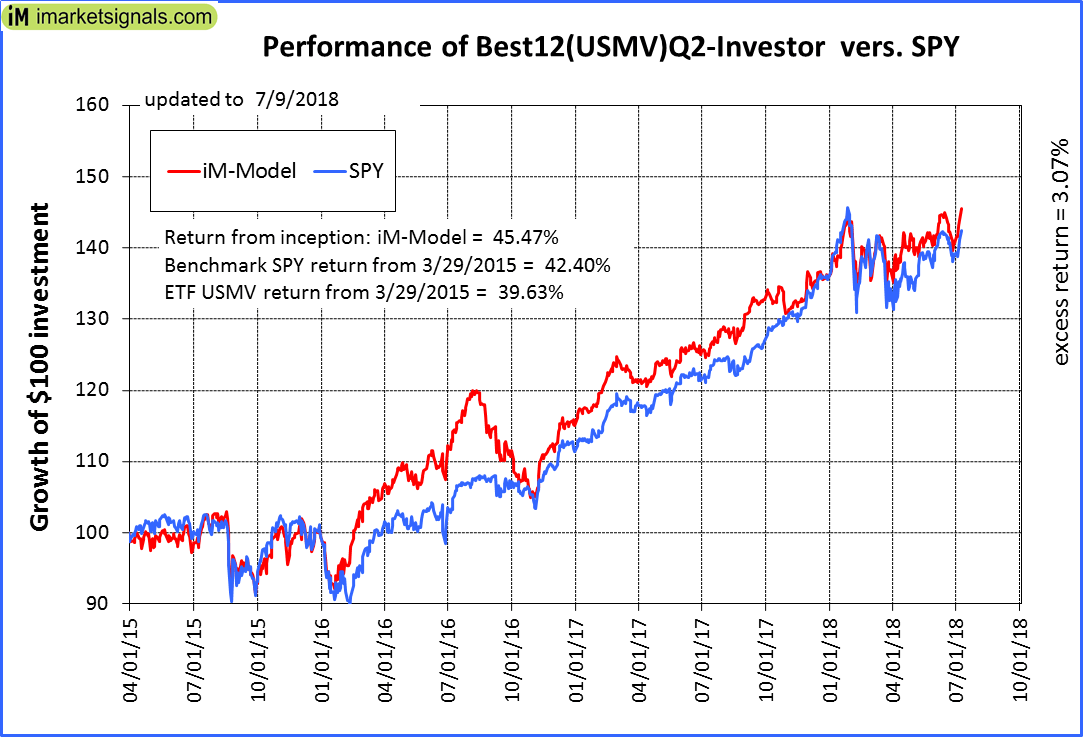
iM-Best12(USMV)Q2-Investor: The model’s out of sample performance YTD is 7.3%, and for the last 12 months is 16.2%. Over the same period the benchmark SPY performance was 5.0% and 16.9% respectively. Since inception, on 3/30/2015, the model gained 45.47% while the benchmark SPY gained 42.40% and the ETF USMV gained 39.63% over the same period. Over the previous week the market value of iM-Best12(USMV)Q2 gained 2.81% at a time when SPY gained 2.22%. A starting capital of $100,000 at inception on 3/30/2015 would have grown to $145,223 which includes $133 cash and excludes $1,014 spent on fees and slippage. |
|
|
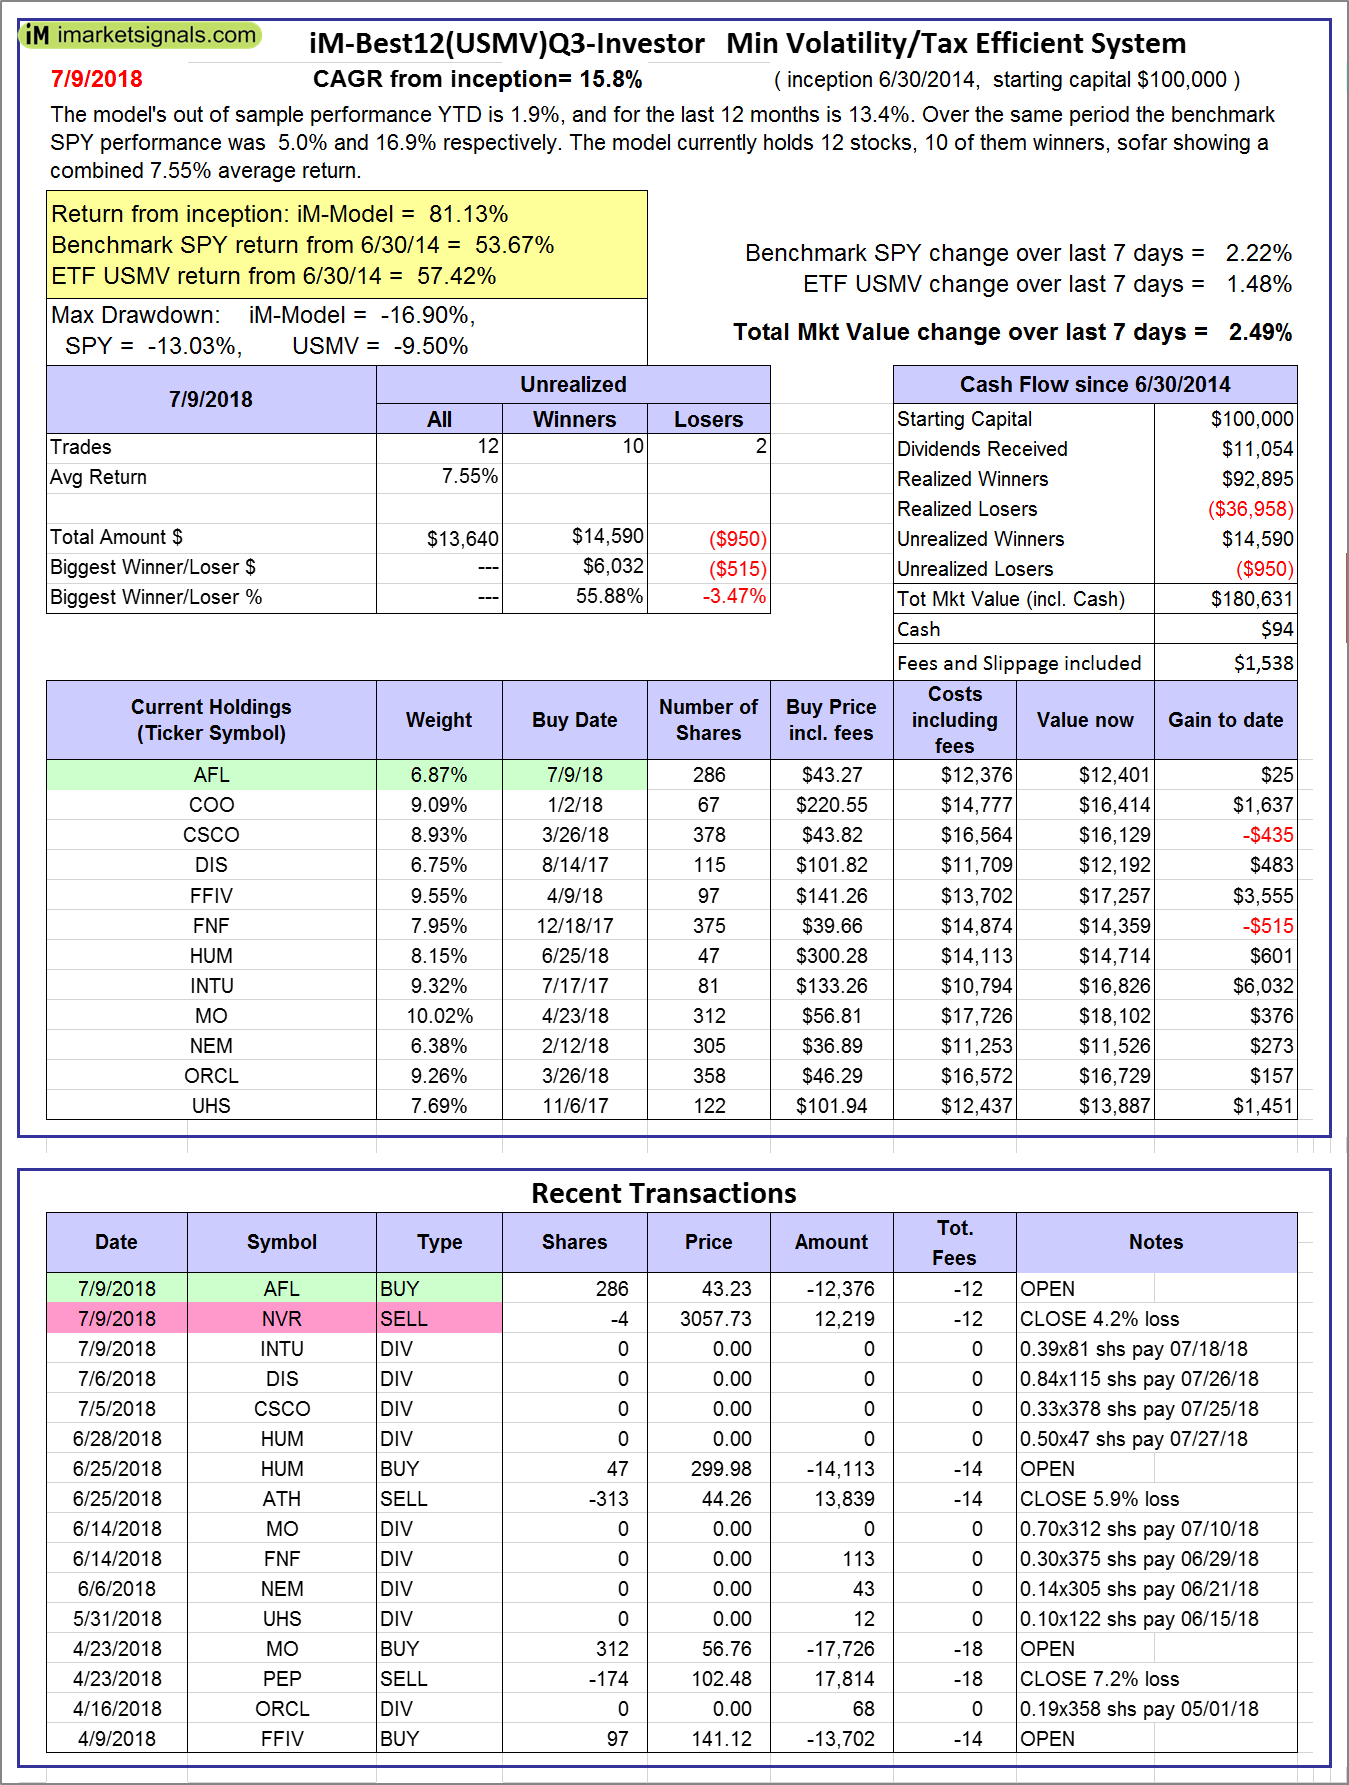
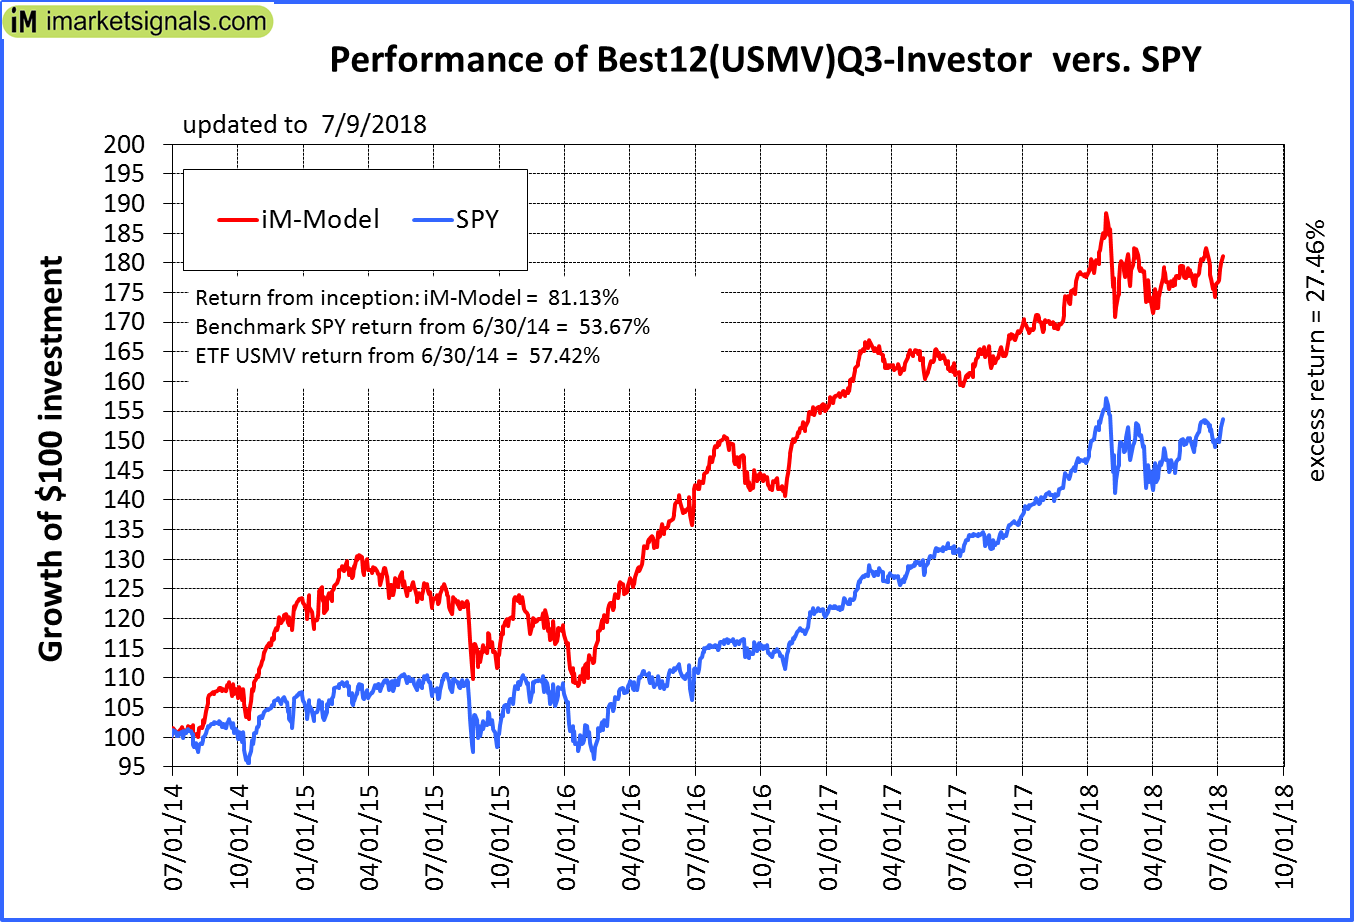
iM-Best12(USMV)Q3-Investor: The model’s out of sample performance YTD is 1.9%, and for the last 12 months is 13.4%. Over the same period the benchmark SPY performance was 5.0% and 16.9% respectively. Since inception, on 7/1/2014, the model gained 81.13% while the benchmark SPY gained 53.67% and the ETF USMV gained 57.42% over the same period. Over the previous week the market value of iM-Best12(USMV)Q3 gained 2.49% at a time when SPY gained 2.22%. A starting capital of $100,000 at inception on 7/1/2014 would have grown to $180,631 which includes $94 cash and excludes $1,538 spent on fees and slippage. |
|
|
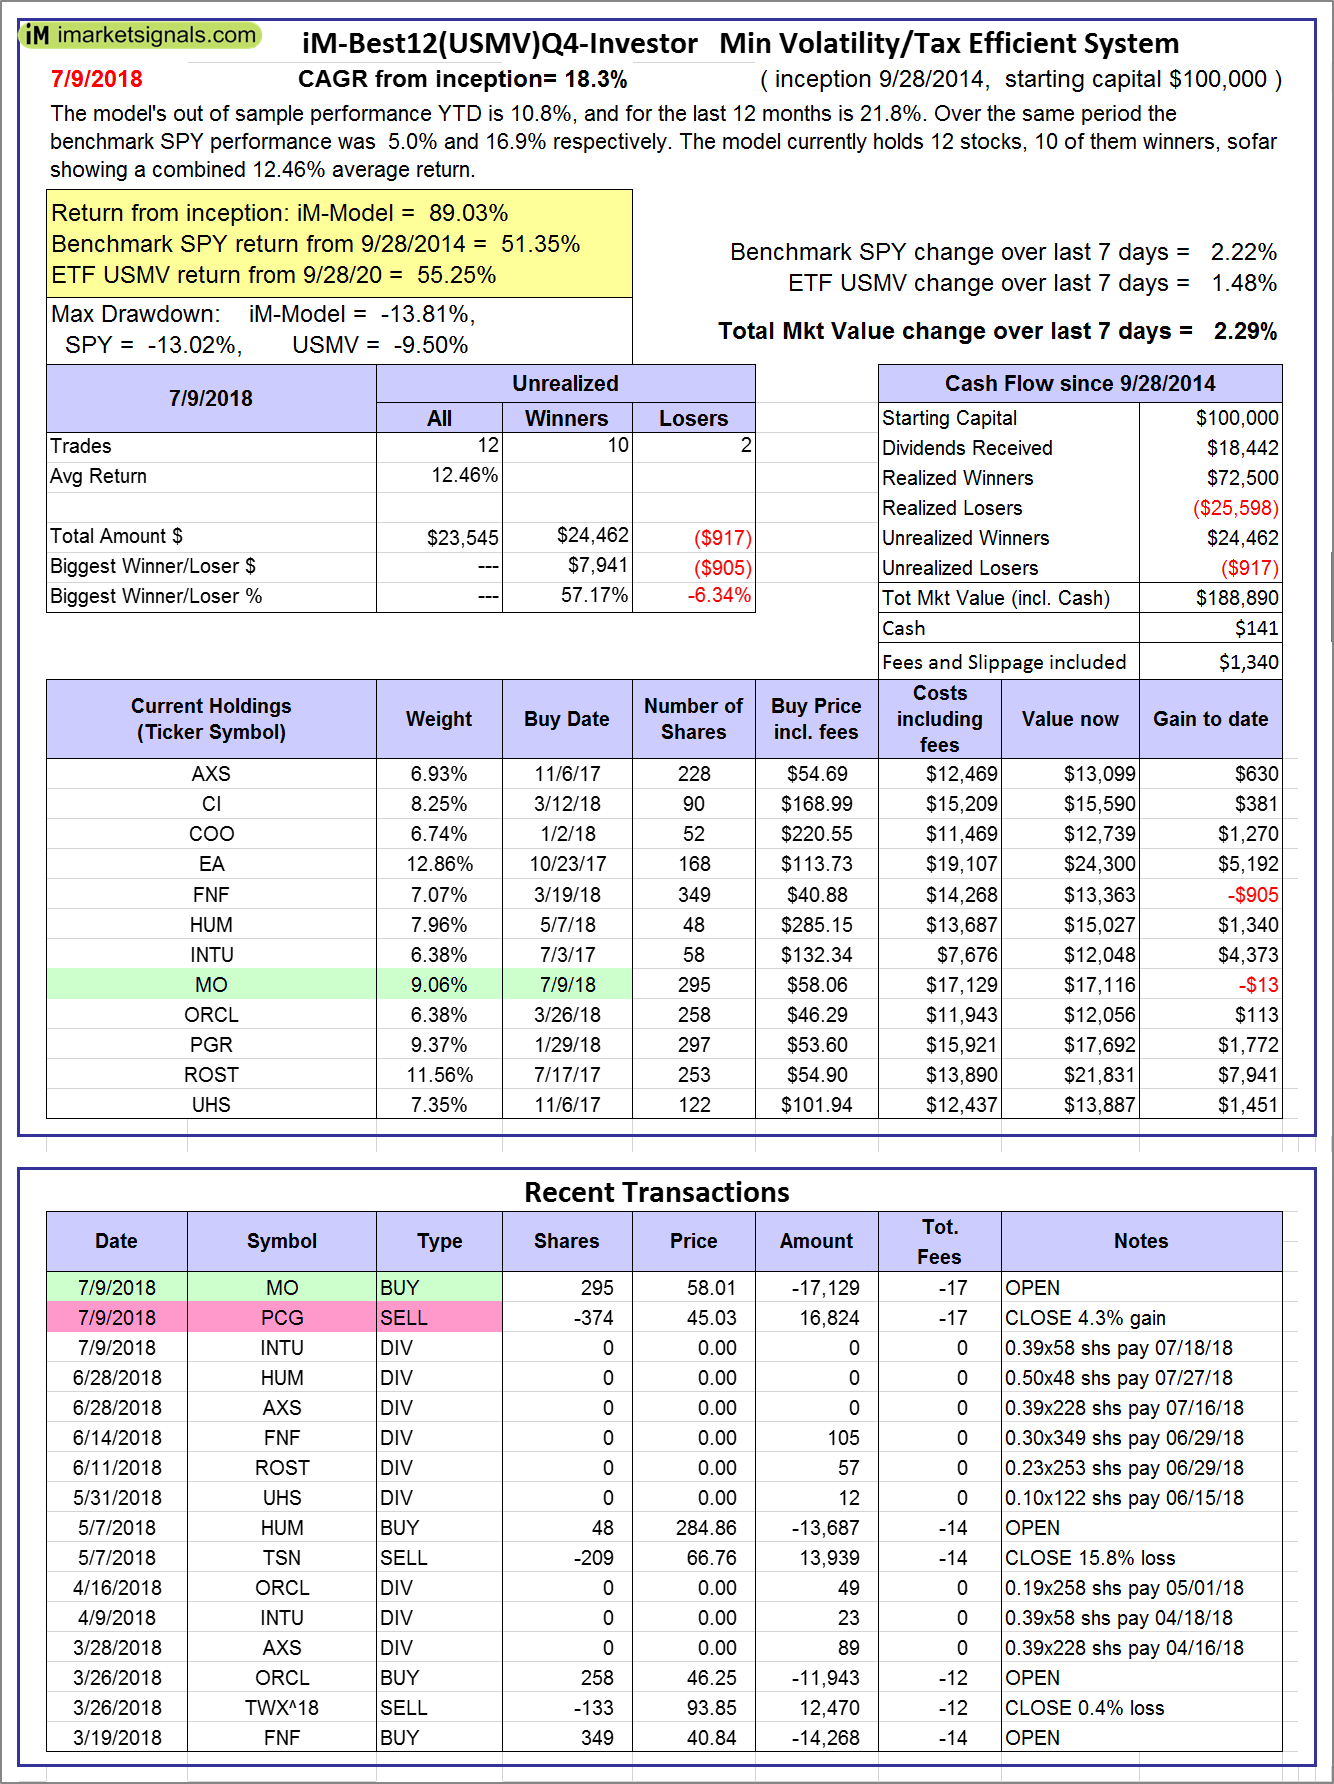
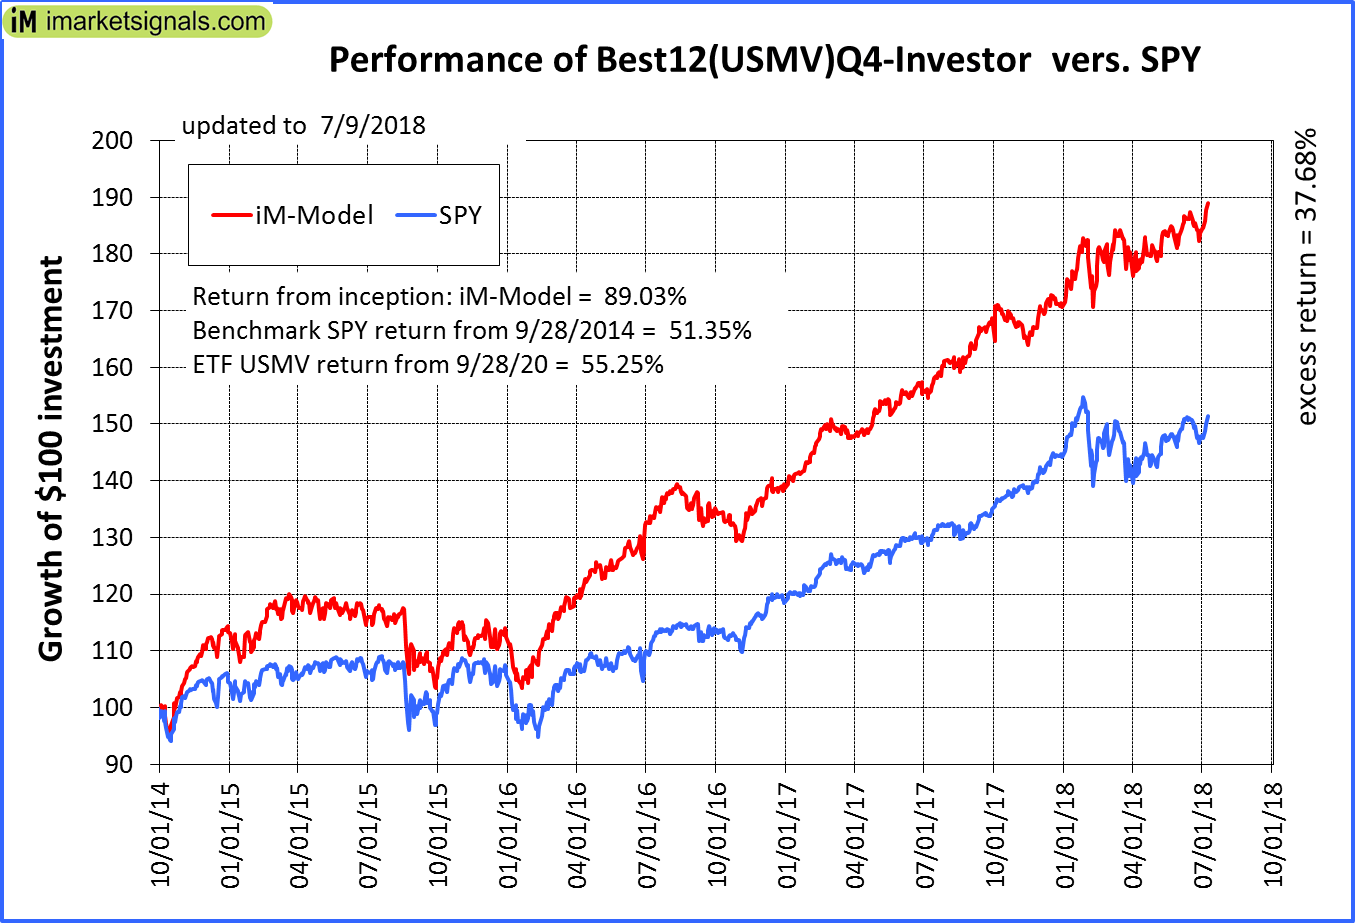
iM-Best12(USMV)Q4-Investor: Since inception, on 9/29/2014, the model gained 89.03% while the benchmark SPY gained 51.35% and the ETF USMV gained 55.25% over the same period. Over the previous week the market value of iM-Best12(USMV)Q4 gained 2.29% at a time when SPY gained 2.22%. A starting capital of $100,000 at inception on 9/29/2014 would have grown to $188,890 which includes $141 cash and excludes $1,340 spent on fees and slippage. |
|
|
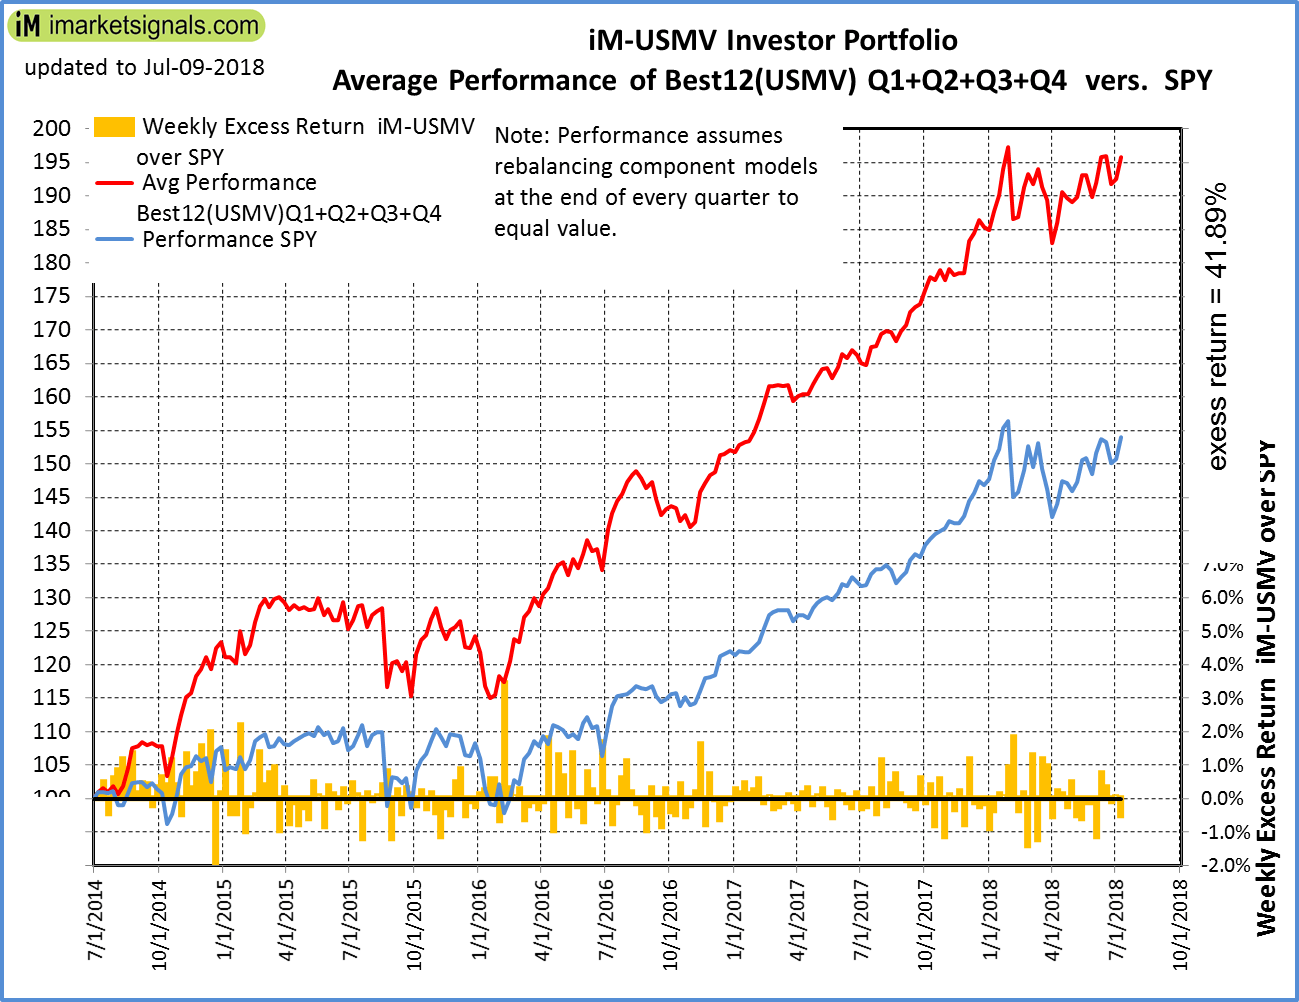
Average Performance of iM-Best12(USMV)Q1+Q2+Q3+Q4-Investor resulted in an excess return of 41.89% over SPY. (see iM-USMV Investor Portfolio) |
|
|
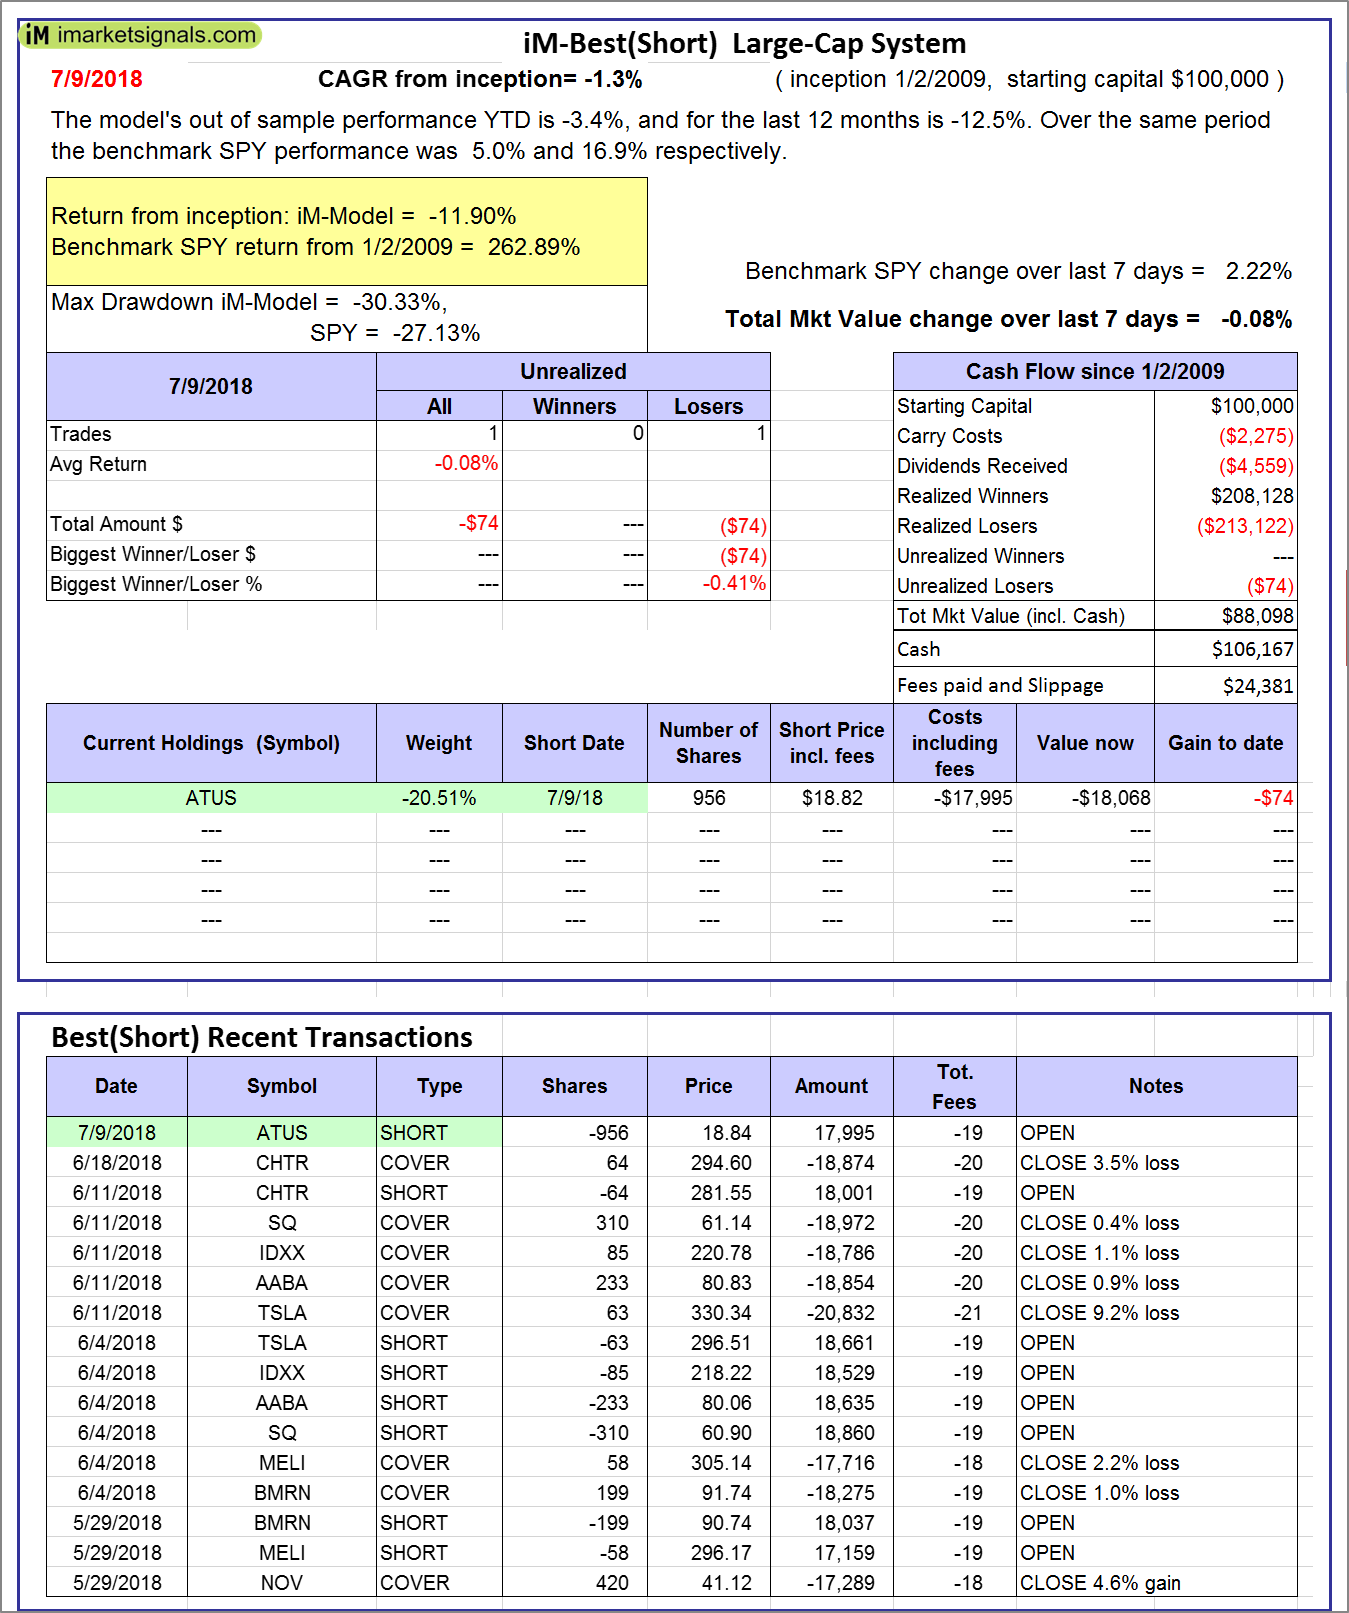
iM-Best(Short): The model’s out of sample performance YTD is -3.4%, and for the last 12 months is -12.5%. Over the same period the benchmark SPY performance was 5.0% and 16.9% respectively. Over the previous week the market value of iM-Best(Short) gained -0.08% at a time when SPY gained 2.22%. Over the period 1/2/2009 to 7/9/2018 the starting capital of $100,000 would have grown to $88,098 which includes $106,167 cash and excludes $24,381 spent on fees and slippage. |
|
|
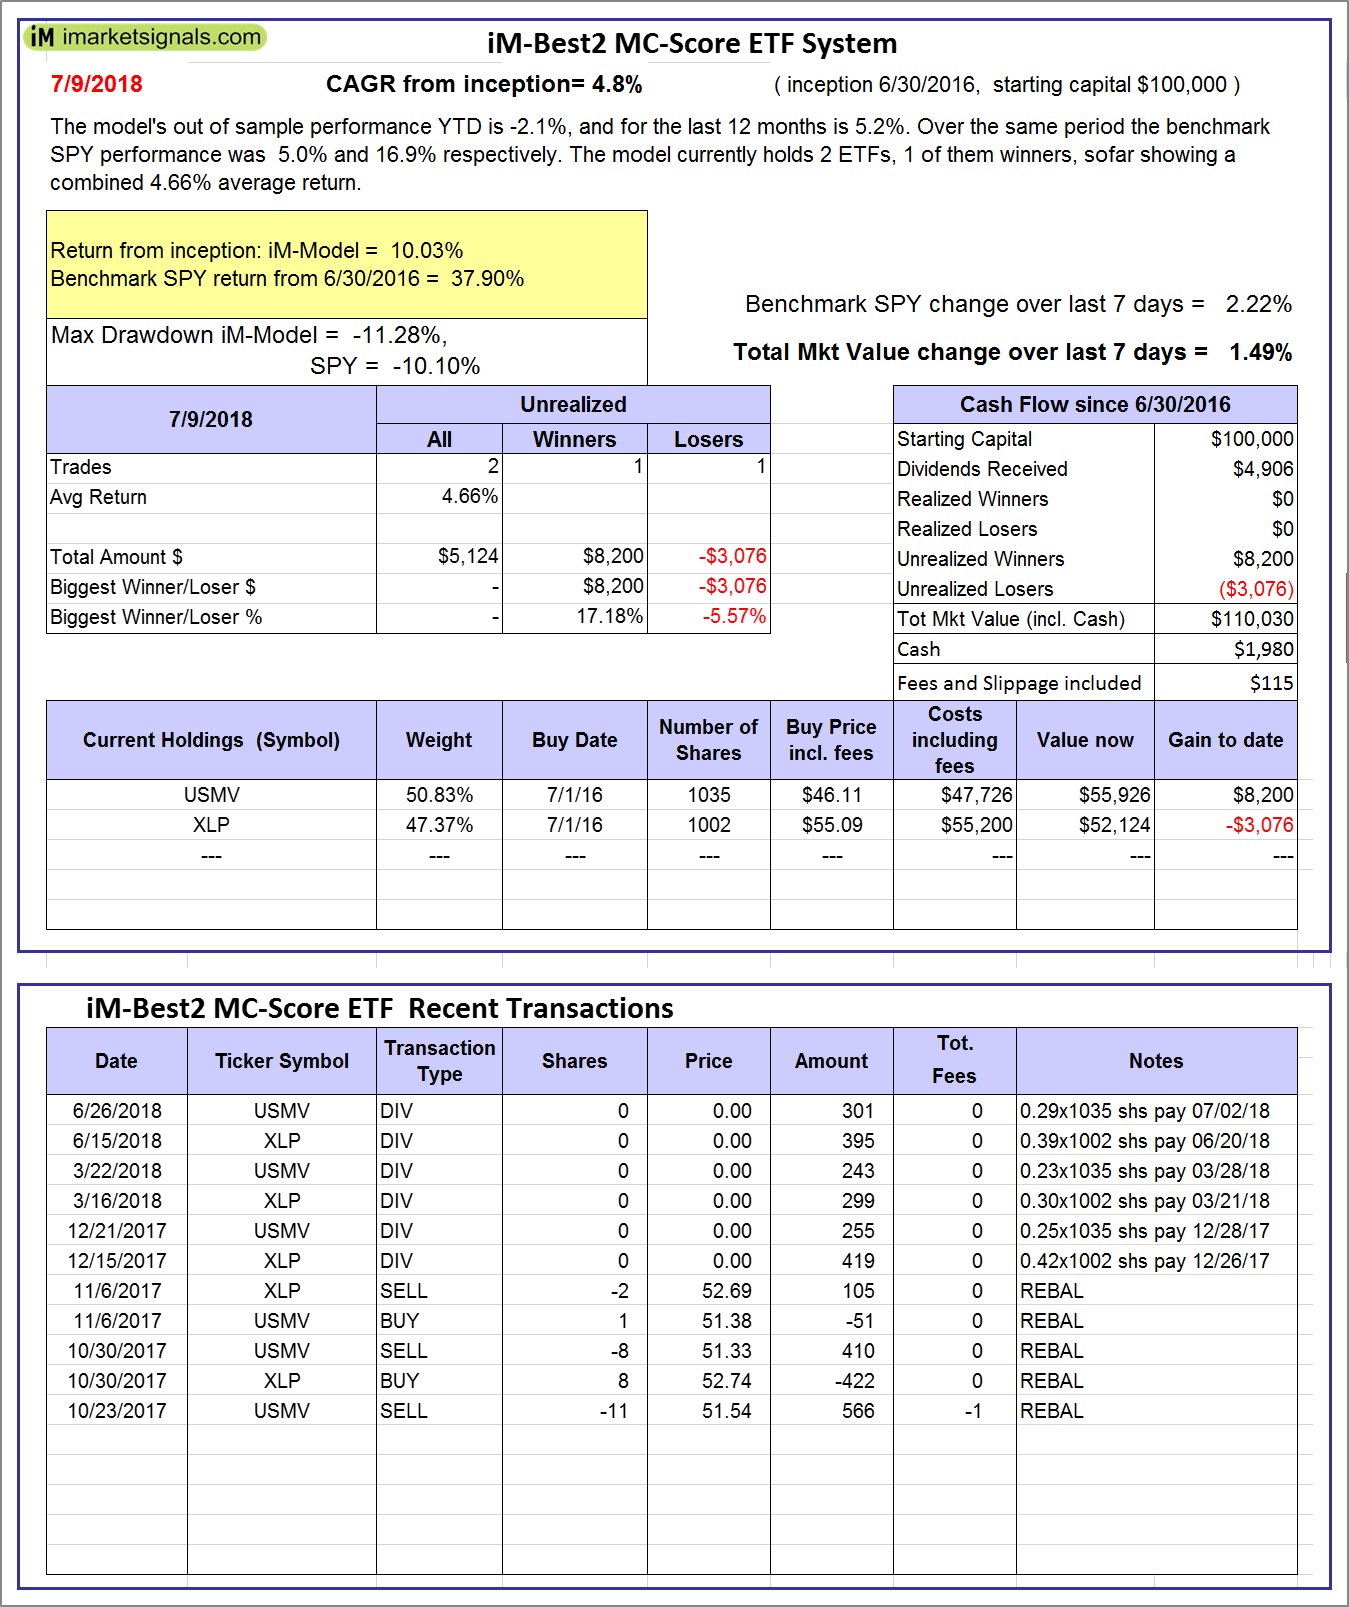
iM-Best2 MC-Score ETF System: The model’s out of sample performance YTD is -2.1%, and for the last 12 months is 5.2%. Over the same period the benchmark SPY performance was 5.0% and 16.9% respectively. Over the previous week the market value of the iM-Best2 MC-Score ETF System gained 1.49% at a time when SPY gained 2.22%. A starting capital of $100,000 at inception on 6/30/2016 would have grown to $110,030 which includes $1,980 cash and excludes $115 spent on fees and slippage. |
|
|
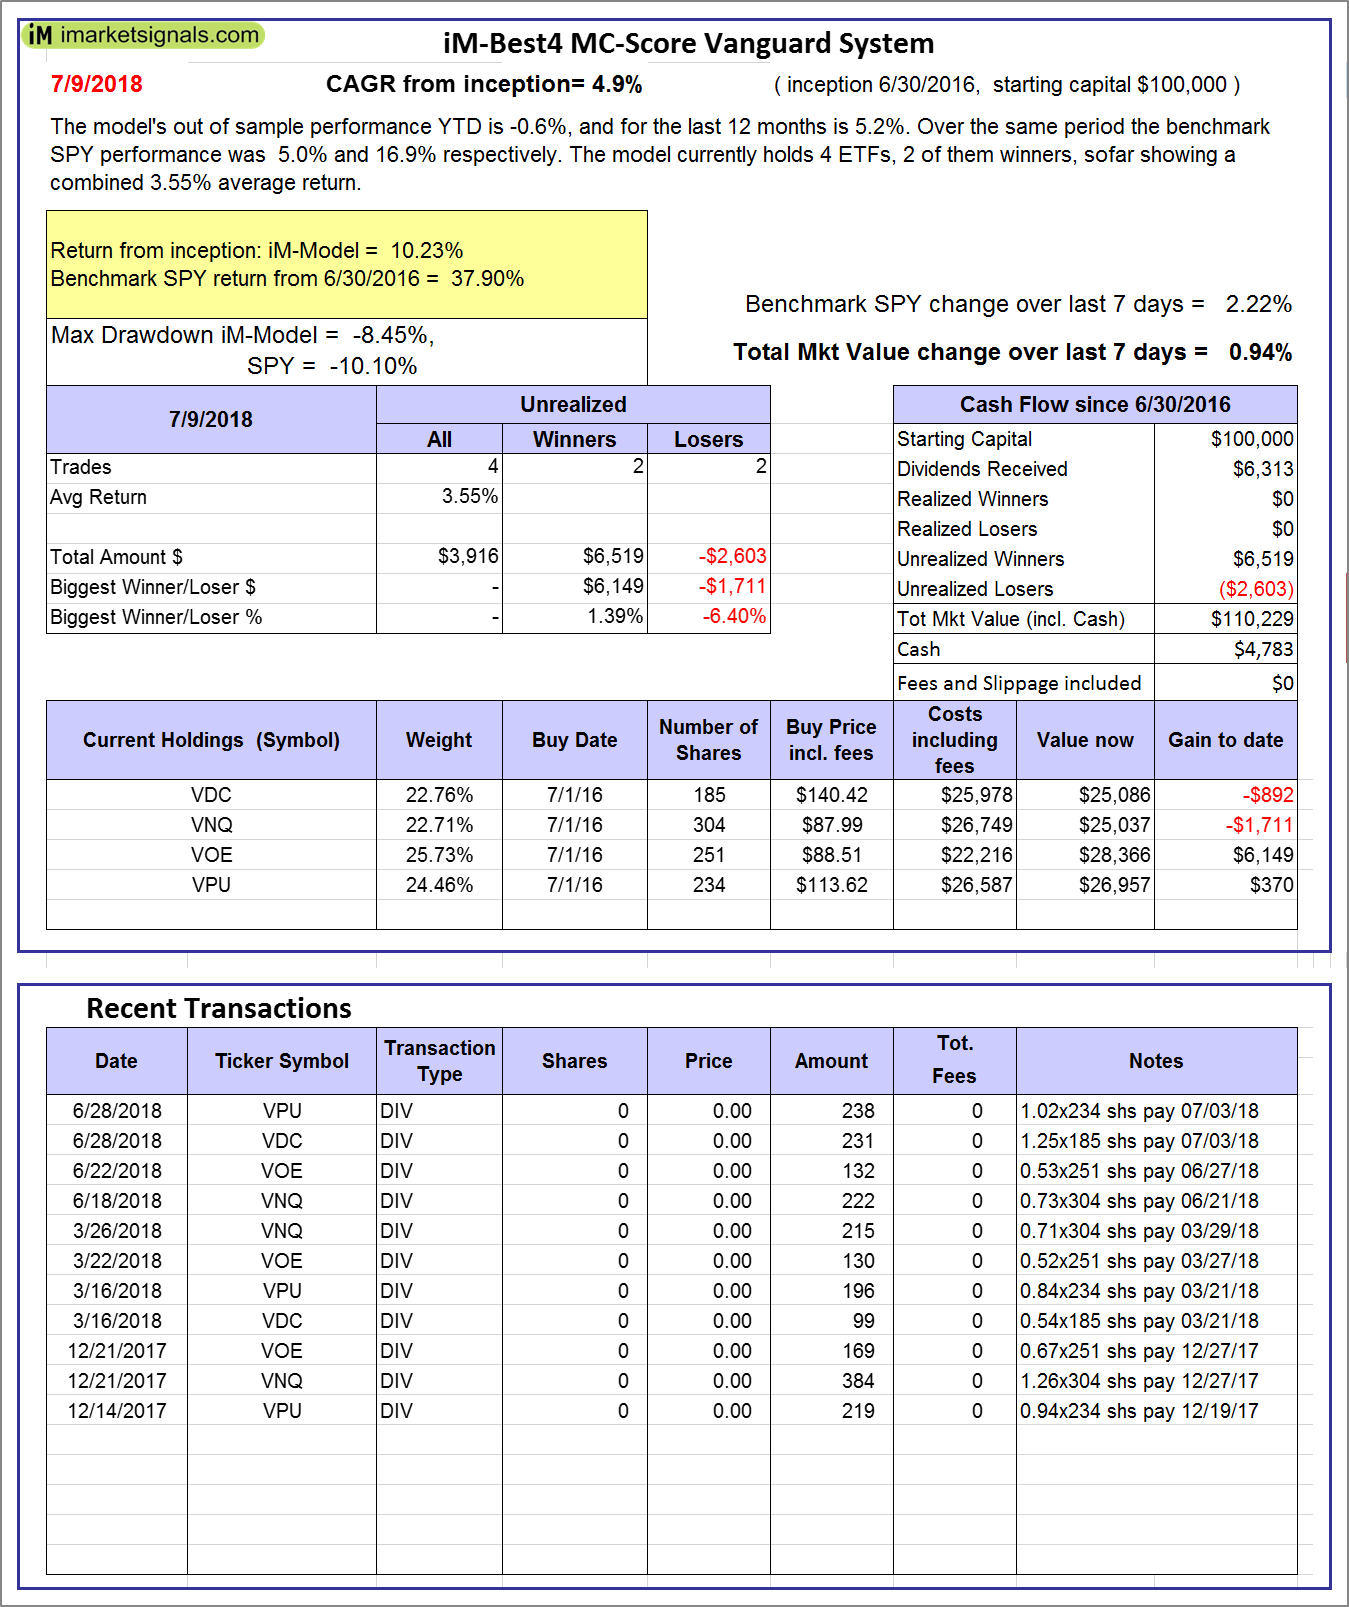
iM-Best4 MC-Score Vanguard System: The model’s out of sample performance YTD is -0.6%, and for the last 12 months is 5.2%. Over the same period the benchmark SPY performance was 5.0% and 16.9% respectively. Over the previous week the market value of the iM-Best4 MC-Score Vanguard System gained 0.94% at a time when SPY gained 2.22%. A starting capital of $100,000 at inception on 6/30/2016 would have grown to $110,229 which includes $4,783 cash and excludes $00 spent on fees and slippage. |
|
|
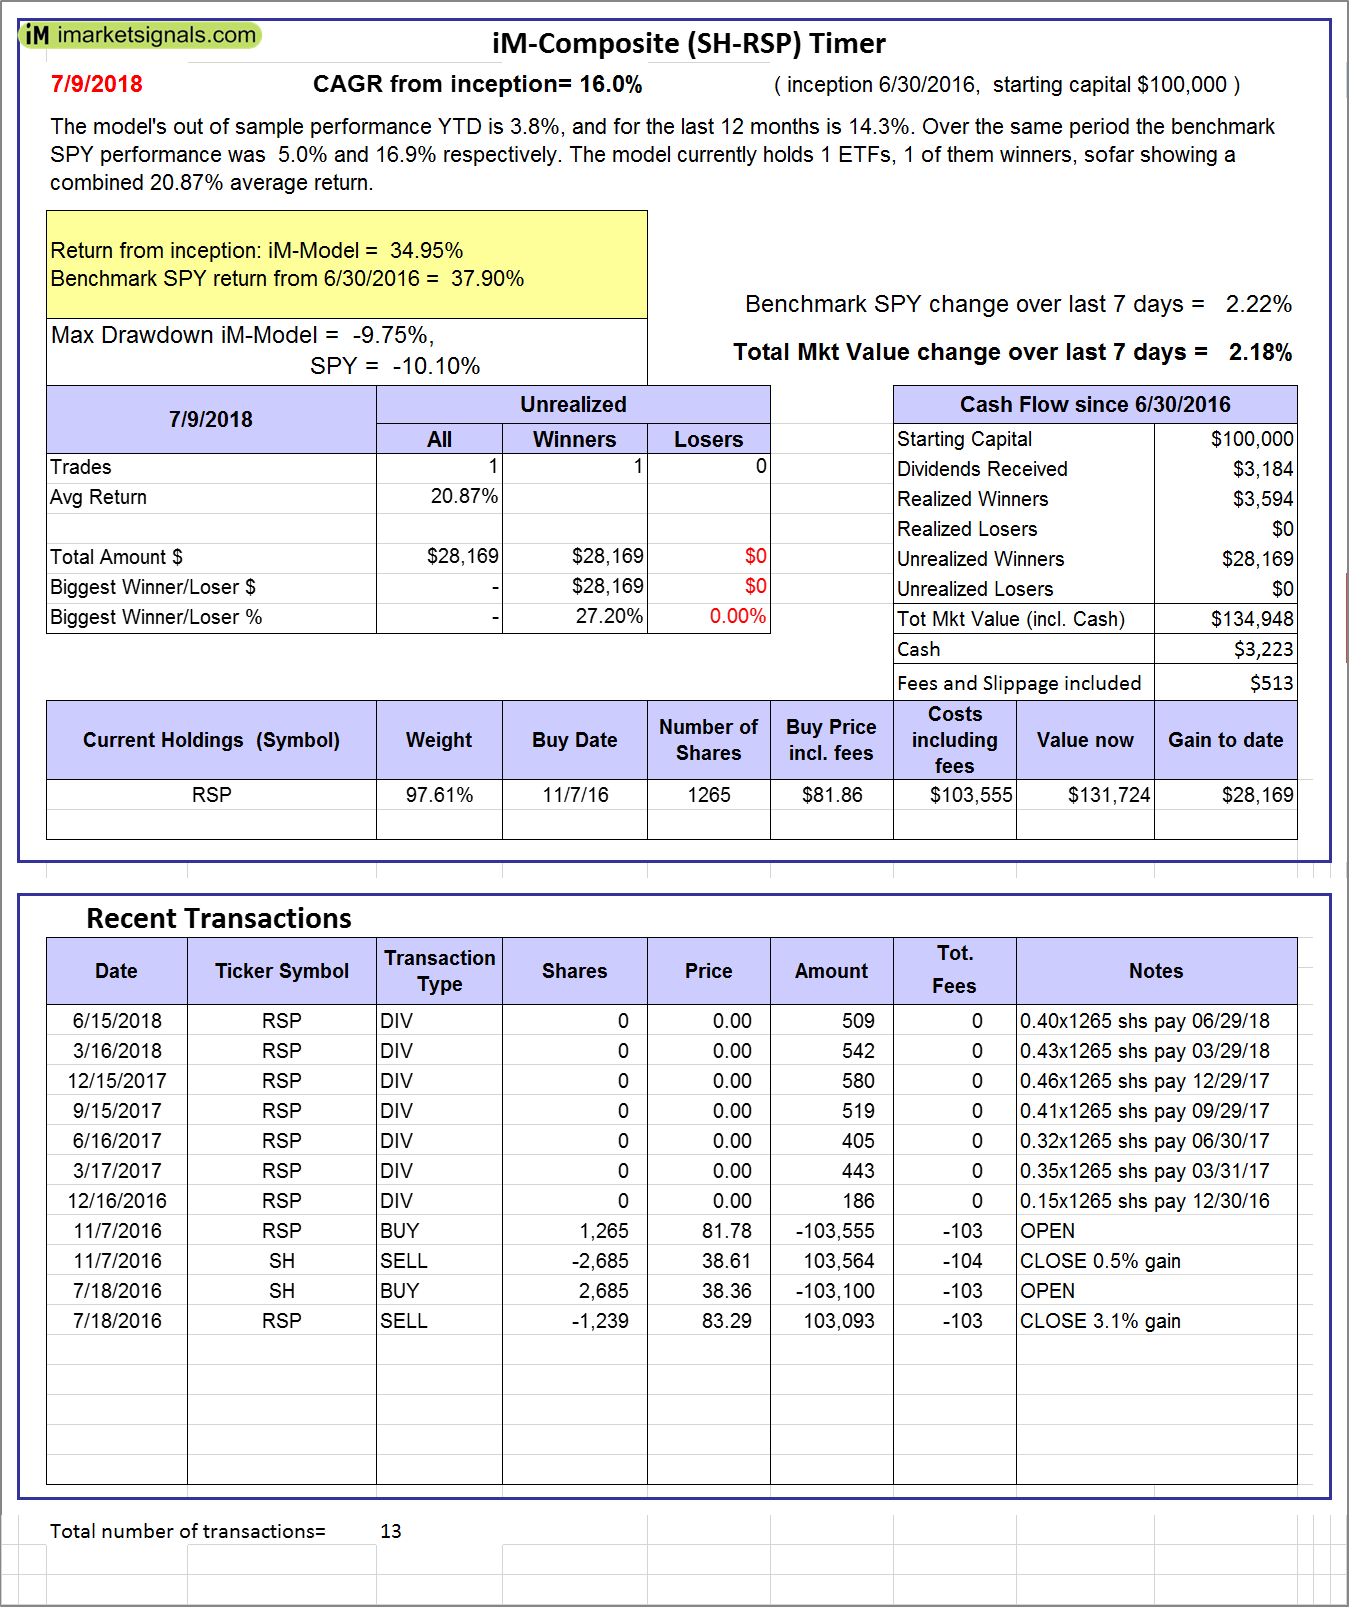
iM-Composite (SH-RSP) Timer: The model’s out of sample performance YTD is 3.8%, and for the last 12 months is 14.3%. Over the same period the benchmark SPY performance was 5.0% and 16.9% respectively. Over the previous week the market value of the iM-Composite (SH-RSP) Timer gained 2.18% at a time when SPY gained 2.22%. A starting capital of $100,000 at inception on 6/30/2016 would have grown to $134,948 which includes $3,223 cash and excludes $513 spent on fees and slippage. |
|
|
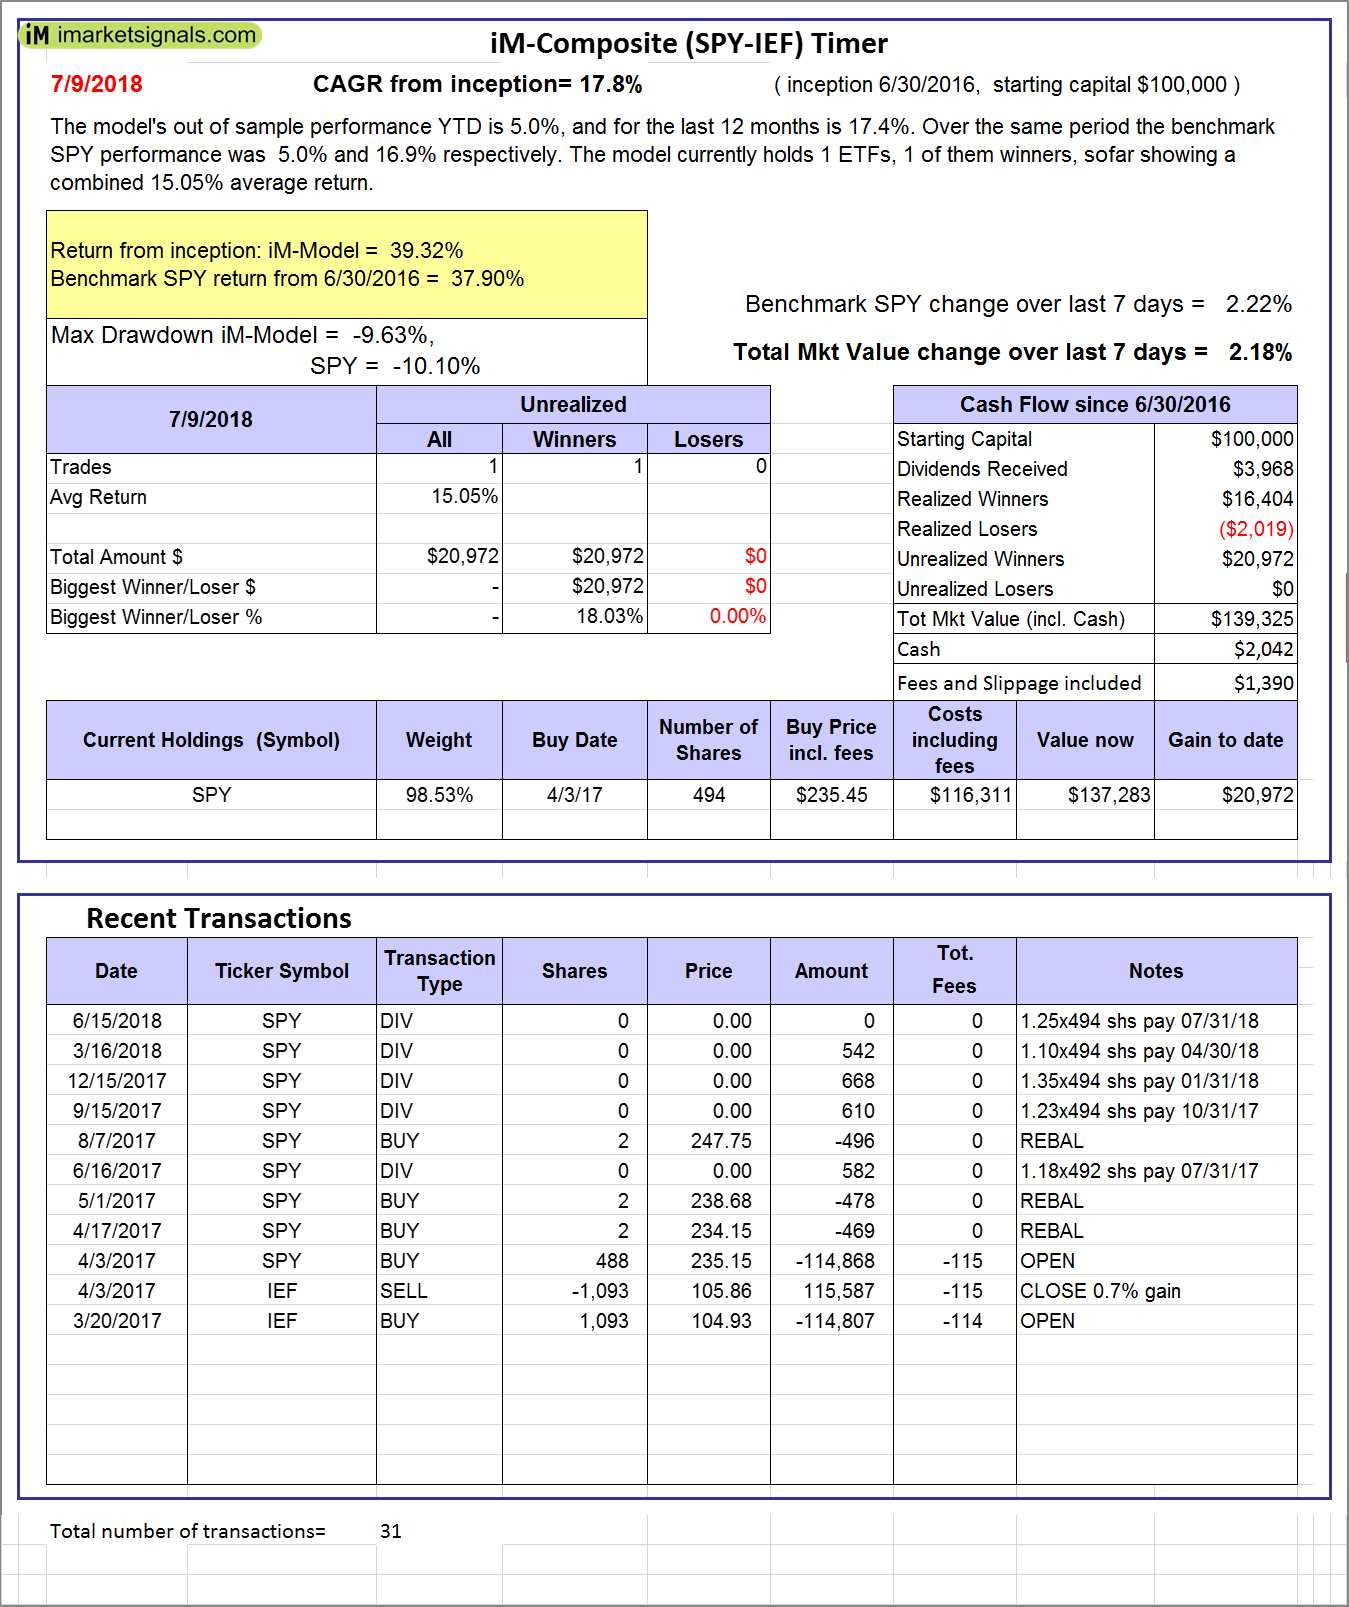
iM-Composite (SPY-IEF) Timer: The model’s out of sample performance YTD is 5.0%, and for the last 12 months is 17.4%. Over the same period the benchmark SPY performance was 5.0% and 16.9% respectively. Over the previous week the market value of the iM-Composite (SPY-IEF) Timer gained 2.18% at a time when SPY gained 2.22%. A starting capital of $100,000 at inception on 6/30/2016 would have grown to $139,325 which includes $2,042 cash and excludes $1,390 spent on fees and slippage. |
|
|
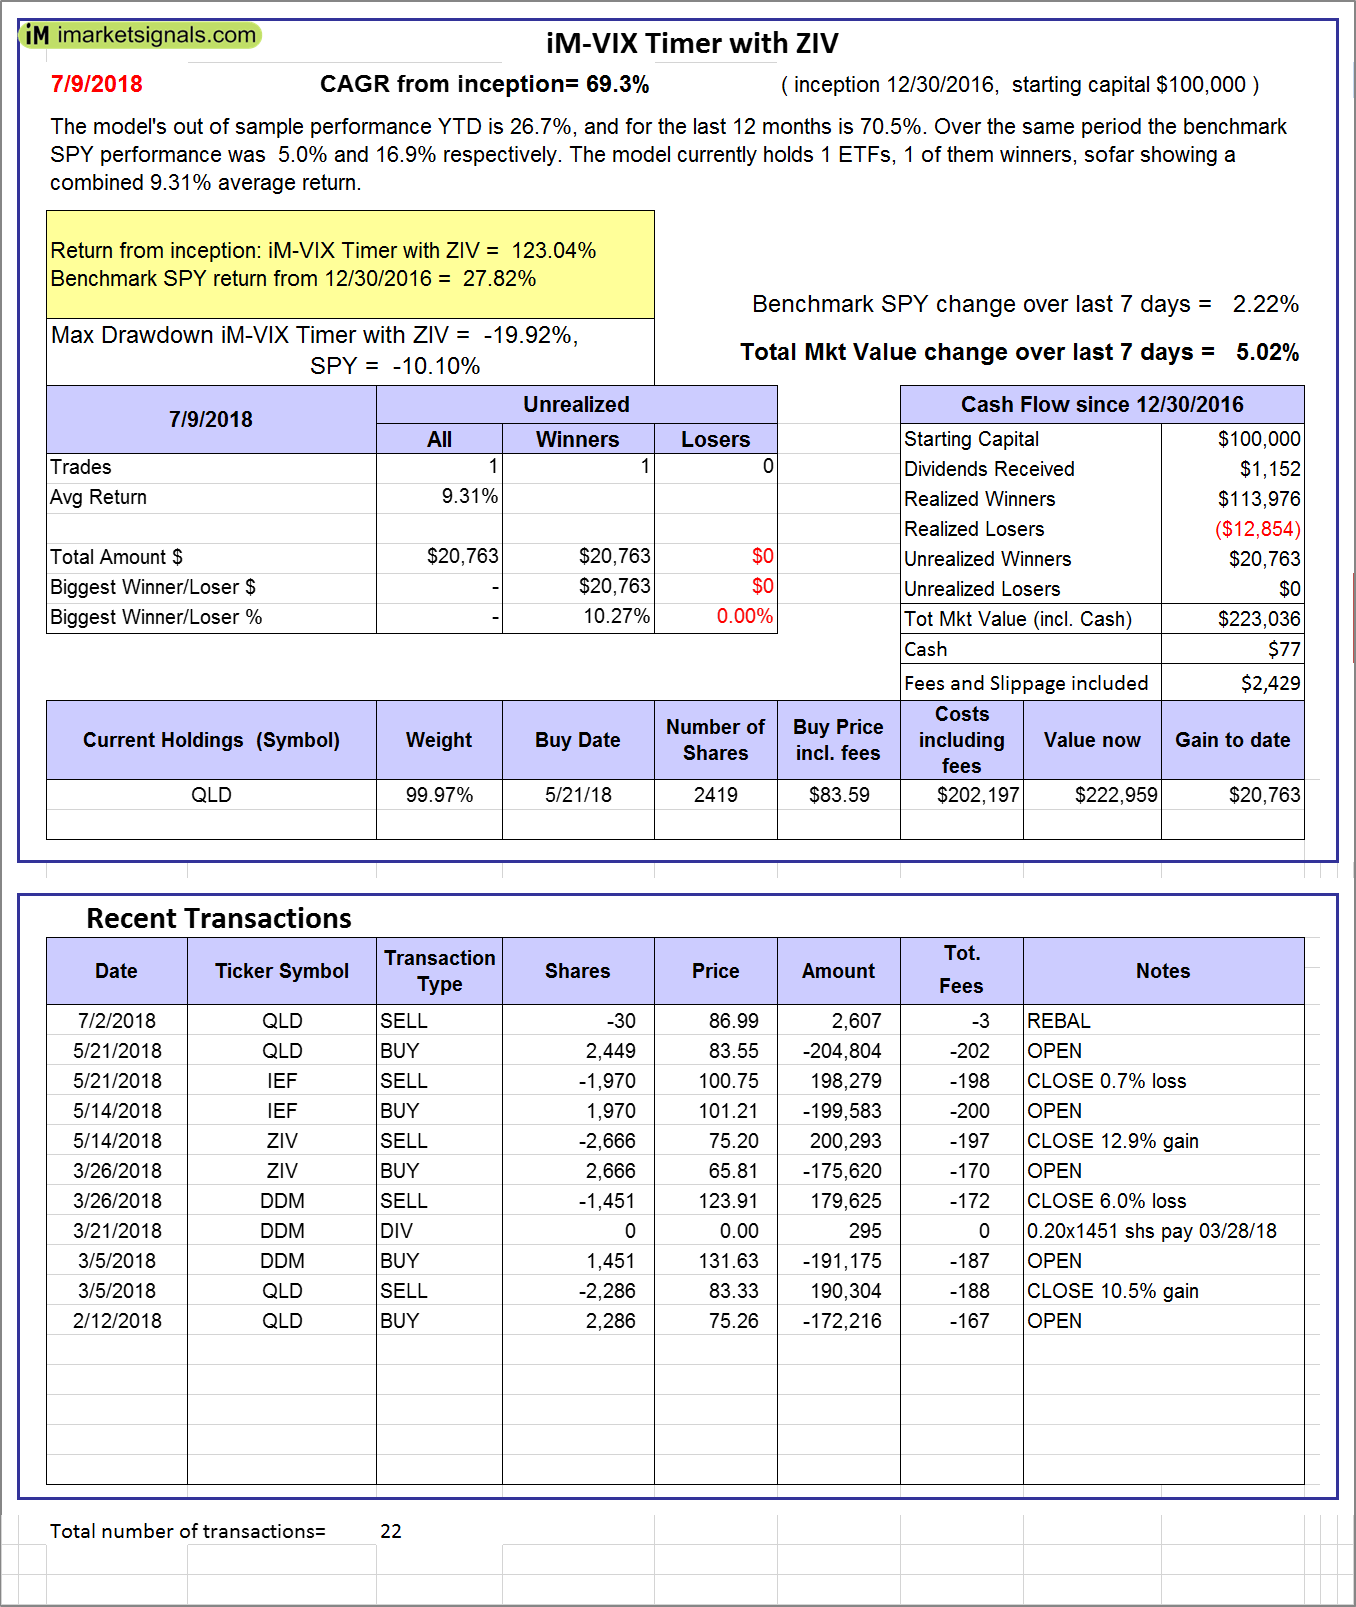
iM-VIX Timer with ZIV: The model’s out of sample performance YTD is 26.7%, and for the last 12 months is 70.5%. Over the same period the benchmark SPY performance was 5.0% and 16.9% respectively. Over the previous week the market value of the iM-VIX Timer with ZIV gained 5.02% at a time when SPY gained 2.22%. A starting capital of $100,000 at inception on 6/30/2016 would have grown to $223,036 which includes $77 cash and excludes $2,429 spent on fees and slippage. |
|
|
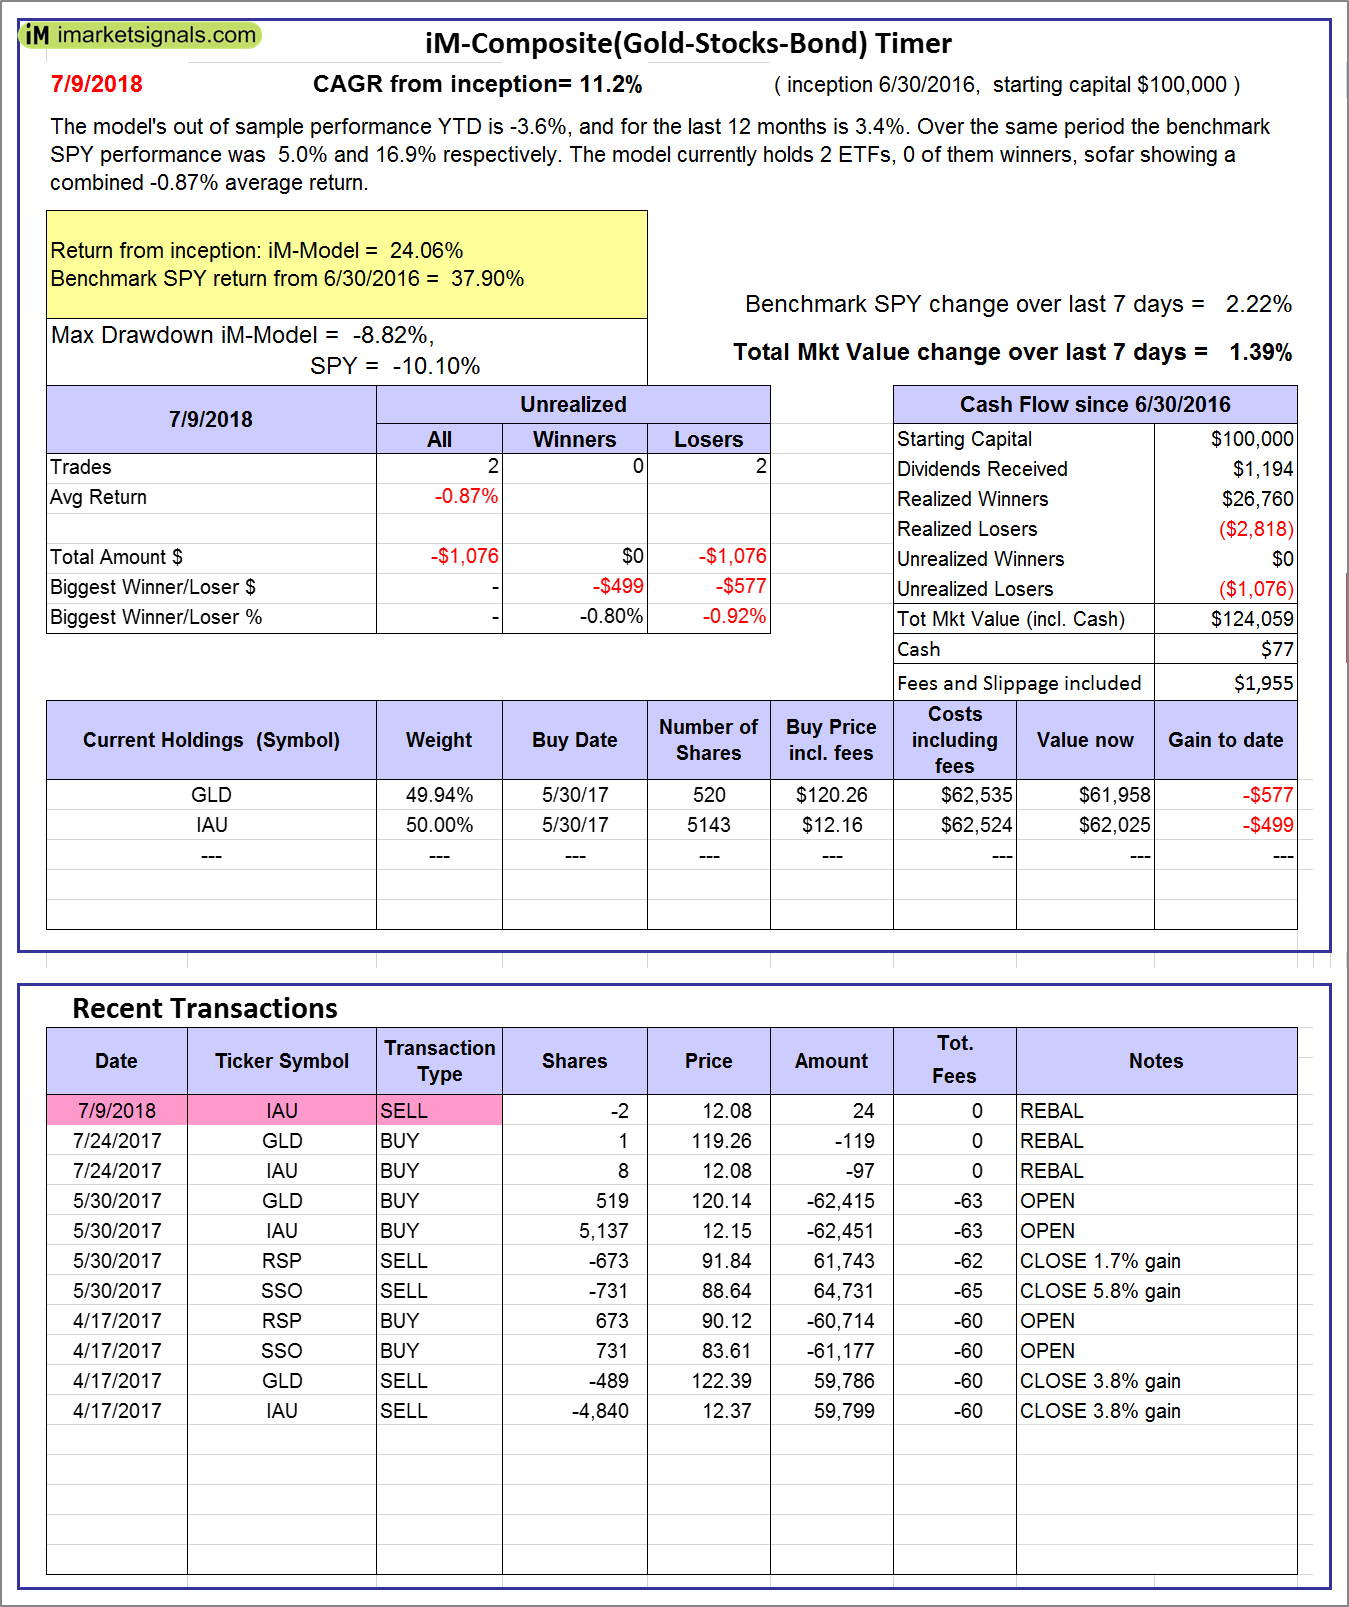
iM-Composite(Gold-Stocks-Bond) Timer: The model’s out of sample performance YTD is -3.6%, and for the last 12 months is 3.4%. Over the same period the benchmark SPY performance was 5.0% and 16.9% respectively. Over the previous week the market value of the iM-Composite(Gold-Stocks-Bond) Timer gained 1.39% at a time when SPY gained 2.22%. A starting capital of $100,000 at inception on 6/30/2016 would have grown to $124,059 which includes $77 cash and excludes $1,955 spent on fees and slippage. |
|
|
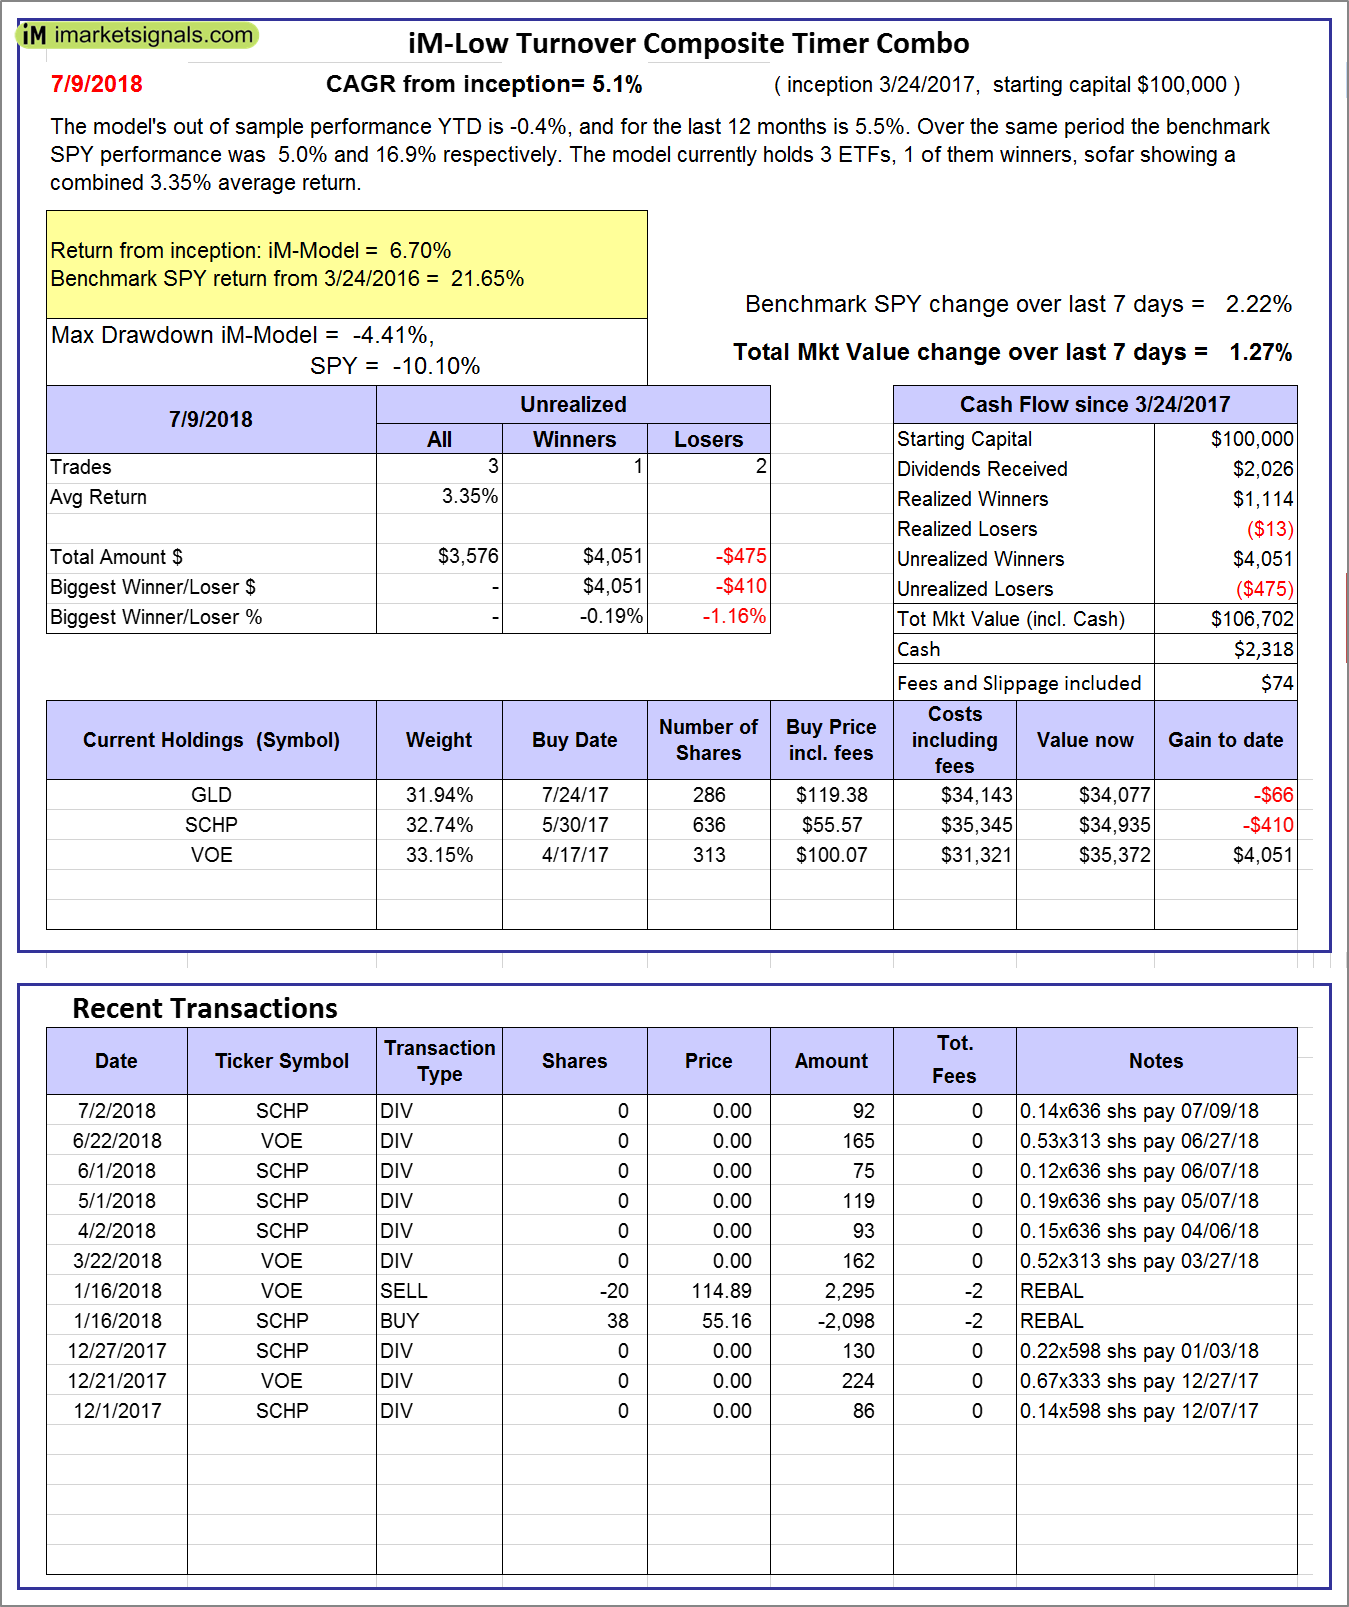
iM-Low Turnover Composite Timer Combo: The model’s out of sample performance YTD is -0.4%, and for the last 12 months is 5.5%. Over the same period the benchmark SPY performance was 5.0% and 16.9% respectively. Over the previous week the market value of the iM-Low Turnover Composite Timer Combo gained 1.27% at a time when SPY gained 2.22%. A starting capital of $100,000 at inception on 3/24/27 would have grown to $106,702 which includes $2,318 cash and excludes $74 spent on fees and slippage. |
|
|
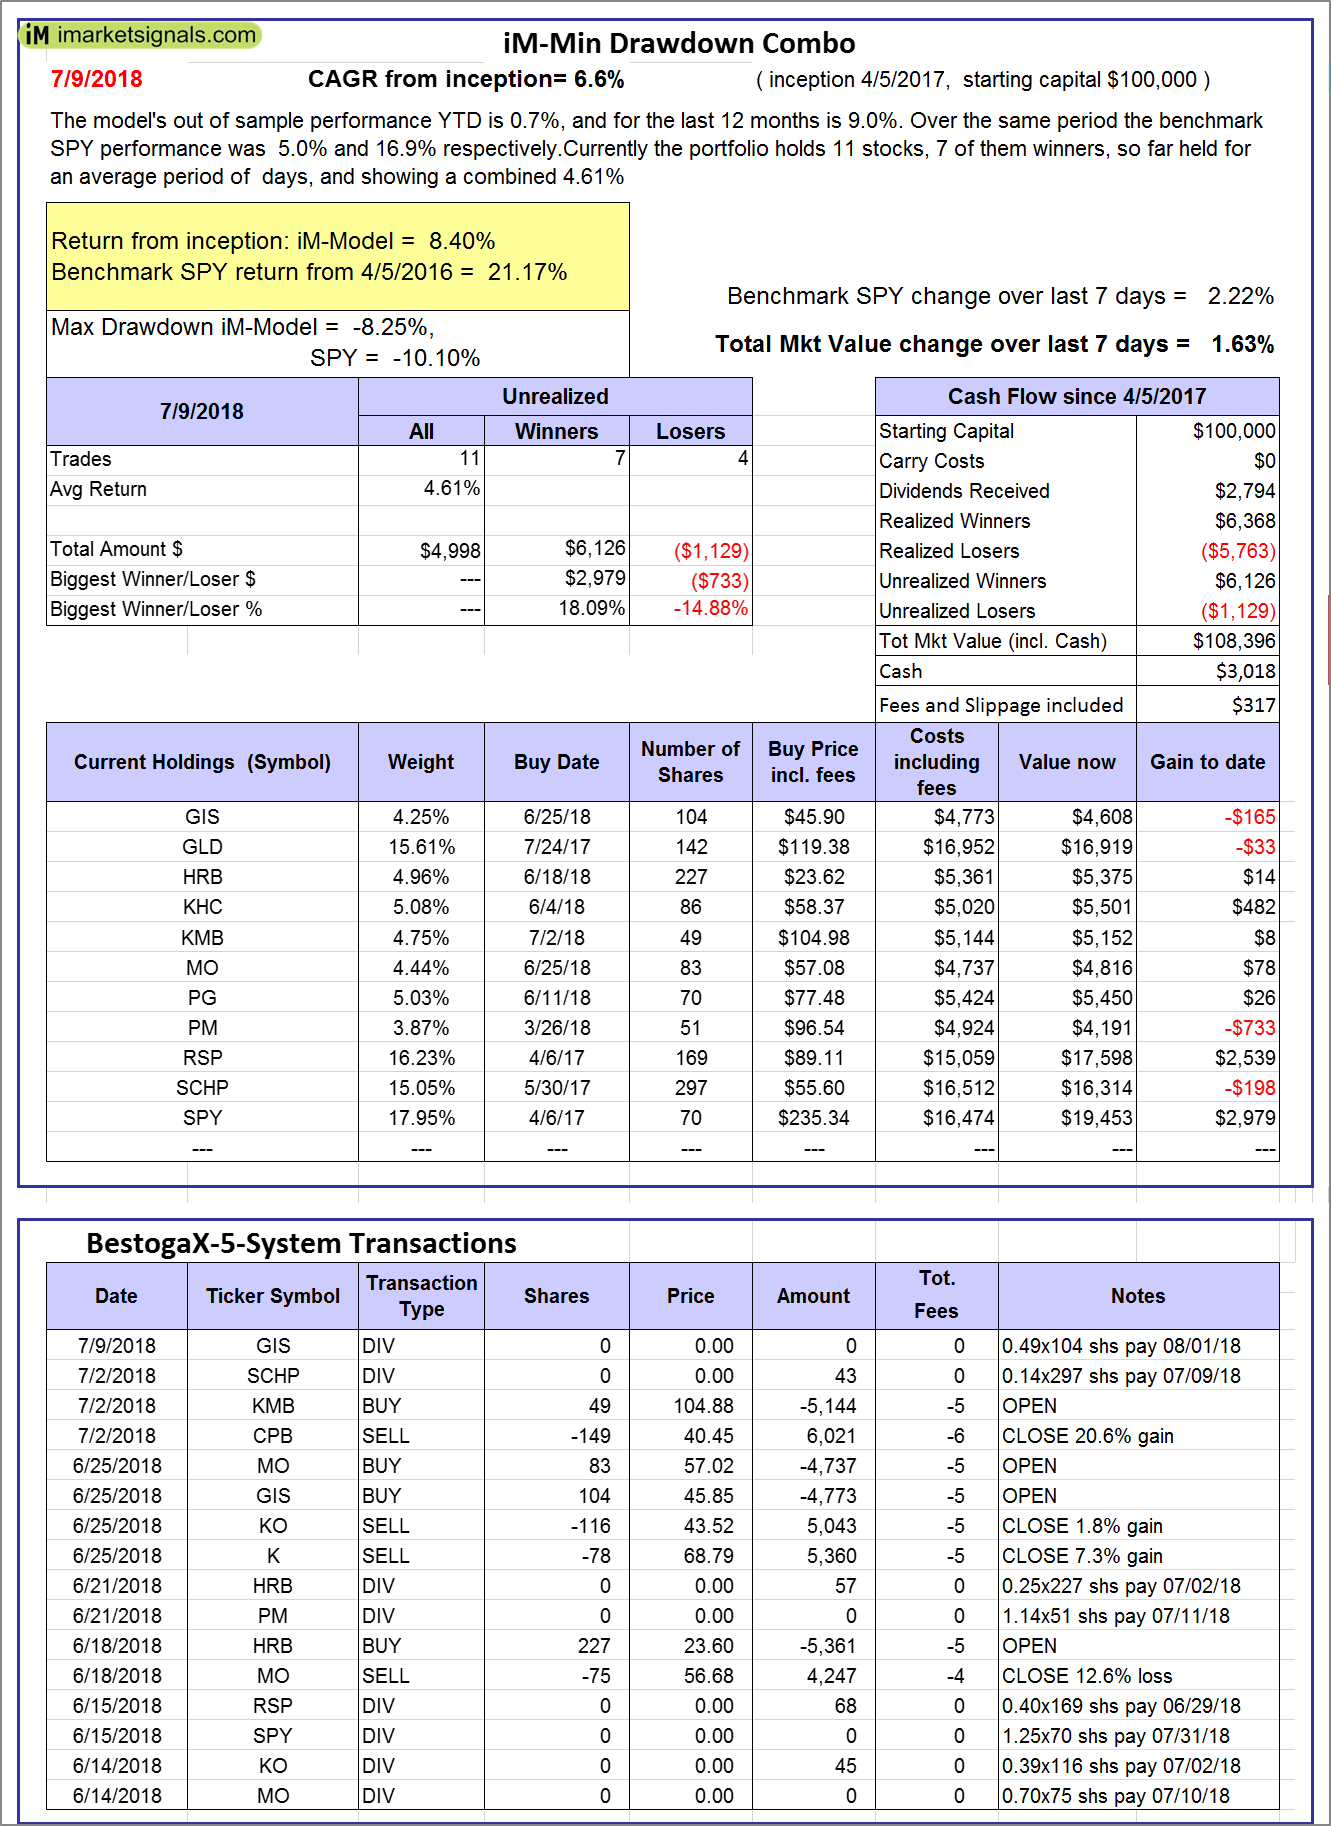
iM-Min Drawdown Combo: The model’s out of sample performance YTD is 0.7%, and for the last 12 months is 9.0%. Over the same period the benchmark SPY performance was 5.0% and 16.9% respectively. Over the previous week the market value of the iM-Min Drawdown Combo gained 1.63% at a time when SPY gained 2.22%. A starting capital of $100,000 at inception on 4/5/2017 would have grown to $108,396 which includes $3,018 cash and excludes $317 spent on fees and slippage. |
|
|
iM-5ETF Trader (includes leveraged ETFs): The model’s out of sample performance YTD is 11.2%, and for the last 12 months is 35.8%. Over the same period the benchmark SPY performance was 5.0% and 16.9% respectively. Over the previous week the market value of the iM-5ETF Trader (includes leveraged ETFs) gained 4.43% at a time when SPY gained 2.22%. A starting capital of $100,000 at inception on 10/30/2016 would have grown to $180,984 which includes $1,539 cash and excludes $1,030 spent on fees and slippage. |
|
|
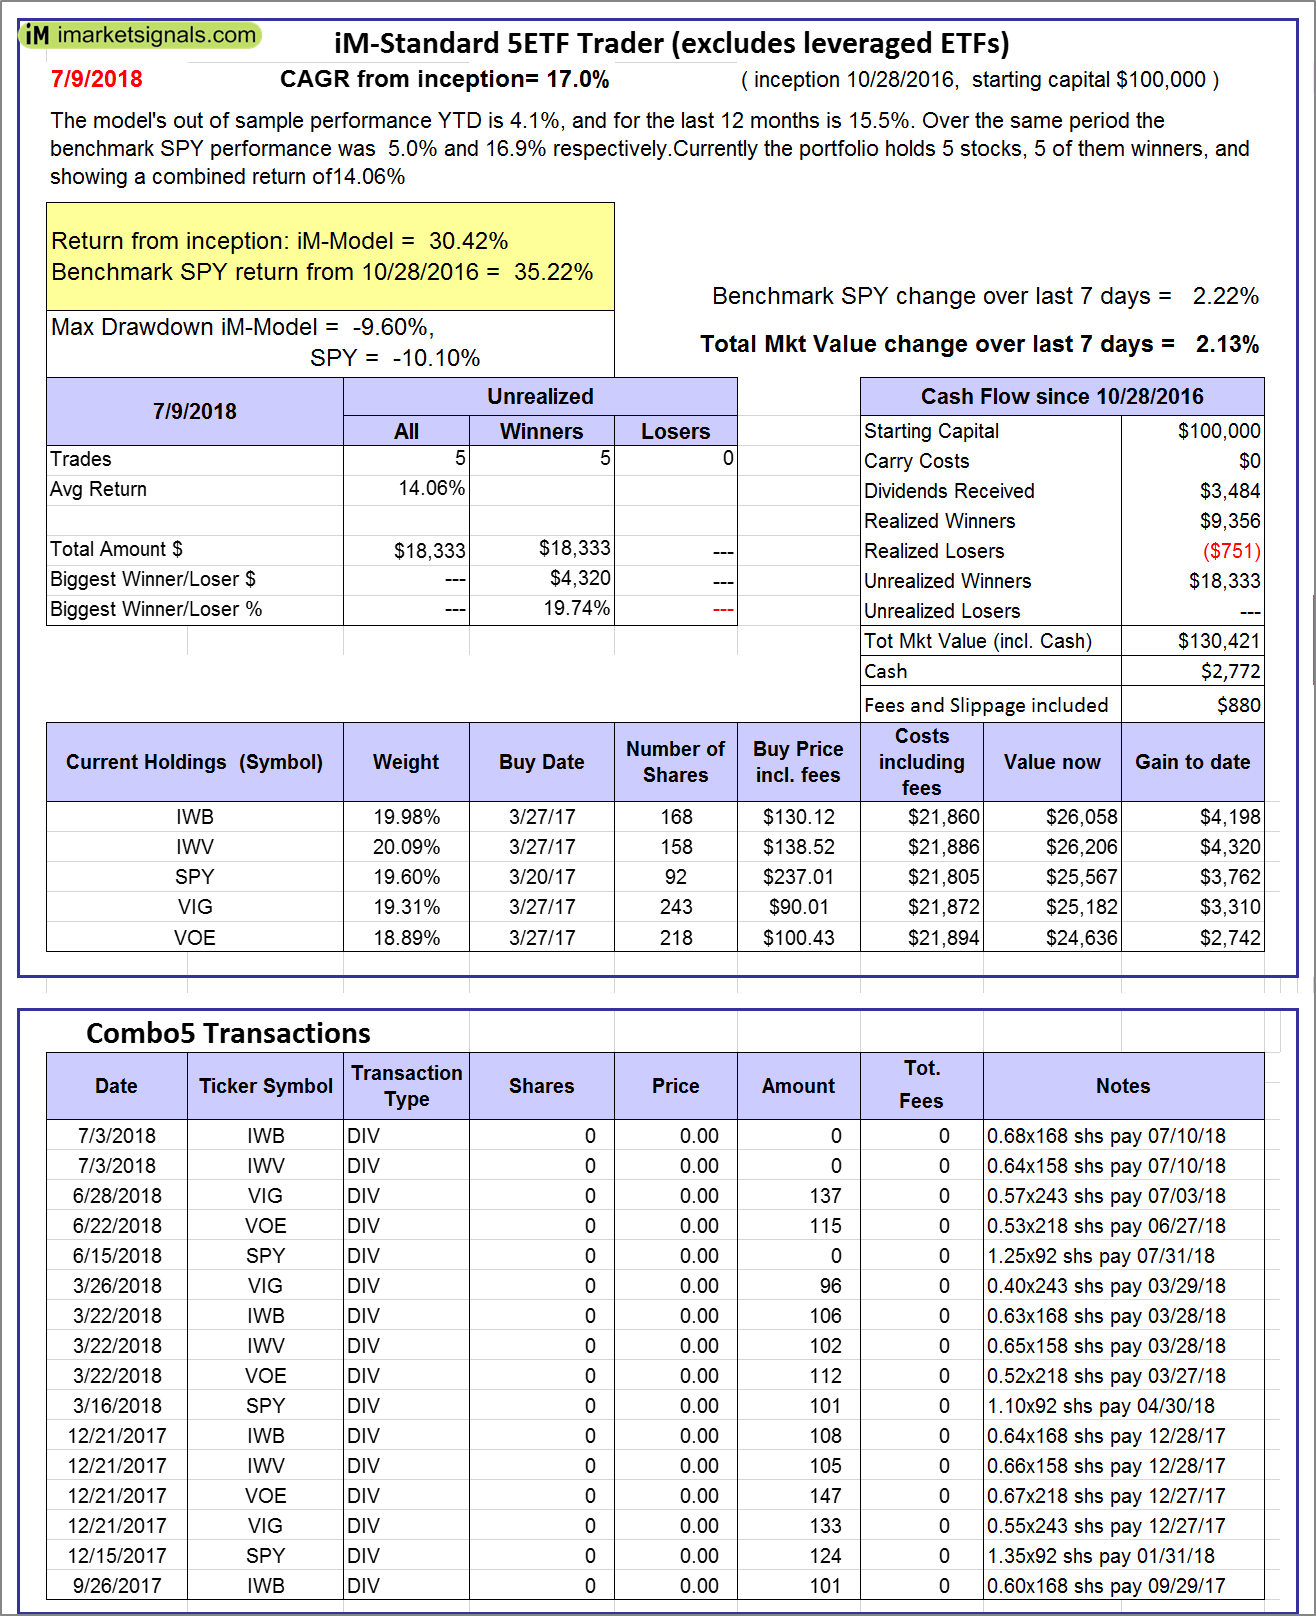
iM-Standard 5ETF Trader (excludes leveraged ETFs): The model’s out of sample performance YTD is 4.1%, and for the last 12 months is 15.5%. Over the same period the benchmark SPY performance was 5.0% and 16.9% respectively. Over the previous week the market value of the iM-Standard 5ETF Trader (excludes leveraged ETFs) gained 2.13% at a time when SPY gained 2.22%. A starting capital of $100,000 at inception on 10/30/2016 would have grown to $130,421 which includes $2,772 cash and excludes $880 spent on fees and slippage. |


Leave a Reply
You must be logged in to post a comment.