
  |
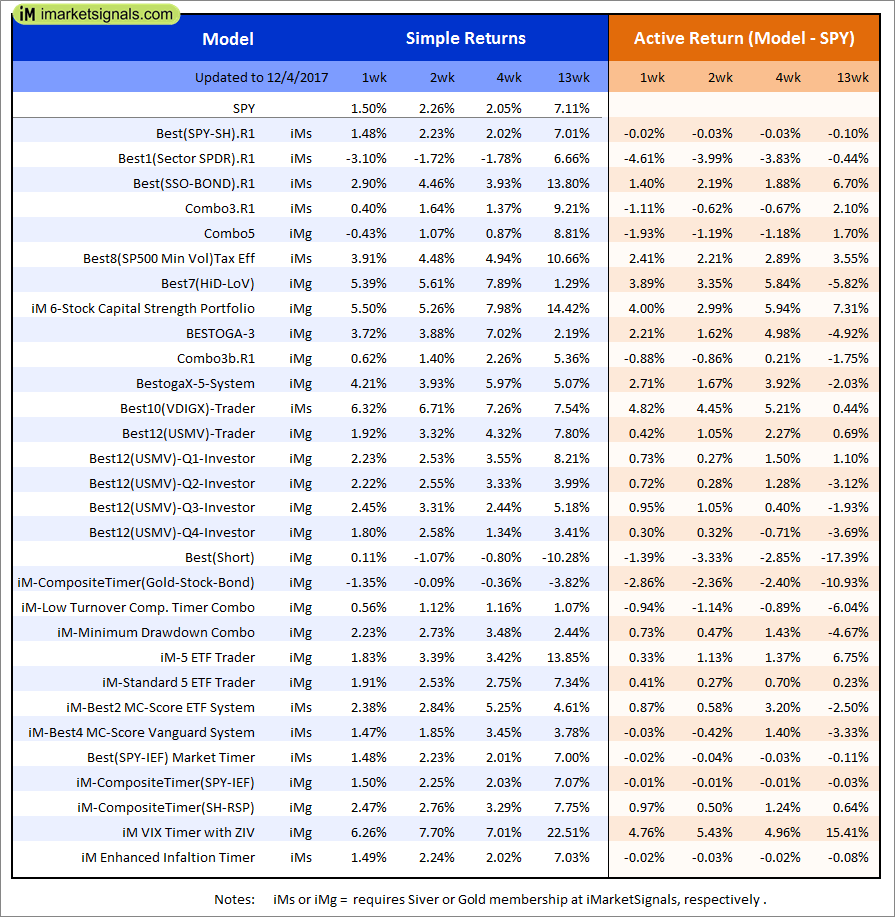
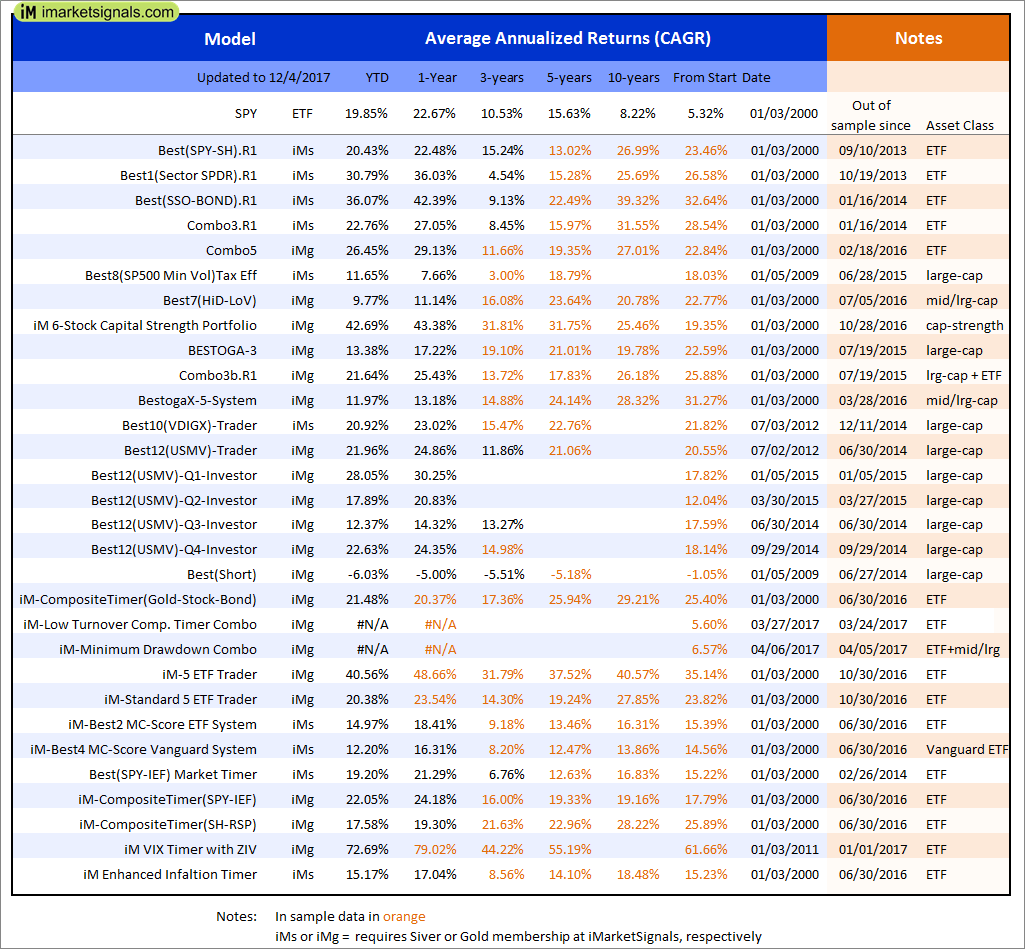
Out of sample performance summary of our models for the past 1, 2, 4 and 13 week periods. The active active return indicates how the models over- or underperformed the benchmark ETF SPY. Also the YTD, and the 1-, 3-, 5- and 10-year annualized returns are shown in the second table |
 |
iM-Best(SPY-SH).R1: The model’s out of sample performance YTD is 20.4%, and for the last 12 months is 22.5%. Over the same period the benchmark SPY performance was 19.9% and 22.7% respectively. Over the previous week the market value of Best(SPY-SH) gained 1.48% at a time when SPY gained 1.50%. A starting capital of $100,000 at inception on 1/2/2009 would have grown to $556,633 which includes $7,222 cash and excludes $15,358 spent on fees and slippage. |
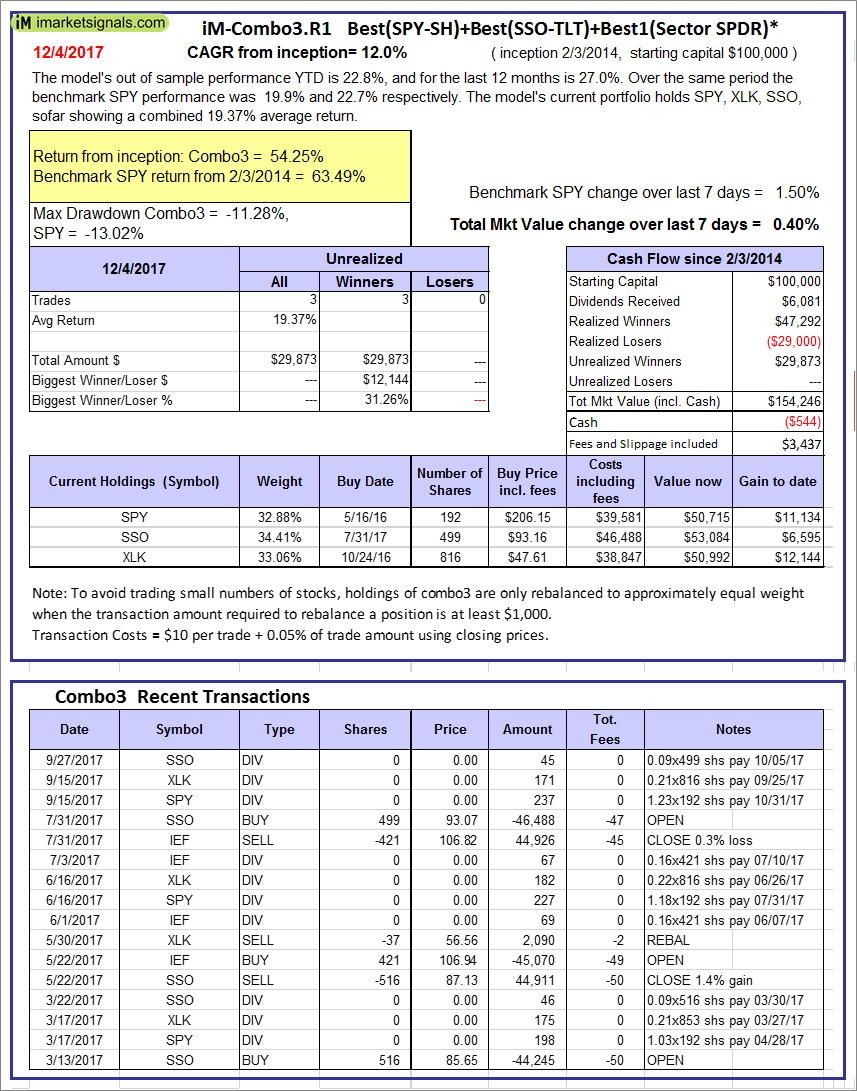 |
iM-Combo3.R1: The model’s out of sample performance YTD is 22.8%, and for the last 12 months is 27.0%. Over the same period the benchmark SPY performance was 19.9% and 22.7% respectively. Over the previous week the market value of iM-Combo3.R1 gained 0.40% at a time when SPY gained 1.50%. A starting capital of $100,000 at inception on 2/3/2014 would have grown to $154,246 which includes -$544 cash and excludes $3,437 spent on fees and slippage. |
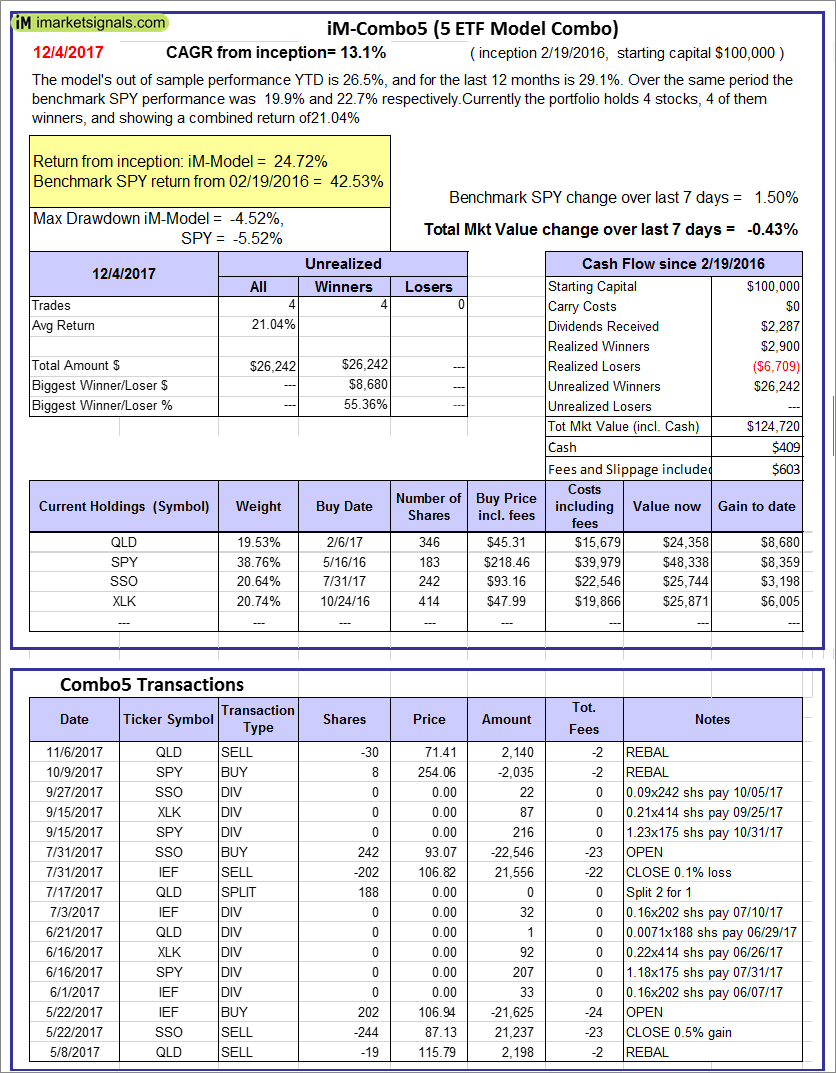 |
iM-Combo5: The model’s out of sample performance YTD is 26.5%, and for the last 12 months is 29.1%. Over the same period the benchmark SPY performance was 19.9% and 22.7% respectively. Over the previous week the market value of iM-Combo5 gained -0.43% at a time when SPY gained 1.50%. A starting capital of $100,000 at inception on 2/22/2016 would have grown to $124,720 which includes $409 cash and excludes $603 spent on fees and slippage. |
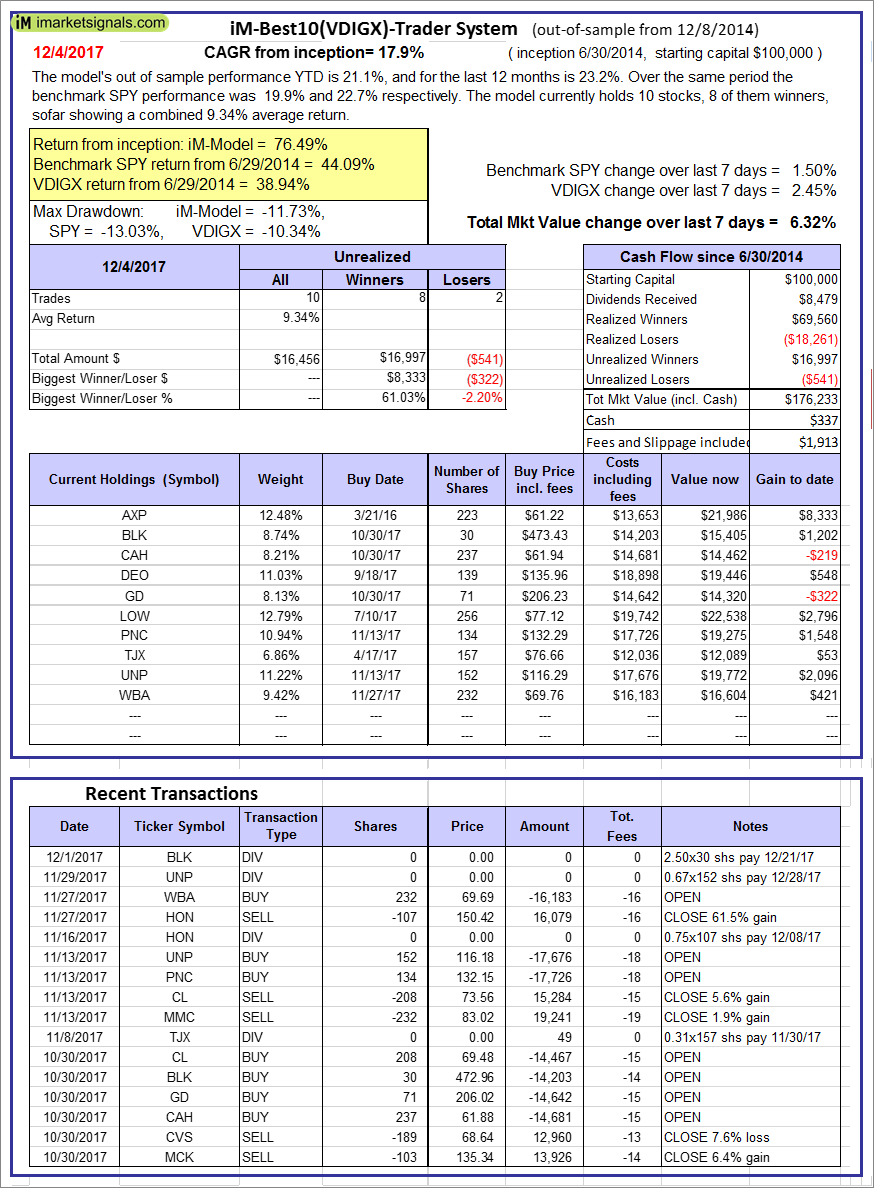  |
iM-Best10(VDIGX)-Trader: The model’s out of sample performance YTD is 21.1%, and for the last 12 months is 23.2%. Over the same period the benchmark SPY performance was 19.9% and 22.7% respectively. Since inception, on 7/1/2014, the model gained 76.49% while the benchmark SPY gained 44.09% and VDIGX gained 38.94% over the same period. Over the previous week the market value of iM-Best10(VDIGX) gained 6.32% at a time when SPY gained 1.50%. A starting capital of $100,000 at inception on 7/1/2014 would have grown to $176,233 which includes $337 cash and excludes $1,913 spent on fees and slippage. |
 |
iM-BESTOGA-3: The model’s out of sample performance YTD is 13.5%, and for the last 12 months is 17.4%. Over the same period the benchmark SPY performance was 19.9% and 22.7% respectively. Over the previous week the market value of iM-BESTOGA-3 gained 3.72% at a time when SPY gained 1.50%. A starting capital of $100,000 at inception on 2/3/2014 would have grown to $229,443 which includes $1,003 cash and excludes $1,818 spent on fees and slippage. |
 |
iM-Best7(HiD-LoV): The model’s out of sample performance YTD is 10.1%, and for the last 12 months is 11.5%. Over the same period the benchmark SPY performance was 19.9% and 22.7% respectively. Over the previous week the market value of iM-BESTOGA-3 gained 5.39% at a time when SPY gained 1.50%. A starting capital of $100,000 at inception on 6/30/2016 would have grown to $112,792 which includes $109 cash and excludes $1,256 spent on fees and slippage. |
 |
iM 6-Stock Capital Strength Portfolio: The model’s out of sample performance YTD is 42.9%, and for the last 12 months is 43.6%. Over the same period the benchmark SPY performance was 19.9% and 22.7% respectively. Over the previous week the market value of the iM 6-Stock Capital Strength Portfolio gained 5.50% at a time when SPY gained 1.50%. A starting capital of $100,000 at inception on 10/28/2016 would have grown to $150,890 which includes $907 cash and excludes $559 spent on fees and slippage. |
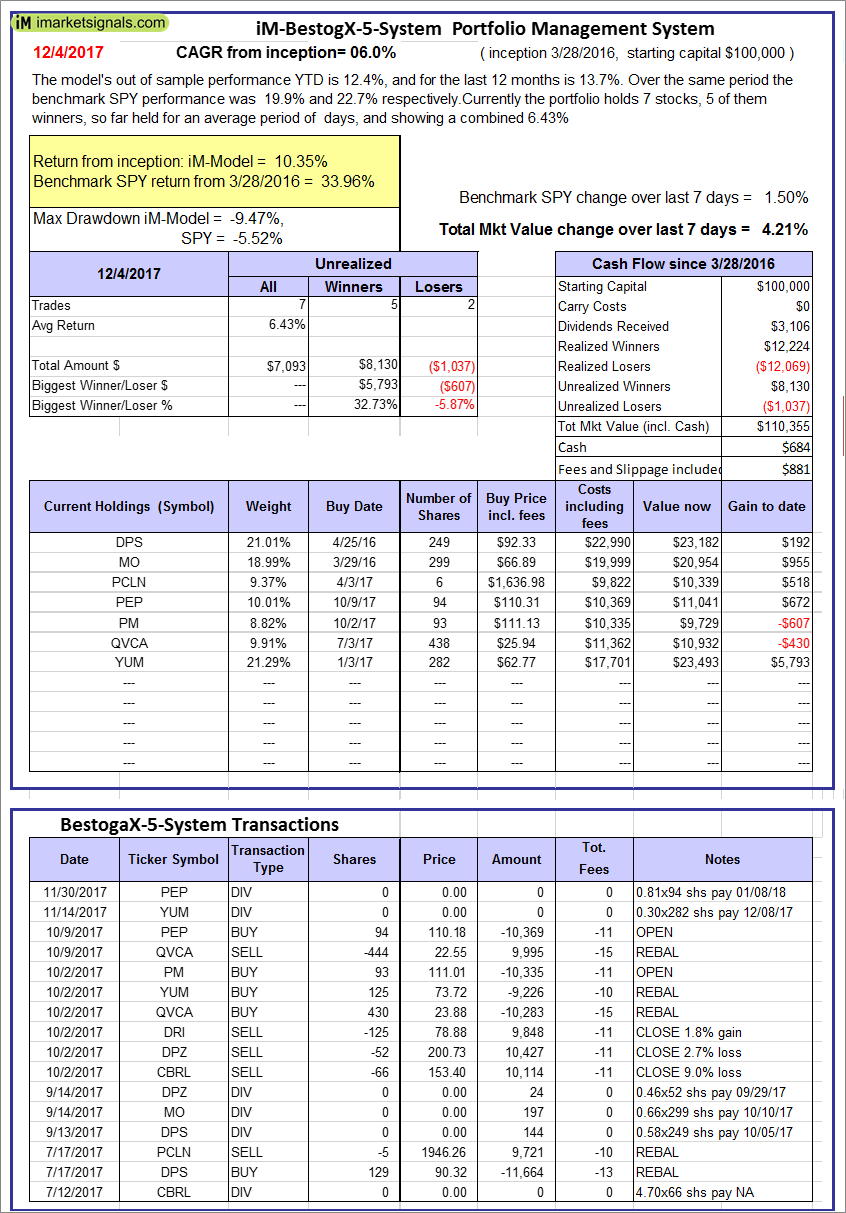 |
iM-BestogaX5-System: The model’s out of sample performance YTD is 12.4%, and for the last 12 months is 13.7%. Over the same period the benchmark SPY performance was 19.9% and 22.7% respectively. Over the previous week the market value of iM-Best8(S&P 500)Tax-Eff. gained 4.21% at a time when SPY gained 1.50%. A starting capital of $100,000 at inception on 3/28/2016 would have grown to $110,355 which includes $684 cash and excludes $881 spent on fees and slippage. |
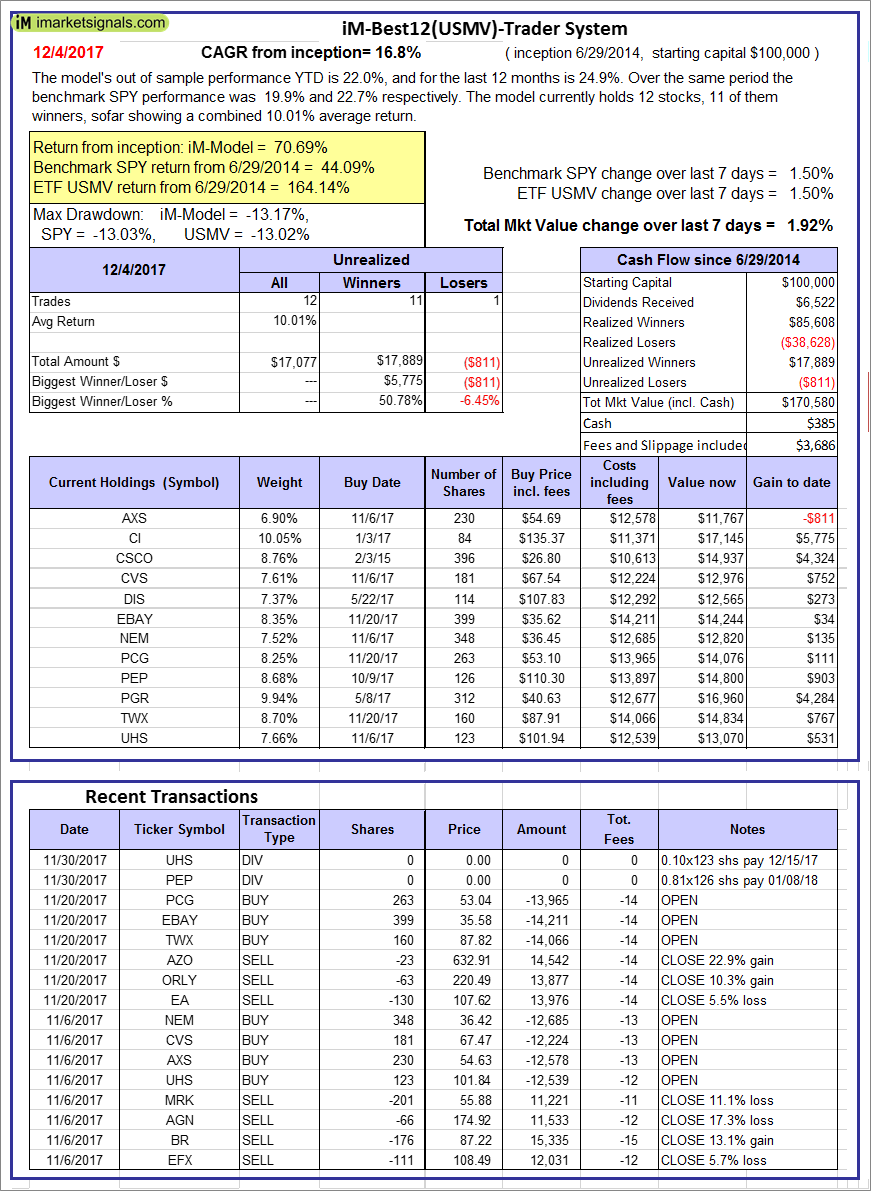 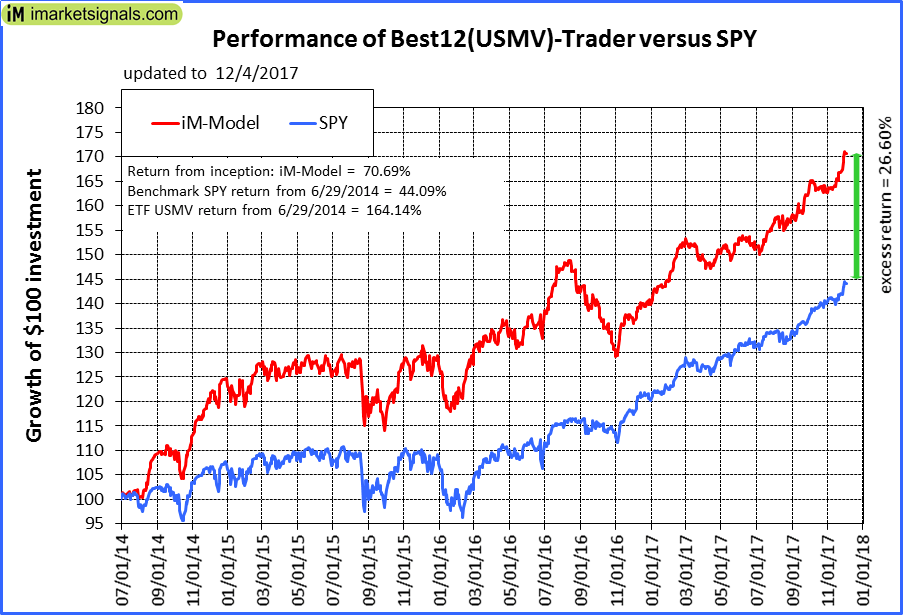 |
iM-Best12(USMV)-Trader: The model’s out of sample performance YTD is 22.0%, and for the last 12 months is 24.9%. Over the same period the benchmark SPY performance was 19.9% and 22.7% respectively. Since inception, on 6/30/2014, the model gained 70.69% while the benchmark SPY gained 44.09% and the ETF USMV gained 164.14% over the same period. Over the previous week the market value of iM-Best12(USMV)-Trader gained 1.92% at a time when SPY gained 1.50%. A starting capital of $100,000 at inception on 6/30/2014 would have grown to $170,580 which includes $385 cash and excludes $3,686 spent on fees and slippage. |
  |
iM-Best12(USMV)Q1-Investor: The model’s out of sample performance YTD is 28.2%, and for the last 12 months is 30.4%. Over the same period the benchmark SPY performance was 19.9% and 22.7% respectively. Since inception, on 1/5/2015, the model gained 61.29% while the benchmark SPY gained 38.47% and the ETF USMV gained 38.46% over the same period. Over the previous week the market value of iM-Best12(USMV)Q1 gained 2.18% at a time when SPY gained 1.50%. A starting capital of $100,000 at inception on 1/5/2015 would have grown to $161,136 which includes $172 cash and excludes $871 spent on fees and slippage. |
 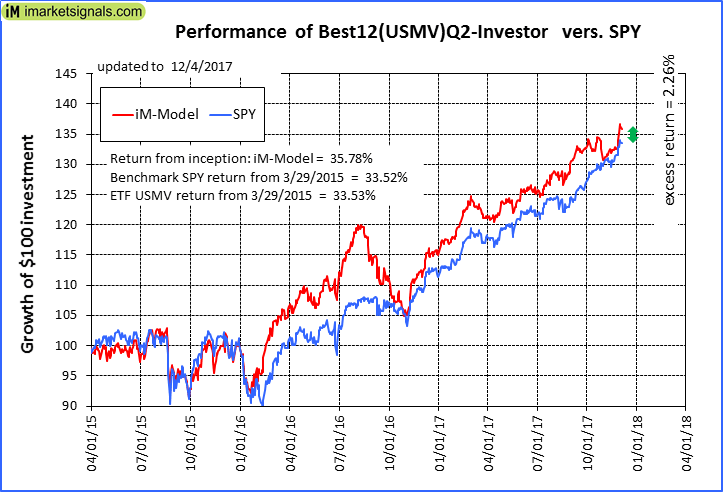 |
iM-Best12(USMV)Q2-Investor: The model’s out of sample performance YTD is 18.0%, and for the last 12 months is 20.9%. Over the same period the benchmark SPY performance was 19.9% and 22.7% respectively. Since inception, on 3/30/2015, the model gained 35.78% while the benchmark SPY gained 33.52% and the ETF USMV gained 33.53% over the same period. Over the previous week the market value of iM-Best12(USMV)Q2 gained 2.16% at a time when SPY gained 1.50%. A starting capital of $100,000 at inception on 3/30/2015 would have grown to $135,657 which includes -$221 cash and excludes $784 spent on fees and slippage. |
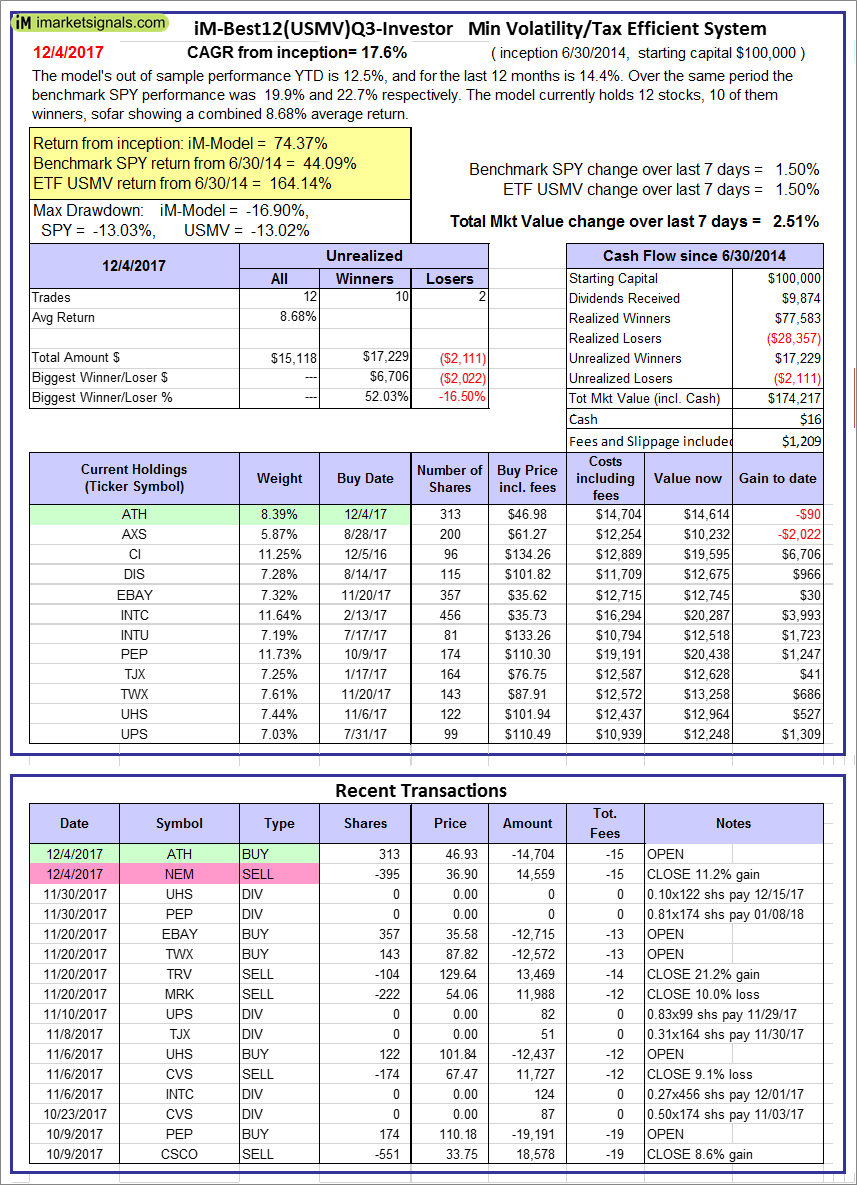 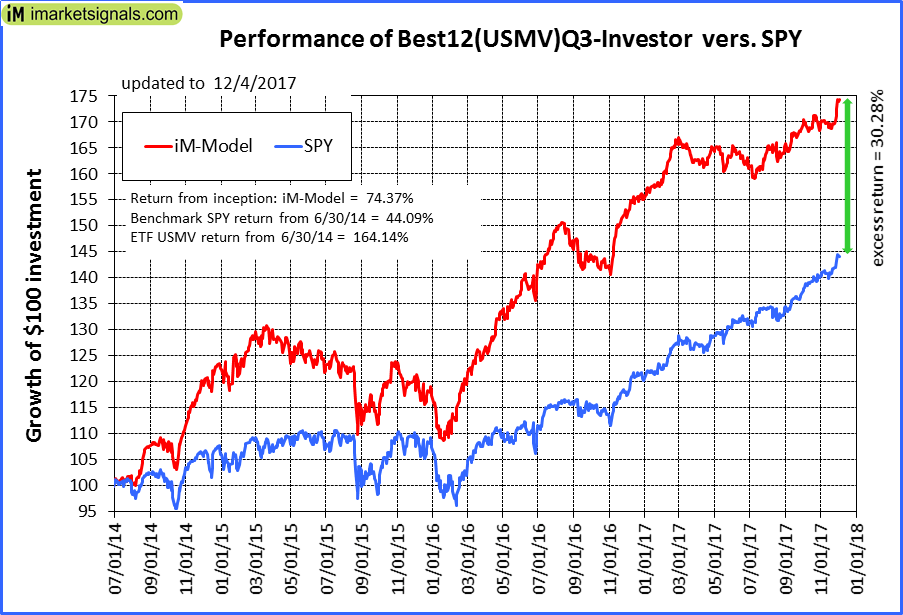 |
iM-Best12(USMV)Q3-Investor: The model’s out of sample performance YTD is 12.5%, and for the last 12 months is 14.4%. Over the same period the benchmark SPY performance was 19.9% and 22.7% respectively. Since inception, on 7/1/2014, the model gained 74.37% while the benchmark SPY gained 44.09% and the ETF USMV gained 164.14% over the same period. Over the previous week the market value of iM-Best12(USMV)Q3 gained 2.51% at a time when SPY gained 1.50%. A starting capital of $100,000 at inception on 7/1/2014 would have grown to $174,217 which includes $16 cash and excludes $1,209 spent on fees and slippage. |
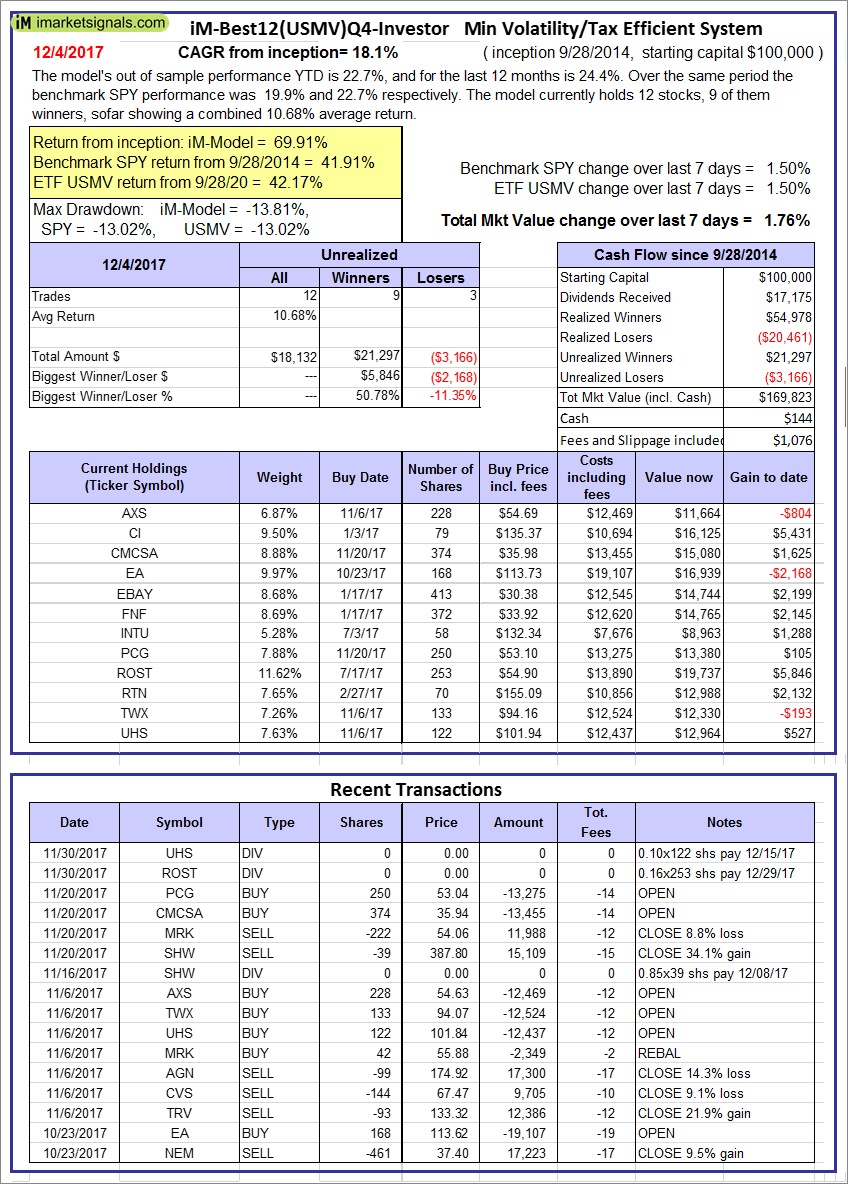 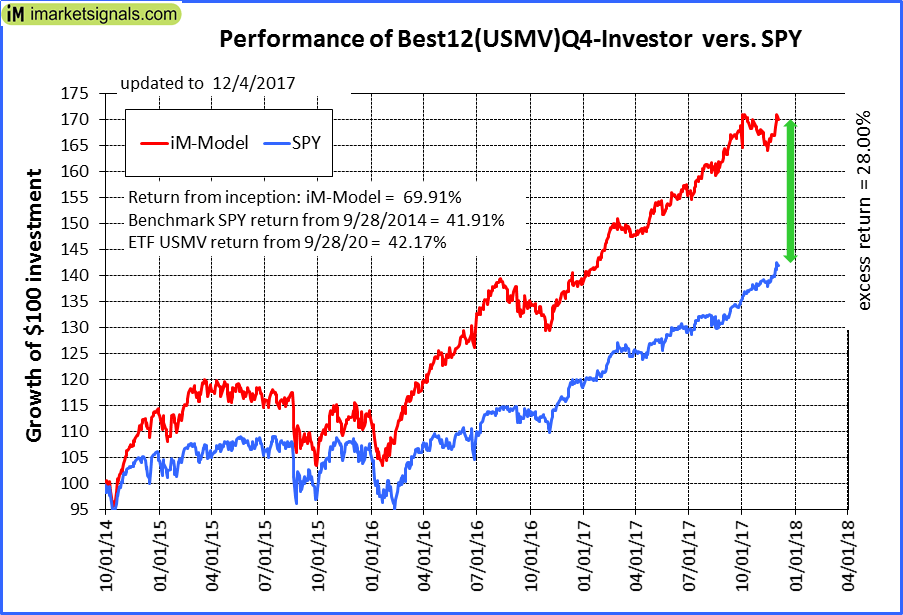 |
iM-Best12(USMV)Q4-Investor: Since inception, on 9/29/2014, the model gained 69.91% while the benchmark SPY gained 41.91% and the ETF USMV gained 42.17% over the same period. Over the previous week the market value of iM-Best12(USMV)Q4 gained 1.76% at a time when SPY gained 1.50%. A starting capital of $100,000 at inception on 9/29/2014 would have grown to $169,823 which includes $144 cash and excludes $1,076 spent on fees and slippage. |
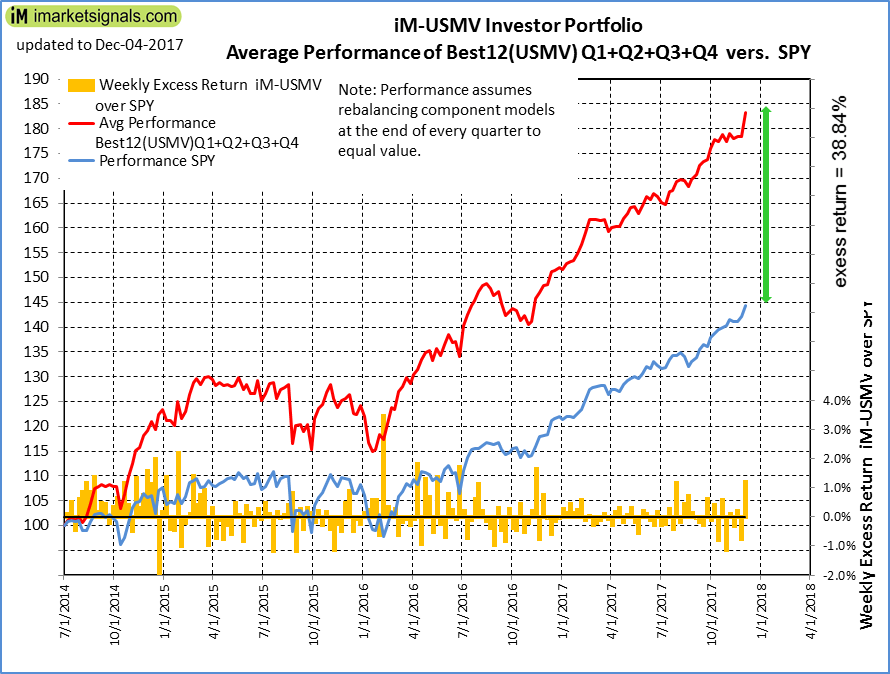 |
Average Performance of iM-Best12(USMV)Q1+Q2+Q3+Q4-Investor resulted in an excess return of 38.84% over SPY. (see iM-USMV Investor Portfolio) |
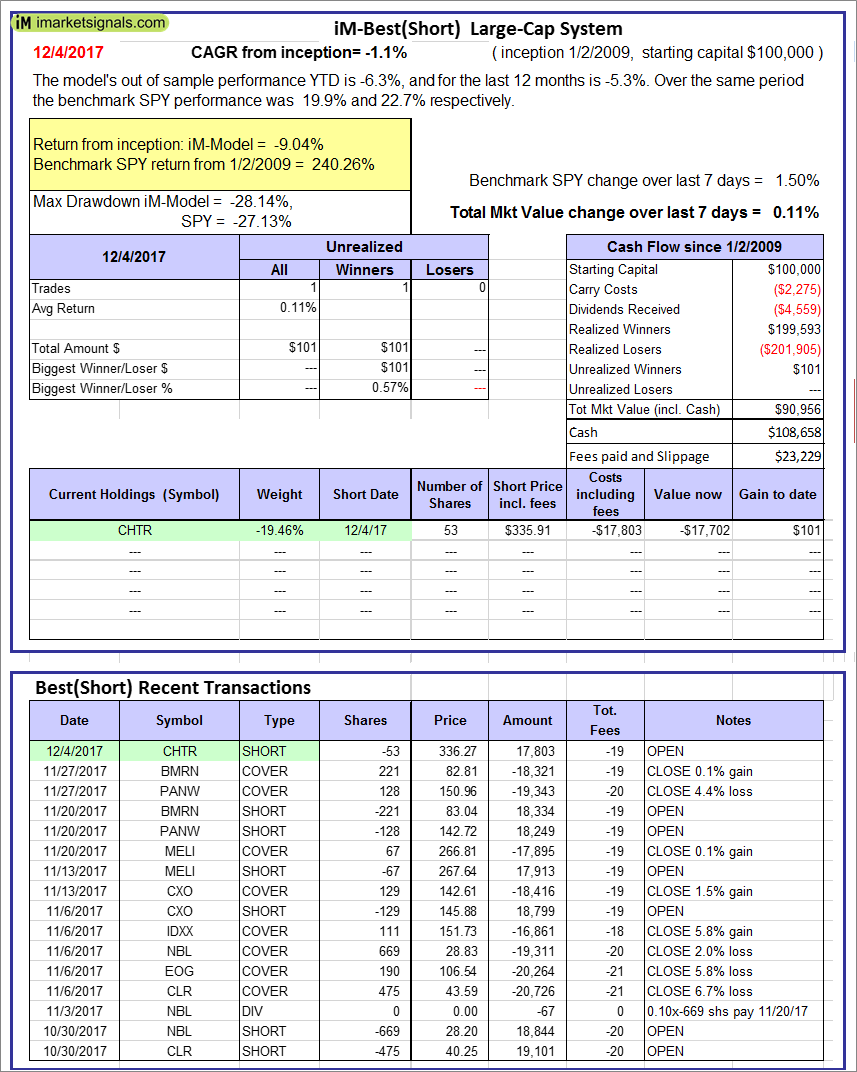 |
iM-Best(Short): The model’s out of sample performance YTD is -6.3%, and for the last 12 months is -5.3%. Over the same period the benchmark SPY performance was 19.9% and 22.7% respectively. Over the previous week the market value of iM-Best(Short) gained 0.11% at a time when SPY gained 1.50%. Over the period 1/2/2009 to 12/4/2017 the starting capital of $100,000 would have grown to $90,956 which includes $108,658 cash and excludes $23,229 spent on fees and slippage. |
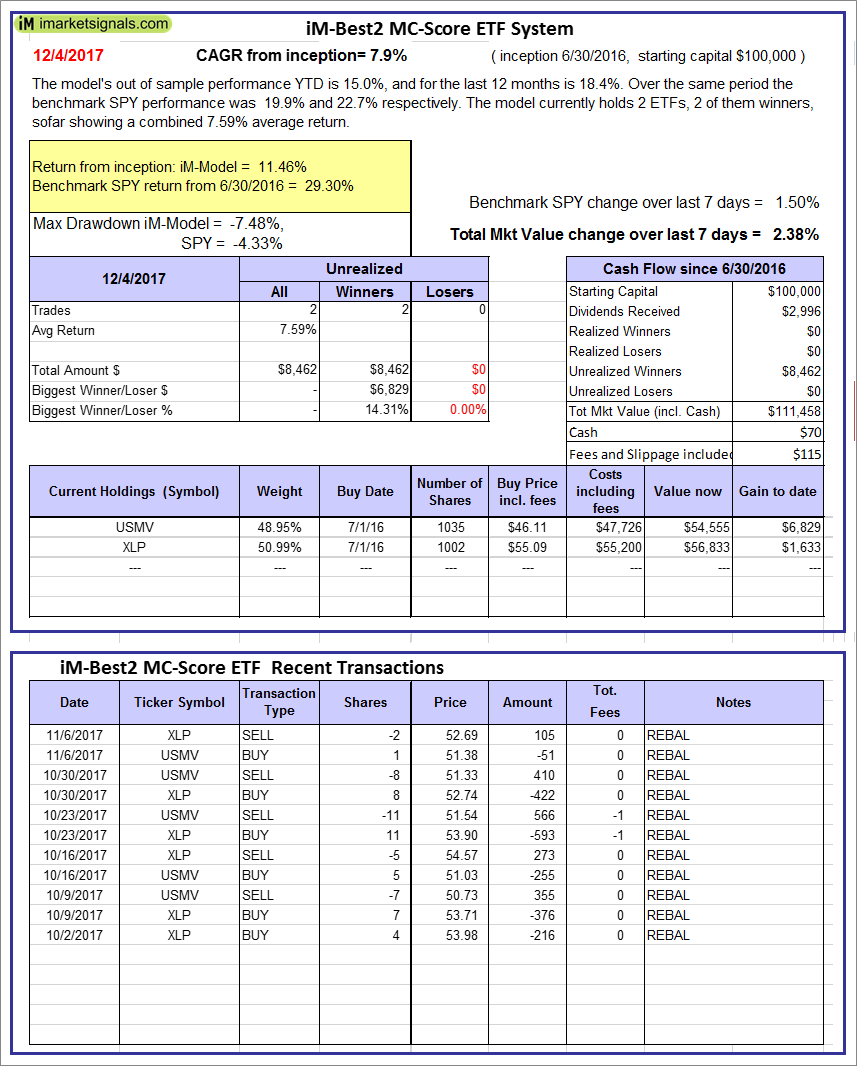 |
iM-Best2 MC-Score ETF System: The model’s out of sample performance YTD is 15.0%, and for the last 12 months is 18.4%. Over the same period the benchmark SPY performance was 19.9% and 22.7% respectively. Over the previous week the market value of the iM-Best2 MC-Score ETF System gained 2.38% at a time when SPY gained 1.50%. A starting capital of $100,000 at inception on 6/30/2016 would have grown to $111,458 which includes $70 cash and excludes $115 spent on fees and slippage. |
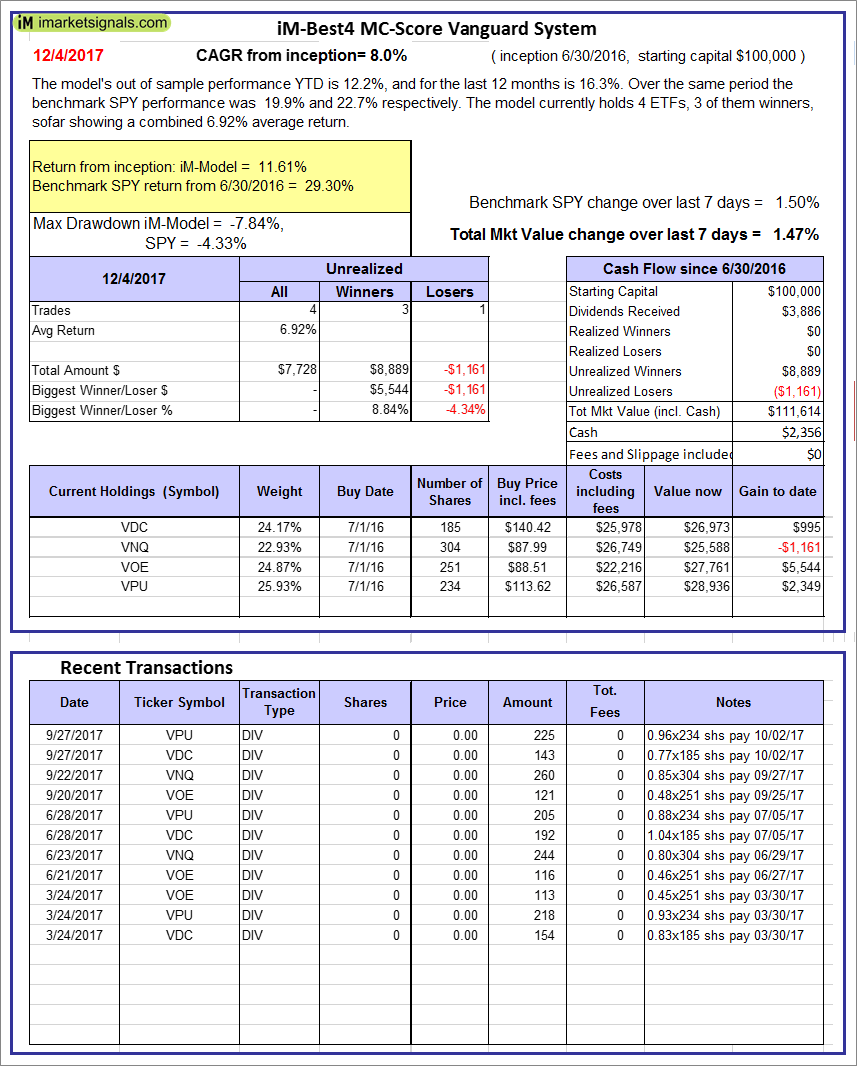 |
iM-Best4 MC-Score Vanguard System: The model’s out of sample performance YTD is 12.2%, and for the last 12 months is 16.3%. Over the same period the benchmark SPY performance was 19.9% and 22.7% respectively. Over the previous week the market value of the iM-Best4 MC-Score Vanguard System gained 1.47% at a time when SPY gained 1.50%. A starting capital of $100,000 at inception on 6/30/2016 would have grown to $111,614 which includes $2,356 cash and excludes $00 spent on fees and slippage. |
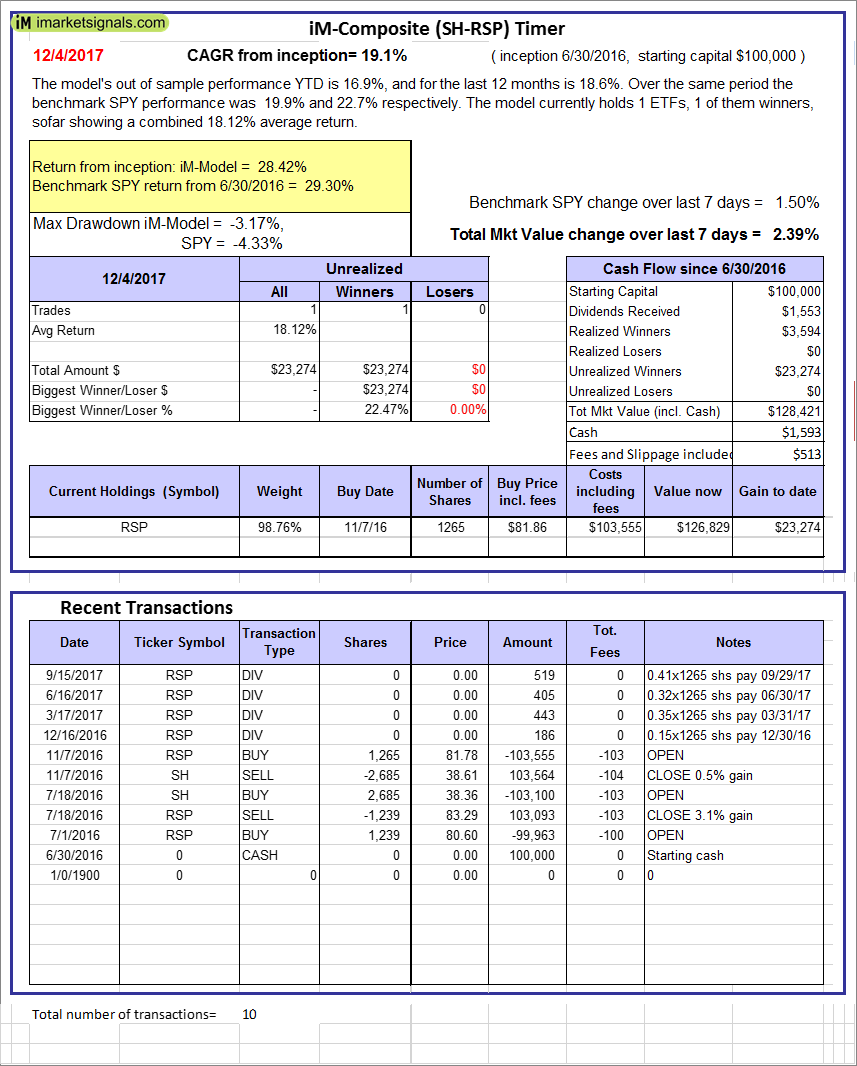 |
iM-Composite (SH-RSP) Timer: The model’s out of sample performance YTD is 16.9%, and for the last 12 months is 18.6%. Over the same period the benchmark SPY performance was 19.9% and 22.7% respectively. Over the previous week the market value of the iM-Composite (SH-RSP) Timer gained 2.39% at a time when SPY gained 1.50%. A starting capital of $100,000 at inception on 6/30/2016 would have grown to $128,421 which includes $1,593 cash and excludes $513 spent on fees and slippage. |
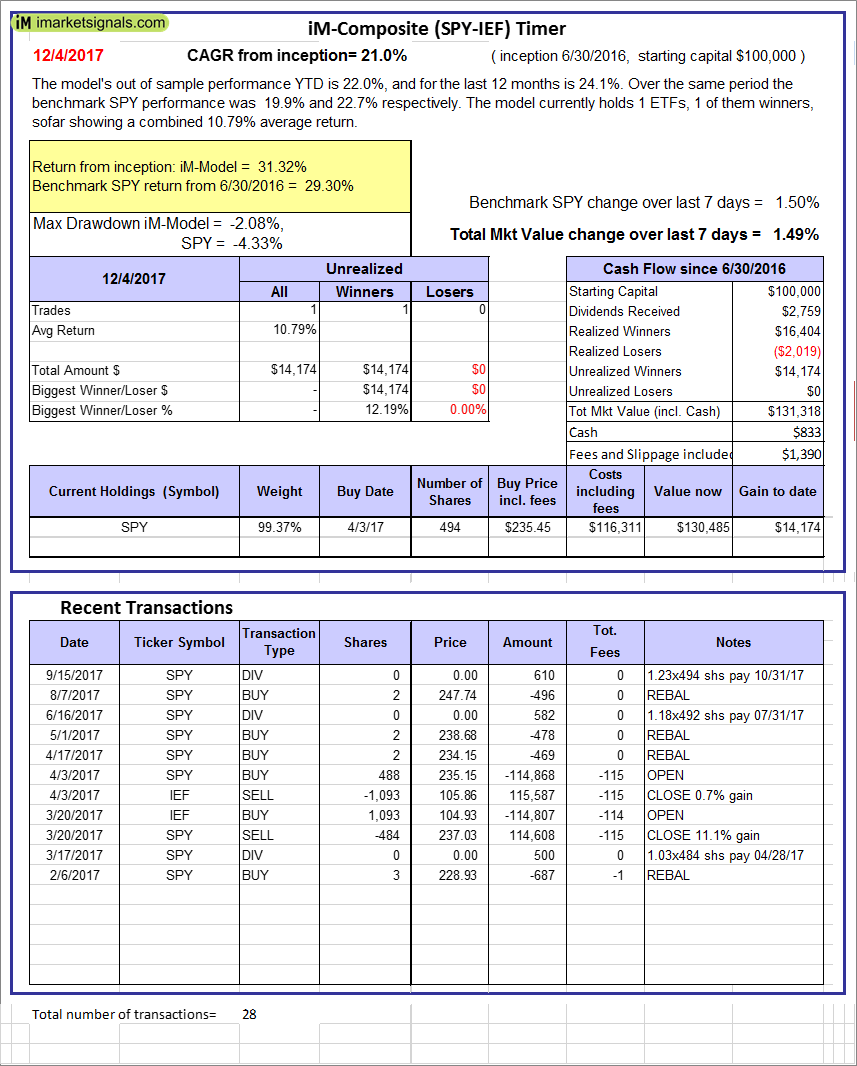 |
iM-Composite (SPY-IEF) Timer: The model’s out of sample performance YTD is 22.0%, and for the last 12 months is 24.1%. Over the same period the benchmark SPY performance was 19.9% and 22.7% respectively. Over the previous week the market value of the iM-Composite (SPY-IEF) Timer gained 1.49% at a time when SPY gained 1.50%. A starting capital of $100,000 at inception on 6/30/2016 would have grown to $131,318 which includes $833 cash and excludes $1,390 spent on fees and slippage. |
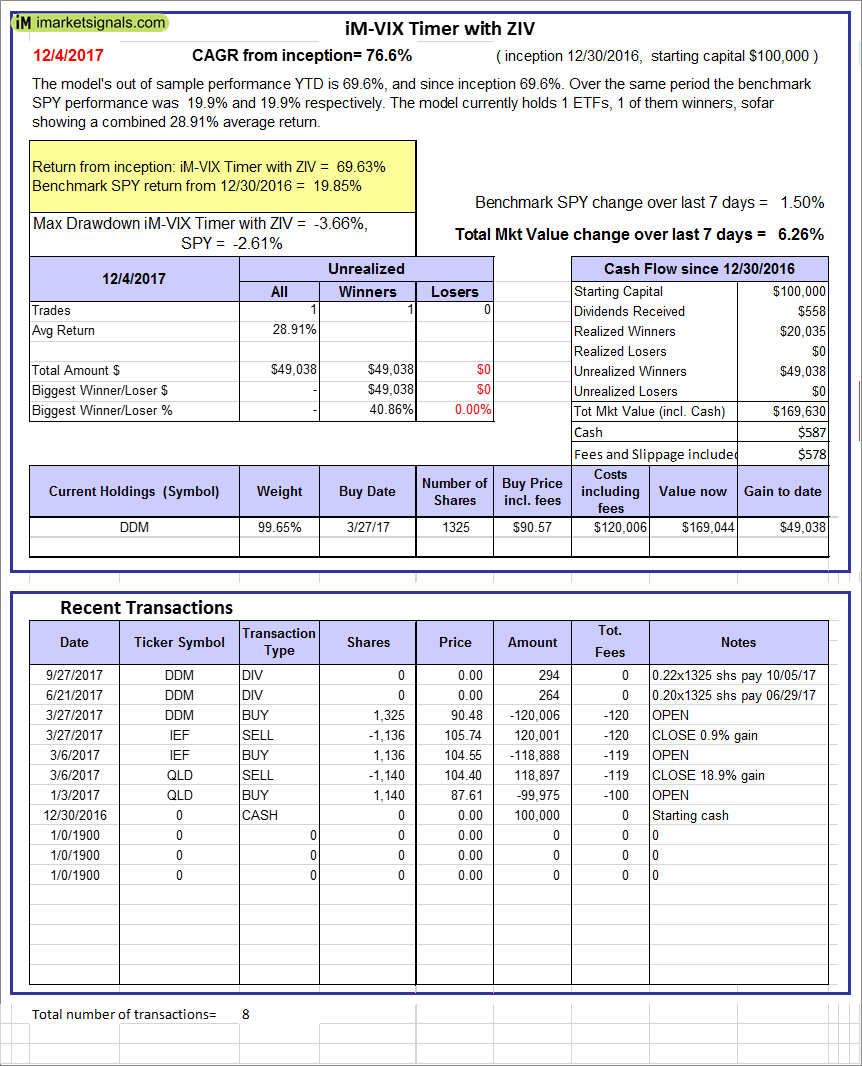 |
iM-VIX Timer with ZIV: The model’s out of sample performance YTD is 69.6%, and since inception 69.6%. Over the same period the benchmark SPY performance was 19.9% and 19.9% respectively. Over the previous week the market value of the iM-VIX Timer with ZIV gained 6.26% at a time when SPY gained 1.50%. A starting capital of $100,000 at inception on 6/30/2016 would have grown to $169,630 which includes $587 cash and excludes $578 spent on fees and slippage. |
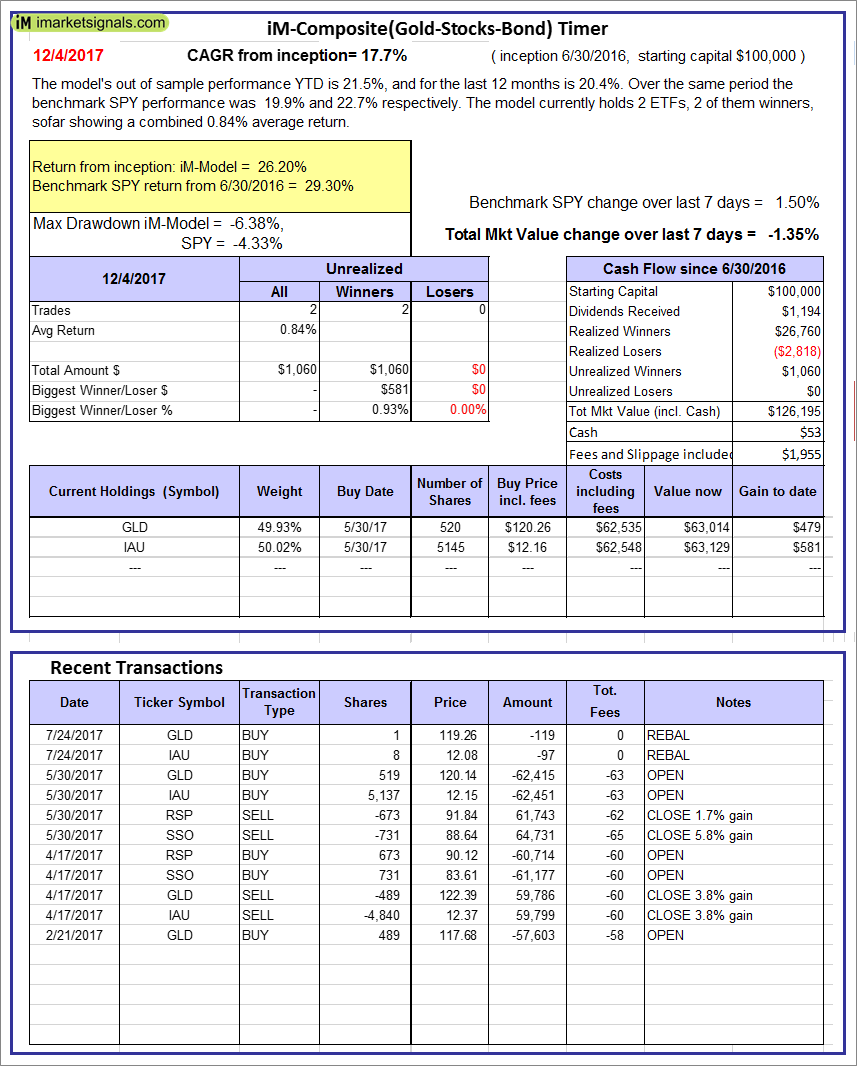 |
iM-Composite(Gold-Stocks-Bond) Timer: The model’s out of sample performance YTD is 21.5%, and for the last 12 months is 20.4%. Over the same period the benchmark SPY performance was 19.9% and 22.7% respectively. Over the previous week the market value of the iM-Composite(Gold-Stocks-Bond) Timer gained -1.35% at a time when SPY gained 1.50%. A starting capital of $100,000 at inception on 6/30/2016 would have grown to $126,195 which includes $53 cash and excludes $1,955 spent on fees and slippage. |
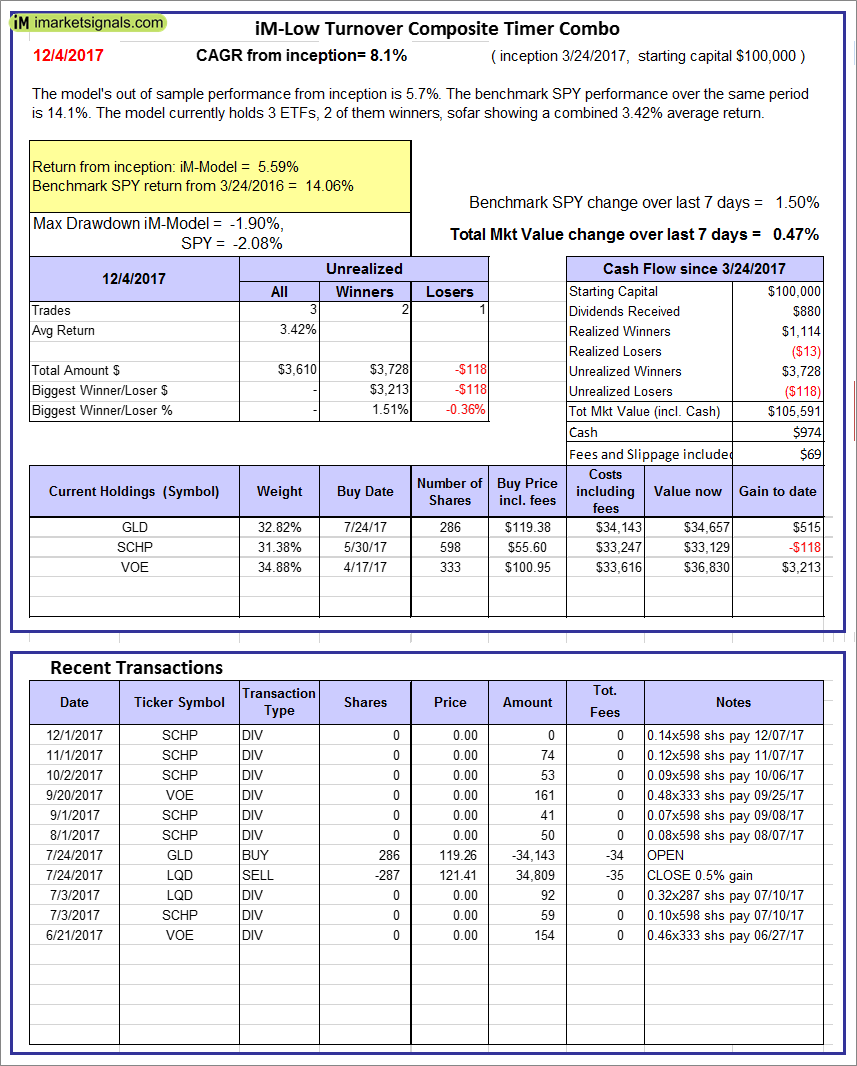 |
iM-Low Turnover Composite Timer Combo: The model’s out of sample performance from inception is 5.7%. The benchmark SPY performance over the same period is 14.1%. Over the previous week the market value of the iM-Low Turnover Composite Timer Combo gained 0.47% at a time when SPY gained 1.50%. A starting capital of $100,000 at inception on 3/24/27 would have grown to $105,591 which includes $974 cash and excludes $69 spent on fees and slippage. |
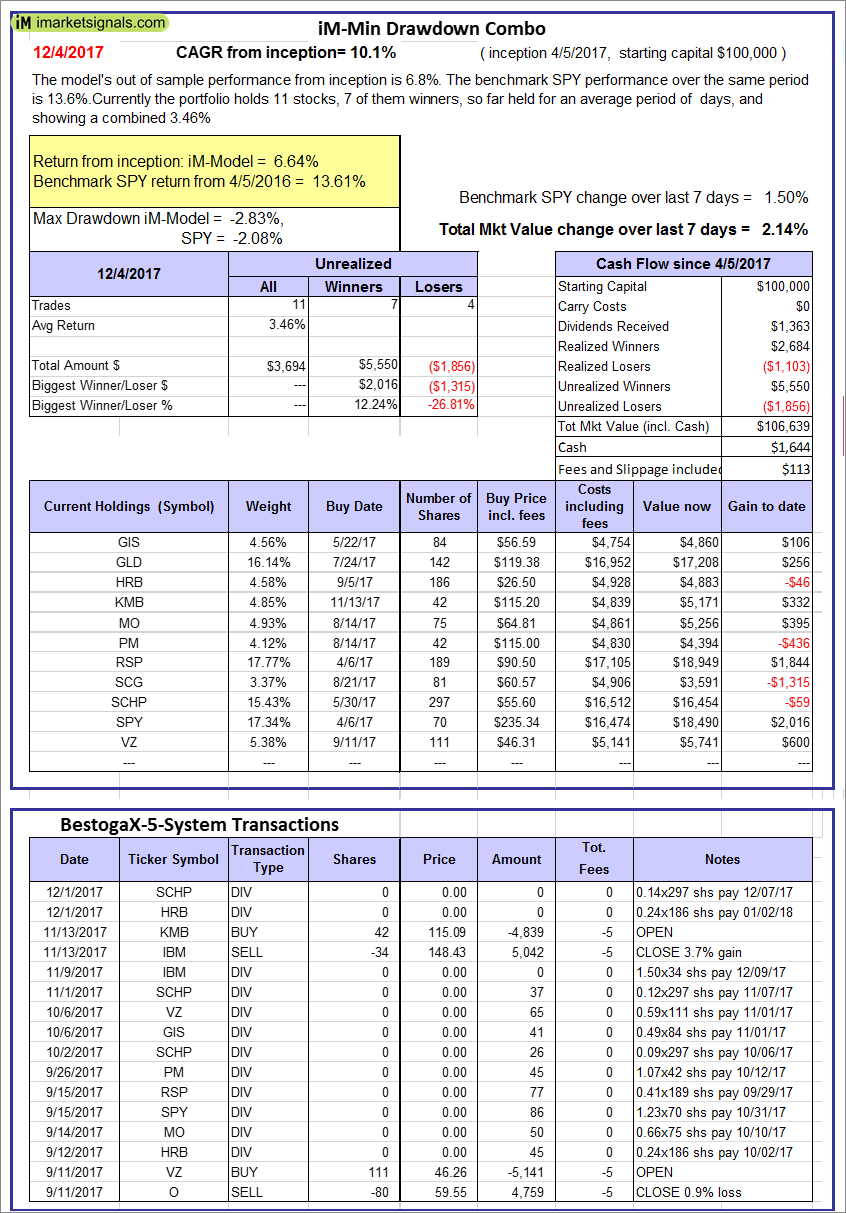 |
iM-Min Drawdown Combo: The model’s out of sample performance from inception is 6.8%. The benchmark SPY performance over the same period is 13.6%. Over the previous week the market value of the iM-Min Drawdown Combo gained 2.14% at a time when SPY gained 1.50%. A starting capital of $100,000 at inception on 4/5/2017 would have grown to $106,639 which includes $1,644 cash and excludes $113 spent on fees and slippage. |
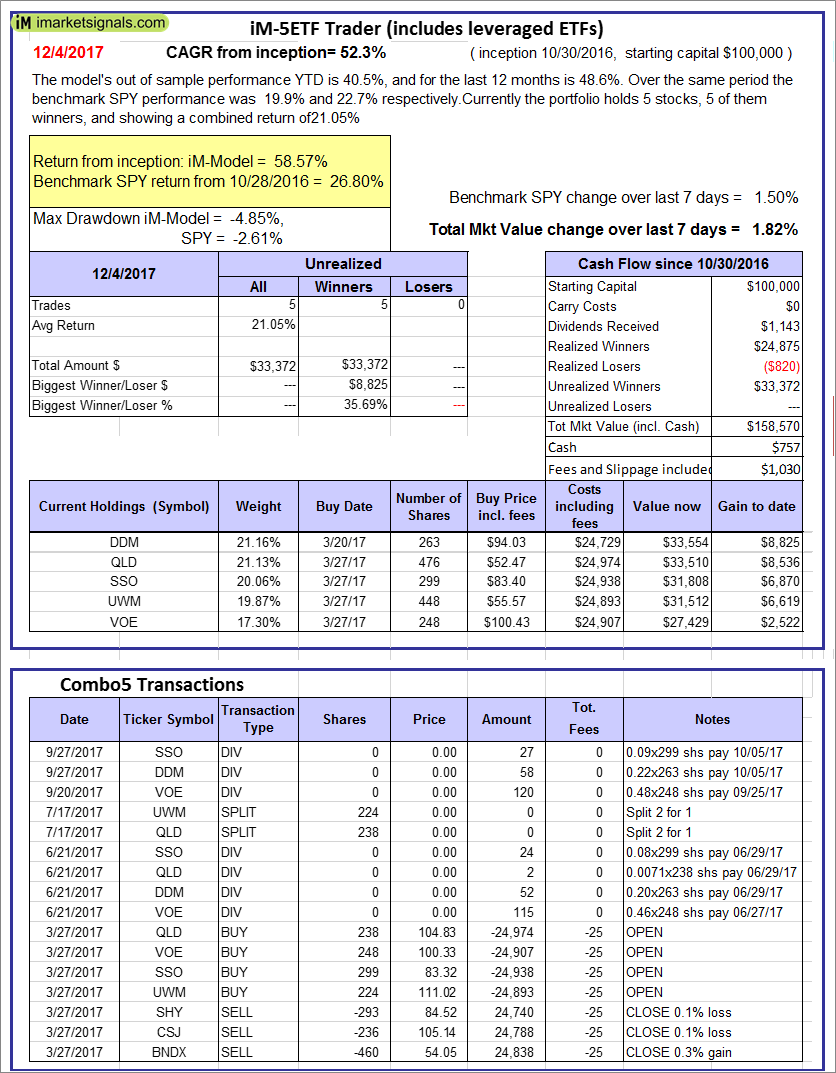 |
iM-5ETF Trader (includes leveraged ETFs): The model’s out of sample performance YTD is 40.5%, and for the last 12 months is 48.6%. Over the same period the benchmark SPY performance was 19.9% and 22.7% respectively. Over the previous week the market value of the iM-5ETF Trader (includes leveraged ETFs) gained 1.82% at a time when SPY gained 1.50%. A starting capital of $100,000 at inception on 10/30/2016 would have grown to $158,570 which includes $757 cash and excludes $1,030 spent on fees and slippage. |
 |
iM-Standard 5ETF Trader (excludes leveraged ETFs): The model’s out of sample performance YTD is 20.3%, and for the last 12 months is 23.5%. Over the same period the benchmark SPY performance was 19.9% and 22.7% respectively. Over the previous week the market value of the iM-Standard 5ETF Trader (excludes leveraged ETFs) gained 1.91% at a time when SPY gained 1.50%. A starting capital of $100,000 at inception on 10/30/2016 would have grown to $123,732 which includes $1,385 cash and excludes $880 spent on fees and slippage. |
iM-Best Reports – 12/05/2017
Posted in pmp SPY-SH
Leave a Reply
You must be logged in to post a comment.