Unemployment
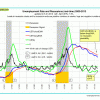
 Based on the historic patterns of the unemployment rate indicators prior to recessions one can reasonably conclude that the U.S. economy is currently not in a recession. The indicator pattern is consistent with those from prior in-between recession periods. Forecast for the unemployment rate for May = 7.4%, June = 7.4%, July = 7.3%.
Modified S&P500 Coppock
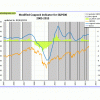
 The modified Coppock indicator for the S&P500 has signaled a continuous stock market investment now from May-22-09 onwards only interrupted for three weeks from April-23 to May-14-10. This indicator can only provide buy signals and stays invested until the S&P has gained 38% or for 48 weeks after a buy signal, whichever comes first. If a new buy signal is generated during an investment period, then these criteria apply again from the new buy signal onwards. Download all the buy signals here.

Could use clarification please on the Unemployment (UER) model, namely that in the Web articles the EMAs are described as based on selected WEEKly periods but the unemployment data is monthly; does this mean that a conversion to monthly is required? This would also pertain to the 19 WEEK ROC and whether a conversion to monthly is required.
As to the EMAs the Web articles also show an inconsistency in the period of the short EMA: is it 12 periods or 9 periods?
The 04/05/13 article mentions 12 periods; the 04/17/12 articles refers to EMAs in Appendix 1 but the Appendix 1 example mentions N=9 and N=60 for the short and long EMAs respectively.
Thank you for your attention. I am following your work and trying to keep my spreadsheet correct and aligned with the model guidelines.
Lance, the monthly UER number is inserted into the respective weekly slots to provide real time weekly data. We use a short 12 period EMA. In the appendix N=9 comes from an hypothetical example of how to calculate the exponential moving average.