Market Signals Summary:
The IBH stock market model is out of the market. The MAC stock market model is invested, the bond market model avoids high beta (long) bonds, the yield curve is steepening, the gold model is not invested, but the silver model is invested. The recession indicator COMP is higher from last week’s level, but iM-BCIg remains unchanged. MAC-AU is invested.
Stock-markets:
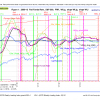 The IBH-model is out of the market as shown in Fig. 1. A sell signal was generated 37 weeks ago when the WLIg_shortEMA moved below the WLIg_longEMA. Currently the WLIg_shortEMA indicator is just below WLIg_longEMA. If the sell signal was correct then WLIg_shortEMA should move decisively below WLIg_longEMA, which is currently not the case. However, had it not been for this sell signal, the model would have generated another sell signal on Sep-20-13. A Sell-C signal was generated on during week ending 11/15/13
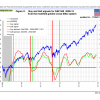 The MAC-US model stays invested. MAC-US Fig 2 shows the spreads of the moving averages. The sell-spread is higher from last week’s level. A sell signals is not imminent. The sell spread (red graph) has to move below the zero line for a sell signal.
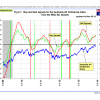 The MAC-AU model stays invested. MAC-AU Fig 2.1 shows the spreads of the moving averages of the Australia All Ordinaries Index. The sell-spread and the buy-spread are near last week’s levels. The sell spread (red graph) has to move below the zero line for a sell signal.
This model and its application is described in MAC-Australia: A Moving Average Crossover System for Superannuation Asset Allocations
Bond-market:
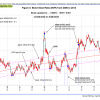 The BVR-model avoids high beta bonds (long-bonds) and also intermediate duration bonds.
The Bond Value Ratio is shown in Fig 3. The BVR is higher from last week’s level. It is possible that bond yields may go lower for a while, reflected by BVR moving higher, but the trend of BVR is lower. According to the model, only when BVR turns upward after having been lower than the lower offset-line should one consider long bonds again.
The Yield Curve:
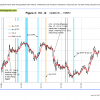 The yield curve model shows the steepening trend of the 10-year and 2-year Treasuries yield spread. Figure 4 charts (i10 – i2). The trend is up, as one can see, but it may go flatter for a while. FLAT and STPP are ETNs. STPP profits from a steepening yield curve and FLAT increases in value when the yield curve flattens. This model confirms the direction of the BVR.
Recession:
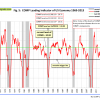 In Fig. 5 one can see that COMP is higher than last week’s level, and far away from signaling recession
COMP can be used for stock market exit timing as discussed in this article The Use of Recession Indicators in Stock Market Timing.
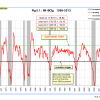 Fig. 5.1 shows our recession indicator iM-BCIg, near last week’s level. It is possible that BCIg may have peaked in June. A recession is not imminent as one can clearly see.
Please also refer to the BCI page
Gold:
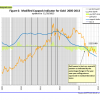 There is no buy-signal from the modified Coppock Gold indicator shown in Fig 6. This model has been out of Gold since Nov-26-2012.
This indicator is described in Is it Time to Buy Gold Again? – Wait for the buy signal ……. Please also view the technical gold chart from a recent article in Morningstar-Australia.
Silver:
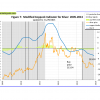 The modified Coppock Silver indicator shown in Fig 7 and is currently invested.
This indicator is described in Silver – Better Than Gold: A Modified Coppock Indicator for Silver.

Leave a Reply
You must be logged in to post a comment.