Stock-market:
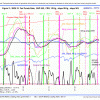 ECRI reported the WLI at a level of 126.8 and the six months smoothed annualized growth WLIg at +3.5%, as shown in Fig 2. Three weeks ago the IBH model generated a sell-basic signal and 2 days later a sell A signal, indicating that the model had exited the S&P500. For those who are new to the IBH model, sell-basic is a warning signal to get ready to sell, it is not a sell signal, and it can be voided when a subsequent buy signal appears, before a sell A. Sell C does not need a sell-basic signal. The various indicator lines after peaking appear to be heading lower. So far the S&P has gained since the sell signal.
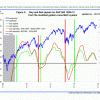 MAC Fig 3 shows the spreads of the moving averages. The sell spread (red graph) has declined further from last week, but the buy spread (green graph) is forming a trough. No sell signal has so far been generated from this model. The model stays invested.
Bond-market:
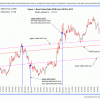 The Bond Value Ratio is shown in Fig 1. The BVR has been flat from last week. In the longer term BVR will reach the long-term trendline and long-bond investors will have suffered considerable losses by then. The model stays invested in low beta bonds.
The Yield Curve:
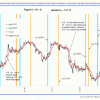 Figure 5 charts (i10 – i2). The trend is neither up or down, but the model expects the yield curve to steepen. FLAT and STPP are ETNs. STPP profits from a steepening yield curve and FLAT increases in value when the yield curve flattens.
The Elusive Recession of 2012:
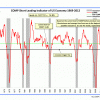 Today the unemployment rate was reported at 7.7%, down from 7.9% last month. Our unemployment recession model has not signalled the start of a recession since the beginning of 2008. Here is a link to the update on this topic. Also attached is my composite recession indicator COMP. It is also well out of recession territory and the trajectory is upwards.
