Stock-market:
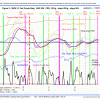
 ECRI reported the WLI at a level of 126.3 and the six months smoothed annualized growth WLIg at +3.4%, as shown in Fig 2, almost identical to our shadow WLI. Two weeks ago the IBH model generated a sell-basic signal and 2 days later a sell A signal, indicating that the model had exited the S&P500. For those who are new to the IBH model, sell-basic is a warning signal to get ready to sell, it is not a sell signal, and it can be voided when a subsequent buy signal appears, before a sell A or sell B signal. Sell C does not need a sell-basic signal. The various indicator lines after peaking are now all heading lower.
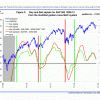
 MAC Fig 3 shows the spreads of the moving averages which have declined further from last week. No sell signal has so far been generated from this model. The model stays invested.
Bond-market:
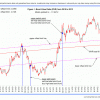
 The Bond Value Ratio is shown in Fig 1. The BVR is not much changed from last week. In the longer term BVR will reach the long-term trendline and long-bond investors will have suffered considerable losses by then. The model stays invested in low beta bonds.
The Yield Curve:
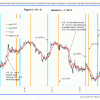
 Figure 5 charts (i10 – i2). The trend is neither up or down, but the model expects the yield curve to steepen. FLAT and STPP are ETNs. STPP profits from a steepening yield curve and FLAT increases in value when the yield curve flattens.
The Elusive Recession of 2012:
ECRI’s Achuthan is now pinpointing a recession start with data, and places the beginning for July 2012. For more details on this see Doug Short’s ECRI Weekly Update: Beating the Recession Drum. Since September 2011 ECRI has issued numerous recession forecasts relying on indicators which subsequently turned against their calls. Hopefully, this is the final call from them. It looks as if they are keeping this going until a recession actually occurs. It is annoying that the TV networks only seem to be interested in what ECRI has to say. I know of no indicator which signals recession now.

Leave a Reply
You must be logged in to post a comment.