Stock-market:
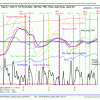
 ECRI reported the WLI at a level of 125.4 and the six months smoothed annualized growth WLIg at +4.4%, as shown in Fig 2, almost identical to our shadow WLI. The IBH model generated a basic sell signal two days ago and a sell A signal today, all as per yesterday’s flash update based on the shadow WLI. (We calculate a first estimate for the shadow WLI on a Monday, the second estimate on Wednesday and the final estimate on Thursday, all before ECRI publishes the WLI on Friday. This provides an early warning. The estimates of the WLI are available at recessionalert.com .)
A Type A sell signal is generated after a basic sell signal:
- 2 days after a basic sell signal, if at the same time the 15-day MA of the S&P500 is less than the 35-day MA of the S&P500, and 10-day slope of the 12-day EMA of (MACD – 9-day EMA of MACD) is negative. (MACD= 12-day EMA of S&P500 minus 26-day EMA of S&P500),
- or later when the 15-day MA of the S&P is less than the 35-day MA of the S&P after a basic sell signal,
- but not later than 65 days after a basic sell signal.
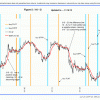
MAC Fig 3 shows the spreads of the moving averages which are now declining sharply. No sell signal has so far been generated from this model. The model stays invested.
Bond-market:
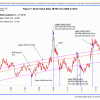
 The Bond Value Ratio is shown in Fig 7. The BVR is again higher than where it was last week. In the longer term BVR will reach the long-term trendline and long-bond investors will have suffered considerable losses by then. The model stays invested in low beta bonds.
The Yield Curve:
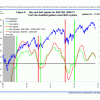
 Figure 5 charts (i10 – i2). The trend is currently undefined, but the model is still signaling a steepening of the yield cureve between those two yields.

