Stock-market:
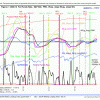 ECRI reported the WLI at a level of 126.2 and the six months smoothed annualized growth WLIg at +5.1%, as shown in Fig 2, almost identical to our shadow WLI. All the indicator lines on Fig 2 point to the model staying invested, although there is now an indication of a possible sell-basic signal coming. For those who are new to the IBH model, Sell-basic is a warning signal to get ready to sell, it is not a sell signal, and it can be voided when a subsequent buy signal appears.
The initial basic sell signal which automatically leads to a type A sell signal occurs when economic conditions deteriorate, which is mainly indicated by the short EMA of the U.S. Weekly Leading Index’s growth rate moving below its long EMA. At the same time the yield curve must be inverted, or, to provide for conditions of prolonged economic weakness, real interest rates must be negative. A basic sell signal is generated when the following simultaneously applies:
- The [short EMA of WLIg+1] moves below the [long EMA of WLIg+1] while the [long EMA of WLIg+1] still shows positive growth but which is steadily declining, and
- the EMA of the Forward Rate Ratio FRR2-10 is at or below 1.00 (indicating an inversion of the yield curve), or if the average of the 3-month T-Bill, 2-year and 10-year T-Note yields minus the annual inflation rate is less than -1.00%, and
- when X is greater than the maximum of X over the preceding 130 days – 0.5%, where X = the maximum Federal Funds Rate (FFR) over the preceding 130 days minus the minimum FFR over the preceding 650 days.
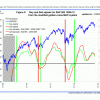 MAC Fig 3 shows the spreads of the moving averages having formed a peak. This may indicate a flat market or a declining one ahead, similar to previous occasions when this occurred. The model stays invested.
Bond-market:
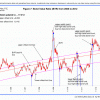 The Bond Value Ratio is shown in Fig 7. The BVR is a bit higher than where it was last week, but the trend seems to be lower. In the longer term BVR will reach the long-term trendline and long-bond investors will have suffered considerable losses by then. The model stays invested in low beta bonds.
The Yield Curve:
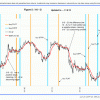 Figure 5 charts (i10 – i2). The trend is now for the yield curve to steepen, i.e. (i10 – i2) is getting bigger, as one can see.
The Elusive Recession of 2012:
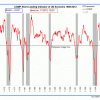 Attached also my composite recession indicator COMP. The level of this indicator is now at its highest since September 2011, and the trajectory is upwards at the end. No recession from 1969 onwards has ever started when this indicator was at the present level and had an upward slope. The slope was always downwards and the level was zero or lower when any of the last 7 recessions began. In fact this recession indicator is beginning to look quite good as it is steadily moving further away from the recession trigger line.
