 The BCI at 180.6 is up from last week’s upward revised 178.8. The BCIg, the six month smoothed annualized growth of BCI, is at 19.1 also up from last week’s upward revised 18.5.
Read more >

Blog Archives
BCI September 25, 2014
Posted in pmp BCI
Latest iM-Best Update
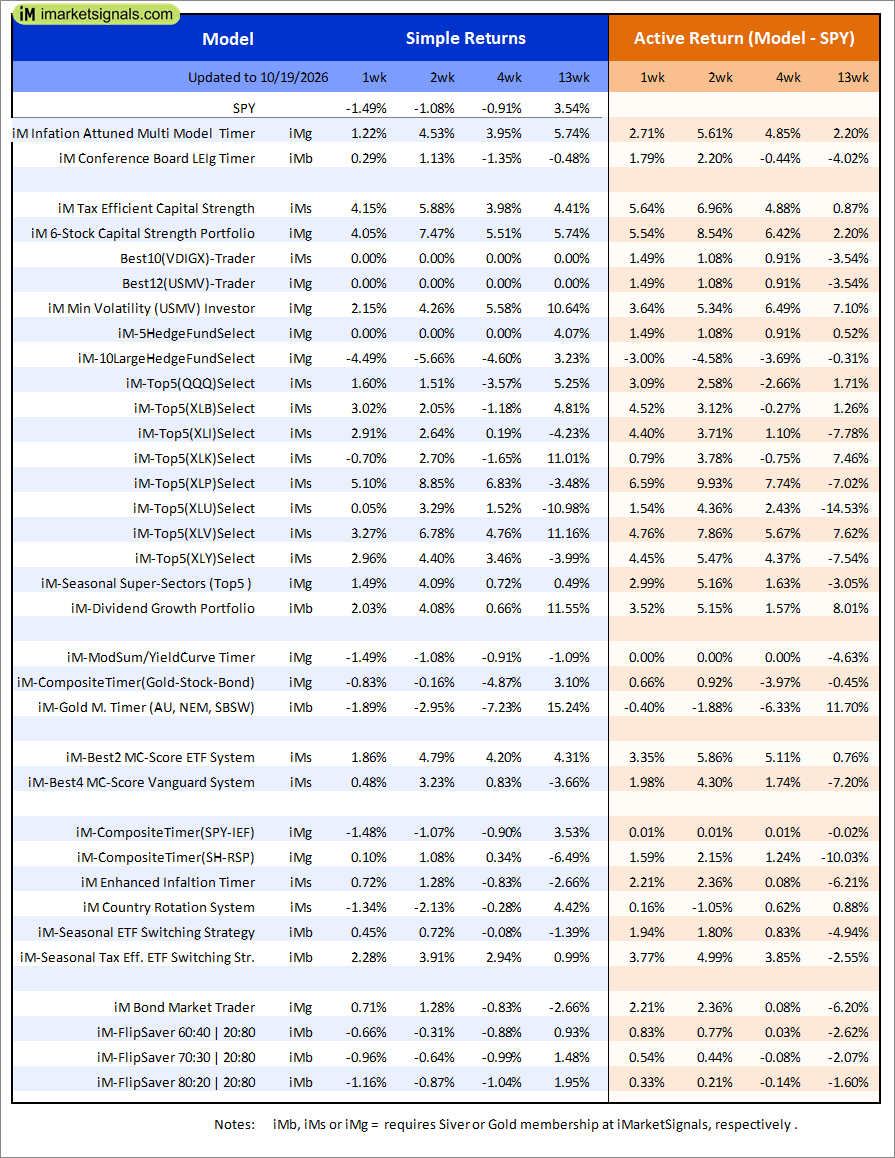 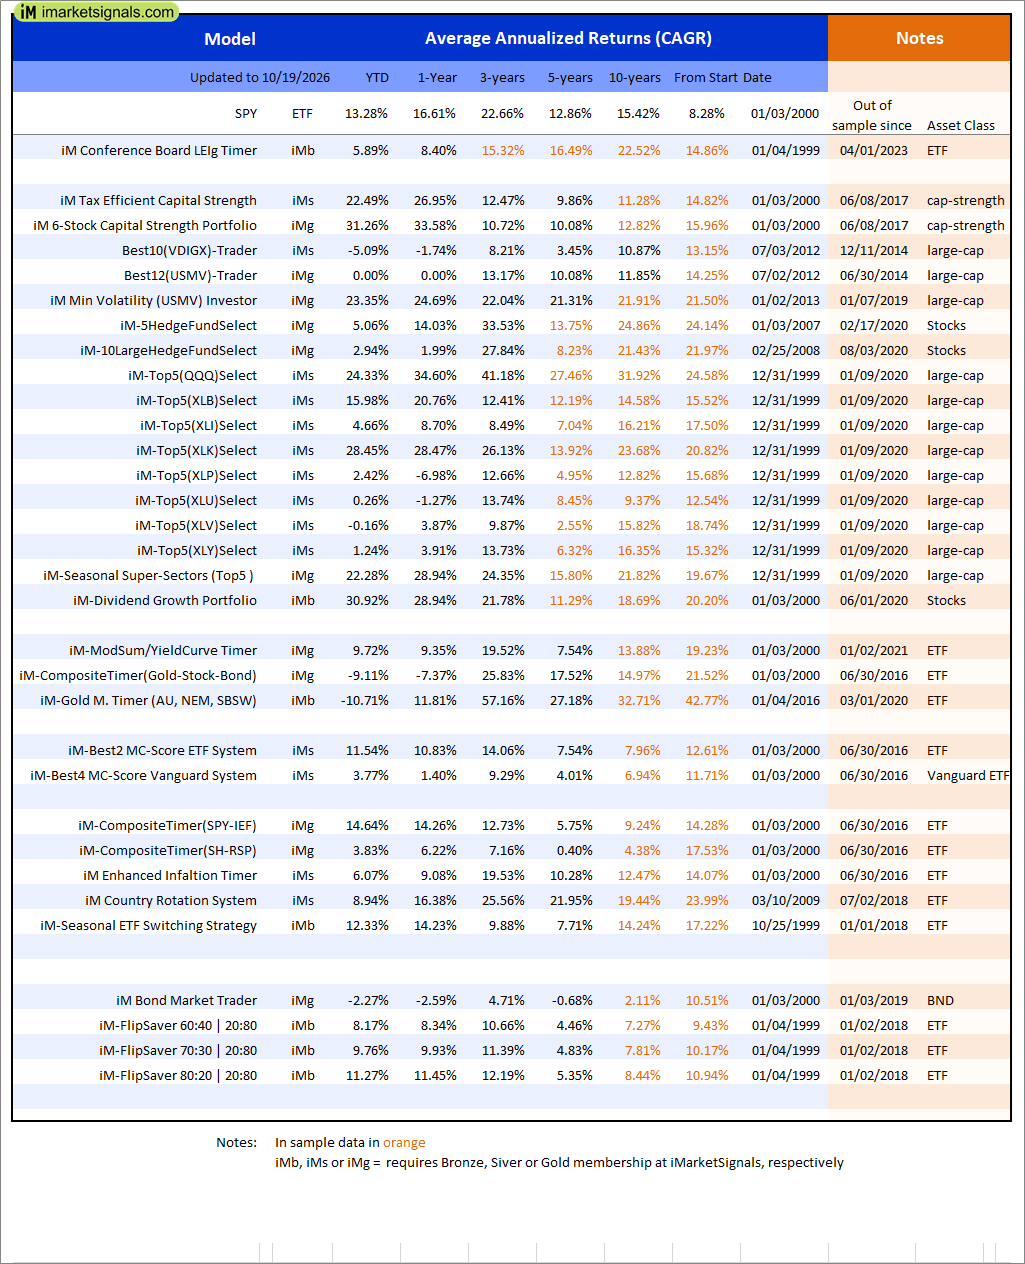 |
Out of sample performance summary of our models for the past 1, 2, 4 and 13 week periods. The active active return indicates how the models over- or underperformed the benchmark ETF SPY. Also the YTD, and the 1-, 3-, 5- and 10-year annualized returns are shown in the second table |
 |
iM-Inflation Attuned Multi-Model Market Timer: The model’s out of sample performance YTD is 10.6%, and for the last 12 months is 11.9%. Over the same period the benchmark SPY performance was 13.3% and 16.6% respectively. Over the previous week the market value of the iM-Inflation Attuned Multi-Model Market Timer gained 1.22% at a time when SPY gained -1.49%. A starting capital of $100,000 at inception on 3/24/2017 would have grown to $169,321,075 which includes $4,109,301 cash and excludes $4,103,439 spent on fees and slippage. |
|
|
iM-Conference Board LEIg Timer: The model’s performance YTD is 14.3%, and for the last 12 months is 7.3%. Over the same period the benchmark SPY performance was 20.1% and 9.4% respectively. Over the previous week the market value of the iM-Conference Board LEIg Timer gained 0.47% at a time when SPY gained -1.49%. A starting capital of $100,000 at inception on 4/5/2017 would have grown to $763,775 which includes $9,534 cash and excludes $769 spent on fees and slippage. |
| iM-FlipSaver 60:40 | 20:80 – 2017: The model’s out of sample performance YTD is 8.3%, and for the last 12 months is 8.4%. Over the same period the benchmark E60B40 performance was 7.1% and 9.0% respectively. Over the previous week the market value of iM-FlipSaver 80:20 | 20:80 gained -0.74% at a time when SPY gained -0.70%. A starting capital of $100,000 at inception on 7/16/2015 would have grown to $194,212 which includes $374 cash and excludes $5,614 spent on fees and slippage. | |
| iM-FlipSaver 70:30 | 20:80 – 2017: The model’s out of sample performance YTD is 9.8%, and for the last 12 months is 9.9%. Over the same period the benchmark E60B40 performance was 7.1% and 9.0% respectively. Over the previous week the market value of iM-FlipSaver 70:30 | 20:80 gained -0.96% at a time when SPY gained -0.70%. A starting capital of $100,000 at inception on 7/15/2015 would have grown to $205,062 which includes $830 cash and excludes $5,886 spent on fees and slippage. | |
| iM-FlipSaver 80:20 | 20:80 – 2017: The model’s out of sample performance YTD is 11.3%, and for the last 12 months is 11.4%. Over the same period the benchmark E60B40 performance was 7.1% and 9.0% respectively. Over the previous week the market value of iM-FlipSaver 80:20 | 20:80 gained -1.16% at a time when SPY gained -0.70%. A starting capital of $100,000 at inception on 1/2/2017 would have grown to $216,081 which includes $60 cash and excludes $6,150 spent on fees and slippage. | |
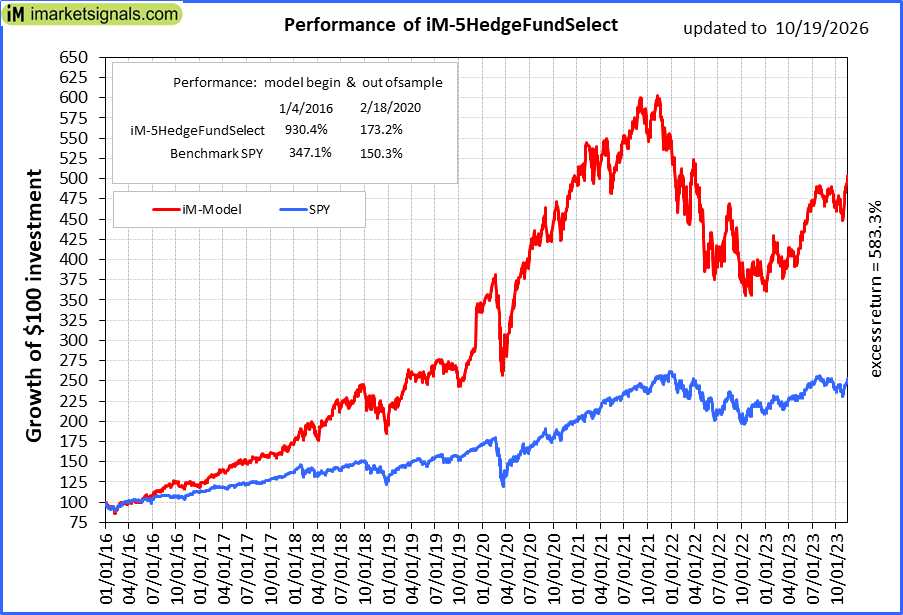 |
iM-5HedgeFundSelect: Since inception, on 1/5/2016, the model gained 930.37% while the benchmark SPY gained 347.06% over the same period. Over the previous week the market value of iM-5HedgeFundSelect gained -4.50% at a time when SPY gained -1.49%. A starting capital of $25,000 at inception on 1/5/2016 would have grown to $257,593 which includes $10,739 cash and excludes $3,606 spent on fees and slippage. |
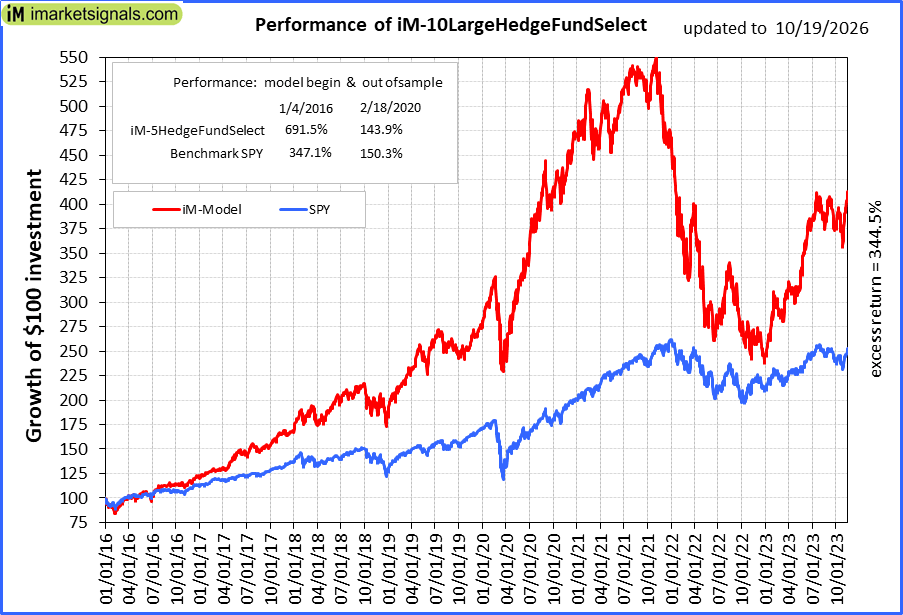 |
iM-10LargeHedgeFundSelect: Since inception, on 1/5/2016, the model gained 691.54% while the benchmark SPY gained 347.06% over the same period. Over the previous week the market value of iM-10LargeHedgeFundSelect gained -4.49% at a time when SPY gained -1.49%. A starting capital of $25,000 at inception on 1/5/2016 would have grown to $187,435 which includes -$9,730 cash and excludes $2,084 spent on fees and slippage. |
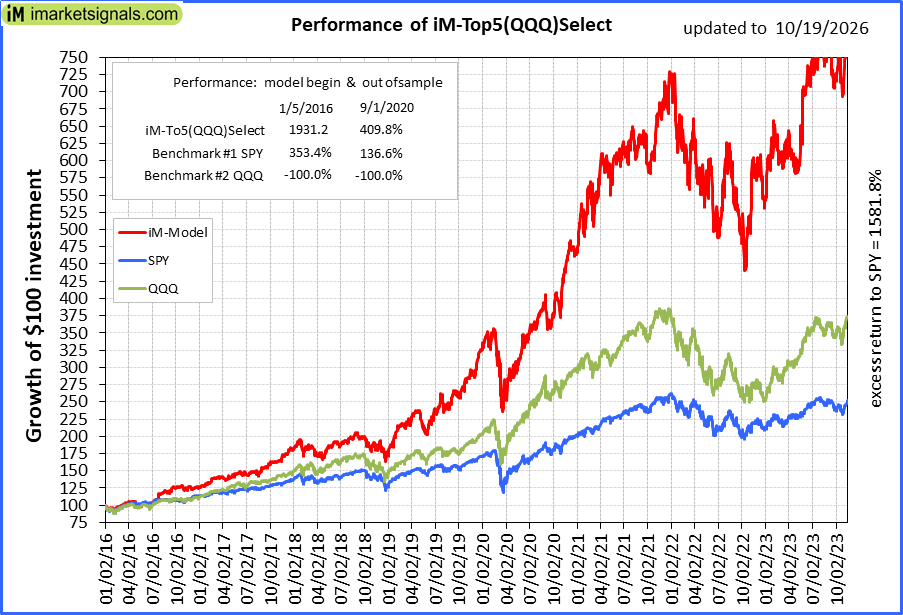 |
iM-Top5(QQQ)Select: Since inception, on 1/5/2016, the model gained 1928.89% while the benchmark SPY gained 347.06% over the same period. Over the previous week the market value of iM-Top5(QQQ)Select gained 1.60% at a time when SPY gained -1.49%. A starting capital of $100,000 at inception on 1/5/2016 would have grown to $2,028,890 which includes -$27,079 cash and excludes $35,396 spent on fees and slippage. |
 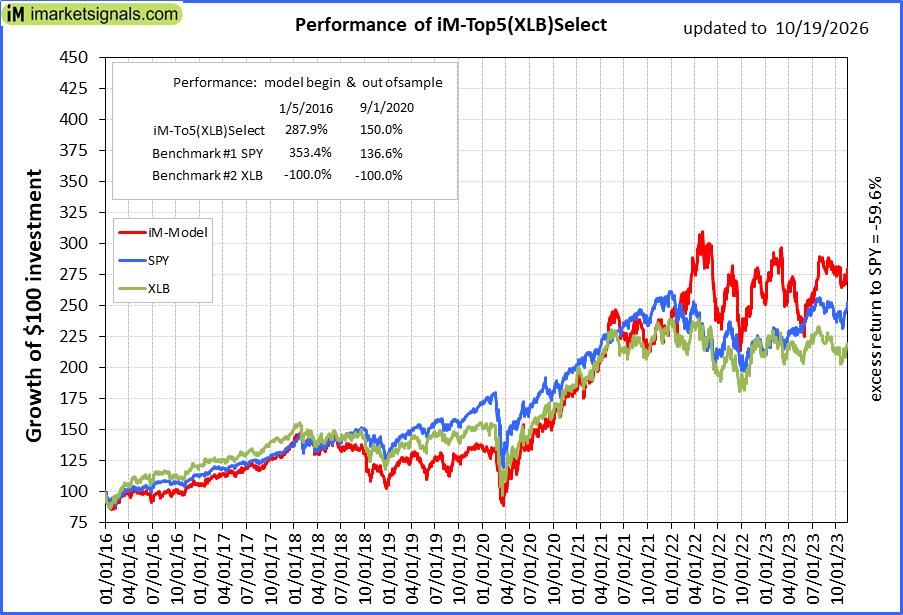 |
iM-Top5(XLB)Select: Since inception, on 1/5/2016, the model gained 287.45% while the benchmark SPY gained 347.06% over the same period. Over the previous week the market value of iM-Top5(XLB)Select gained 3.02% at a time when SPY gained -1.49%. A starting capital of $100,000 at inception on 1/5/2016 would have grown to $387,445 which includes $3,848 cash and excludes $18,262 spent on fees and slippage. |
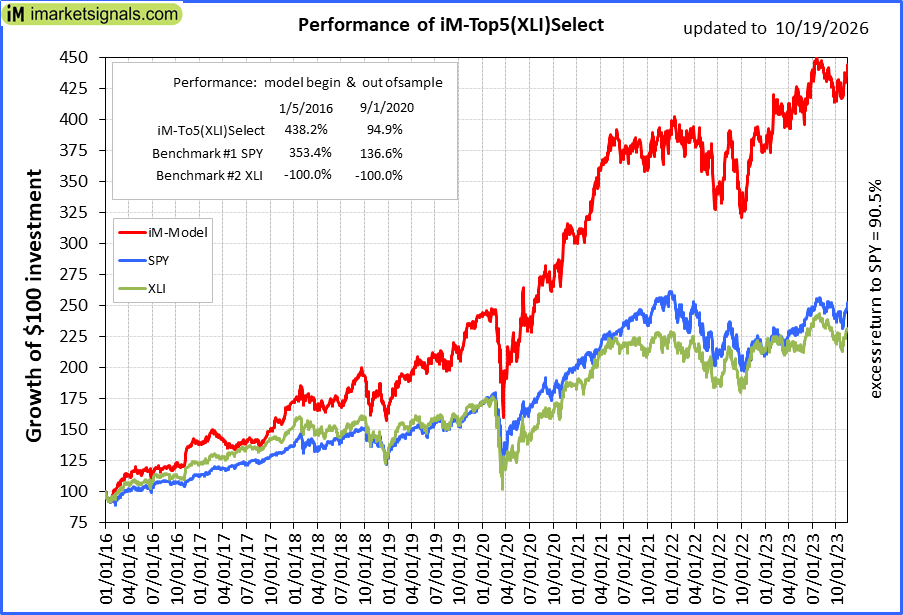 |
iM-Top5(XLI)Select: Since inception, on 1/5/2016, the model gained 437.57% while the benchmark SPY gained 347.06% over the same period. Over the previous week the market value of iM-Top5(XLI)Select gained 2.91% at a time when SPY gained -1.49%. A starting capital of $100,000 at inception on 1/5/2016 would have grown to $537,574 which includes $78 cash and excludes $10,234 spent on fees and slippage. |
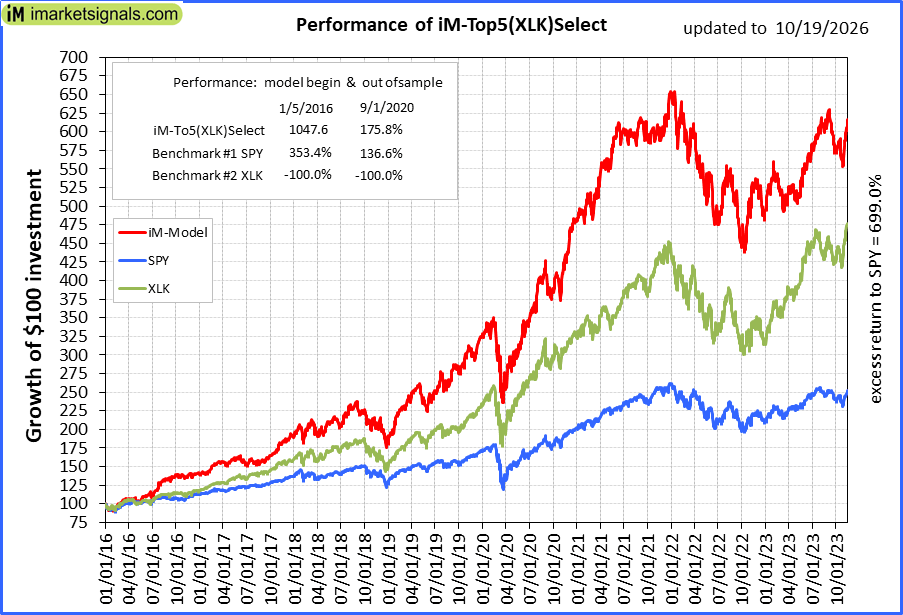 |
iM-Top5(XLK)Select: Since inception, on 1/5/2016, the model gained 1046.08% while the benchmark SPY gained 347.06% over the same period. Over the previous week the market value of iM-Top5(XLK)Select gained -0.70% at a time when SPY gained -1.49%. A starting capital of $100,000 at inception on 1/5/2016 would have grown to $1,146,085 which includes $457 cash and excludes $3,952 spent on fees and slippage. |
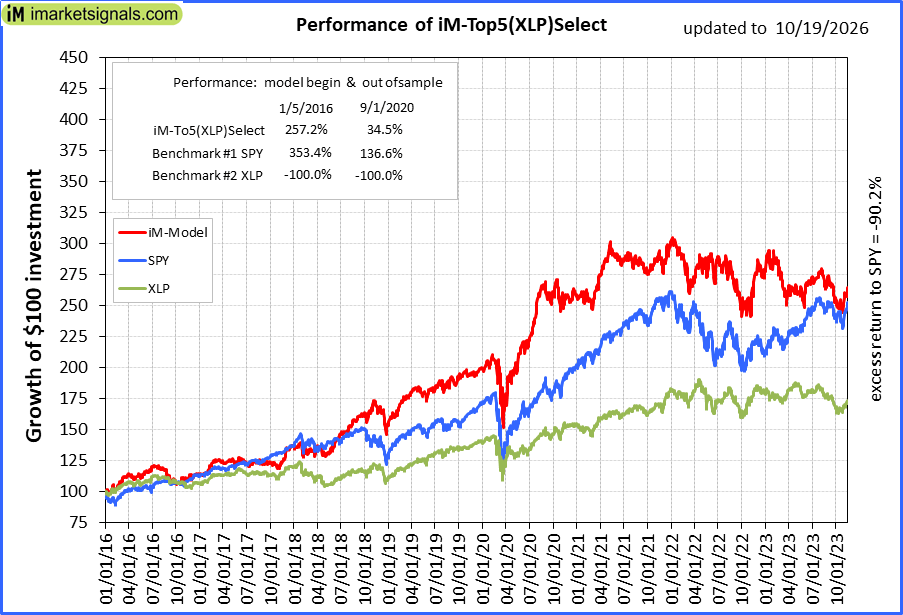 |
iM-Top5(XLP)Select: Since inception, on 1/5/2016, the model gained 256.82% while the benchmark SPY gained 347.06% over the same period. Over the previous week the market value of iM-Top5(XLP)Select gained 5.09% at a time when SPY gained -1.49%. A starting capital of $100,000 at inception on 1/5/2016 would have grown to $356,815 which includes -$986 cash and excludes $3,653 spent on fees and slippage. |
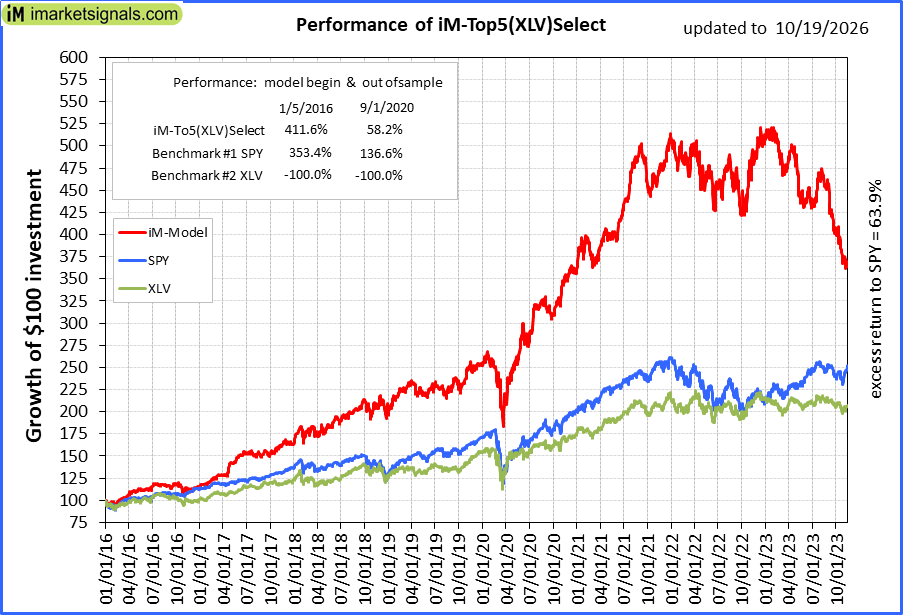 |
iM-Top5(XLV)Select: Since inception, on 1/5/2016, the model gained 410.99% while the benchmark SPY gained 347.06% over the same period. Over the previous week the market value of iM-Top5(XLV)Select gained 3.27% at a time when SPY gained -1.49%. A starting capital of $100,000 at inception on 1/5/2016 would have grown to $510,990 which includes $1,243 cash and excludes $20,953 spent on fees and slippage. |
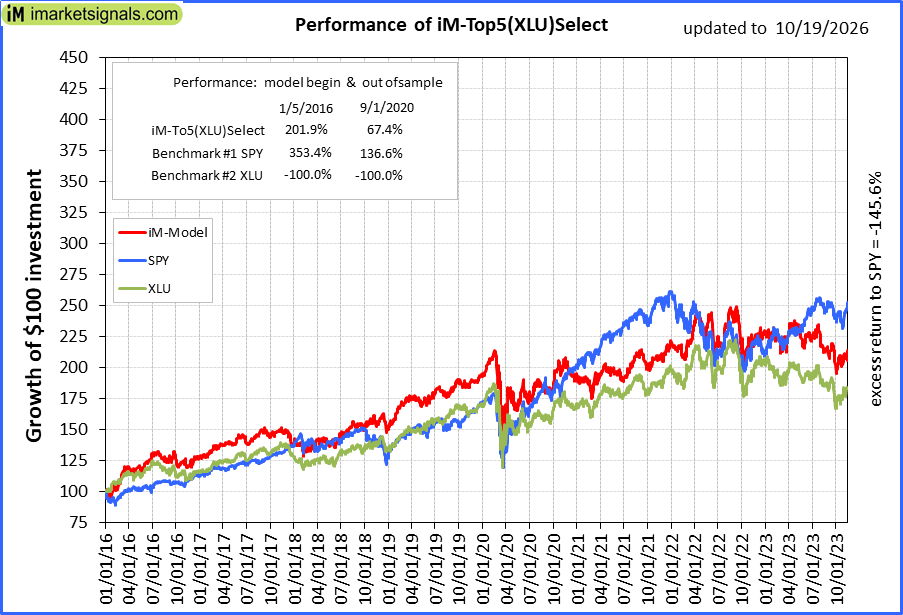 |
iM-Top5(XLU)Select: Since inception, on 1/5/2016, the model gained 201.46% while the benchmark SPY gained 347.06% over the same period. Over the previous week the market value of iM-Top5(XLU)Select gained 0.04% at a time when SPY gained -1.49%. A starting capital of $100,000 at inception on 1/5/2016 would have grown to $301,458 which includes $3,811 cash and excludes $19,252 spent on fees and slippage. |
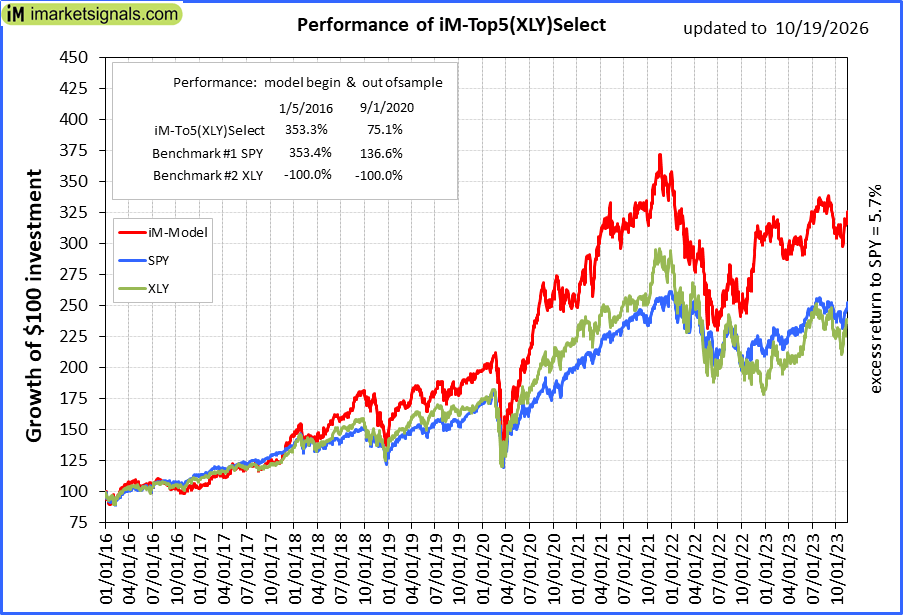 |
iM-Top5(XLY)Select: Since inception, on 1/5/2016, the model gained 352.75% while the benchmark SPY gained 347.06% over the same period. Over the previous week the market value of iM-Top5(XLY)Select gained 2.96% at a time when SPY gained -1.49%. A starting capital of $100,000 at inception on 1/5/2016 would have grown to $452,753 which includes $480 cash and excludes $8,975 spent on fees and slippage. |
|
|
iM-Seasonal Super-Sectors (Top5 combo) : Since inception, on 11/17/2020, the model gained 152.63% while the benchmark SPY gained 132.07% over the same period. Over the previous week the market value of iM-Seasonal Super-Sectors (Top5 combo) gained 1.49% at a time when SPY gained -1.49%. A starting capital of $100,000 at inception on 11/17/2020 would have grown to $252,632 which includes $939 cash and excludes $00 spent on fees and slippage. |
| iM-Dividend Growth Portfolio: The model’s out of sample performance YTD is 30.1%, and for the last 12 months is 28.9%. Over the same period the benchmark SPY performance was 13.3% and 16.6% respectively. Over the previous week the market value of the iM-Dividend Growth Portfolio gained 2.03% at a time when SPY gained -1.49%. A starting capital of $100,000 at inception on 6/30/2016 would have grown to $692,884 which includes $1,552 cash and excludes $16,095 spent on fees and slippage. | |
| iM-Gold Momentum Timer (AU, NEM, SBSW): The model’s out of sample performance YTD is -10.7%, and for the last 12 months is 11.8%. Over the same period the benchmark SPY performance was 13.3% and 16.6% respectively. Over the previous week the market value of iM-Gold Momentum Timer (AU, NEM, SBSW) gained -1.89% at a time when SPY gained -1.49%. A starting capital of $100,000 at inception on 6/30/2016 would have grown to -$27,095 which includes $306,772 cash and excludes Gain to date spent on fees and slippage. | |
|
|
iM-ModSum/YieldCurve Timer: The model’s out of sample performance YTD is 9.7%, and for the last 12 months is 9.4%. Over the same period the benchmark SPY performance was 13.3% and 16.6% respectively. Over the previous week the market value of iM-PortSum/YieldCurve Timer gained -1.49% at a time when SPY gained -1.49%. A starting capital of $100,000 at inception on 1/1/2016 would have grown to $420,175 which includes $144 cash and excludes $2,605 spent on fees and slippage. |
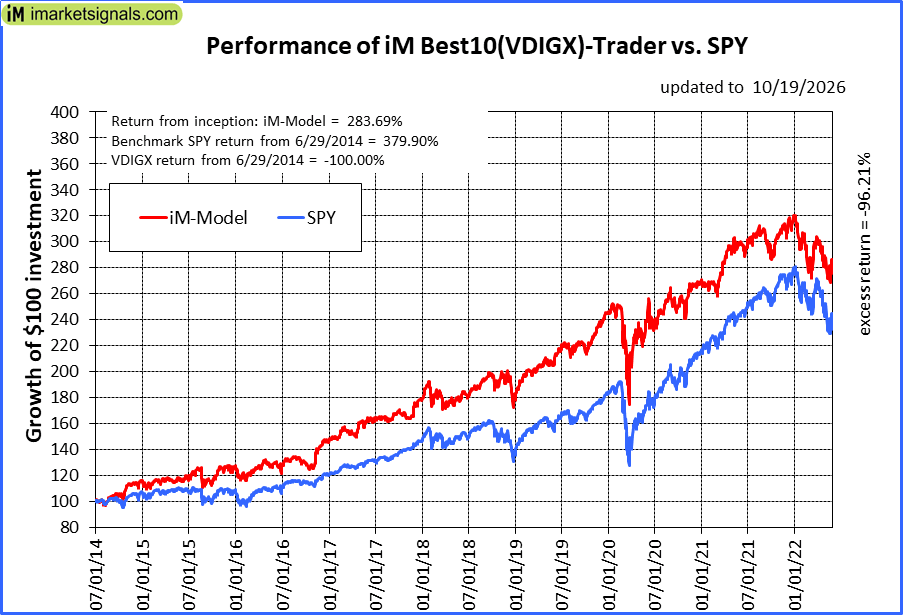 |
iM-Best10(VDIGX)-Trader: The model’s out of sample performance YTD is 3.0%, and for the last 12 months is 6.4%. Over the same period the benchmark SPY performance was 13.3% and 16.6% respectively. Since inception, on 7/1/2014, the model gained 283.69% while the benchmark SPY gained 379.90% and VDIGX gained -100.00% over the same period. Over the previous week the market value of iM-Best10(VDIGX) gained 3.62% at a time when SPY gained -1.49%. A starting capital of $100,000 at inception on 7/1/2014 would have grown to $383,690 which includes $1,093 cash and excludes $5,836 spent on fees and slippage. |
|
|
iM 6-Stock Capital Strength Portfolio: The model’s out of sample performance YTD is 30.6%, and for the last 12 months is 33.6%. Over the same period the benchmark SPY performance was 13.3% and 16.6% respectively. Over the previous week the market value of the iM 6-Stock Capital Strength Portfolio gained 3.86% at a time when SPY gained -1.49%. A starting capital of $100,000 at inception on 10/28/2016 would have grown to $335,470 which includes $2,680 cash and excludes $4,732 spent on fees and slippage. |
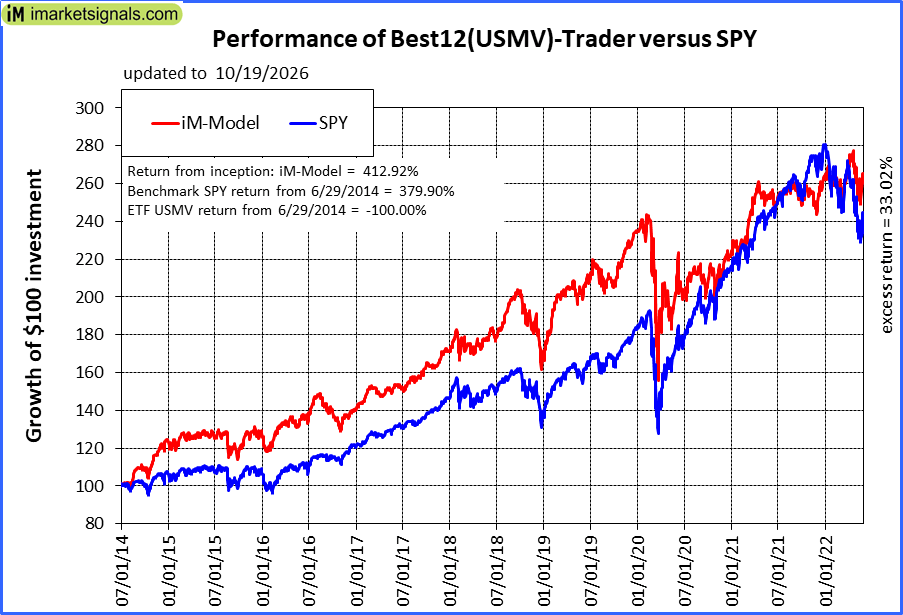 |
iM-Best12(USMV)-Trader: The model’s out of sample performance YTD is 20.1%, and for the last 12 months is 23.8%. Over the same period the benchmark SPY performance was 13.3% and 16.6% respectively. Since inception, on 6/30/2014, the model gained 412.92% while the benchmark SPY gained 379.90% and the ETF USMV gained -100.00% over the same period. Over the previous week the market value of iM-Best12(USMV)-Trader gained -0.94% at a time when SPY gained -1.49%. A starting capital of $100,000 at inception on 6/30/2014 would have grown to $512,920 which includes $1,734 cash and excludes $9,286 spent on fees and slippage. |
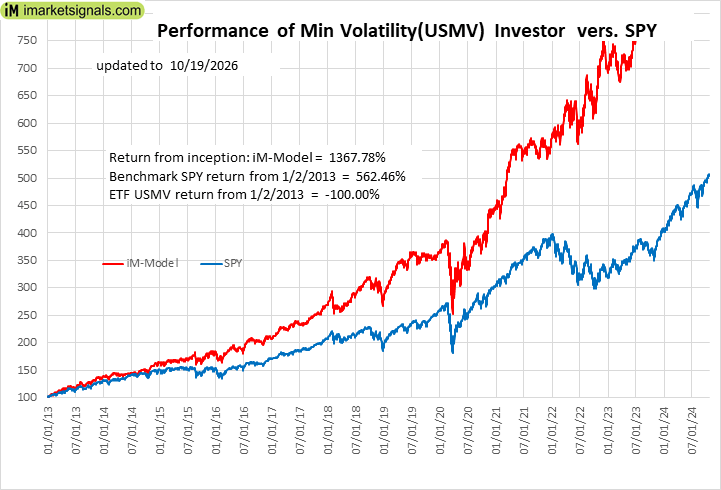 |
iM-Min Volatility(USMV) Investor (Tax Efficient): The model’s out of sample performance YTD is 23.3%, and for the last 12 months is 24.5%. Over the same period the benchmark SPY performance was 13.3% and 16.6% respectively. Since inception, on 1/3/2013, the model gained 1367.78% while the benchmark SPY gained 562.46% and the ETF USMV gained -100.00% over the same period. Over the previous week the market value of iM-Best12(USMV)Q1 gained 2.15% at a time when SPY gained -1.49%. A starting capital of $100,000 at inception on 1/3/2013 would have grown to $1,467,783 which includes $166 cash and excludes $18,626 spent on fees and slippage. |
|
|
iM-Bond Market Trader (High-Yield Bond or 10-yr Treasury Bond): The model’s out of sample performance YTD is -2.3%, and for the last 12 months is -2.6%. Over the same period the benchmark BND performance was -1.8% and -1.9% respectively. Over the previous week the market value of the iM-Bond Market Trader (High-Yield Bond or 10-yr Treasury Bond) gained 0.71% at a time when BND gained 0.50%. A starting capital of $10,000 at inception on 1/3/2000 would have grown to $145,719 which includes $2,492 cash and excludes $2,977 spent on fees and slippage. |
|
|
iM-ModSum/YieldCurve Timer: The model’s out of sample performance YTD is 9.7%, and for the last 12 months is 9.4%. Over the same period the benchmark SPY performance was 13.3% and 16.6% respectively. Over the previous week the market value of iM-PortSum/YieldCurve Timer gained -1.49% at a time when SPY gained -1.49%. A starting capital of $100,000 at inception on 1/1/2016 would have grown to $420,175 which includes $144 cash and excludes $2,605 spent on fees and slippage. |
|
|
iM-Best2 MC-Score ETF System: The model’s out of sample performance YTD is 11.5%, and for the last 12 months is 10.8%. Over the same period the benchmark SPY performance was 13.3% and 16.6% respectively. Over the previous week the market value of the iM-Best2 MC-Score ETF System gained 1.86% at a time when SPY gained -1.49%. A starting capital of $100,000 at inception on 6/30/2016 would have grown to $209,852 which includes $2,974 cash and excludes $5,779 spent on fees and slippage. |
|
|
iM-Best4 MC-Score Vanguard System: The model’s out of sample performance YTD is 3.8%, and for the last 12 months is 1.4%. Over the same period the benchmark SPY performance was 13.3% and 16.6% respectively. Over the previous week the market value of the iM-Best4 MC-Score Vanguard System gained 0.48% at a time when SPY gained -1.49%. A starting capital of $100,000 at inception on 6/30/2016 would have grown to $189,801 which includes $8,854 cash and excludes $00 spent on fees and slippage. |
|
|
iM-Composite (SPY-IEF) Timer: The model’s out of sample performance YTD is 14.6%, and for the last 12 months is 14.2%. Over the same period the benchmark SPY performance was 13.3% and 16.6% respectively. Over the previous week the market value of the iM-Composite (SPY-IEF) Timer gained -1.48% at a time when SPY gained -1.49%. A starting capital of $100,000 at inception on 6/30/2016 would have grown to $248,196 which includes $2,156 cash and excludes $8,651 spent on fees and slippage. |
|
|
iM-Composite(Gold-Stocks-Bond) Timer: The model’s out of sample performance YTD is -9.1%, and for the last 12 months is -7.4%. Over the same period the benchmark SPY performance was 13.3% and 16.6% respectively. Over the previous week the market value of the iM-Composite(Gold-Stocks-Bond) Timer gained -0.83% at a time when SPY gained -1.49%. A starting capital of $100,000 at inception on 6/30/2016 would have grown to $367,036 which includes -$556 cash and excludes $11,611 spent on fees and slippage. |
Posted in extra
BCI September 18, 2014
 The BCI at 178.4 is up from last week’s 177.8. The BCIg, the smoothed annualized growth of BCI, at 18.2 is also up from last week’s 18.1.
Read more >
Posted in pmp BCI
BCI September 11, 2014
 The BCI at 177.8 is up from last week’s downward revised 177.6. The BCIg, the smoothed annualized growth of BCI, at 18.1 is also up from last week’s downward revised 17.9.
Read more >
Posted in pmp BCI

With reference to Section 202(a)(11)(D) of the Investment Advisers Act:
We are Engineers and not Investment Advisers,
read more ...
By the mere act of reading this page and navigating this site you acknowledge, agree to, and abide by the
Terms of Use / Disclaimer