
  |
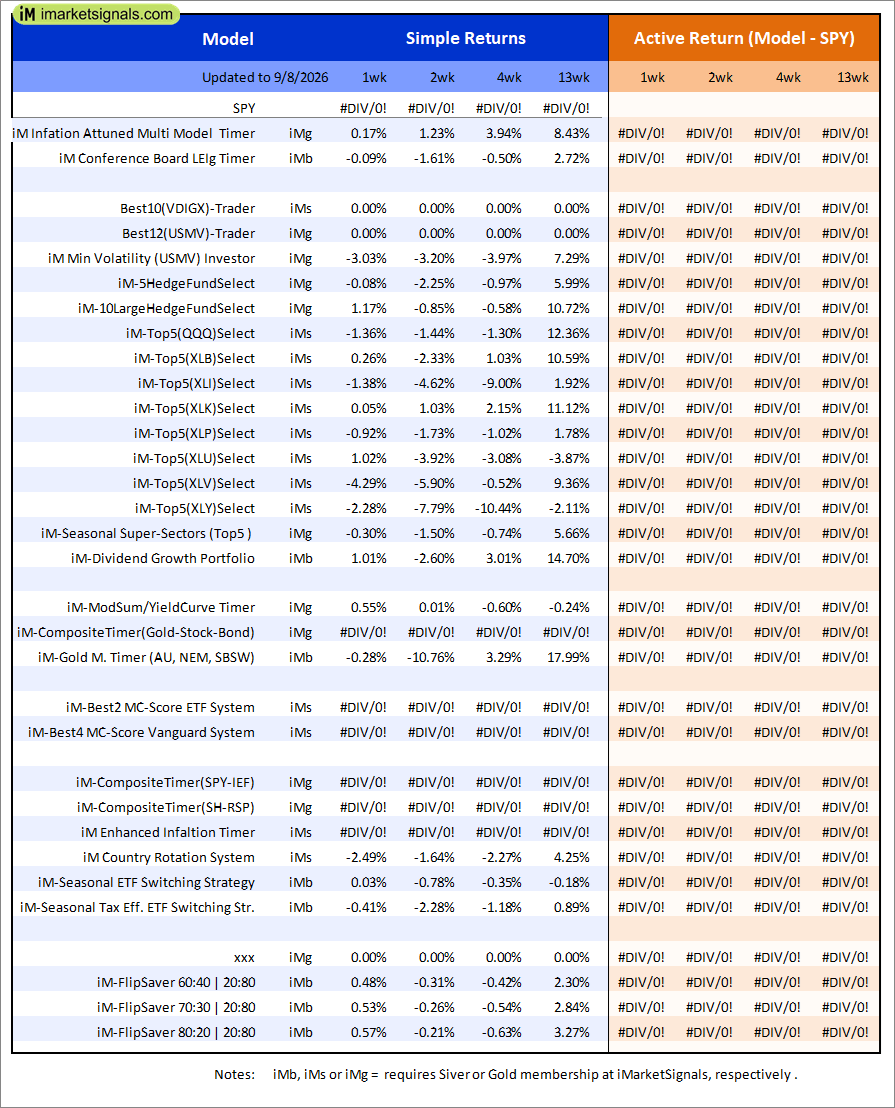
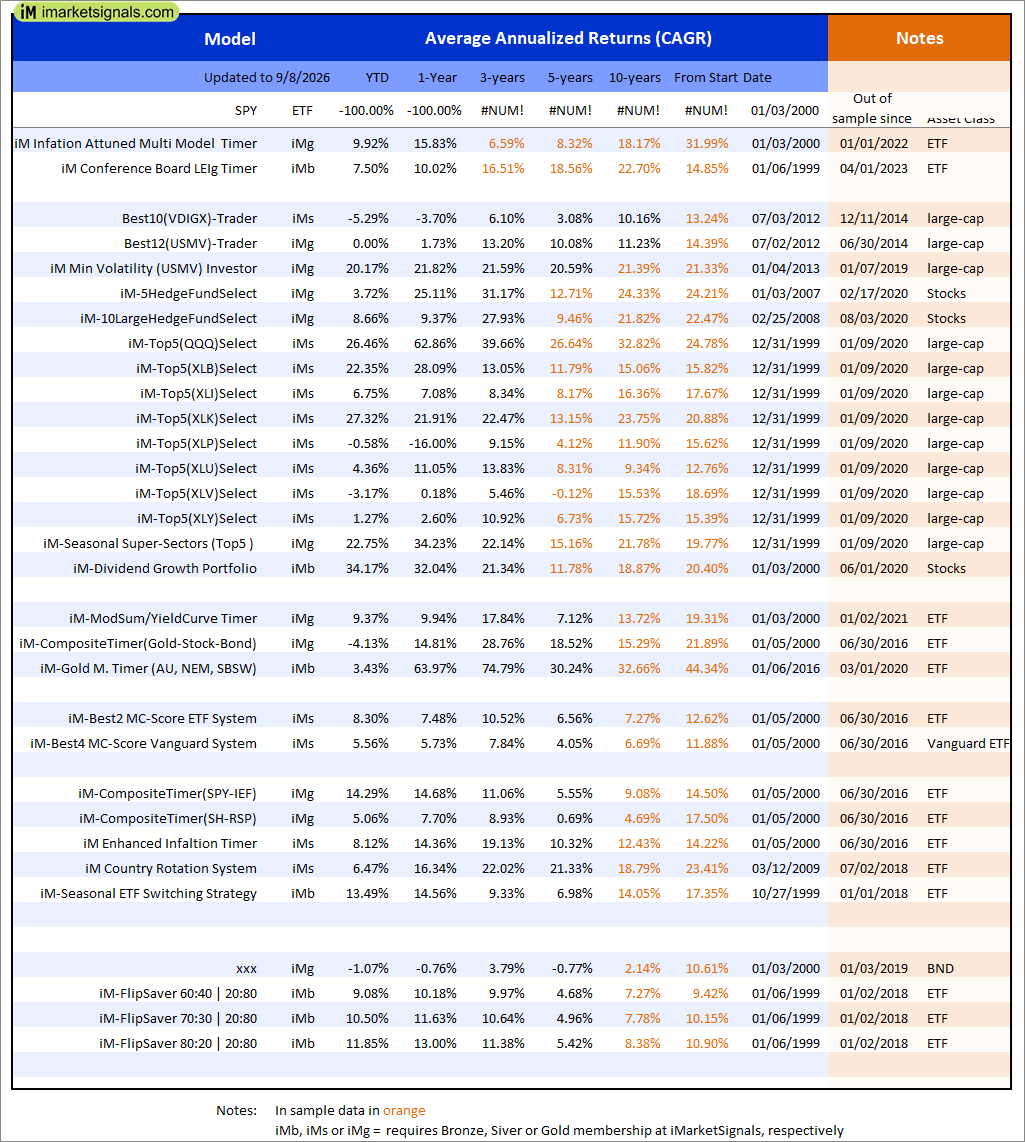
Out of sample performance summary of our models for the past 1, 2, 4 and 13 week periods. The active active return indicates how the models over- or underperformed the benchmark ETF SPY. Also the YTD, and the 1-, 3-, 5- and 10-year annualized returns are shown in the second table |
 |
iM-Inflation Attuned Multi-Model Market Timer: The model’s out of sample performance YTD is 9.9%, and for the last 12 months is 15.8%. Over the same period the benchmark SPY performance was 12.9% and 19.7% respectively. Over the previous week the market value of the iM-Inflation Attuned Multi-Model Market Timer gained 0.17% at a time when SPY gained 0.55%. A starting capital of $100,000 at inception on 3/24/2017 would have grown to $168,327,935 which includes $3,098,198 cash and excludes $4,103,439 spent on fees and slippage. |
|
|
iM-Conference Board LEIg Timer: The model’s performance YTD is 14.3%, and for the last 12 months is 7.3%. Over the same period the benchmark SPY performance was 20.1% and 9.4% respectively. Over the previous week the market value of the iM-Conference Board LEIg Timer gained -0.05% at a time when SPY gained 0.55%. A starting capital of $100,000 at inception on 4/5/2017 would have grown to $763,593 which includes $6,308 cash and excludes $769 spent on fees and slippage. |
| iM-FlipSaver 60:40 | 20:80 – 2017: The model’s out of sample performance YTD is 9.1%, and for the last 12 months is 10.2%. Over the same period the benchmark E60B40 performance was 7.6% and 11.9% respectively. Over the previous week the market value of iM-FlipSaver 80:20 | 20:80 gained 0.49% at a time when SPY gained 0.39%. A starting capital of $100,000 at inception on 7/16/2015 would have grown to $195,792 which includes $64 cash and excludes $5,614 spent on fees and slippage. | |
| iM-FlipSaver 70:30 | 20:80 – 2017: The model’s out of sample performance YTD is 10.5%, and for the last 12 months is 11.6%. Over the same period the benchmark E60B40 performance was 7.6% and 11.9% respectively. Over the previous week the market value of iM-FlipSaver 70:30 | 20:80 gained 0.53% at a time when SPY gained 0.39%. A starting capital of $100,000 at inception on 7/15/2015 would have grown to $206,448 which includes $453 cash and excludes $5,886 spent on fees and slippage. | |
| iM-FlipSaver 80:20 | 20:80 – 2017: The model’s out of sample performance YTD is 11.8%, and for the last 12 months is 13.0%. Over the same period the benchmark E60B40 performance was 7.6% and 11.9% respectively. Over the previous week the market value of iM-FlipSaver 80:20 | 20:80 gained 0.57% at a time when SPY gained 0.39%. A starting capital of $100,000 at inception on 1/2/2017 would have grown to $217,206 which includes $2,109 cash and excludes $6,148 spent on fees and slippage. | |
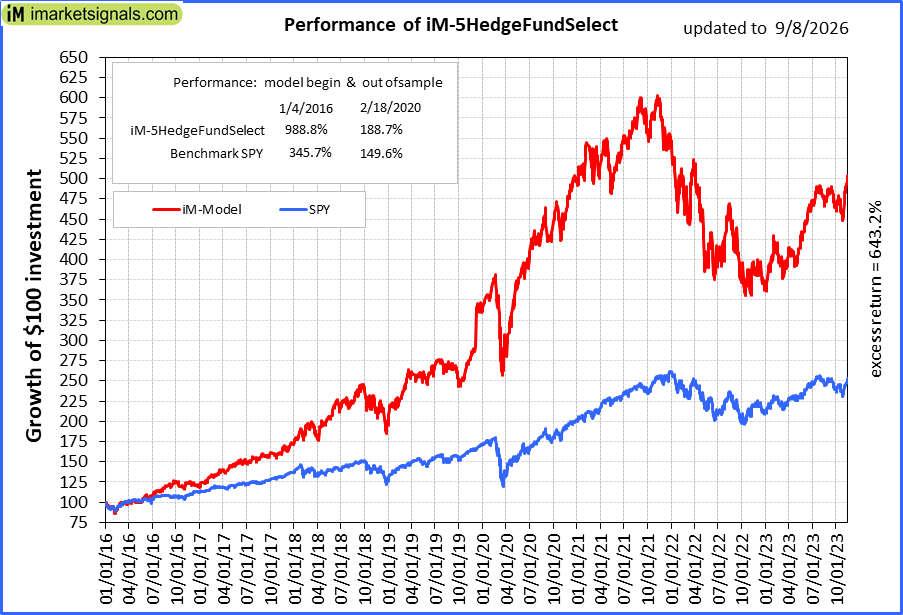 |
iM-5HedgeFundSelect: Since inception, on 1/5/2016, the model gained 988.83% while the benchmark SPY gained 345.65% over the same period. Over the previous week the market value of iM-5HedgeFundSelect gained -0.07% at a time when SPY gained 0.55%. A starting capital of $25,000 at inception on 1/5/2016 would have grown to $272,208 which includes $2,336 cash and excludes $3,466 spent on fees and slippage. |
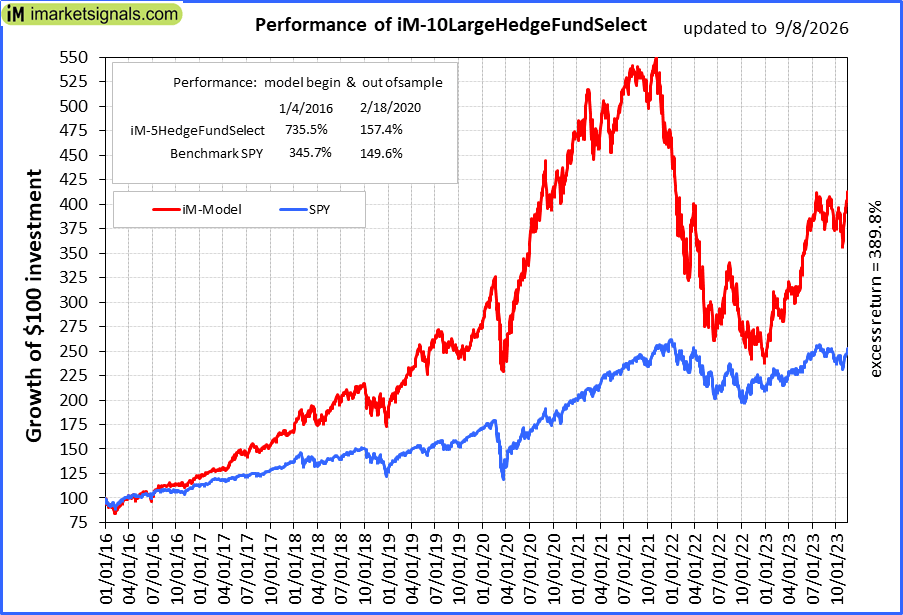 |
iM-10LargeHedgeFundSelect: Since inception, on 1/5/2016, the model gained 735.47% while the benchmark SPY gained 345.65% over the same period. Over the previous week the market value of iM-10LargeHedgeFundSelect gained 1.17% at a time when SPY gained 0.55%. A starting capital of $25,000 at inception on 1/5/2016 would have grown to $198,419 which includes -$10,257 cash and excludes $2,030 spent on fees and slippage. |
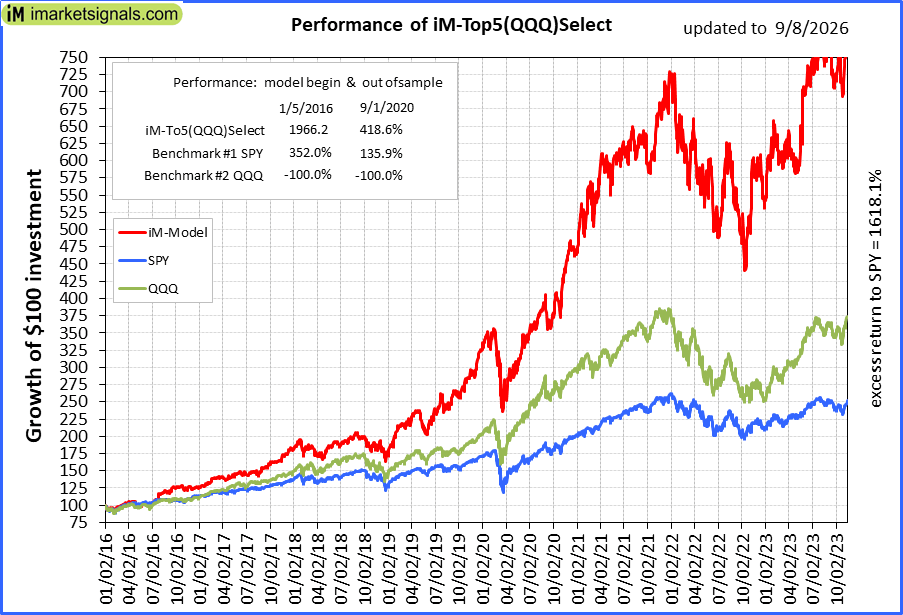 |
iM-Top5(QQQ)Select: Since inception, on 1/5/2016, the model gained 1963.77% while the benchmark SPY gained 345.65% over the same period. Over the previous week the market value of iM-Top5(QQQ)Select gained -1.36% at a time when SPY gained 0.55%. A starting capital of $100,000 at inception on 1/5/2016 would have grown to $2,063,772 which includes -$35,962 cash and excludes $34,523 spent on fees and slippage. |
 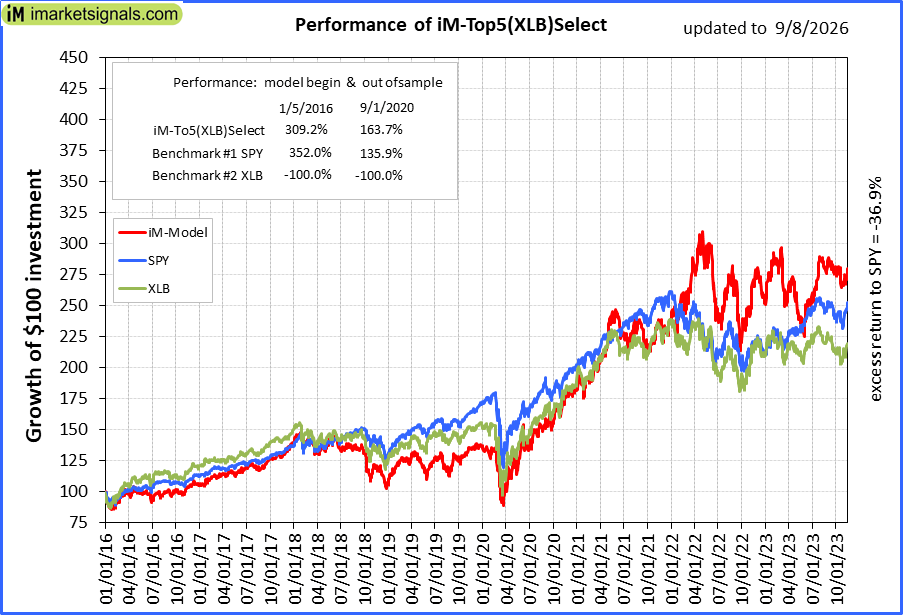 |
iM-Top5(XLB)Select: Since inception, on 1/5/2016, the model gained 308.74% while the benchmark SPY gained 345.65% over the same period. Over the previous week the market value of iM-Top5(XLB)Select gained 0.26% at a time when SPY gained 0.55%. A starting capital of $100,000 at inception on 1/5/2016 would have grown to $408,741 which includes $3,848 cash and excludes $18,262 spent on fees and slippage. |
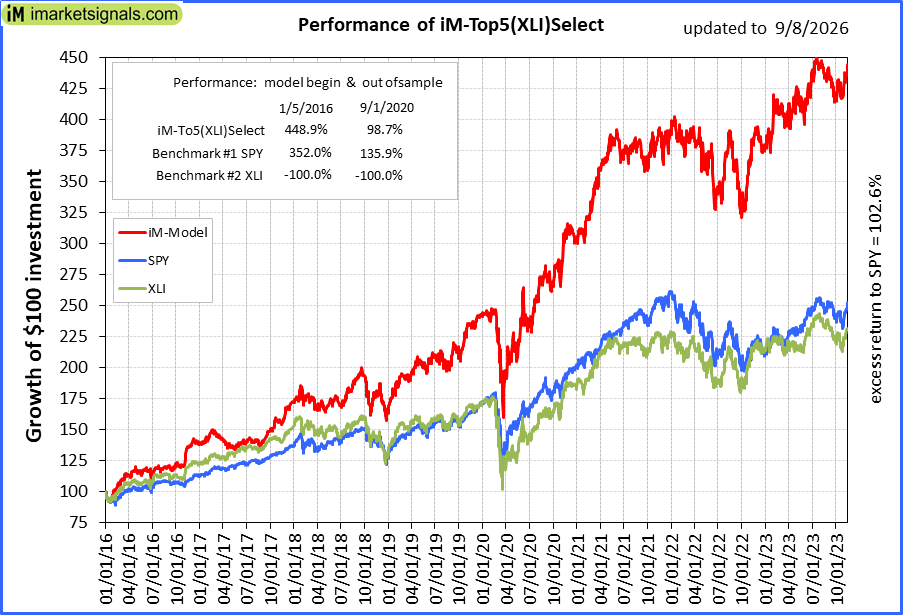 |
iM-Top5(XLI)Select: Since inception, on 1/5/2016, the model gained 448.28% while the benchmark SPY gained 345.65% over the same period. Over the previous week the market value of iM-Top5(XLI)Select gained -1.38% at a time when SPY gained 0.55%. A starting capital of $100,000 at inception on 1/5/2016 would have grown to $548,276 which includes $2,932 cash and excludes $10,212 spent on fees and slippage. |
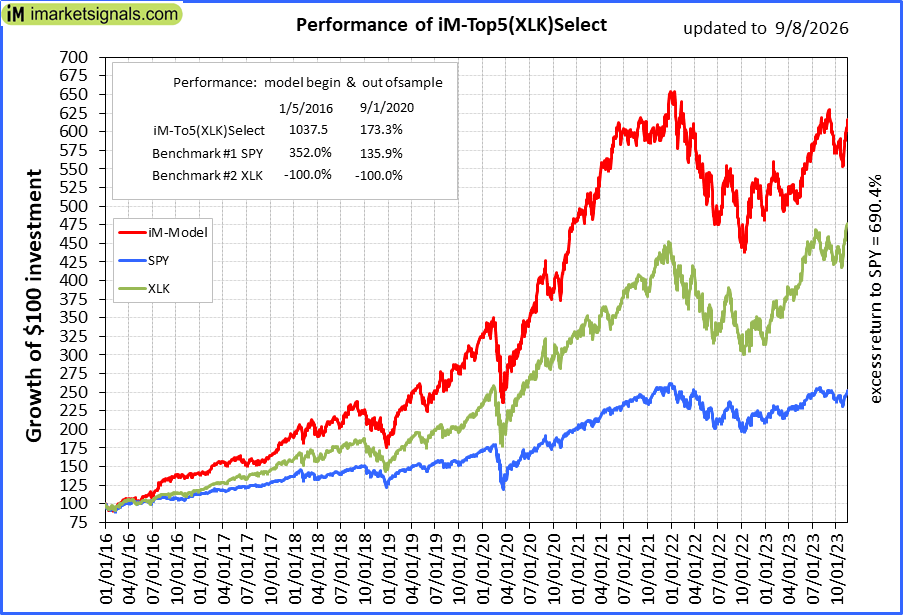 |
iM-Top5(XLK)Select: Since inception, on 1/5/2016, the model gained 1036.02% while the benchmark SPY gained 345.65% over the same period. Over the previous week the market value of iM-Top5(XLK)Select gained 0.05% at a time when SPY gained 0.55%. A starting capital of $100,000 at inception on 1/5/2016 would have grown to $1,136,019 which includes $3,728 cash and excludes $3,886 spent on fees and slippage. |
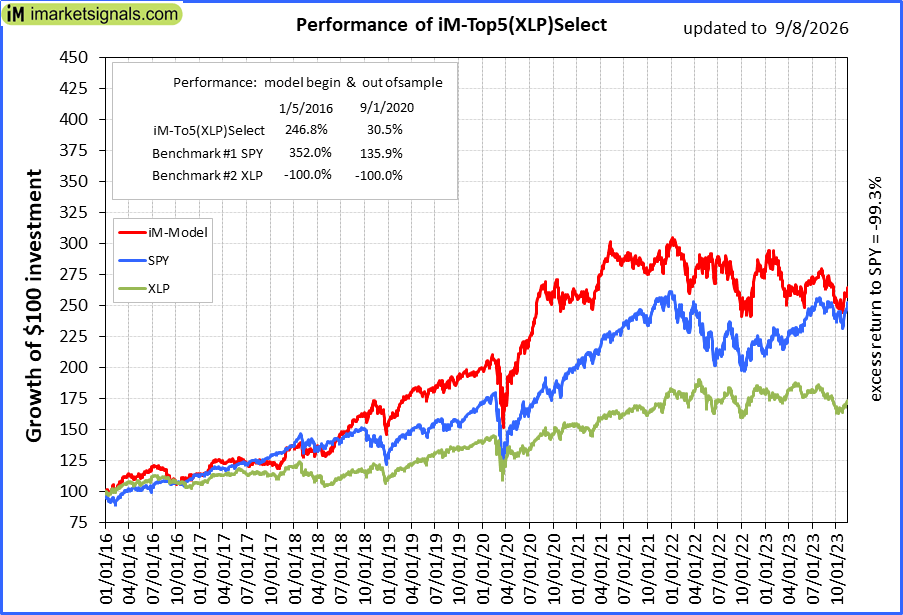 |
iM-Top5(XLP)Select: Since inception, on 1/5/2016, the model gained 246.36% while the benchmark SPY gained 345.65% over the same period. Over the previous week the market value of iM-Top5(XLP)Select gained -0.92% at a time when SPY gained 0.55%. A starting capital of $100,000 at inception on 1/5/2016 would have grown to $346,361 which includes $1,395 cash and excludes $3,557 spent on fees and slippage. |
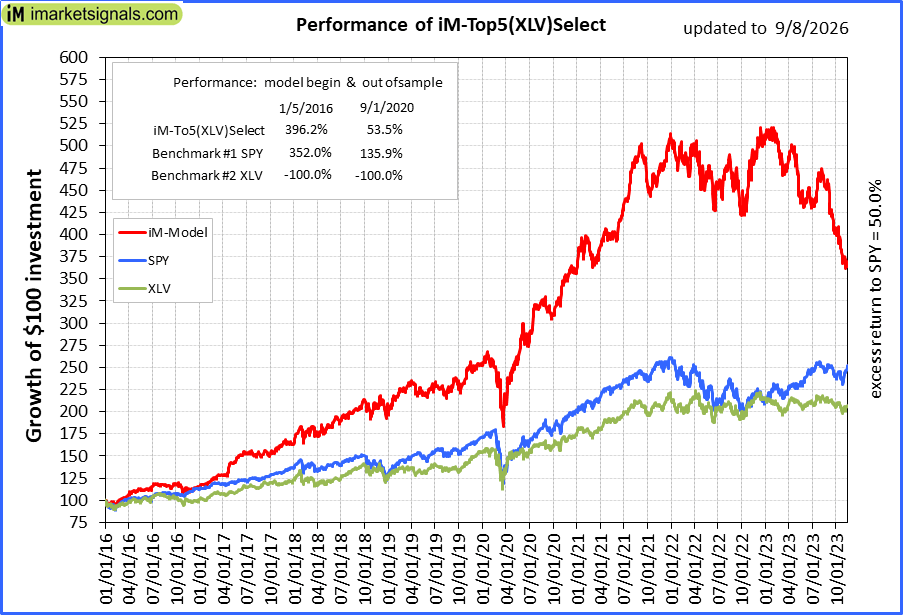 |
iM-Top5(XLV)Select: Since inception, on 1/5/2016, the model gained 395.63% while the benchmark SPY gained 345.65% over the same period. Over the previous week the market value of iM-Top5(XLV)Select gained -4.29% at a time when SPY gained 0.55%. A starting capital of $100,000 at inception on 1/5/2016 would have grown to $495,628 which includes -$10,939 cash and excludes $20,936 spent on fees and slippage. |
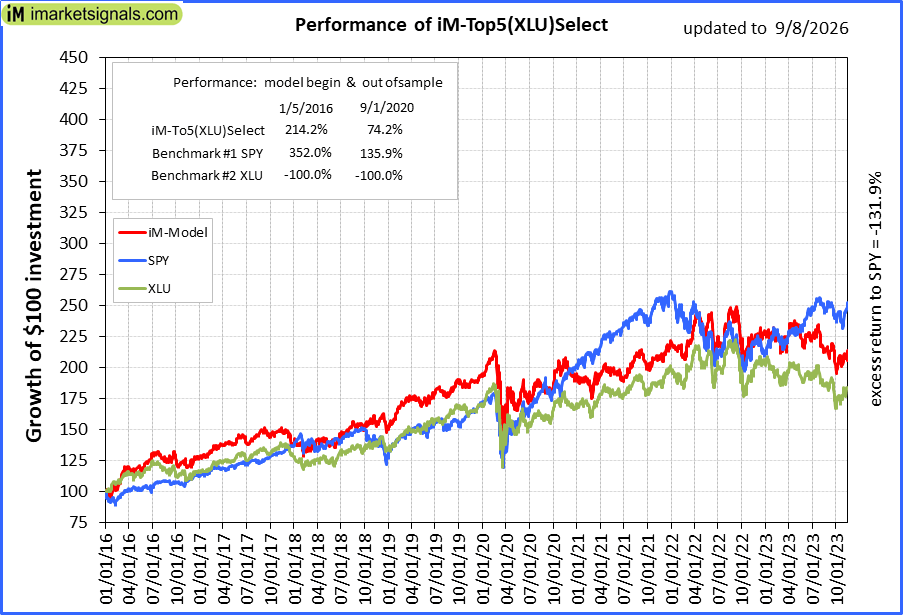 |
iM-Top5(XLU)Select: Since inception, on 1/5/2016, the model gained 213.80% while the benchmark SPY gained 345.65% over the same period. Over the previous week the market value of iM-Top5(XLU)Select gained 1.02% at a time when SPY gained 0.55%. A starting capital of $100,000 at inception on 1/5/2016 would have grown to $313,801 which includes $2,442 cash and excludes $19,237 spent on fees and slippage. |
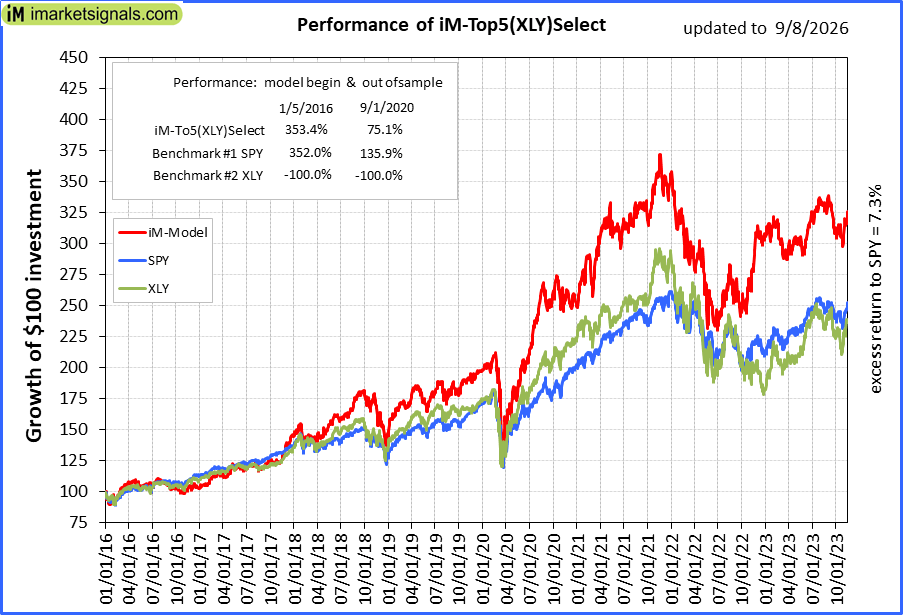 |
iM-Top5(XLY)Select: Since inception, on 1/5/2016, the model gained 352.90% while the benchmark SPY gained 345.65% over the same period. Over the previous week the market value of iM-Top5(XLY)Select gained -2.28% at a time when SPY gained 0.55%. A starting capital of $100,000 at inception on 1/5/2016 would have grown to $452,899 which includes $726 cash and excludes $8,640 spent on fees and slippage. |
|
|
iM-Seasonal Super-Sectors (Top5 combo) : Since inception, on 11/17/2020, the model gained 153.60% while the benchmark SPY gained 131.34% over the same period. Over the previous week the market value of iM-Seasonal Super-Sectors (Top5 combo) gained -0.30% at a time when SPY gained 0.55%. A starting capital of $100,000 at inception on 11/17/2020 would have grown to $253,603 which includes -$1,281 cash and excludes $00 spent on fees and slippage. |
| iM-Dividend Growth Portfolio: The model’s out of sample performance YTD is 33.3%, and for the last 12 months is 31.8%. Over the same period the benchmark SPY performance was 12.9% and 19.7% respectively. Over the previous week the market value of the iM-Dividend Growth Portfolio gained 0.77% at a time when SPY gained 0.55%. A starting capital of $100,000 at inception on 6/30/2016 would have grown to $710,088 which includes $2,868 cash and excludes $16,076 spent on fees and slippage. | |
| iM-Gold Momentum Timer (AU, NEM, SBSW): The model’s out of sample performance YTD is 3.4%, and for the last 12 months is 64.0%. Over the same period the benchmark SPY performance was 12.9% and 19.7% respectively. Over the previous week the market value of iM-Gold Momentum Timer (AU, NEM, SBSW) gained -0.28% at a time when SPY gained 0.55%. A starting capital of $100,000 at inception on 6/30/2016 would have grown to -$39,182 which includes $279,853 cash and excludes Gain to date spent on fees and slippage. | |
|
|
iM-ModSum/YieldCurve Timer: The model’s out of sample performance YTD is 9.4%, and for the last 12 months is 9.9%. Over the same period the benchmark SPY performance was 12.9% and 19.7% respectively. Over the previous week the market value of iM-PortSum/YieldCurve Timer gained 0.55% at a time when SPY gained 0.55%. A starting capital of $100,000 at inception on 1/1/2016 would have grown to $418,855 which includes -$891 cash and excludes $2,605 spent on fees and slippage. |
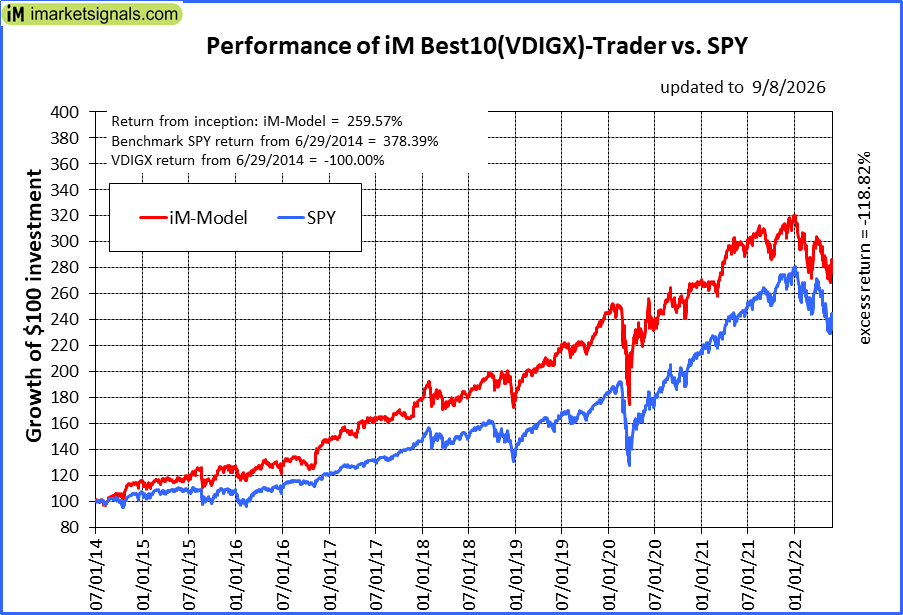 |
iM-Best10(VDIGX)-Trader: The model’s out of sample performance YTD is -3.5%, and for the last 12 months is -2.0%. Over the same period the benchmark SPY performance was 12.9% and 19.7% respectively. Since inception, on 7/1/2014, the model gained 259.57% while the benchmark SPY gained 378.39% and VDIGX gained -100.00% over the same period. Over the previous week the market value of iM-Best10(VDIGX) gained -2.36% at a time when SPY gained 0.55%. A starting capital of $100,000 at inception on 7/1/2014 would have grown to $359,566 which includes $746 cash and excludes $5,808 spent on fees and slippage. |
|
|
iM 6-Stock Capital Strength Portfolio: The model’s out of sample performance YTD is 26.7%, and for the last 12 months is 25.6%. Over the same period the benchmark SPY performance was 12.9% and 19.7% respectively. Over the previous week the market value of the iM 6-Stock Capital Strength Portfolio gained -2.34% at a time when SPY gained 0.55%. A starting capital of $100,000 at inception on 10/28/2016 would have grown to $325,426 which includes $777 cash and excludes $4,732 spent on fees and slippage. |
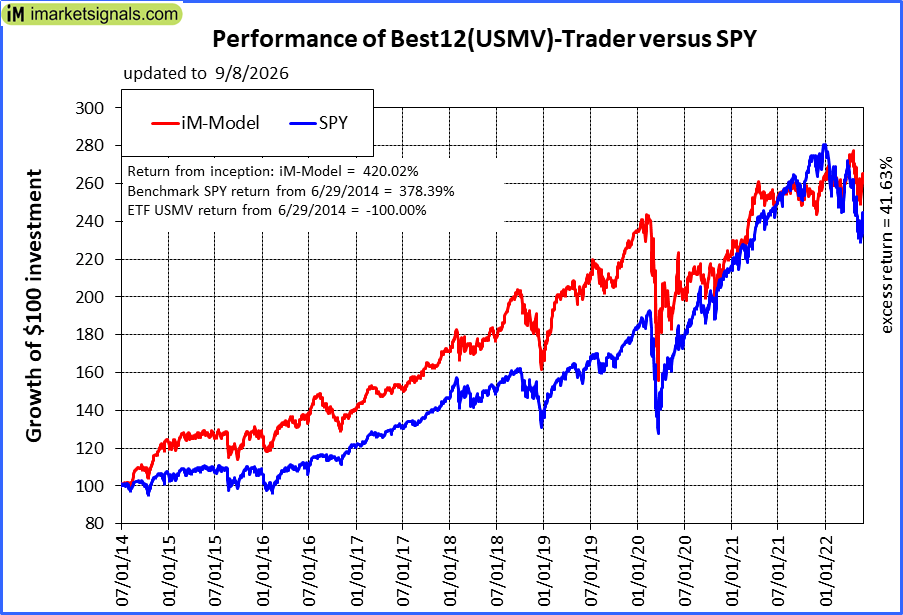 |
iM-Best12(USMV)-Trader: The model’s out of sample performance YTD is 21.7%, and for the last 12 months is 26.8%. Over the same period the benchmark SPY performance was 12.9% and 19.7% respectively. Since inception, on 6/30/2014, the model gained 420.02% while the benchmark SPY gained 378.39% and the ETF USMV gained -100.00% over the same period. Over the previous week the market value of iM-Best12(USMV)-Trader gained 0.26% at a time when SPY gained 0.55%. A starting capital of $100,000 at inception on 6/30/2014 would have grown to $520,017 which includes $165 cash and excludes $9,108 spent on fees and slippage. |
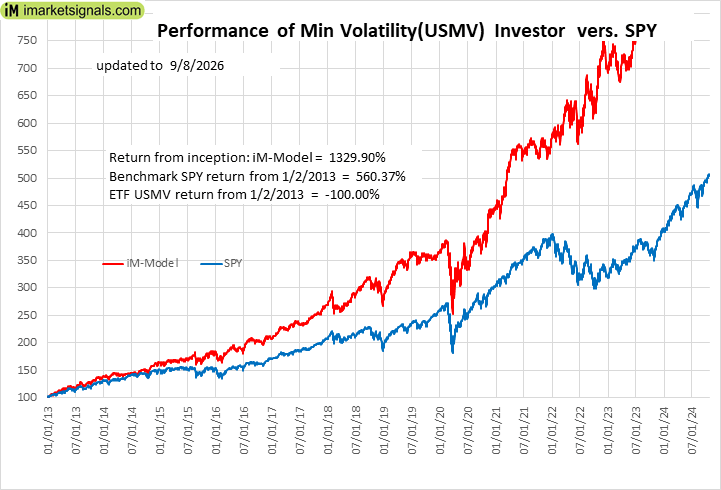 |
iM-Min Volatility(USMV) Investor (Tax Efficient): The model’s out of sample performance YTD is 20.1%, and for the last 12 months is 21.7%. Over the same period the benchmark SPY performance was 12.9% and 19.7% respectively. Since inception, on 1/3/2013, the model gained 1329.90% while the benchmark SPY gained 560.37% and the ETF USMV gained -100.00% over the same period. Over the previous week the market value of iM-Best12(USMV)Q1 gained -3.03% at a time when SPY gained 0.55%. A starting capital of $100,000 at inception on 1/3/2013 would have grown to $1,429,898 which includes -$340 cash and excludes $18,062 spent on fees and slippage. |
|
|
iM-Bond Market Trader (High-Yield Bond or 10-yr Treasury Bond): The model’s out of sample performance YTD is -0.4%, and for the last 12 months is -0.1%. Over the same period the benchmark BND performance was -0.3% and 0.7% respectively. Over the previous week the market value of the iM-Bond Market Trader (High-Yield Bond or 10-yr Treasury Bond) gained 0.06% at a time when BND gained 0.14%. A starting capital of $10,000 at inception on 1/3/2000 would have grown to $148,538 which includes $2,004 cash and excludes $2,977 spent on fees and slippage. |
|
|
iM-ModSum/YieldCurve Timer: The model’s out of sample performance YTD is 9.4%, and for the last 12 months is 9.9%. Over the same period the benchmark SPY performance was 12.9% and 19.7% respectively. Over the previous week the market value of iM-PortSum/YieldCurve Timer gained 0.55% at a time when SPY gained 0.55%. A starting capital of $100,000 at inception on 1/1/2016 would have grown to $418,855 which includes -$891 cash and excludes $2,605 spent on fees and slippage. |
|
|
iM-Best2 MC-Score ETF System: The model’s out of sample performance YTD is 8.3%, and for the last 12 months is 7.5%. Over the same period the benchmark SPY performance was 12.9% and 19.7% respectively. Over the previous week the market value of the iM-Best2 MC-Score ETF System gained -1.30% at a time when SPY gained 0.55%. A starting capital of $100,000 at inception on 6/30/2016 would have grown to $203,755 which includes $2,002 cash and excludes $5,779 spent on fees and slippage. |
|
|
iM-Best4 MC-Score Vanguard System: The model’s out of sample performance YTD is 5.5%, and for the last 12 months is 5.8%. Over the same period the benchmark SPY performance was 12.9% and 19.7% respectively. Over the previous week the market value of the iM-Best4 MC-Score Vanguard System gained 0.10% at a time when SPY gained 0.55%. A starting capital of $100,000 at inception on 6/30/2016 would have grown to $193,066 which includes $7,671 cash and excludes $00 spent on fees and slippage. |
|
|
iM-Composite (SPY-IEF) Timer: The model’s out of sample performance YTD is 14.3%, and for the last 12 months is 14.7%. Over the same period the benchmark SPY performance was 12.9% and 19.7% respectively. Over the previous week the market value of the iM-Composite (SPY-IEF) Timer gained 0.55% at a time when SPY gained 0.55%. A starting capital of $100,000 at inception on 6/30/2016 would have grown to $247,423 which includes $1,550 cash and excludes $8,651 spent on fees and slippage. |
|
|
iM-Composite(Gold-Stocks-Bond) Timer: The model’s out of sample performance YTD is -4.1%, and for the last 12 months is 14.8%. Over the same period the benchmark SPY performance was 12.9% and 19.7% respectively. Over the previous week the market value of the iM-Composite(Gold-Stocks-Bond) Timer gained 0.74% at a time when SPY gained 0.55%. A starting capital of $100,000 at inception on 6/30/2016 would have grown to $387,143 which includes -$51 cash and excludes $10,872 spent on fees and slippage. |
iM-Best Reports – 9/8/2026
Posted in pmp SPY-SH