We provide unbiased guidance to market direction. Our models can be classed into following groups:
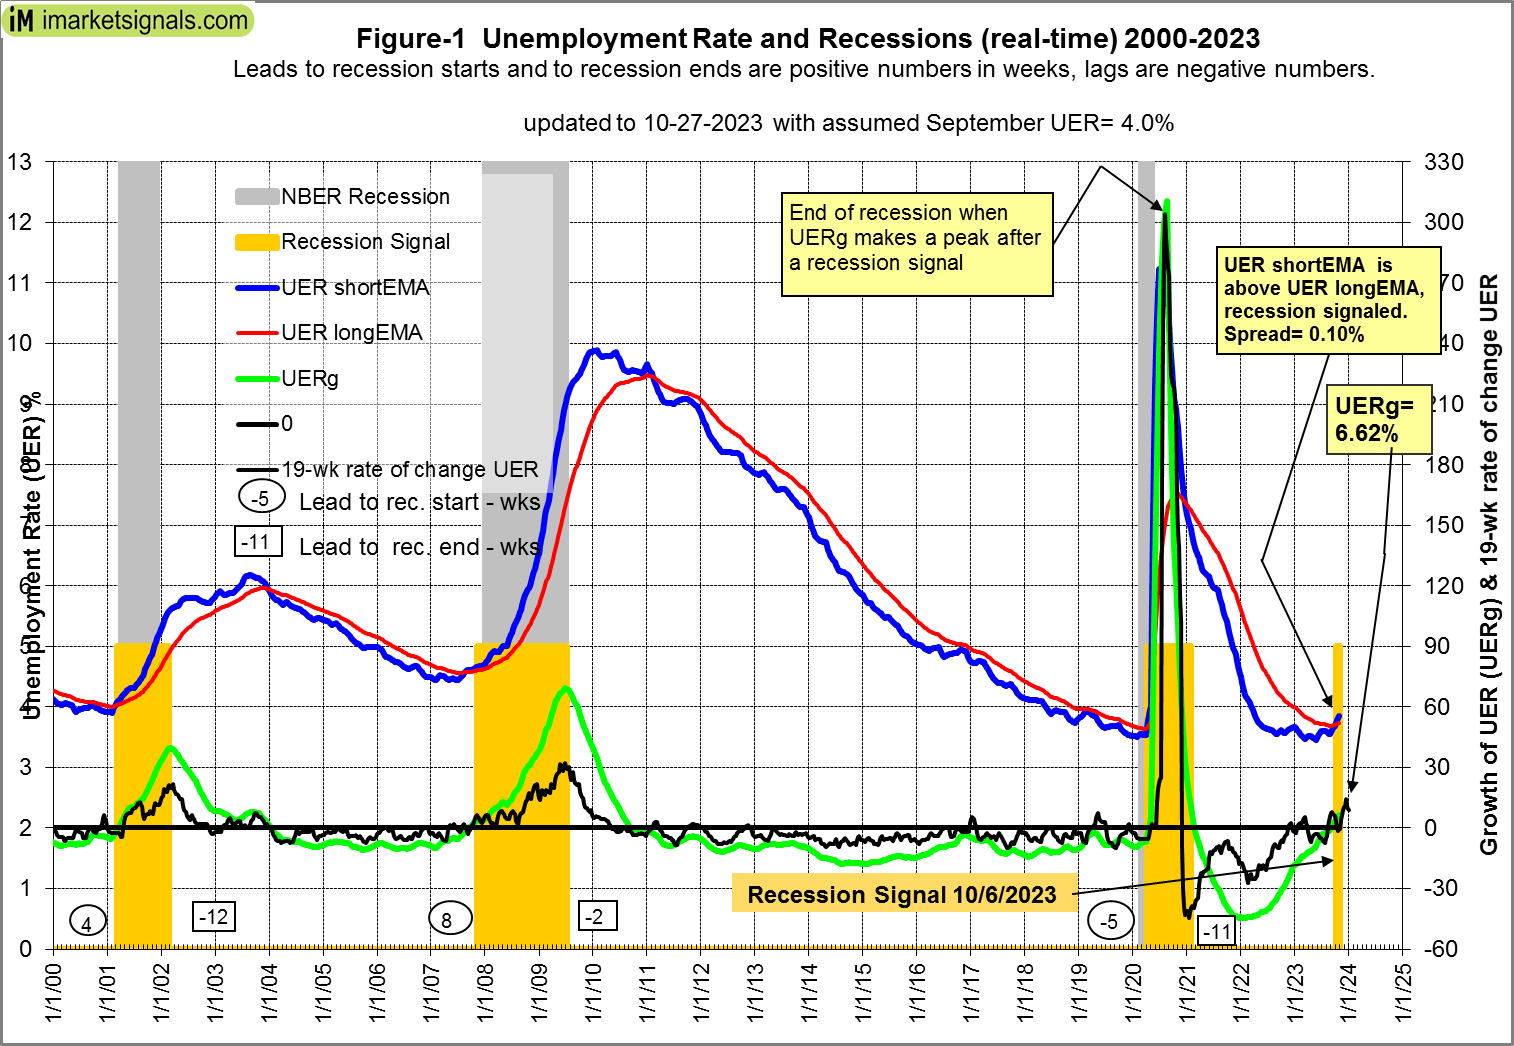
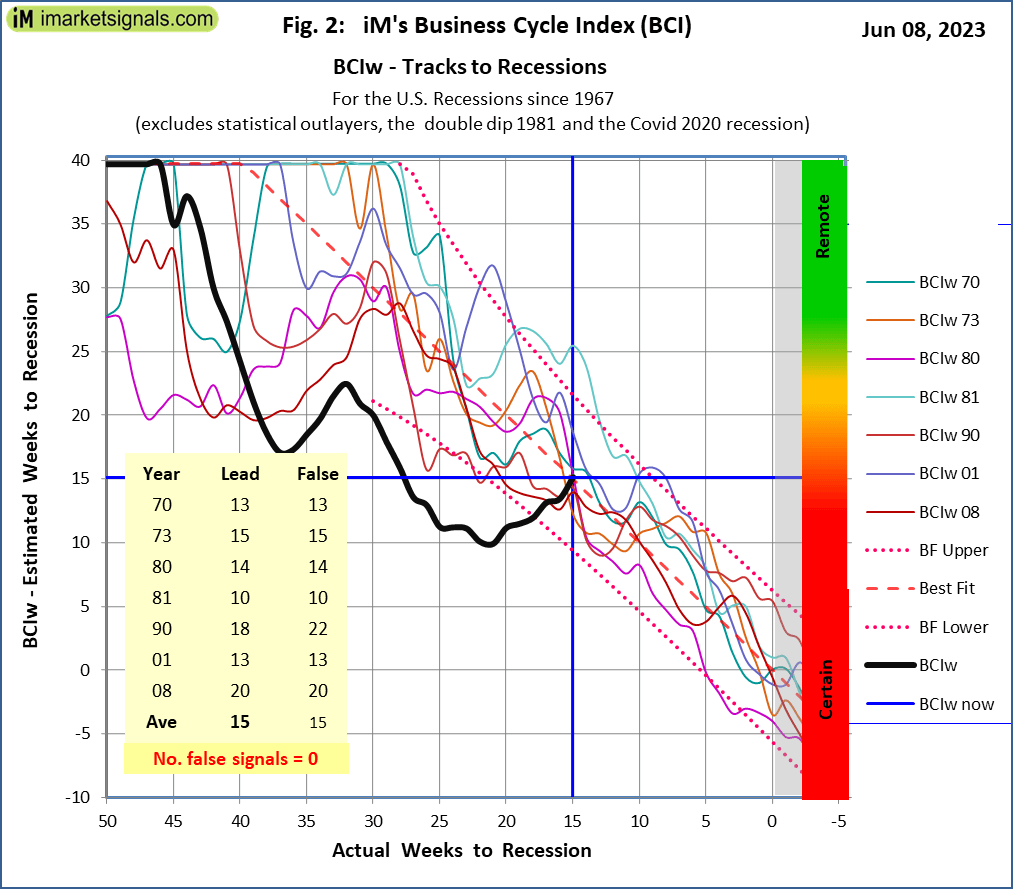
- Leading recession indicators:
- Buy and Hold investing. These models are macro by nature; trading signals from the models occur infrequently and are un-hedged – one does not have to trade constantly in and out of the markets.
- MAC-US is a moving average crossover model for the S&P500.
- MAC-AU is a moving average crossover model for the Australia All Ordinaries Index.
- BVR is a bond market model based on mathematics alone.
- Yield-Curve is a trend-following model.
- GOLD is a rate-of-change trend-following model.
- SILVER is a rate-of-change trend-following model.
- Active weekly trading models based on a proprietary ranking system updated each week to generate un-biased and un-hedged buy- and sell-signals.
- iM-BestX are weekly trading models based on the S&P 500, S&P1500 and Russell 1000 stock index series.
- iM-Best(SPY-SH) is a market timing model, updated weekly on Sundays for the coming week.
- iM-Best1(Sector SPDR) is a rotation system for the Select Sector SPDR® ETFs that divide the S&P500 into 9 sectors.
- iM-Best(SSO-TLT) is a ETF switching system based on market timing.
- iM-Best Combo3 is a combination model of Best(SPY-SH) + Best1(Sector SPDR) + Best(SSO-TLT), updated weekly on Sundays for the coming week.
The models are updated weekly and the charts depict the state of the various markets. They can be seen by registered/logged-in members.
The models have all been published. Before the models were available on the internet, weekly updates for the IBH, MAC, BVR and Yield-Curve were sent by email to subscribers for about two years – here are some of their comments:
This model and your fine work has been quite remarkable (and profitable). I have been enjoying your observations for quite some time. Job well done.
Edward ChruscielYour system looks pretty good. In fact, I was amazed by the high percentage winning trades and the very low drawdowns. I’ve never seen anything like that in a MA system.
Tom SwiatekRegardless of which version one uses, it’s a powerful system. And it answers one of the most troubling worries that investors have. It efficiently gets them out of harm’s way when the market crashes.
Erik ConleyThank you for your unique and excellent work. We will appreciate receiving your Modelling updates. Thanks!
Chuck SzkalakThe average investor reads the financial news and thinks that gives him an edge. That only tells him what everyone else knows and is worried about. We follow the excellent work of Georg Vrba, who has a top-rated coincident recession indicator as well as a successful stock/bond asset allocation model. Here is his most recent comment: “My own composite short leading economic indicator, which has the highest score of all indicators so far tested, does not support the notion of a recession anytime soon.” I listen to Georg, and you should too.
Jeffrey A. Miller, PhD, President NewArc Investments, Inc.I took that S&P buy signal of yours with a little $50K futures contract and am very happy thank you.
Dwaine van Vuuren – CEO of PowerStocksI have read and studied all your articles with interest. I have learned much from your perspectives and will continue to follow your work.
David HamiltonThank you for all your outstanding analysis. Let me say that I couldn’t agree more that data beats opinion.
Dave LincolnGeorg Vrba asks whether the ECRI is still relevant. Great analysis and charts.
Jeffrey A. Miller, PhD, President NewArc Investments, Inc.
I very much liked the write up on your models, and if I may add these have a particular appeal and interest having been developed by a fellow engineer.
Paul WillisHave seen so many manipulate data to fit their predetermined biases and love the way you methodically deconstructed the moving averages to debunk this one. It shows the difference between intellectual laziness and intellectual rigor which you fit to a tee.
Kuosen Fung, CFP®Your work is really interesting and I’d love to receive your updates or any other information you publish. I honestly think your results indicate there is a way to time stock and bond market exposure. Most likely people will remain human and many will follow their “gut feel” or let fear or greed override any mathematical analysis. This is why your methods will most likely continue to work.
James Schwartz, CFP®Georg Vrba, whose excellent work on recession forecasting has helped our readers, has two different market-timing methods. His most recent article explains that the next great bull market might already be here.
Jeffrey A. Miller, PhD, President NewArc Investments, Inc.… as always love your analysis! Always eager for Friday’s just to receive your reports!
Jose R BarceloI agree with your viewpoint that mathematical models provide better guidance to market directions than financial experts. Thanks so much!
C.T. Wu, PhD in EECSI just read your article on identifying recessions. Great work!
Richard G Greenwald, AAMS, CRPCI appreciate using math to model financial behaviour and appreciate your good work.
Richard E. Hamrick, CFA®This time it is perma-bear Albert Edwards warning investors about the “Ultimate Death Cross” taking the S&P 500 back to 666. Georg Vrba takes the analysis even further. He shows that Edwards’ prediction is almost impossible to accomplish if you actually do the math on the moving averages involved. In addition, he demonstrates that the current indicator conditions are actually bullish based on historical data.
Jeffrey A. Miller, PhD, President NewArc Investments, Inc.I have great respect for your work and am grateful to be included on your list.
Marvin SnyderI have your historical charts going back and it is great material. I appreciate your insights. Steve Wenstrup
I have been following your work for some time and have been very impressed.
Steve McCarthy, CPA, CFP®I’m impressed that you provide this much analysis each week. Thank you for your insights. Your charts are beautiful & clear.
Brett BowmanI am really impressed by your work and liked very much your last research on gold and silver. It’s good to see that you are expanding the scope of possible investments.
Nicolas Tabourdeau