  |
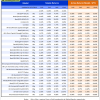
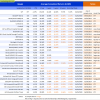
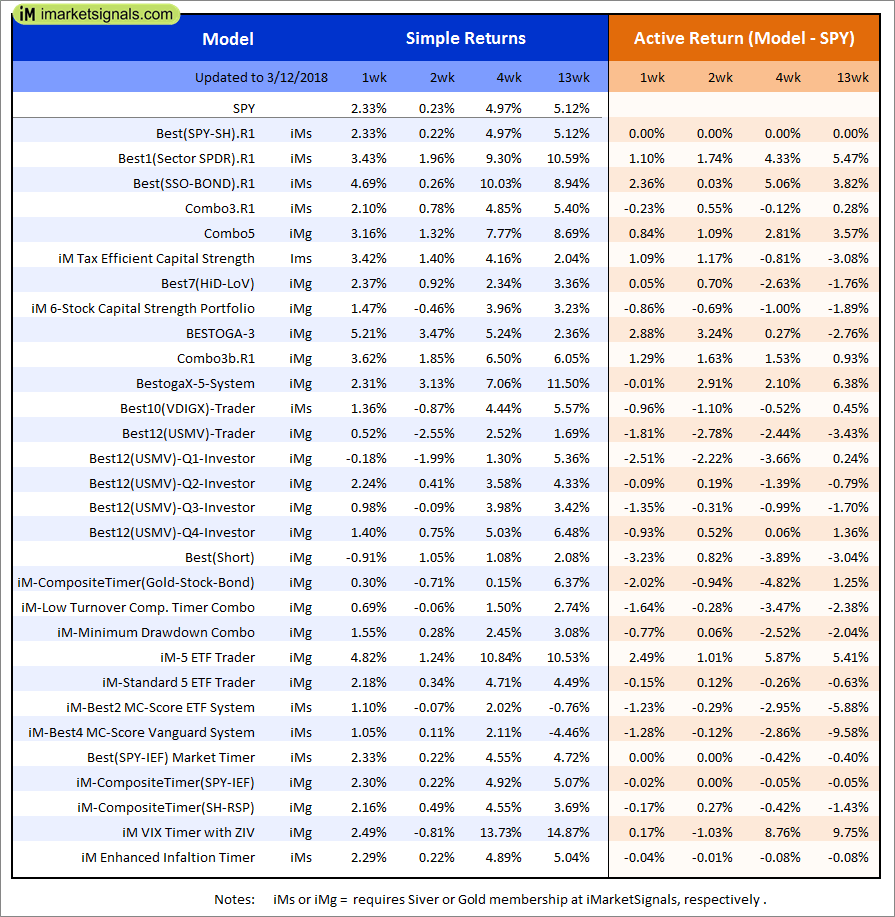
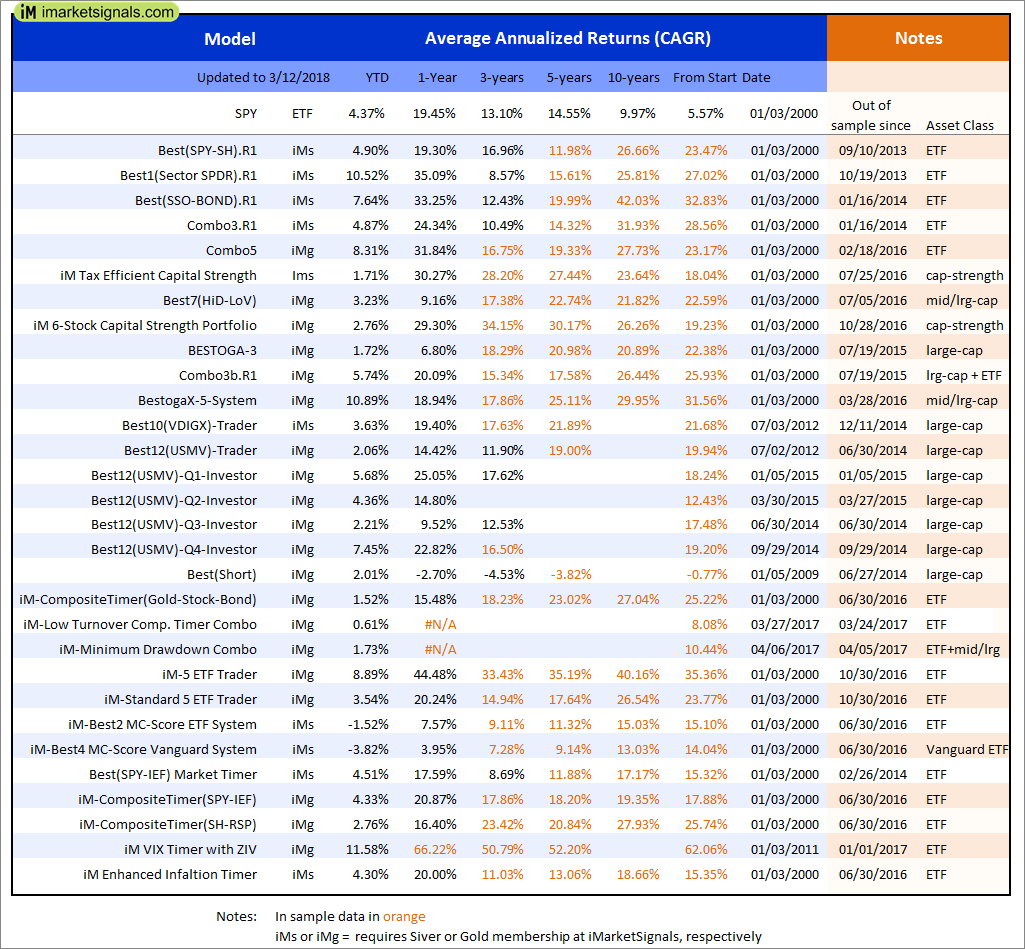
Out of sample performance summary of our models for the past 1, 2, 4 and 13 week periods. The active active return indicates how the models over- or underperformed the benchmark ETF SPY. Also the YTD, and the 1-, 3-, 5- and 10-year annualized returns are shown in the second table |
|
|
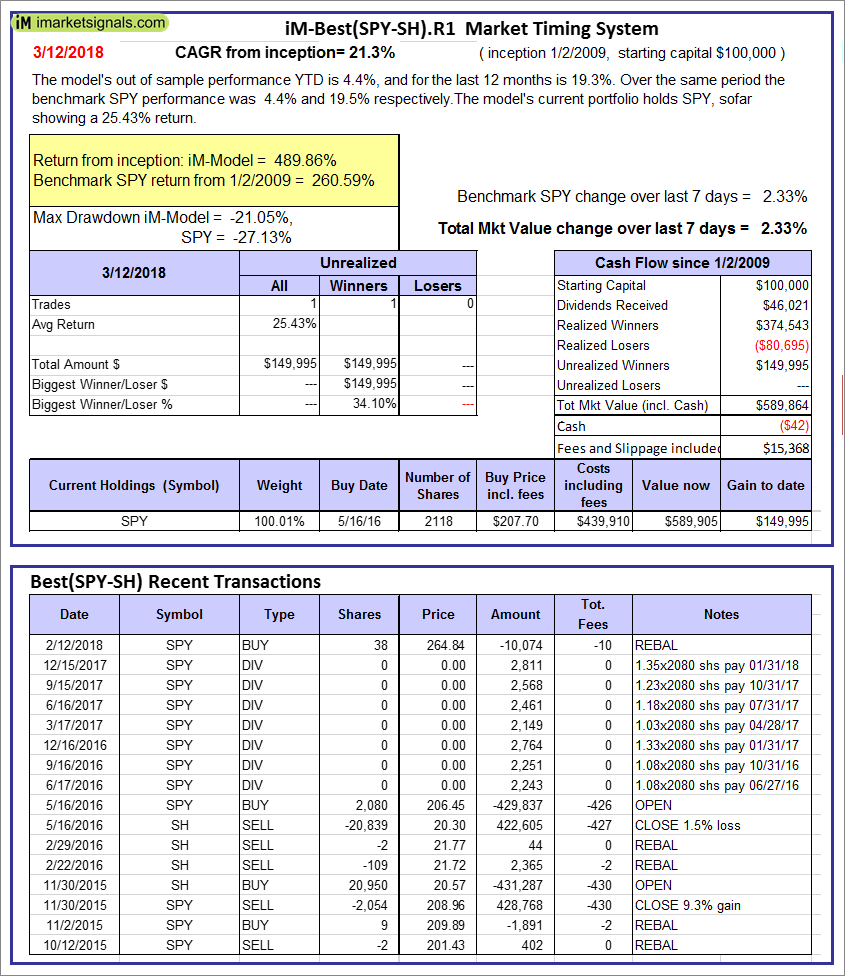
iM-Best(SPY-SH).R1: The model’s out of sample performance YTD is 4.4%, and for the last 12 months is 19.3%. Over the same period the benchmark SPY performance was 4.4% and 19.5% respectively. Over the previous week the market value of Best(SPY-SH) gained 2.33% at a time when SPY gained 2.33%. A starting capital of $100,000 at inception on 1/2/2009 would have grown to $589,864 which includes -$42 cash and excludes $15,368 spent on fees and slippage. |
|
|
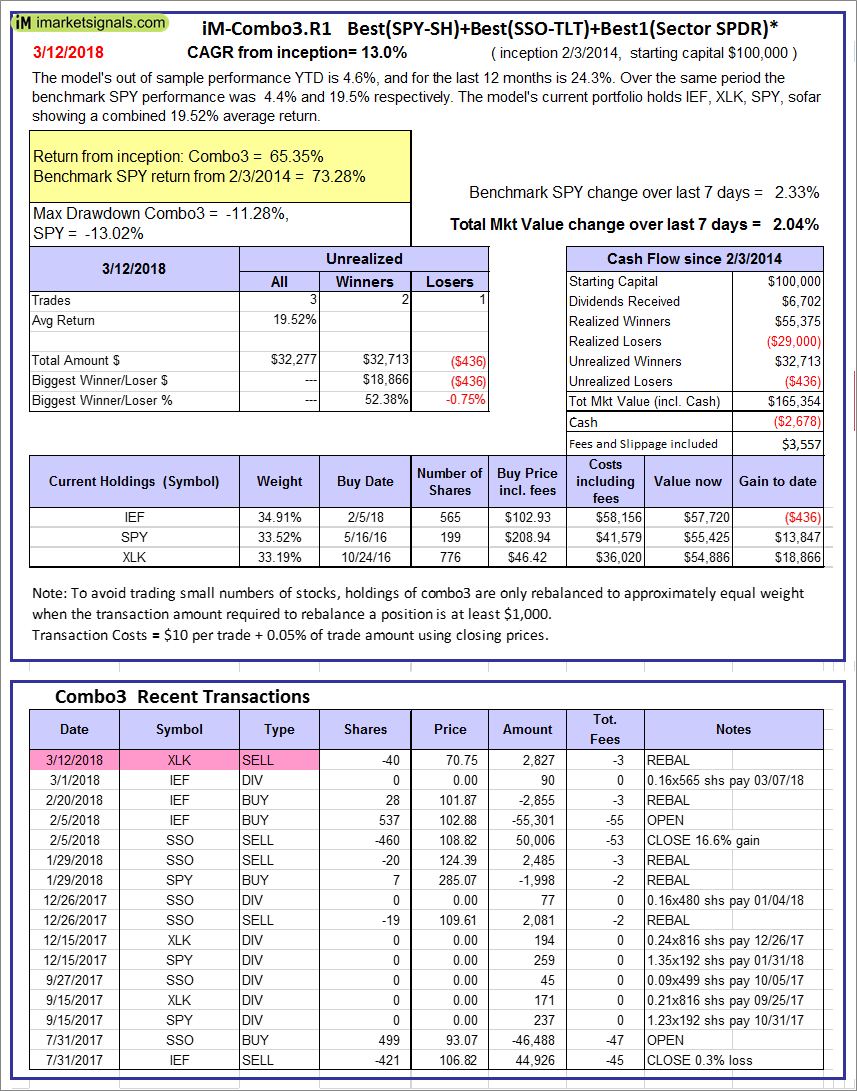
iM-Combo3.R1: The model’s out of sample performance YTD is 4.6%, and for the last 12 months is 24.3%. Over the same period the benchmark SPY performance was 4.4% and 19.5% respectively. Over the previous week the market value of iM-Combo3.R1 gained 2.04% at a time when SPY gained 2.33%. A starting capital of $100,000 at inception on 2/3/2014 would have grown to $165,354 which includes -$2,678 cash and excludes $3,557 spent on fees and slippage. |
|
|
iM-Combo5: The model’s out of sample performance YTD is 8.1%, and for the last 12 months is 31.8%. Over the same period the benchmark SPY performance was 4.4% and 19.5% respectively. Over the previous week the market value of iM-Combo5 gained 3.13% at a time when SPY gained 2.33%. A starting capital of $100,000 at inception on 2/22/2016 would have grown to $138,285 which includes -$1,764 cash and excludes $665 spent on fees and slippage. |
|
|
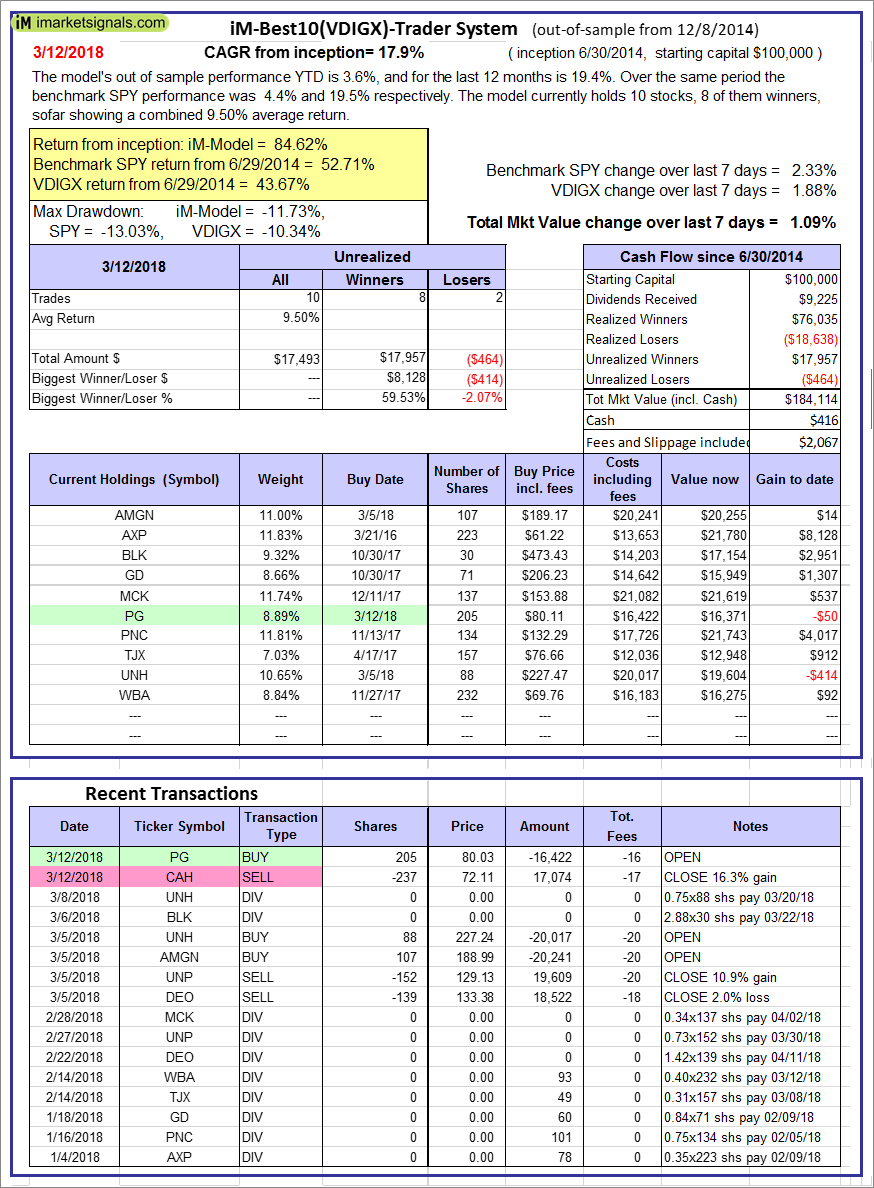
iM-Best10(VDIGX)-Trader: The model’s out of sample performance YTD is 3.6%, and for the last 12 months is 19.4%. Over the same period the benchmark SPY performance was 4.4% and 19.5% respectively. Since inception, on 7/1/2014, the model gained 84.62% while the benchmark SPY gained 52.71% and VDIGX gained 43.67% over the same period. Over the previous week the market value of iM-Best10(VDIGX) gained 1.09% at a time when SPY gained 2.33%. A starting capital of $100,000 at inception on 7/1/2014 would have grown to $184,114 which includes $416 cash and excludes $2,067 spent on fees and slippage. |
|
|
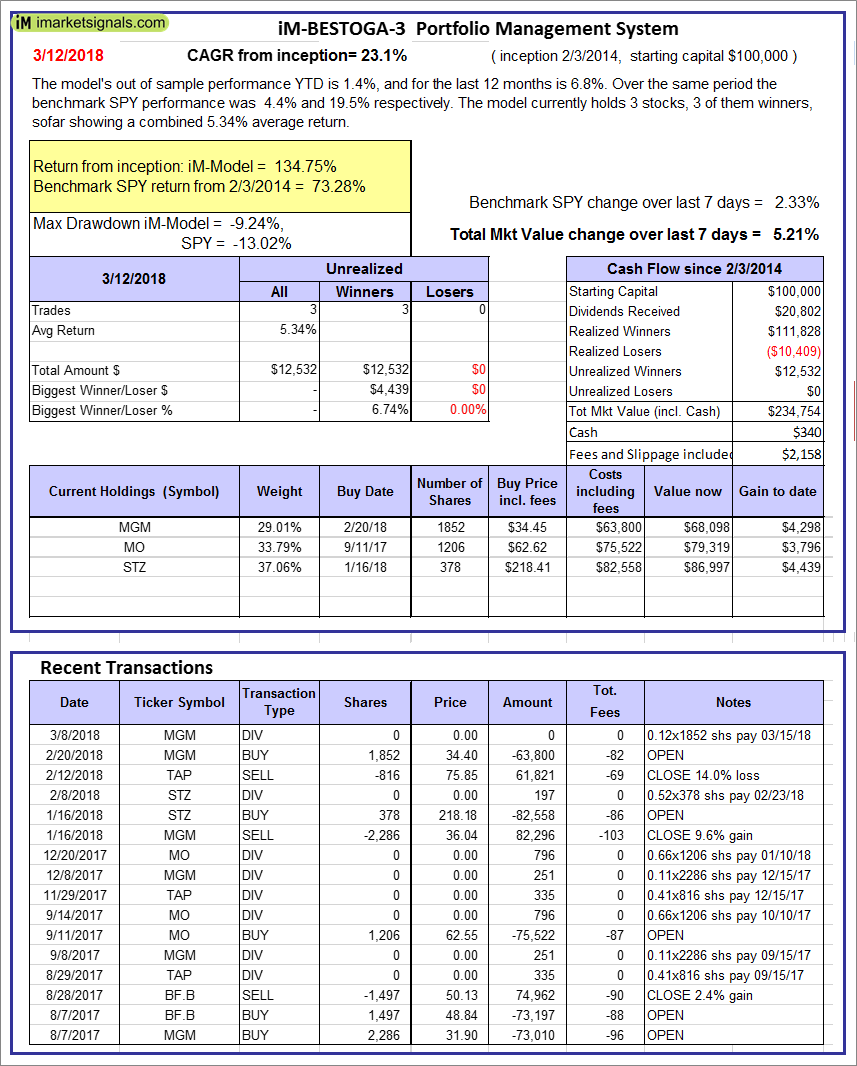
iM-BESTOGA-3: The model’s out of sample performance YTD is 1.4%, and for the last 12 months is 6.8%. Over the same period the benchmark SPY performance was 4.4% and 19.5% respectively. Over the previous week the market value of iM-BESTOGA-3 gained 5.21% at a time when SPY gained 2.33%. A starting capital of $100,000 at inception on 2/3/2014 would have grown to $234,754 which includes $340 cash and excludes $2,158 spent on fees and slippage. |
|
|
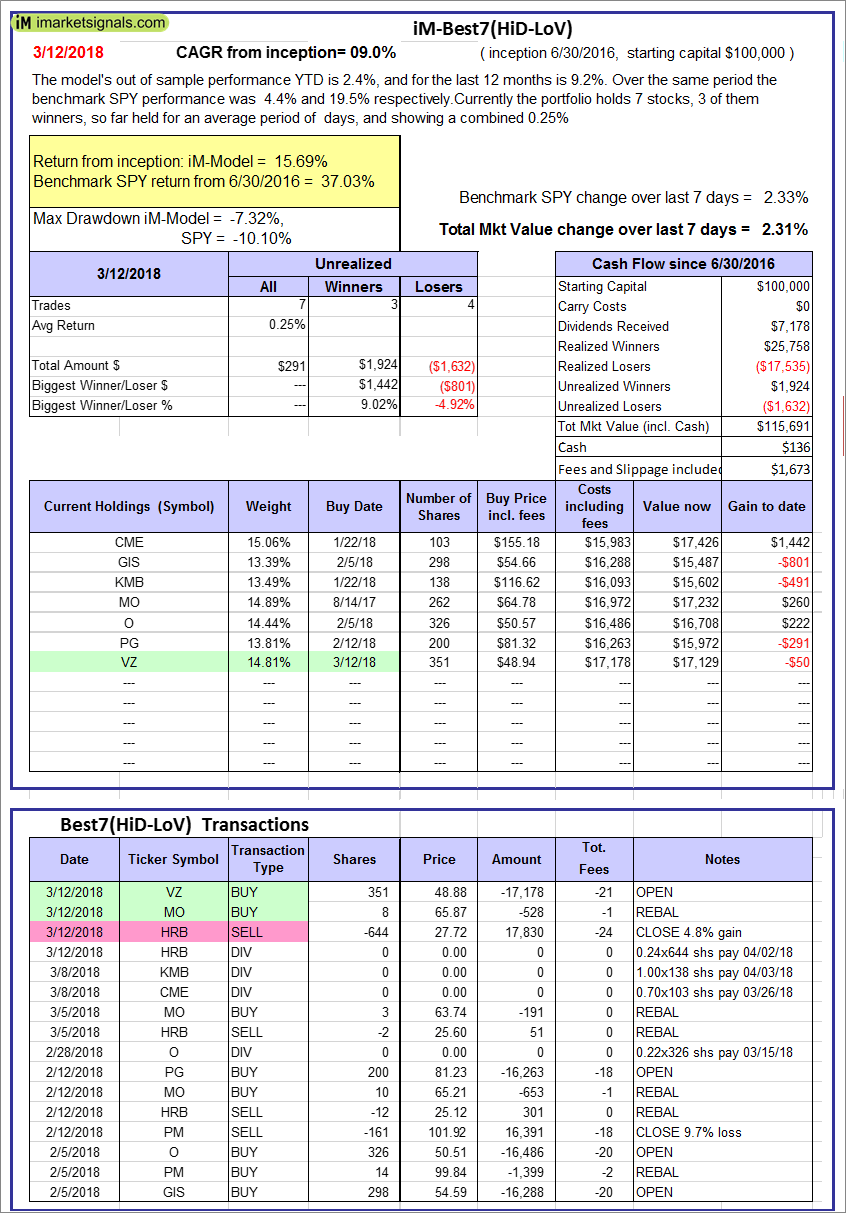
iM-Best7(HiD-LoV): The model’s out of sample performance YTD is 2.4%, and for the last 12 months is 9.2%. Over the same period the benchmark SPY performance was 4.4% and 19.5% respectively. Over the previous week the market value of iM-BESTOGA-3 gained 2.31% at a time when SPY gained 2.33%. A starting capital of $100,000 at inception on 6/30/2016 would have grown to $115,691 which includes $136 cash and excludes $1,673 spent on fees and slippage. |
|
|
iM 6-Stock Capital Strength Portfolio: The model’s out of sample performance YTD is 2.5%, and for the last 12 months is 29.3%. Over the same period the benchmark SPY performance was 4.4% and 19.5% respectively. Over the previous week the market value of the iM 6-Stock Capital Strength Portfolio gained 1.16% at a time when SPY gained 2.33%. A starting capital of $100,000 at inception on 10/28/2016 would have grown to $154,935 which includes $998 cash and excludes $630 spent on fees and slippage. |
|
|
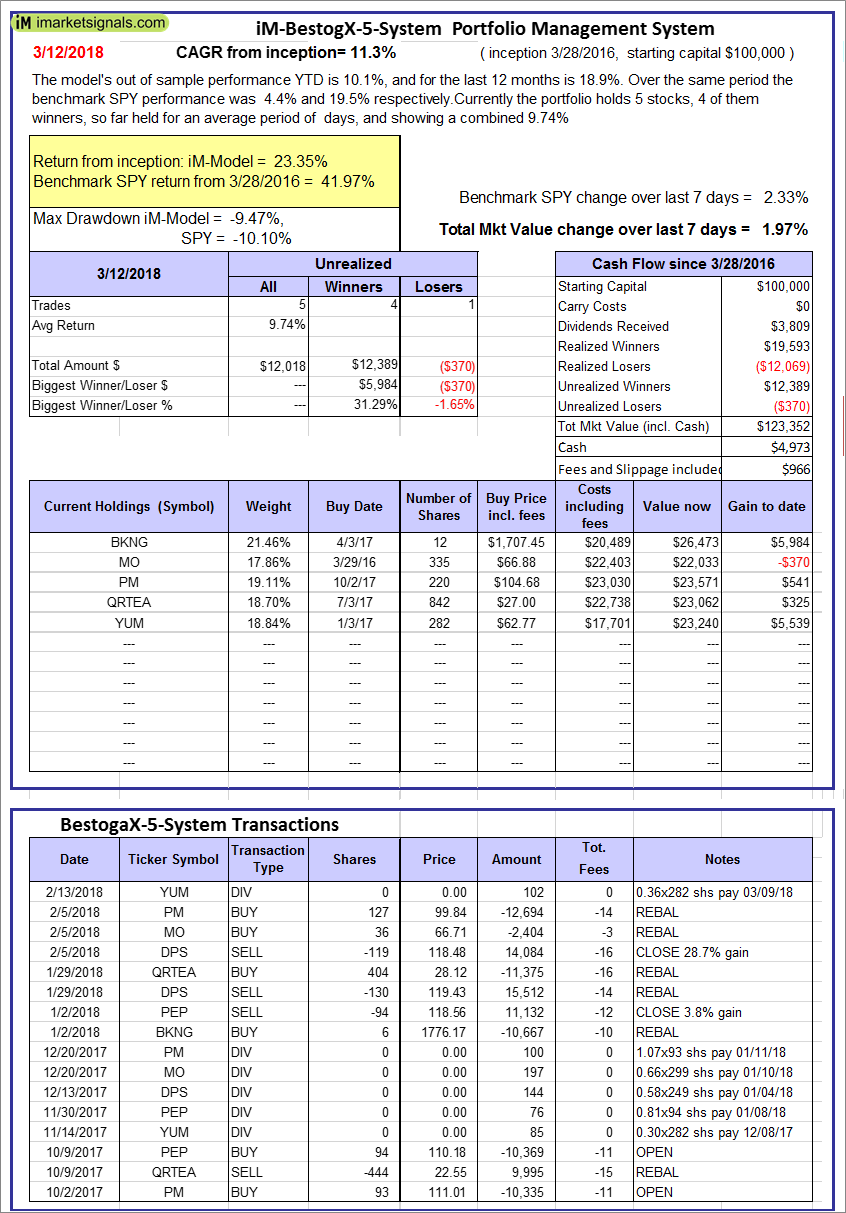
iM-BestogaX5-System: The model’s out of sample performance YTD is 10.1%, and for the last 12 months is 18.9%. Over the same period the benchmark SPY performance was 4.4% and 19.5% respectively. Over the previous week the market value of iM-BestogaX5-System gained 1.97% at a time when SPY gained 2.33%. A starting capital of $100,000 at inception on 3/28/2016 would have grown to $123,352 which includes $4,973 cash and excludes $966 spent on fees and slippage. |
|
|
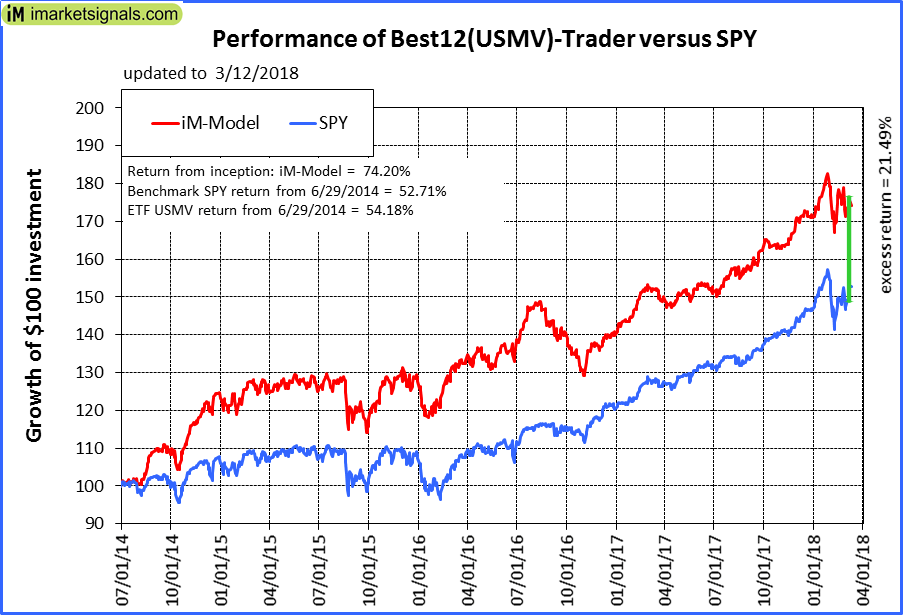
iM-Best12(USMV)-Trader: The model’s out of sample performance YTD is 1.8%, and for the last 12 months is 14.4%. Over the same period the benchmark SPY performance was 4.4% and 19.5% respectively. Since inception, on 6/30/2014, the model gained 74.20% while the benchmark SPY gained 52.71% and the ETF USMV gained 54.18% over the same period. Over the previous week the market value of iM-Best12(USMV)-Trader gained 0.39% at a time when SPY gained 2.33%. A starting capital of $100,000 at inception on 6/30/2014 would have grown to $174,022 which includes -$8 cash and excludes $4,093 spent on fees and slippage. |
|
|
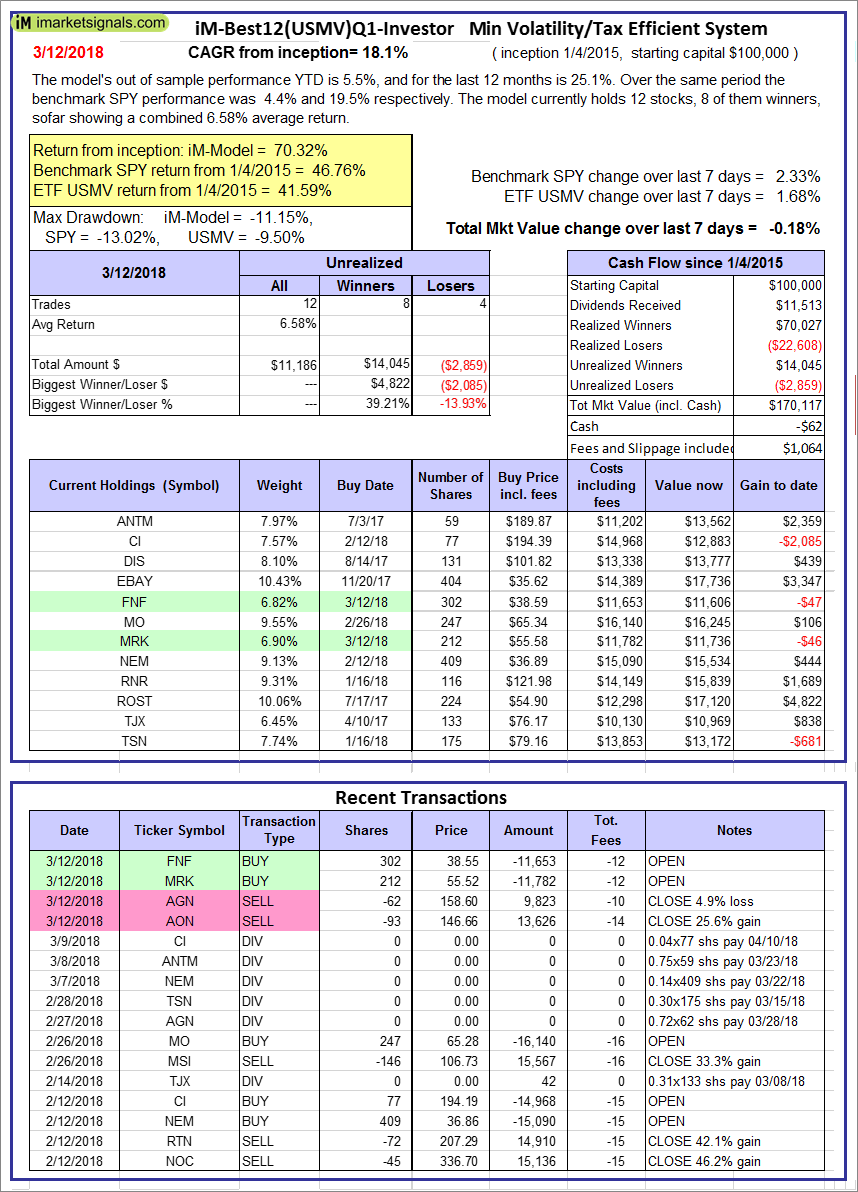
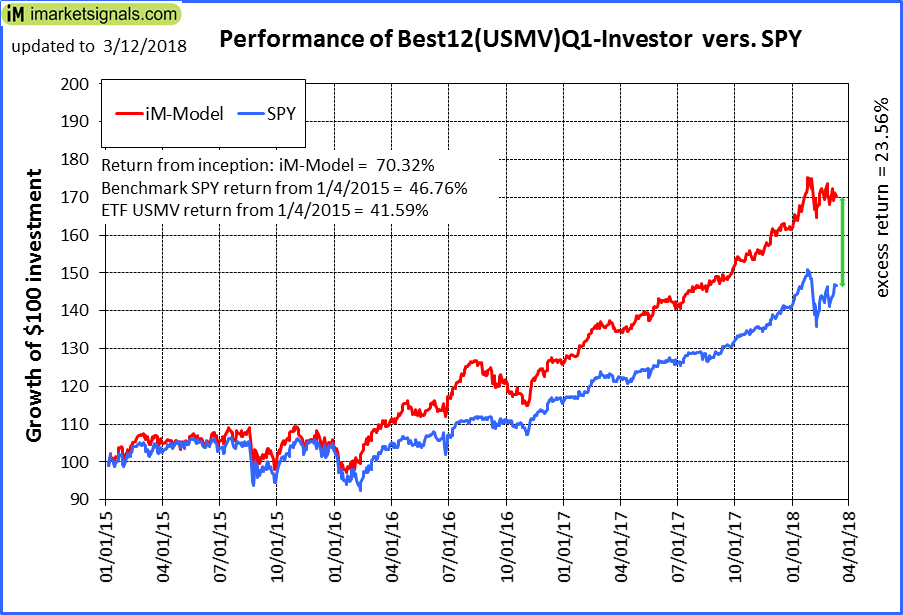
iM-Best12(USMV)Q1-Investor: The model’s out of sample performance YTD is 5.5%, and for the last 12 months is 25.1%. Over the same period the benchmark SPY performance was 4.4% and 19.5% respectively. Since inception, on 1/5/2015, the model gained 70.32% while the benchmark SPY gained 46.76% and the ETF USMV gained 41.59% over the same period. Over the previous week the market value of iM-Best12(USMV)Q1 gained -0.18% at a time when SPY gained 2.33%. A starting capital of $100,000 at inception on 1/5/2015 would have grown to $170,117 which includes -$62 cash and excludes $1,064 spent on fees and slippage. |
|
|
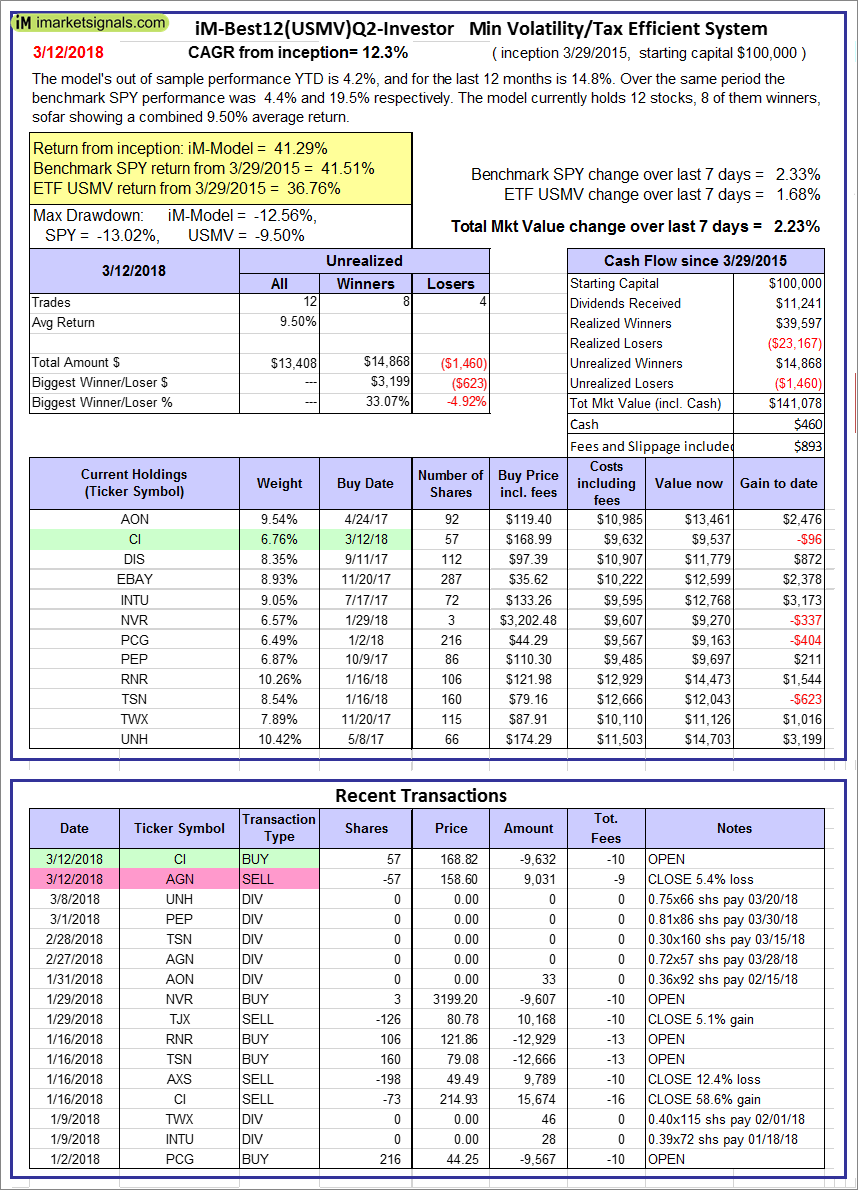
iM-Best12(USMV)Q2-Investor: The model’s out of sample performance YTD is 4.2%, and for the last 12 months is 14.8%. Over the same period the benchmark SPY performance was 4.4% and 19.5% respectively. Since inception, on 3/30/2015, the model gained 41.29% while the benchmark SPY gained 41.51% and the ETF USMV gained 36.76% over the same period. Over the previous week the market value of iM-Best12(USMV)Q2 gained 2.23% at a time when SPY gained 2.33%. A starting capital of $100,000 at inception on 3/30/2015 would have grown to $141,078 which includes $460 cash and excludes $893 spent on fees and slippage. |
|
|
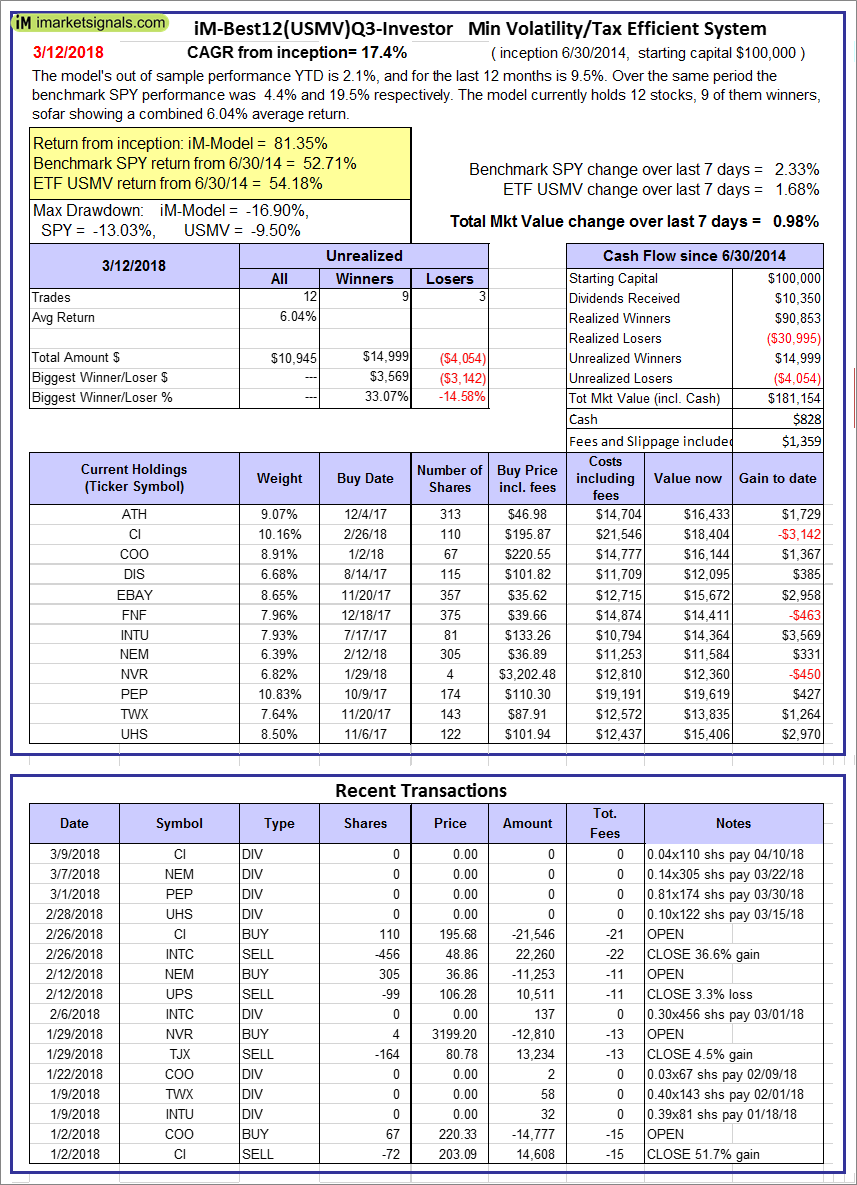
iM-Best12(USMV)Q3-Investor: The model’s out of sample performance YTD is 2.1%, and for the last 12 months is 9.5%. Over the same period the benchmark SPY performance was 4.4% and 19.5% respectively. Since inception, on 7/1/2014, the model gained 81.35% while the benchmark SPY gained 52.71% and the ETF USMV gained 54.18% over the same period. Over the previous week the market value of iM-Best12(USMV)Q3 gained 0.98% at a time when SPY gained 2.33%. A starting capital of $100,000 at inception on 7/1/2014 would have grown to $181,154 which includes $828 cash and excludes $1,359 spent on fees and slippage. |
|
|
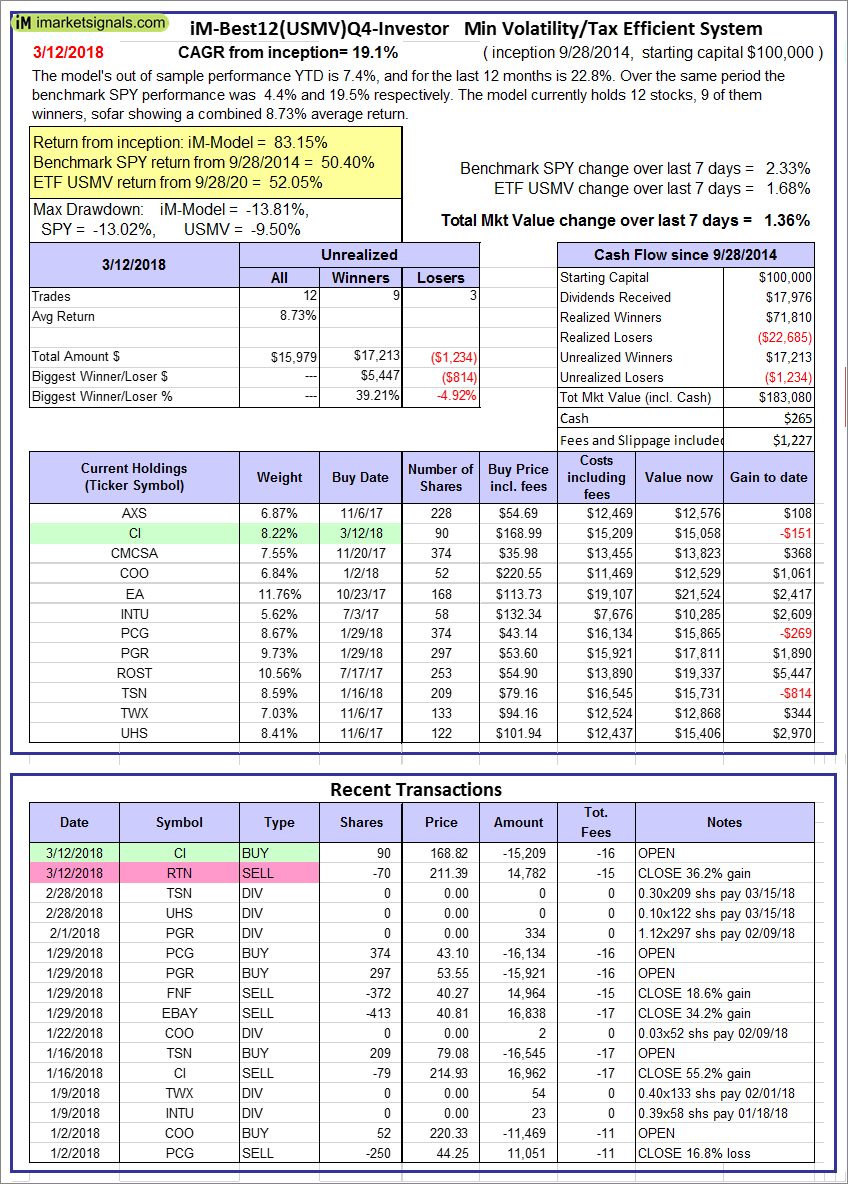
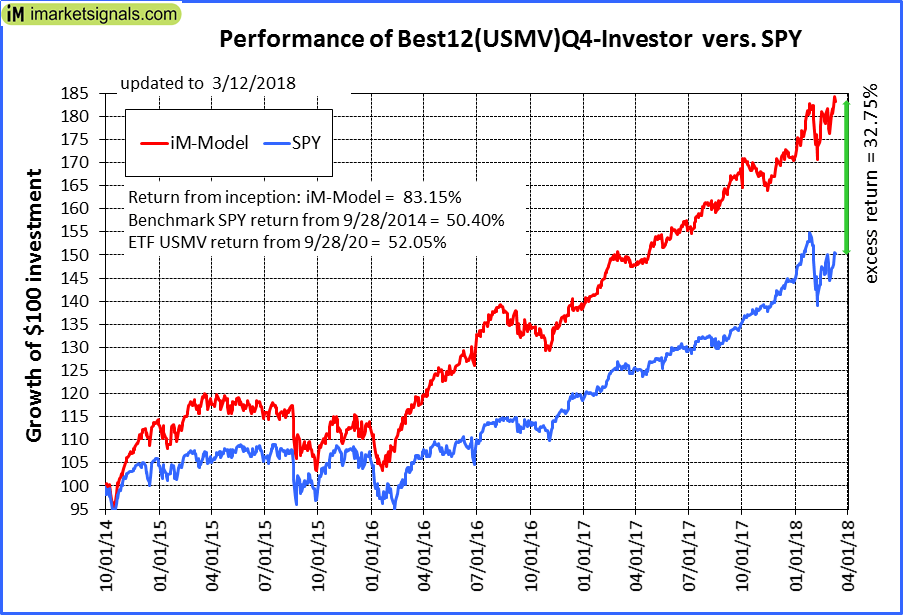
iM-Best12(USMV)Q4-Investor: Since inception, on 9/29/2014, the model gained 83.15% while the benchmark SPY gained 50.40% and the ETF USMV gained 52.05% over the same period. Over the previous week the market value of iM-Best12(USMV)Q4 gained 1.36% at a time when SPY gained 2.33%. A starting capital of $100,000 at inception on 9/29/2014 would have grown to $183,080 which includes $265 cash and excludes $1,227 spent on fees and slippage. |
|
|
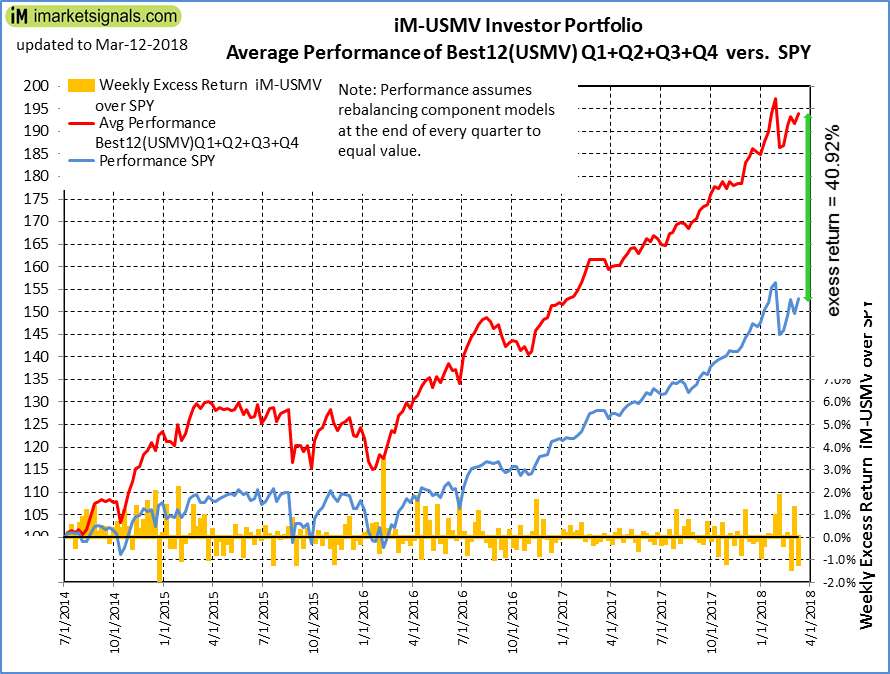
Average Performance of iM-Best12(USMV)Q1+Q2+Q3+Q4-Investor resulted in an excess return of 40.92% over SPY. (see iM-USMV Investor Portfolio) |
|
|
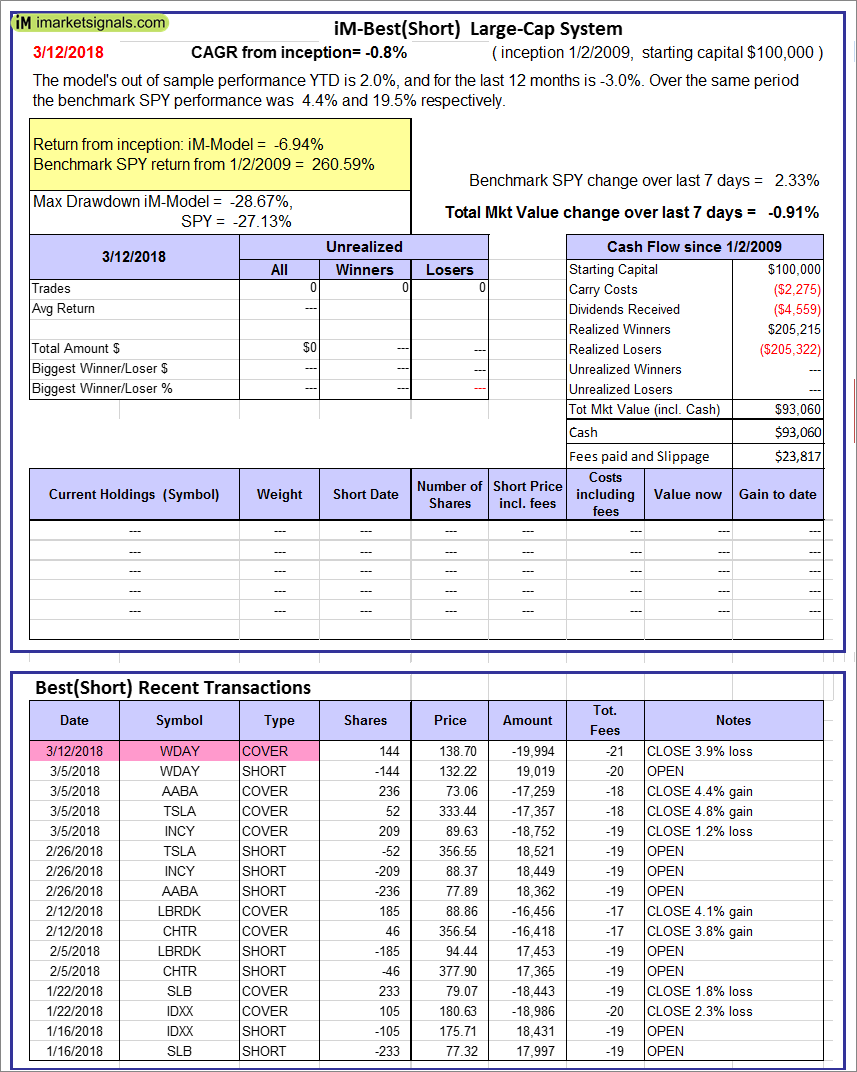
iM-Best(Short): The model’s out of sample performance YTD is 2.0%, and for the last 12 months is -3.0%. Over the same period the benchmark SPY performance was 4.4% and 19.5% respectively. Over the previous week the market value of iM-Best(Short) gained -0.91% at a time when SPY gained 2.33%. Over the period 1/2/2009 to 3/12/2018 the starting capital of $100,000 would have grown to $93,060 which includes $93,060 cash and excludes $23,817 spent on fees and slippage. |
|
|
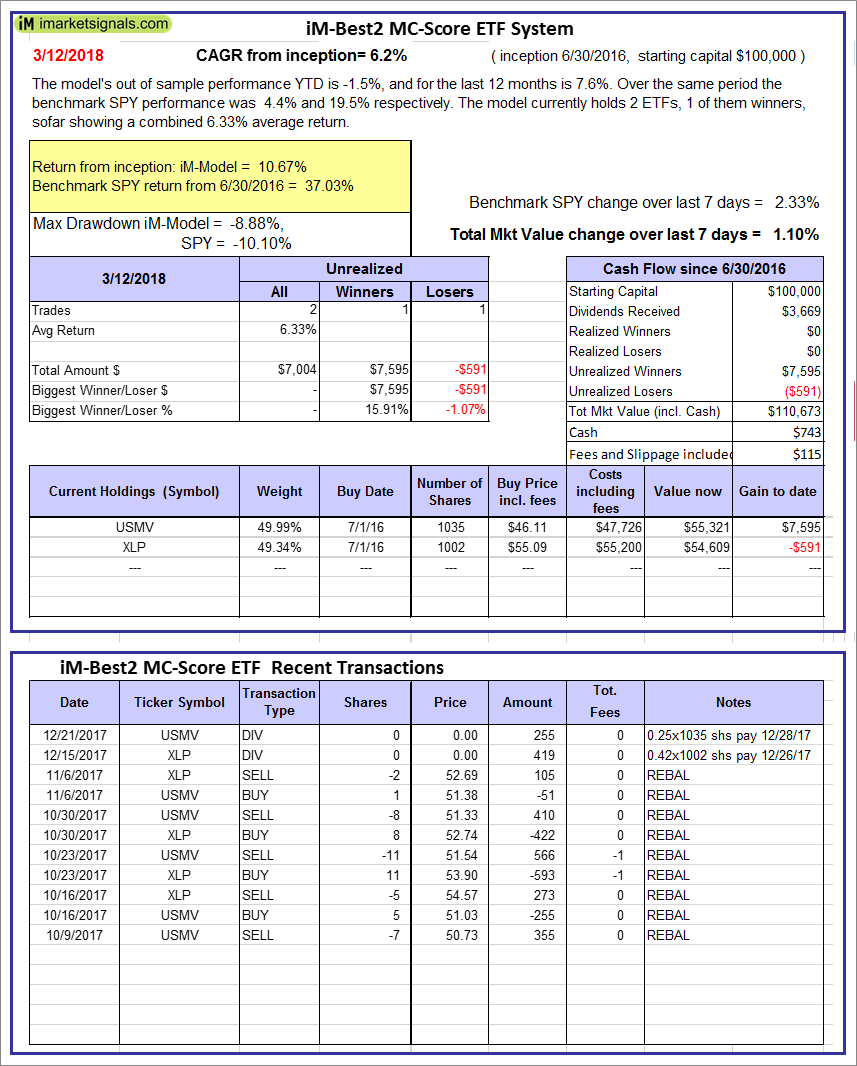
iM-Best2 MC-Score ETF System: The model’s out of sample performance YTD is -1.5%, and for the last 12 months is 7.6%. Over the same period the benchmark SPY performance was 4.4% and 19.5% respectively. Over the previous week the market value of the iM-Best2 MC-Score ETF System gained 1.10% at a time when SPY gained 2.33%. A starting capital of $100,000 at inception on 6/30/2016 would have grown to $110,673 which includes $743 cash and excludes $115 spent on fees and slippage. |
|
|
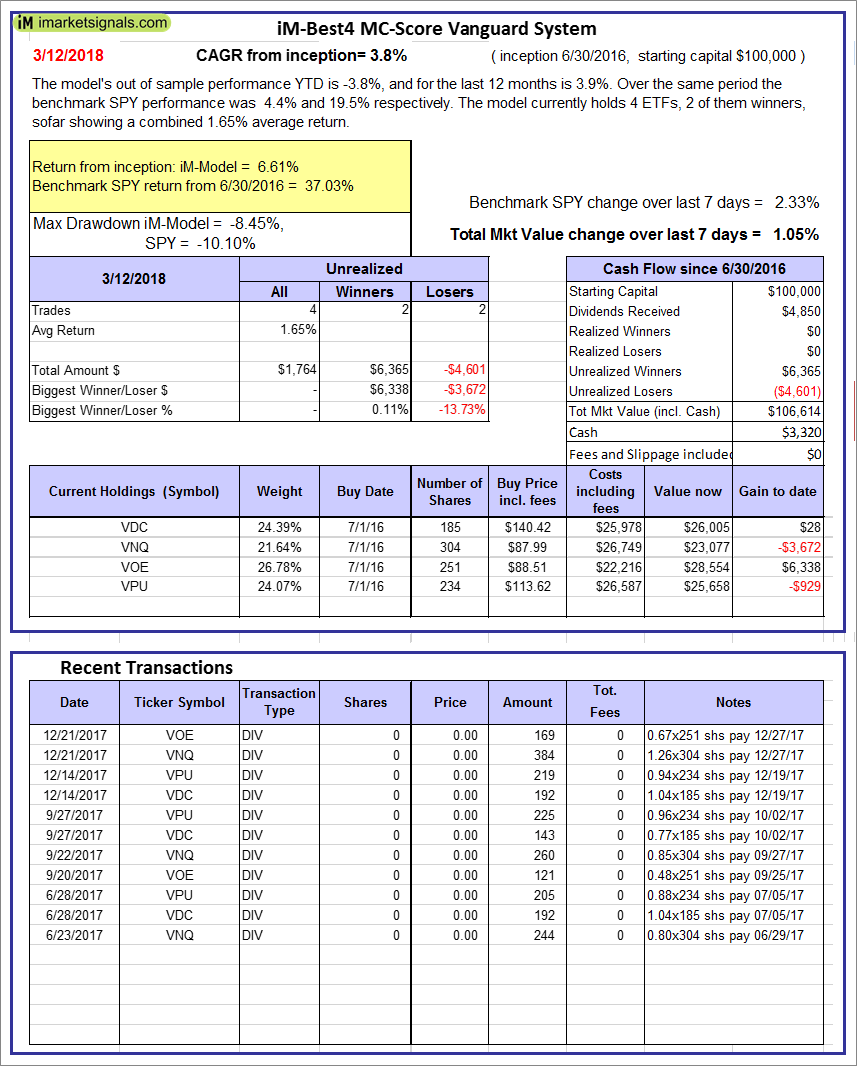
iM-Best4 MC-Score Vanguard System: The model’s out of sample performance YTD is -3.8%, and for the last 12 months is 3.9%. Over the same period the benchmark SPY performance was 4.4% and 19.5% respectively. Over the previous week the market value of the iM-Best4 MC-Score Vanguard System gained 1.05% at a time when SPY gained 2.33%. A starting capital of $100,000 at inception on 6/30/2016 would have grown to $106,614 which includes $3,320 cash and excludes $00 spent on fees and slippage. |
|
|
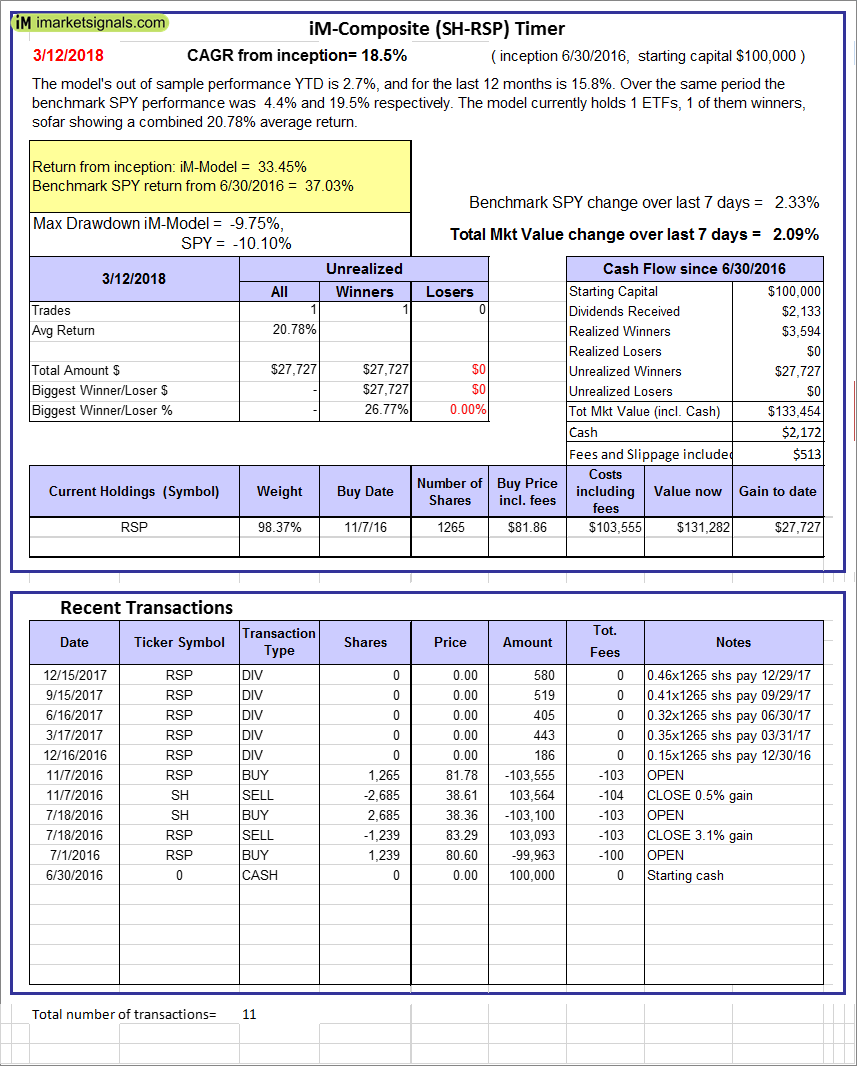
iM-Composite (SH-RSP) Timer: The model’s out of sample performance YTD is 2.7%, and for the last 12 months is 15.8%. Over the same period the benchmark SPY performance was 4.4% and 19.5% respectively. Over the previous week the market value of the iM-Composite (SH-RSP) Timer gained 2.09% at a time when SPY gained 2.33%. A starting capital of $100,000 at inception on 6/30/2016 would have grown to $133,454 which includes $2,172 cash and excludes $513 spent on fees and slippage. |
|
|
iM-Composite (SPY-IEF) Timer: The model’s out of sample performance YTD is 4.3%, and for the last 12 months is 20.8%. Over the same period the benchmark SPY performance was 4.4% and 19.5% respectively. Over the previous week the market value of the iM-Composite (SPY-IEF) Timer gained 2.30% at a time when SPY gained 2.33%. A starting capital of $100,000 at inception on 6/30/2016 would have grown to $139,089 which includes $1,500 cash and excludes $1,390 spent on fees and slippage. |
|
|
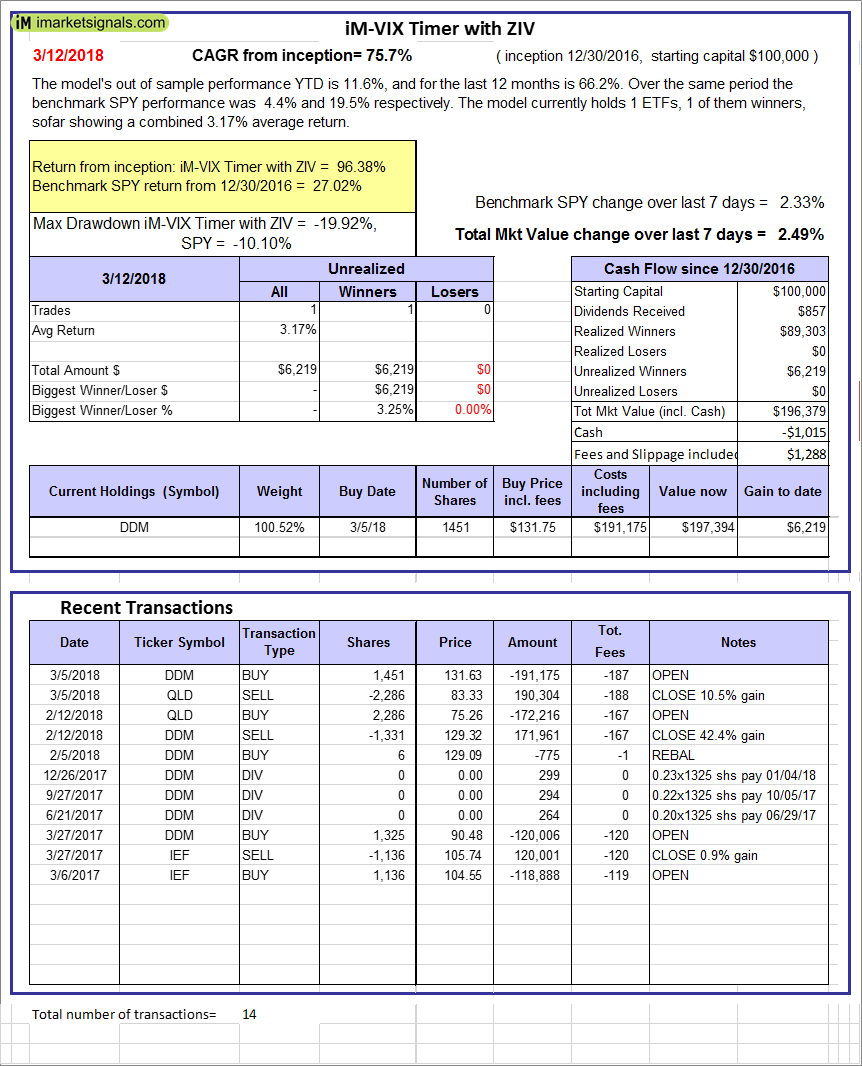
iM-VIX Timer with ZIV: The model’s out of sample performance YTD is 11.6%, and for the last 12 months is 66.2%. Over the same period the benchmark SPY performance was 4.4% and 19.5% respectively. Over the previous week the market value of the iM-VIX Timer with ZIV gained 2.49% at a time when SPY gained 2.33%. A starting capital of $100,000 at inception on 6/30/2016 would have grown to $196,379 which includes -$1,015 cash and excludes $1,288 spent on fees and slippage. |
|
|
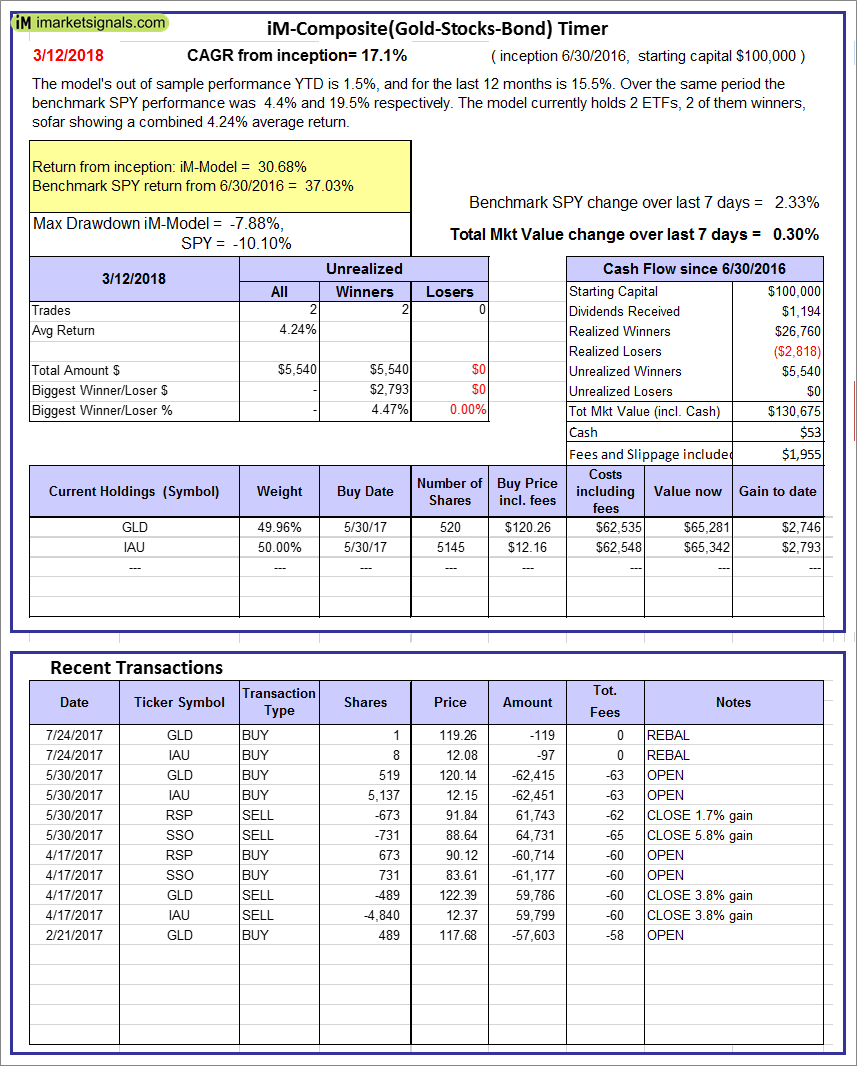
iM-Composite(Gold-Stocks-Bond) Timer: The model’s out of sample performance YTD is 1.5%, and for the last 12 months is 15.5%. Over the same period the benchmark SPY performance was 4.4% and 19.5% respectively. Over the previous week the market value of the iM-Composite(Gold-Stocks-Bond) Timer gained 0.30% at a time when SPY gained 2.33%. A starting capital of $100,000 at inception on 6/30/2016 would have grown to $130,675 which includes $53 cash and excludes $1,955 spent on fees and slippage. |
|
|
iM-Low Turnover Composite Timer Combo: The model’s out of sample performance YTD is 0.6%, and since inception 7.7%. Over the same period the benchmark SPY performance was 4.4% and 20.9% respectively. Over the previous week the market value of the iM-Low Turnover Composite Timer Combo gained 0.69% at a time when SPY gained 2.33%. A starting capital of $100,000 at inception on 3/24/27 would have grown to $107,728 which includes $1,612 cash and excludes $74 spent on fees and slippage. |
|
|
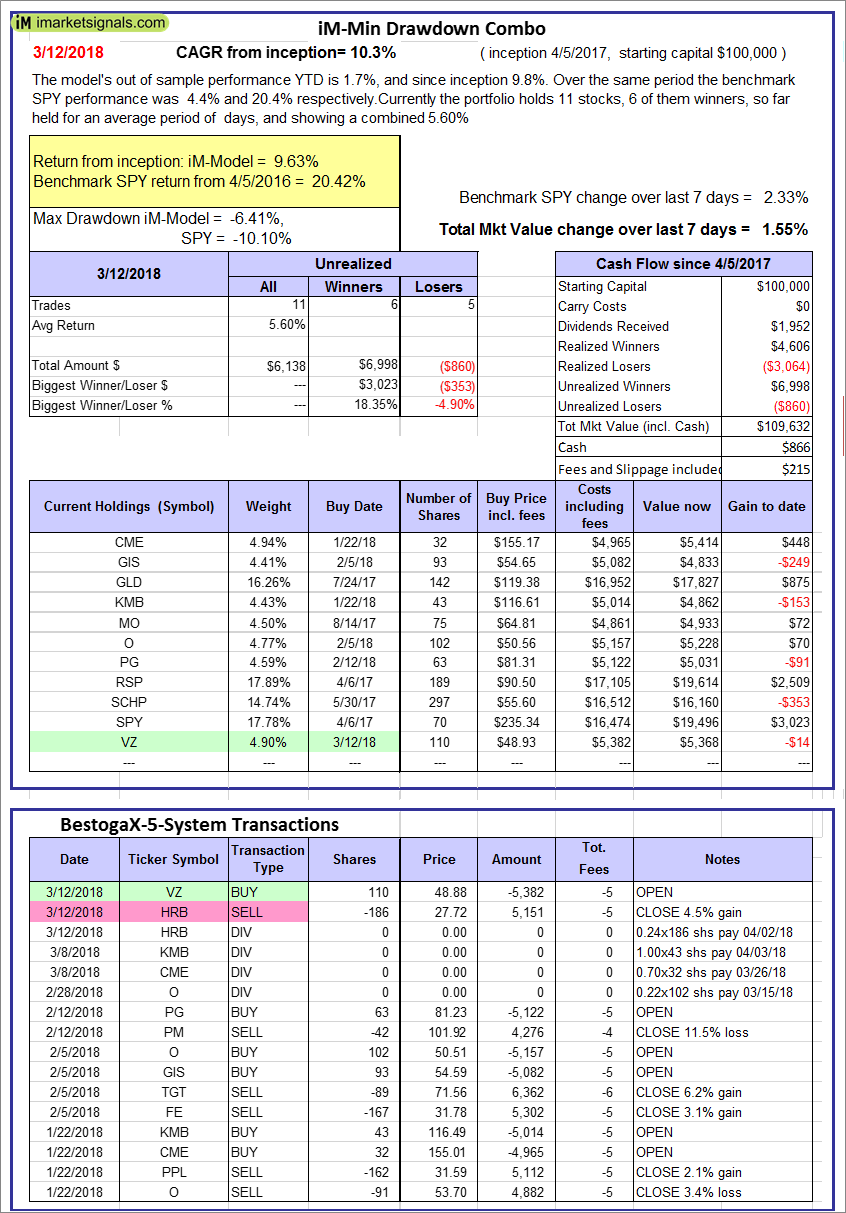
iM-Min Drawdown Combo: The model’s out of sample performance YTD is 1.7%, and since inception 9.8%. Over the same period the benchmark SPY performance was 4.4% and 20.4% respectively. Over the previous week the market value of the iM-Min Drawdown Combo gained 1.55% at a time when SPY gained 2.33%. A starting capital of $100,000 at inception on 4/5/2017 would have grown to $109,632 which includes $866 cash and excludes $215 spent on fees and slippage. |
|
|
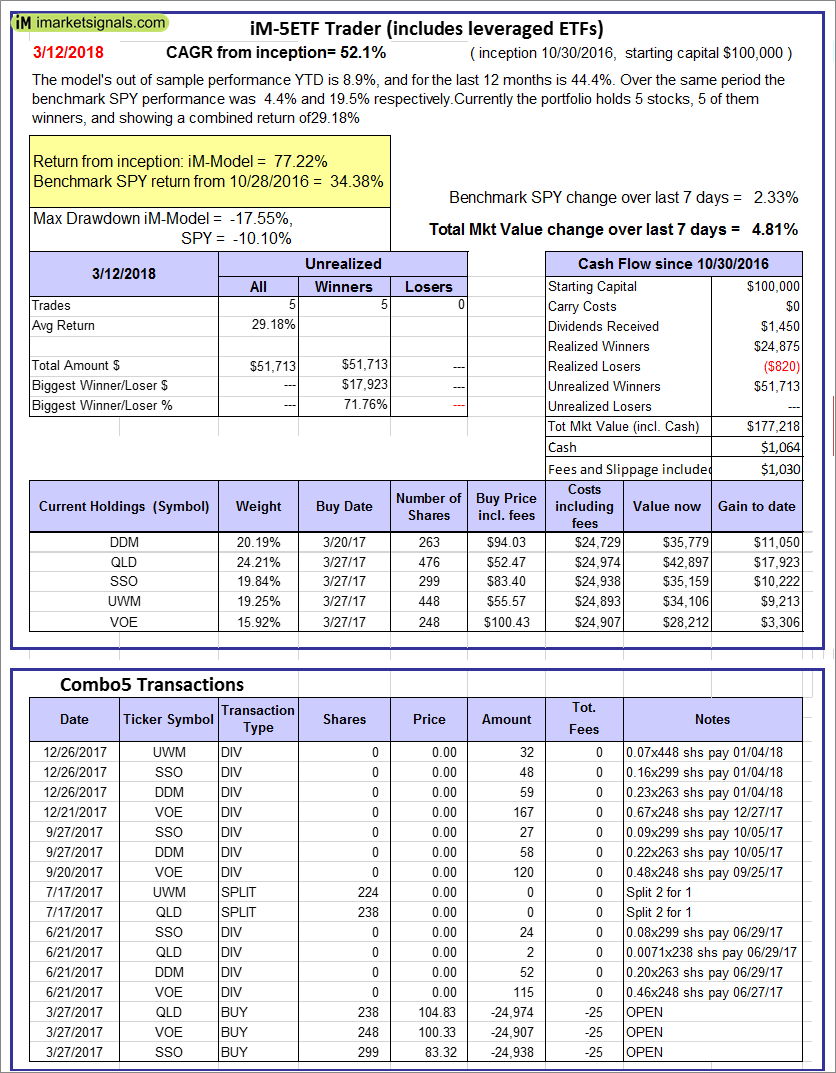
iM-5ETF Trader (includes leveraged ETFs): The model’s out of sample performance YTD is 8.9%, and for the last 12 months is 44.4%. Over the same period the benchmark SPY performance was 4.4% and 19.5% respectively. Over the previous week the market value of the iM-5ETF Trader (includes leveraged ETFs) gained 4.81% at a time when SPY gained 2.33%. A starting capital of $100,000 at inception on 10/30/2016 would have grown to $177,218 which includes $1,064 cash and excludes $1,030 spent on fees and slippage. |
|
|
iM-Standard 5ETF Trader (excludes leveraged ETFs): The model’s out of sample performance YTD is 3.5%, and for the last 12 months is 20.2%. Over the same period the benchmark SPY performance was 4.4% and 19.5% respectively. Over the previous week the market value of the iM-Standard 5ETF Trader (excludes leveraged ETFs) gained 2.17% at a time when SPY gained 2.33%. A starting capital of $100,000 at inception on 10/30/2016 would have grown to $130,067 which includes $2,002 cash and excludes $880 spent on fees and slippage. |


Leave a Reply
You must be logged in to post a comment.