
This BCI-sampler page provides information on our weekly Business Cycle Index. This project was initiated after we realized that the Economic Cycle Research Institute’s Weekly Leading Index is impaired. Refer to Does ECRI’s WLI Remain a Usable Indicator?
A description can be found in our article on Advisor Perspective iM’s Weekly Business Cycle Index; 11 Week average warning for the past seven recessions with no false positives. or on our pages iM’s Business Cycle Index replaces ECRI’s WLI
For description of the BCI in off-peak-mode (BCIp) Fig-2 please refer to BCIp (or BCI in Off-Peak-Mode): 20 Weeks lead to Recessions
The BCI is updated every Thursday This page will not be updated
Please Register and/or log in to obtain the latest values of the BCI‘ ;
 click on image to enlarge
 click on image to enlarge
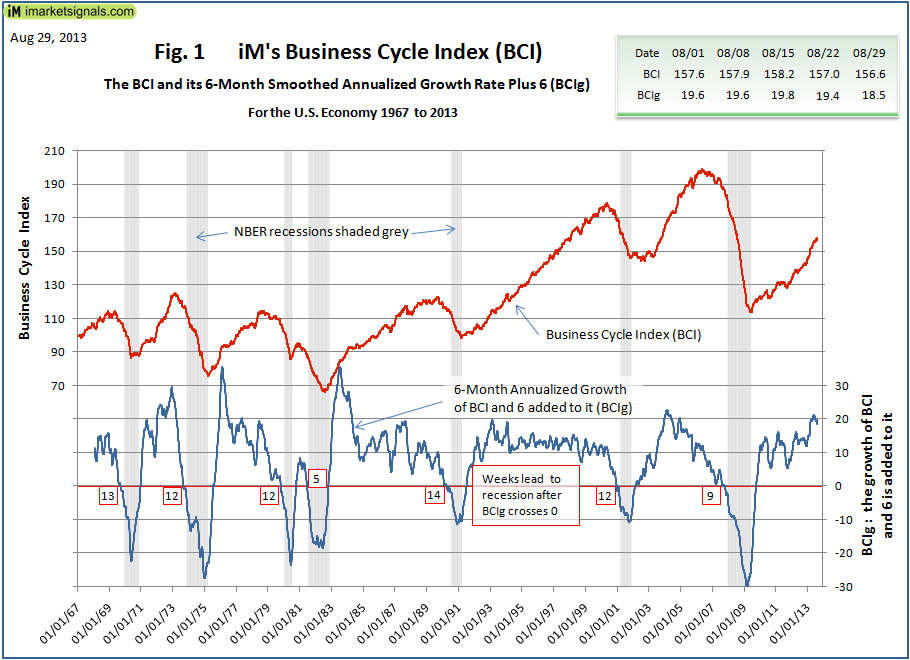
Knowing when the U.S. Economy is on a recession track is paramount to successfully managing investments. We have designed the weekly iMarketSignals Business Cycle Index (BCI) so it would have provided early reliably warnings for the past seven recessions. We achieved recessions leads of 11 weeks on average, with a standard deviation of 2.6 giving a Sharpe ratio of 4.2. This high ratio indicates that all the leads are of similar length. The absence of false positives, for the analyzed time frame 1967 to 2013, enhance the quality and reliability of the recession warnings.
We developed our new proprietary leading index, the iMarketSignals Business Cycle Index (BCI), from the following economic data:
1. 10-year treasury yield (daily)
2. 3-month treasury bill yield (daily)
3. S&P500 (daily)
4. Continues Claims Seasonally Adjusted (weekly)
5. All Employees: Total Private Industries (monthly)
6. New houses for sale (monthly)
7. New houses sold (monthly)
The table below shows the lead times to the various recessions, and the second table is a sample of the data series.
| Business Cycle Index – a sample | ||
| DATE | BCI | BCIg |
| 04/18/13 | 150.70 | 18.08 |
| 04/11/13 | 150.47 | 18.41 |
| 04/04/13 | 150.54 | 18.65 |
| 03/28/13 | 150.56 | 18.44 |
| 03/21/13 | 150.59 | 17.78 |
| 03/14/13 | 150.12 | 16.62 |
| 03/07/13 | 148.90 | 15.58 |
| 02/28/13 | 147.75 | 14.77 |
| 02/21/13 | 146.48 | 14.44 |
| 02/14/13 | 146.35 | 14.61 |
| 02/07/13 | 145.84 | 14.60 |
| 01/31/13 | 145.99 | 14.71 |
| 01/24/13 | 146.09 | 14.40 |
| 01/17/13 | 145.41 | 13.91 |
| 01/10/13 | 145.24 | 13.33 |
| 01/03/13 | 144.21 | 12.74 |
Registered users can download weekly an MS excel file in above format covering the period 1967 to present.