
- Stocks usually perform poorly when inflation is on the rise. We developed a market timer according to two inflation rate based rules. A buy signal has now emerged.
- Switching according to the signals between the S&P500 with dividends and a money-market fund would have provided from Aug-1953 to end of Jan-2017 an annualized return of 12.69%.
- Over the same period buy-and-hold of the S&P500 with dividends showed an annualized return of 10.08%, producing about a quarter of the total return of the Timer model.
- The Enhanced Inflation Timer uses one additional criterion in the buy rule for stocks (and sell rule for bonds); high-beta stocks must perform better than low-beta stocks.
The inflation rate (INF) is the 12-month rate of change of the consumer price index (CPI). The CPI is provided by the Department of Labor Statistics usually during the third week after the month to which it refers.
Rules
Sell Rule for stocks = Buy Rule of bonds:
- INF > (6-mo SMA(INF) + 0.75% & INF > 2.0)
- Sell when the inflation rate exceeds its 6-month moving average plus 0.75% and also exceeds 2.0%.
Buy Rule for stocks = Sell Rule for bonds:
- INF < 6-mo SMA(INF) – 0.20% & Beta-Timer=true
- Buy when the inflation rate becomes less than its 6-month moving average minus 0.20% and high-beta stocks perform better than low-beta stocks as indicated by the iM Beta-Timer.
The performance for the long-term tests from Aug-1953 to Jan-2017 and Jan-2000 to Jan-2017 is shown in the updated model description.
Also the model generated a sell signal for stocks at the end of Jan-2017 which is listed in the Appendix to the model description. Now, both the original model and also the Enhanced Inflation Timer have recently indicated stock market investment again.
Performance of the iM Enhanced Inflation Timer
We simulated performance of the model on Portfolio 123 switching between SPDR S&P 500 ETF (SPY) and the iShares Short Treasury Bond ETF (SHV), so it can be compared to the performance shown in Figure-2 of the updated model description.
Over the period 1/3/2000 to Jan-30-2017 the original model showed an annualized return of 9.01% with a maximum drawdown of -39% in 2002. Buy-and-hold SPY gave an annualized return of 4.58% with a maximum drawdown of -55% in 2009.
The Enhanced Inflation Timer, over the period 1/3/2000 to Jan-30-2017, showed an annualized return of 11.3% with a maximum drawdown of -12% in 2016.
The performance of the Enhanced Inflation Timer, over the period 1/3/2000 to Jun-21-2017 is shown in Figure-1 below. The nearly horizontal performance sections of the graph indicate the periods when the model was in SHV. Recently, the model switched back to SPY.
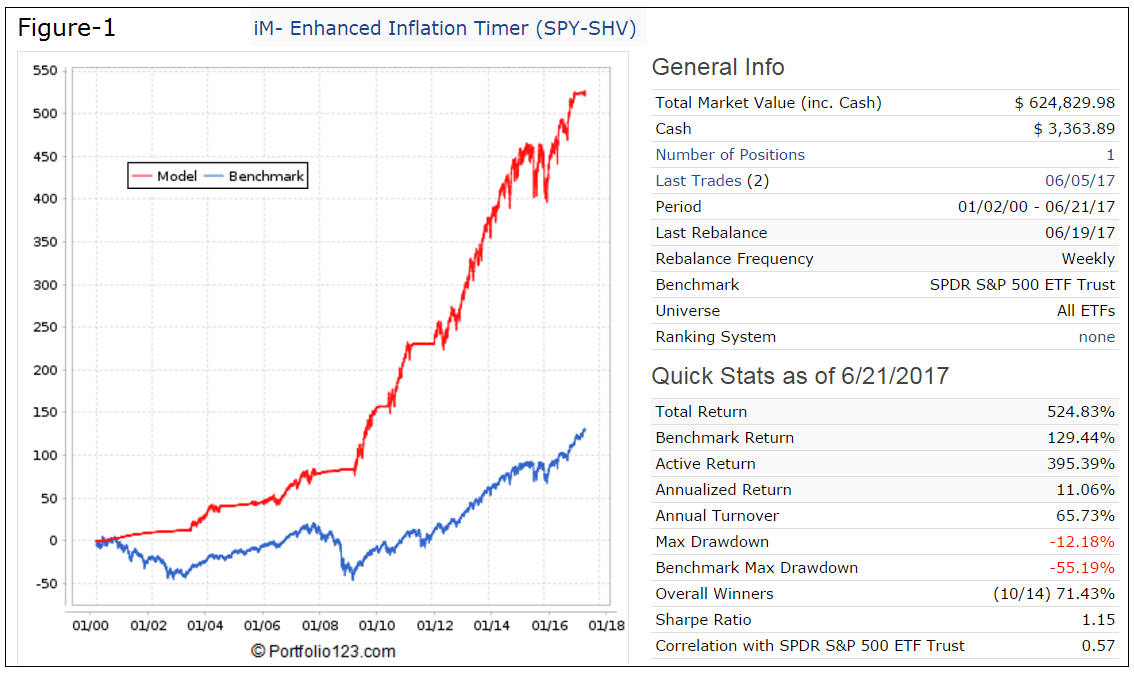
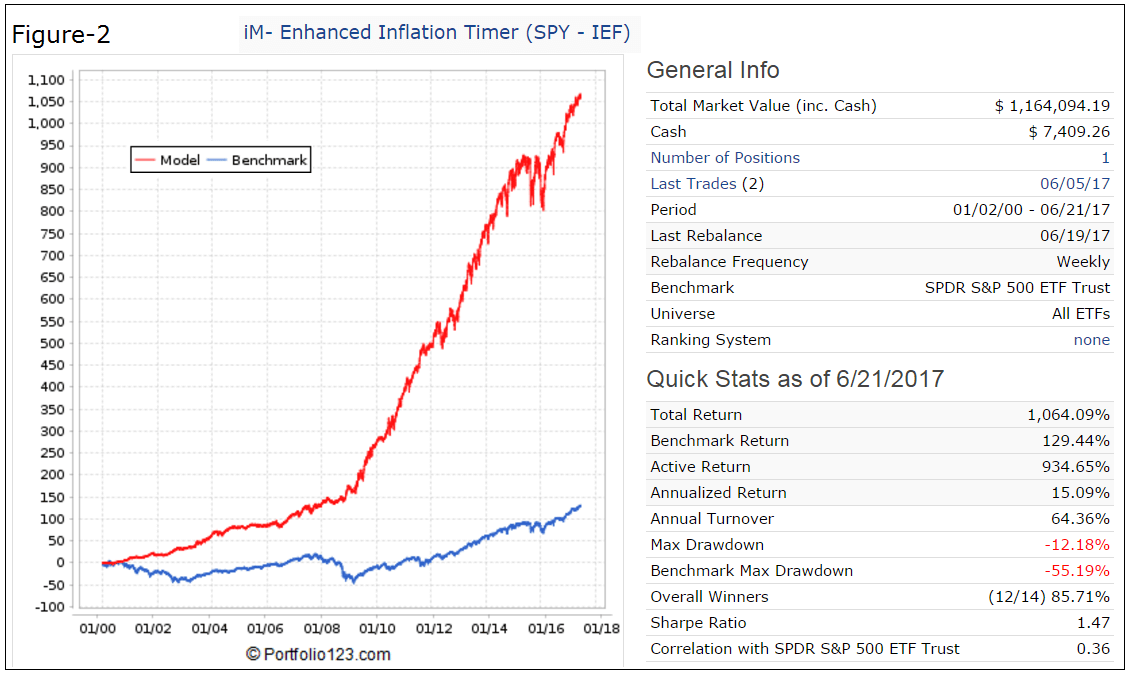
Figure-2 shows the performance for the same model but switching between SPY and the iShares 7-10 Year Treasury Bond ETF (IEF). Over the period 1/3/2000 to Jun-21-2017 it showed an annualized return of 15.1% with a maximum drawdown of -12% in 2016.
Conclusion
The Enhanced Inflation Timer, switching between SPY and IEF, model can also be followed live at iMrketSignals.com. Heeding the monthly signals from the Inflation Timer should provide insurance against major stock market declines and improve investment performance.
Disclaimer
Note: All performance results are hypothetical and the result of backtesting over the period 2000 to 2017. Since performance is dependent on market-timing rules, the future out-of-sample performance may be significantly less if those rules are not as effective as they were during the backtest period. No claim is made about future performance.
Leave a Reply
You must be logged in to post a comment.