
  |
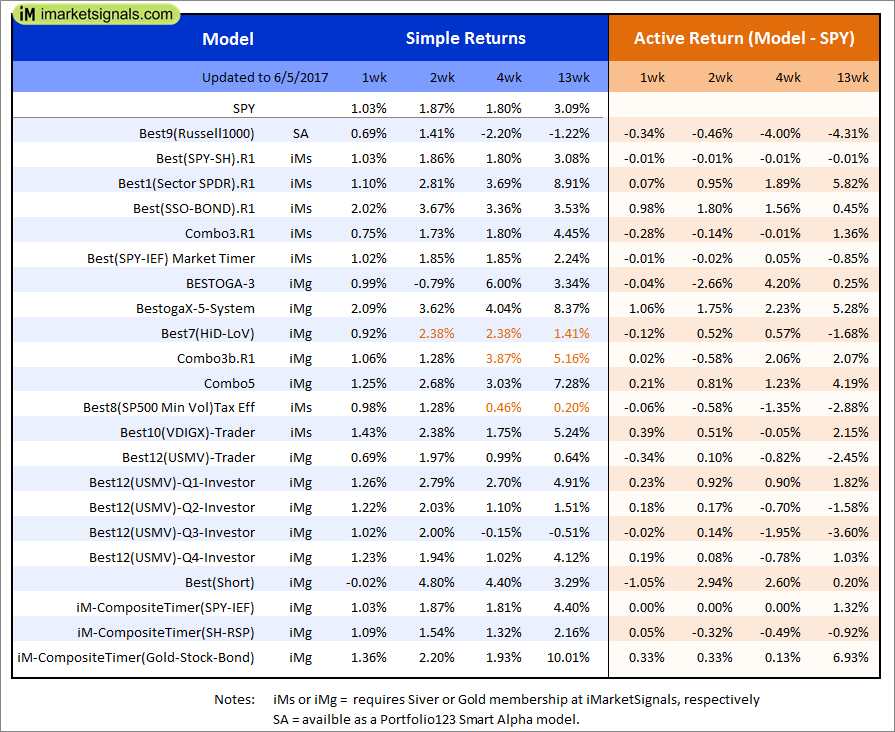
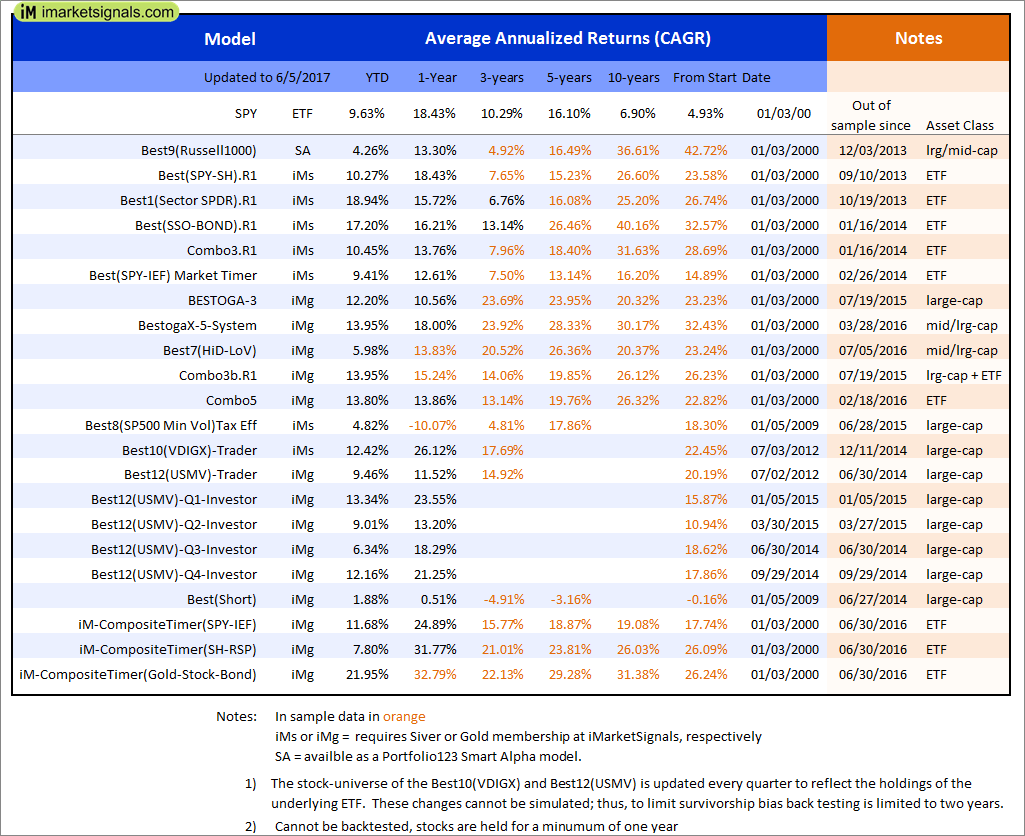
Out of sample performance summary of our models for the past 1, 2, 4 and 13 week periods. The active active return indicates how the models over- or underperformed the benchmark ETF SPY. Also the YTD, and the 1-, 3-, 5- and 10-year annualized returns are shown in the second table |
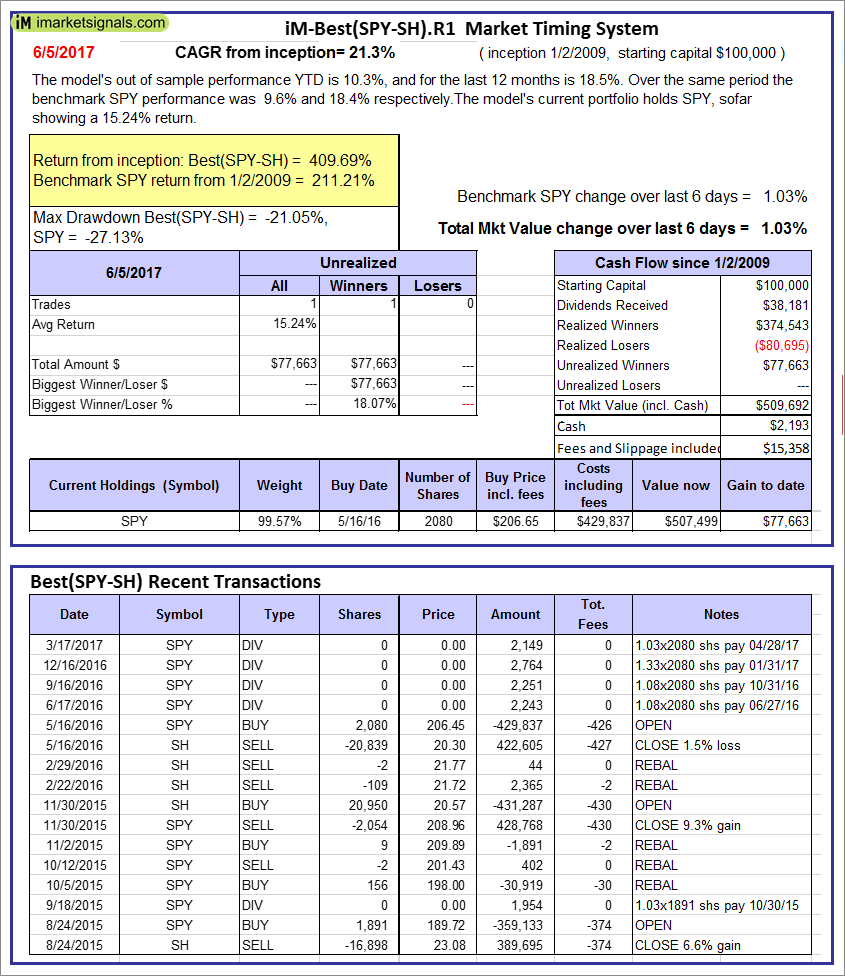 |
iM-Best(SPY-SH).R1: The model’s out of sample performance YTD is 10.3%, and for the last 12 months is 18.5%. Over the same period the benchmark SPY performance was 9.6% and 18.4% respectively. Over the previous week the market value of Best(SPY-SH) gained 1.03% at a time when SPY gained 1.03%. A starting capital of $100,000 at inception on 1/2/2009 would have grown to $509,692 which includes $2,193 cash and excludes $15,358 spent on fees and slippage. |
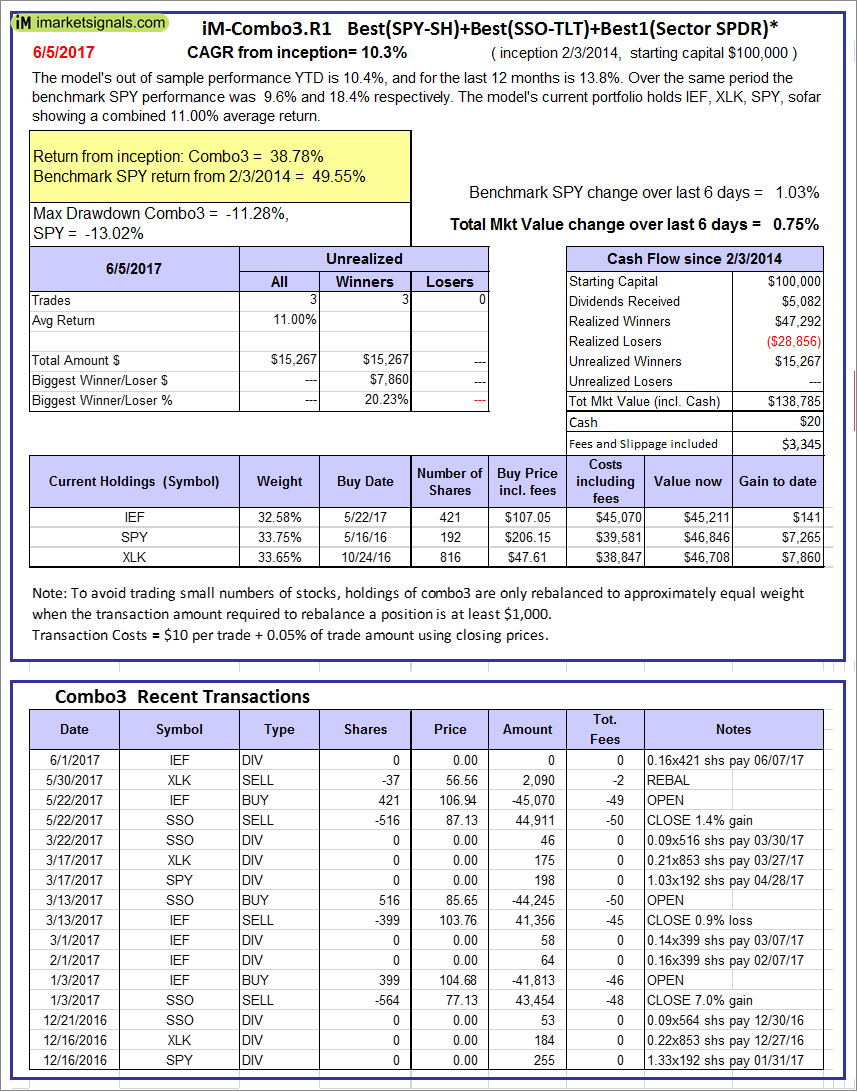 |
iM-Combo3.R1: The model’s out of sample performance YTD is 10.4%, and for the last 12 months is 13.8%. Over the same period the benchmark SPY performance was 9.6% and 18.4% respectively. Over the previous week the market value of iM-Combo3.R1 gained 0.75% at a time when SPY gained 1.03%. A starting capital of $100,000 at inception on 2/3/2014 would have grown to $138,785 which includes $20 cash and excludes $3,345 spent on fees and slippage. |
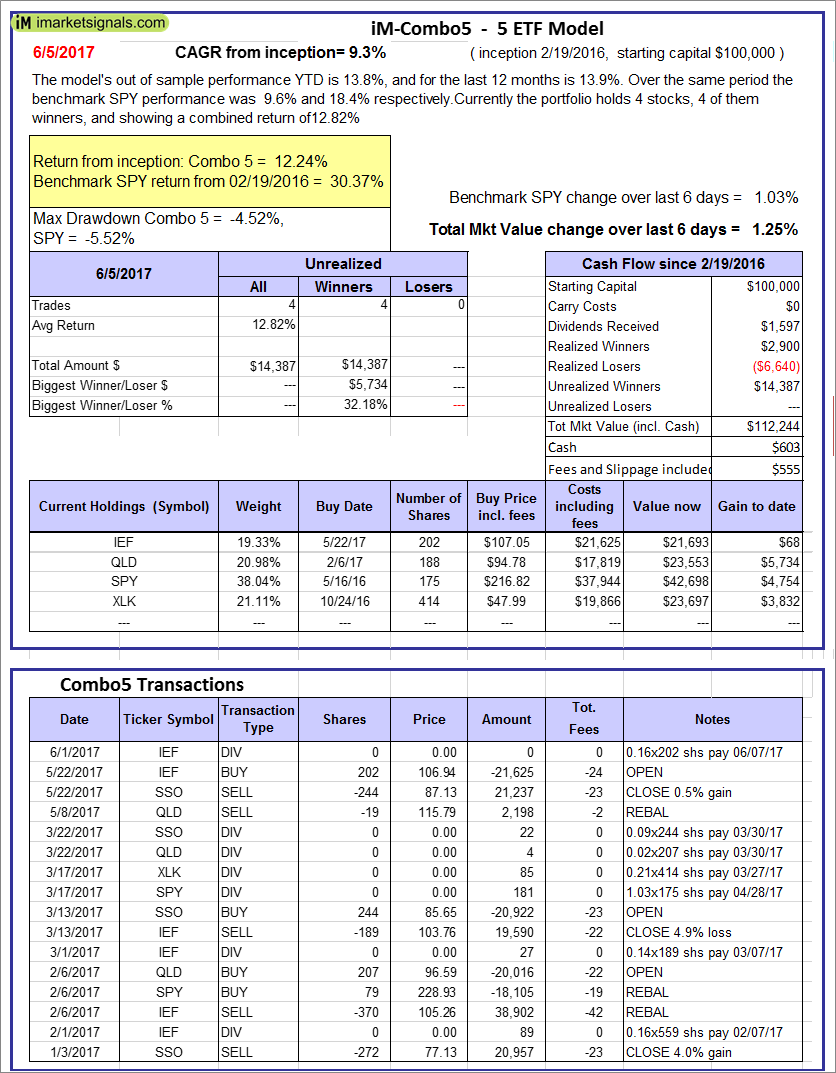 |
iM-Combo5: The model’s out of sample performance YTD is 13.8%, and for the last 12 months is 13.9%. Over the same period the benchmark SPY performance was 9.6% and 18.4% respectively. Over the previous week the market value of iM-Combo5 gained 1.25% at a time when SPY gained 1.03%. A starting capital of $100,000 at inception on 2/22/2016 would have grown to $112,244 which includes $603 cash and excludes $555 spent on fees and slippage. |
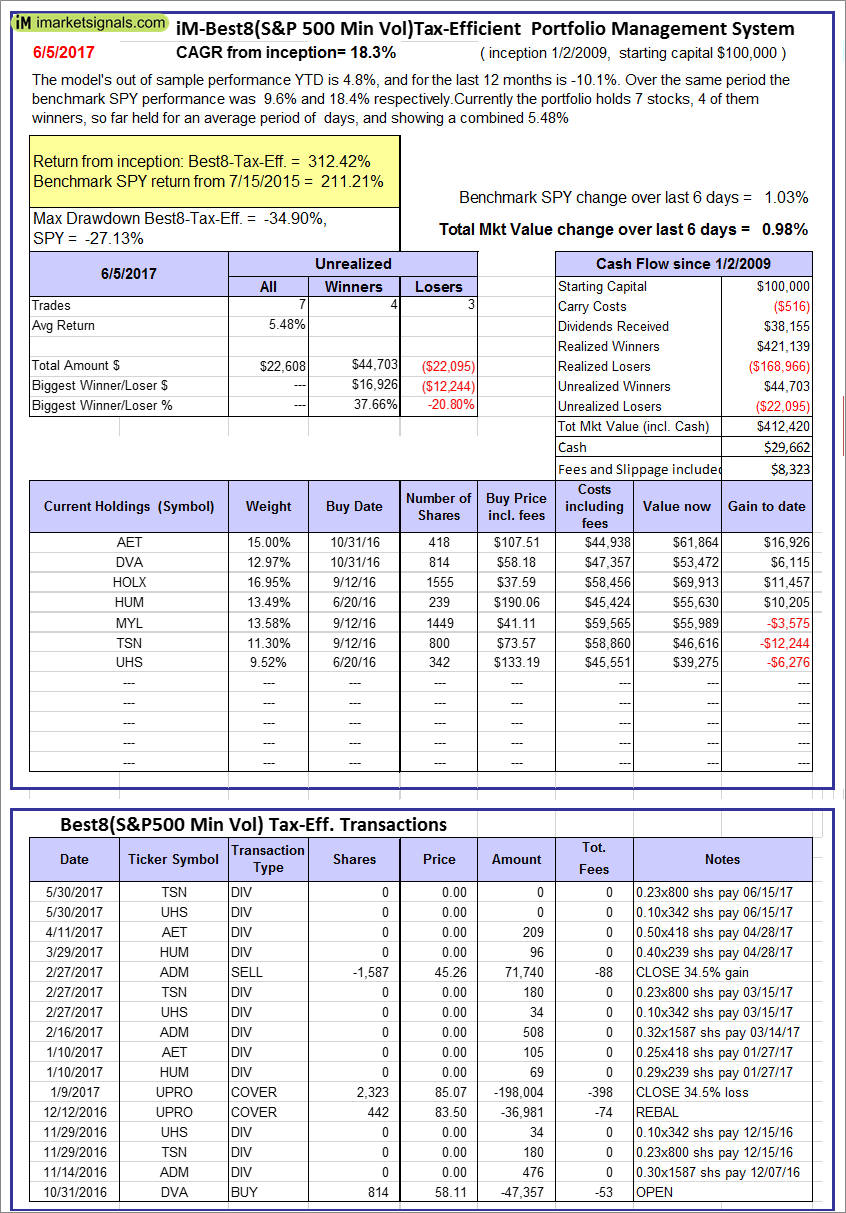 |
The iM-Best8(S&P500 Min Vol)Tax-Efficient The model’s out of sample performance YTD is 4.8%, and for the last 12 months is -10.1%. Over the same period the benchmark SPY performance was 9.6% and 18.4% respectively. Over the previous week the market value of iM-Best8(S&P 500)Tax-Eff. gained 0.98% at a time when SPY gained 1.03%. A starting capital of $100,000 at inception on 1/2/2009 would have grown to $412,420 which includes $29,662 cash and excludes $8,323 spent on fees and slippage. |
 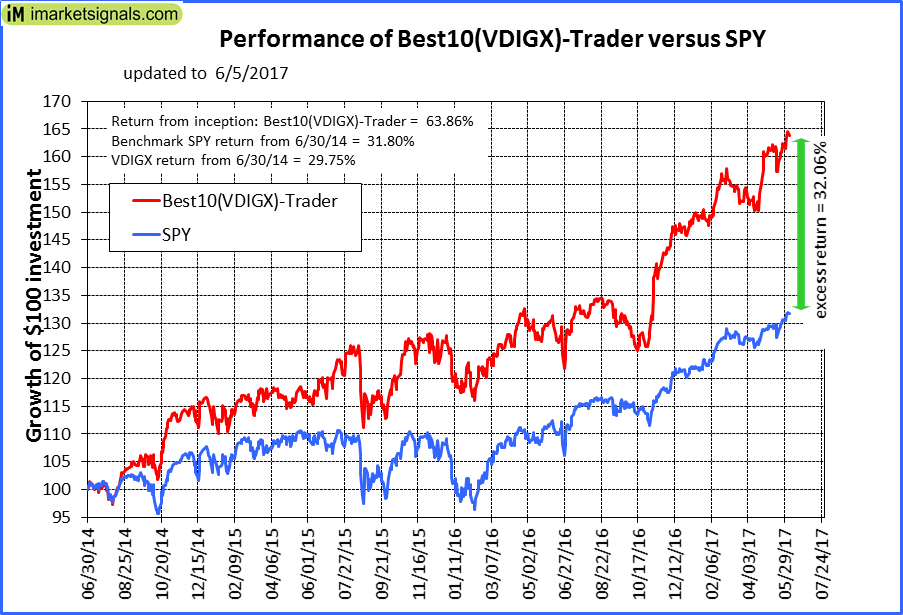 |
iM-Best10(VDIGX)-Trader: The model’s out of sample performance YTD is 12.4%, and for the last 12 months is 26.1%. Over the same period the benchmark SPY performance was 9.6% and 18.4% respectively. Since inception, on 7/1/2014, the model gained 63.86% while the benchmark SPY gained 31.80% and VDIGX gained 29.75% over the same period. Over the previous week the market value of iM-Best10(VDIGX) gained 1.43% at a time when SPY gained 1.03%. A starting capital of $100,000 at inception on 7/1/2014 would have grown to $163,857 which includes $247 cash and excludes $1,542 spent on fees and slippage. |
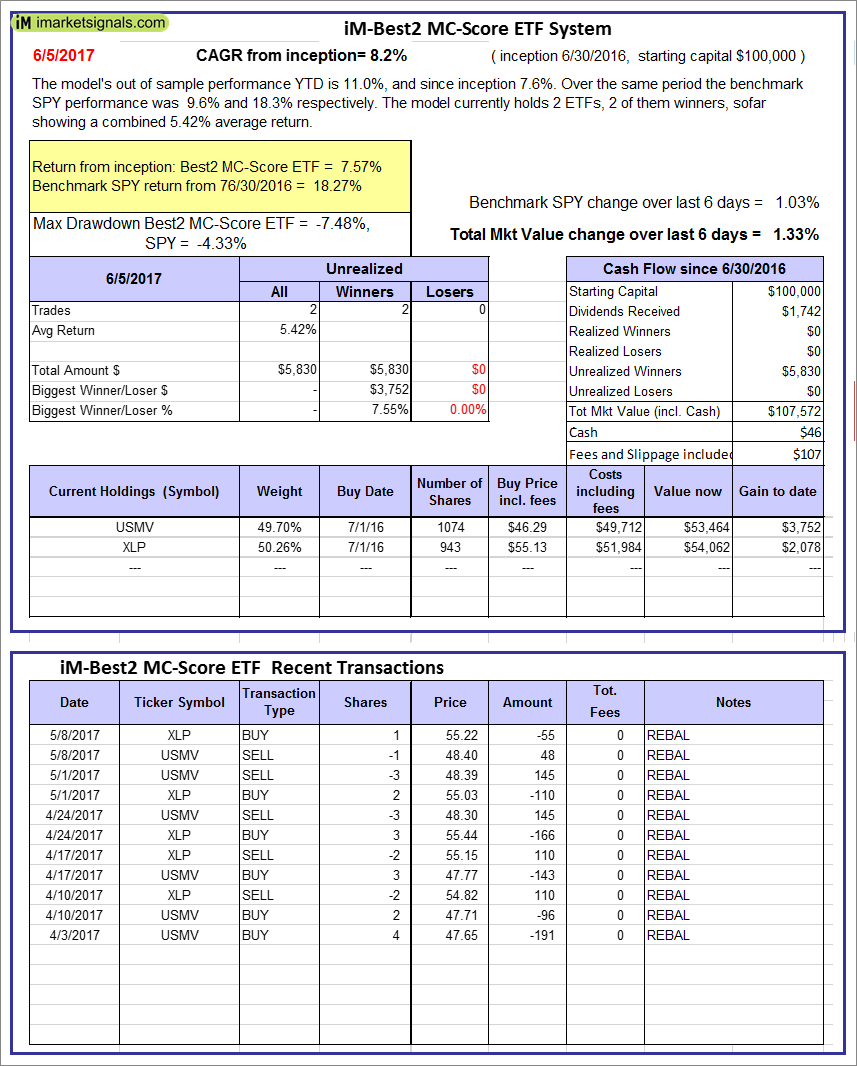 |
iM-Best2 MC-Score ETF System: The model’s out of sample performance YTD is 11.0%, and since inception 7.6%. Over the same period the benchmark SPY performance was 9.6% and 18.3% respectively. Over the previous week the market value of iM-BESTOGA-3 gained 1.33% at a time when SPY gained 1.03%. A starting capital of $100,000 at inception on 6/30/2016 would have grown to $46 which includes $107 cash and excludes Gain to date spent on fees and slippage. |
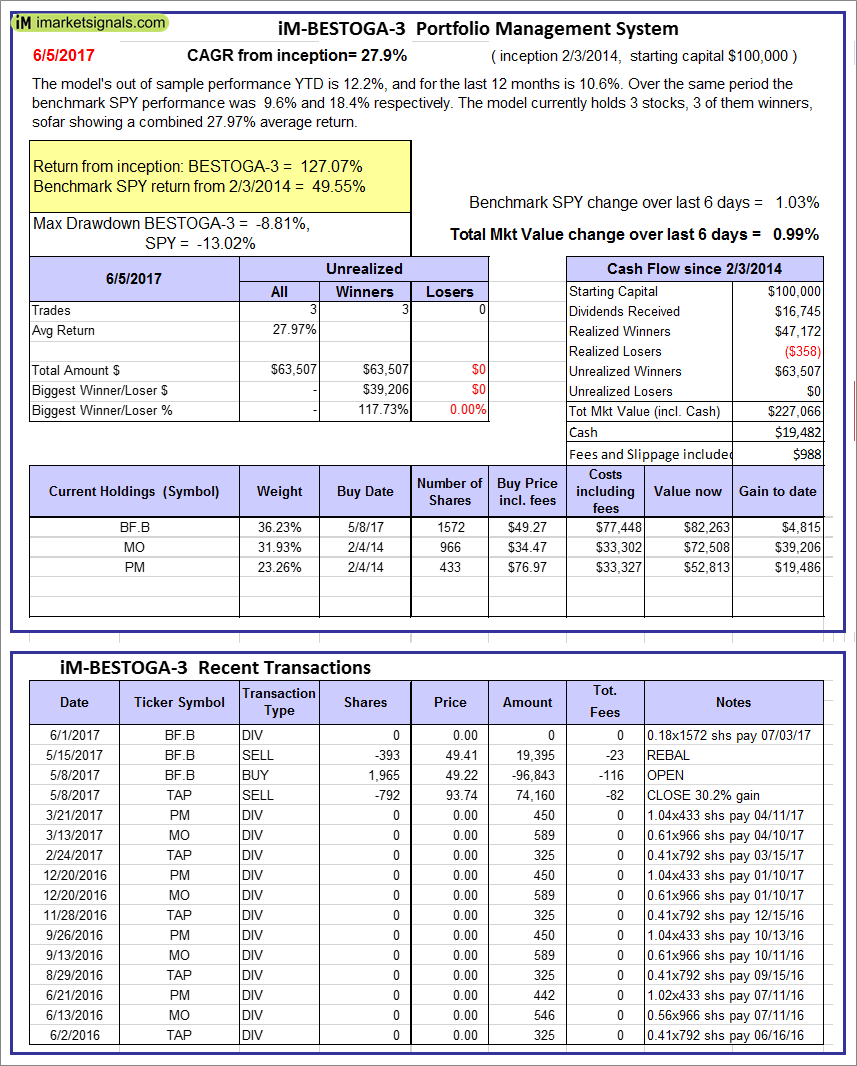 |
iM-BESTOGA-3: The model’s out of sample performance YTD is 12.2%, and for the last 12 months is 10.6%. Over the same period the benchmark SPY performance was 9.6% and 18.4% respectively. Over the previous week the market value of iM-BESTOGA-3 gained 0.99% at a time when SPY gained 1.03%. A starting capital of $100,000 at inception on 2/3/2014 would have grown to $227,066 which includes $19,482 cash and excludes $988 spent on fees and slippage. |
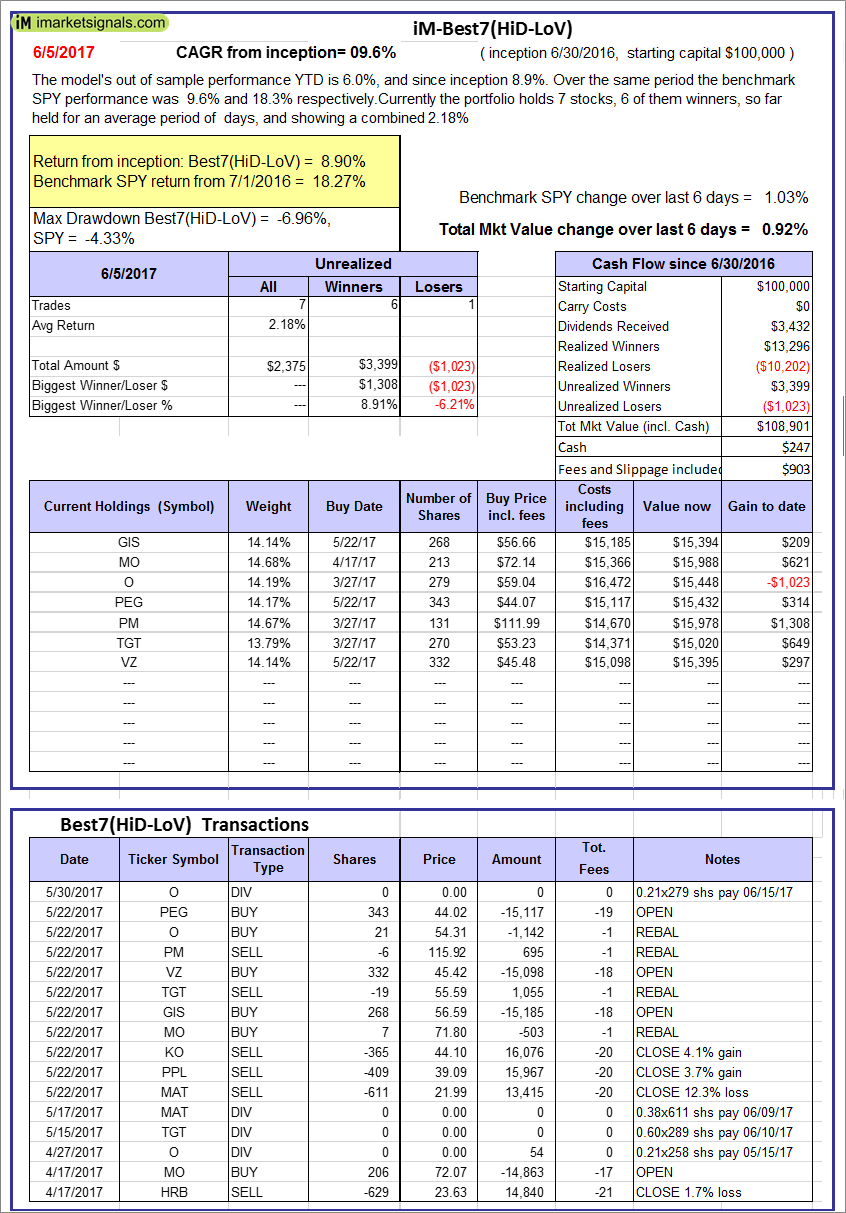 |
iM-Best7(HiD-LoV): The model’s out of sample performance YTD is 6.0%, and since inception 8.9%. Over the same period the benchmark SPY performance was 9.6% and 18.3% respectively. Over the previous week the market value of iM-BESTOGA-3 gained 0.92% at a time when SPY gained 1.03%. A starting capital of $100,000 at inception on 6/30/2016 would have grown to $108,901 which includes $247 cash and excludes $903 spent on fees and slippage. |
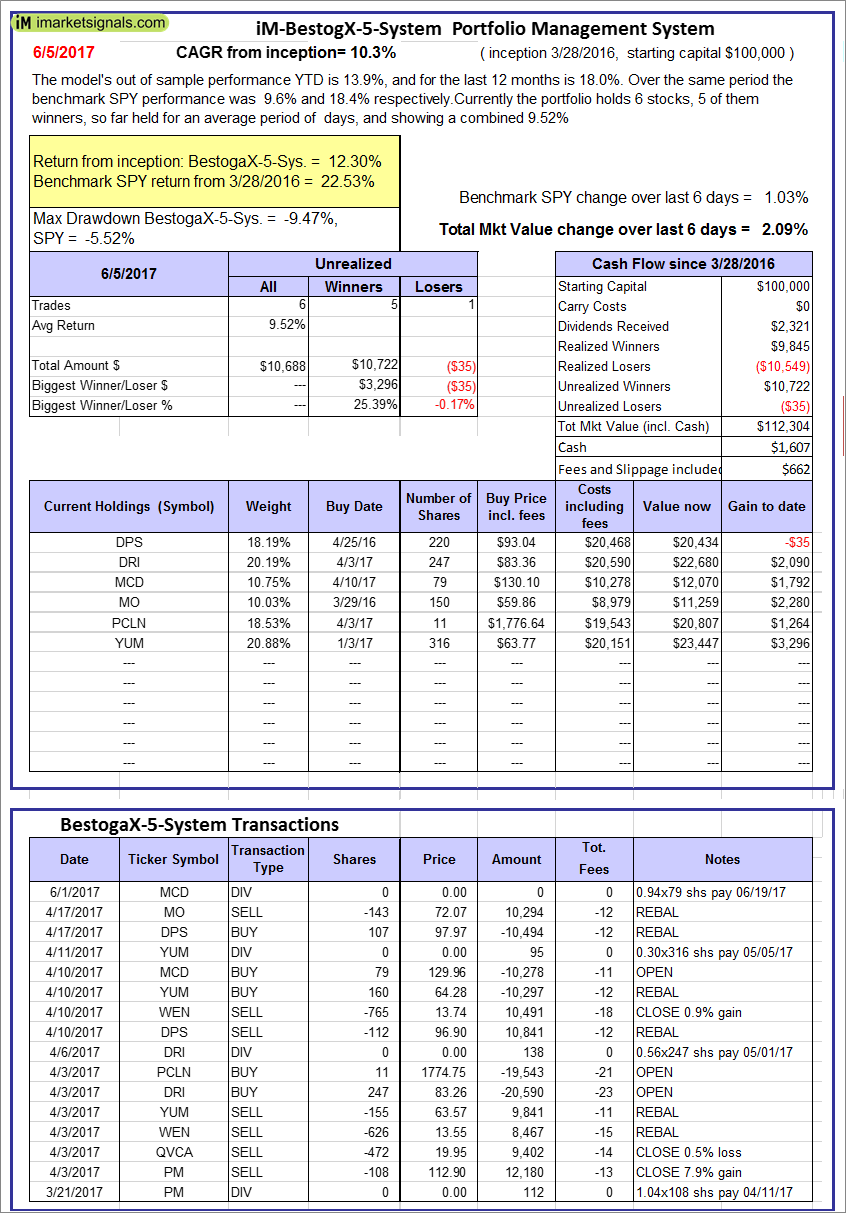 |
iM-BestogaX5-System: The model’s out of sample performance YTD is 13.9%, and for the last 12 months is 18.0%. Over the same period the benchmark SPY performance was 9.6% and 18.4% respectively. Over the previous week the market value of iM-Best8(S&P 500)Tax-Eff. gained 2.09% at a time when SPY gained 1.03%. A starting capital of $100,000 at inception on 3/28/2016 would have grown to $112,304 which includes $1,607 cash and excludes $662 spent on fees and slippage. |
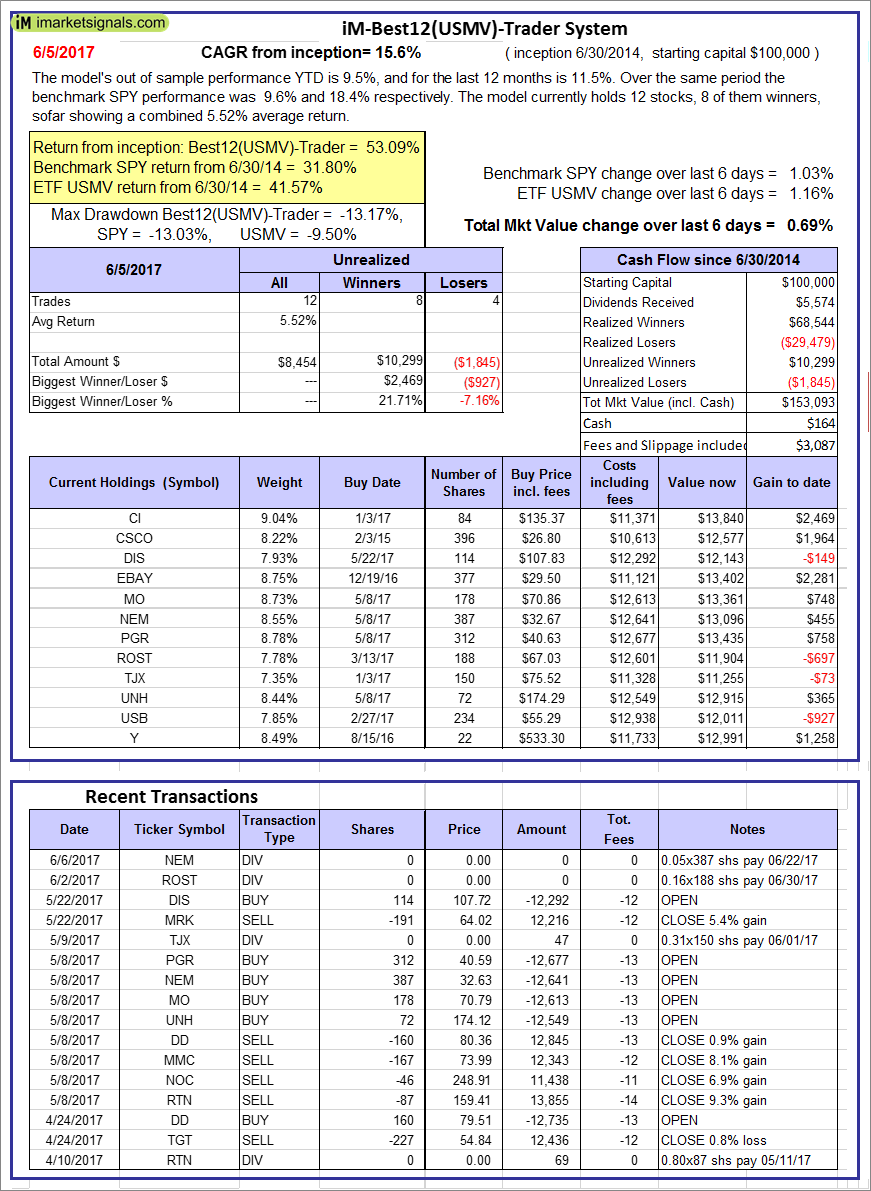  |
iM-Best12(USMV)-Trader: The model’s out of sample performance YTD is 9.5%, and for the last 12 months is 11.5%. Over the same period the benchmark SPY performance was 9.6% and 18.4% respectively. Since inception, on 7/1/2014, the model gained 53.09% while the benchmark SPY gained 31.80% and the ETF USMV gained 41.57% over the same period. Over the previous week the market value of iM-Best12(USMV)-Trader gained 0.69% at a time when SPY gained 1.03%. A starting capital of $100,000 at inception on 7/1/2014 would have grown to $153,093 which includes $164 cash and excludes $3,087 spent on fees and slippage. |
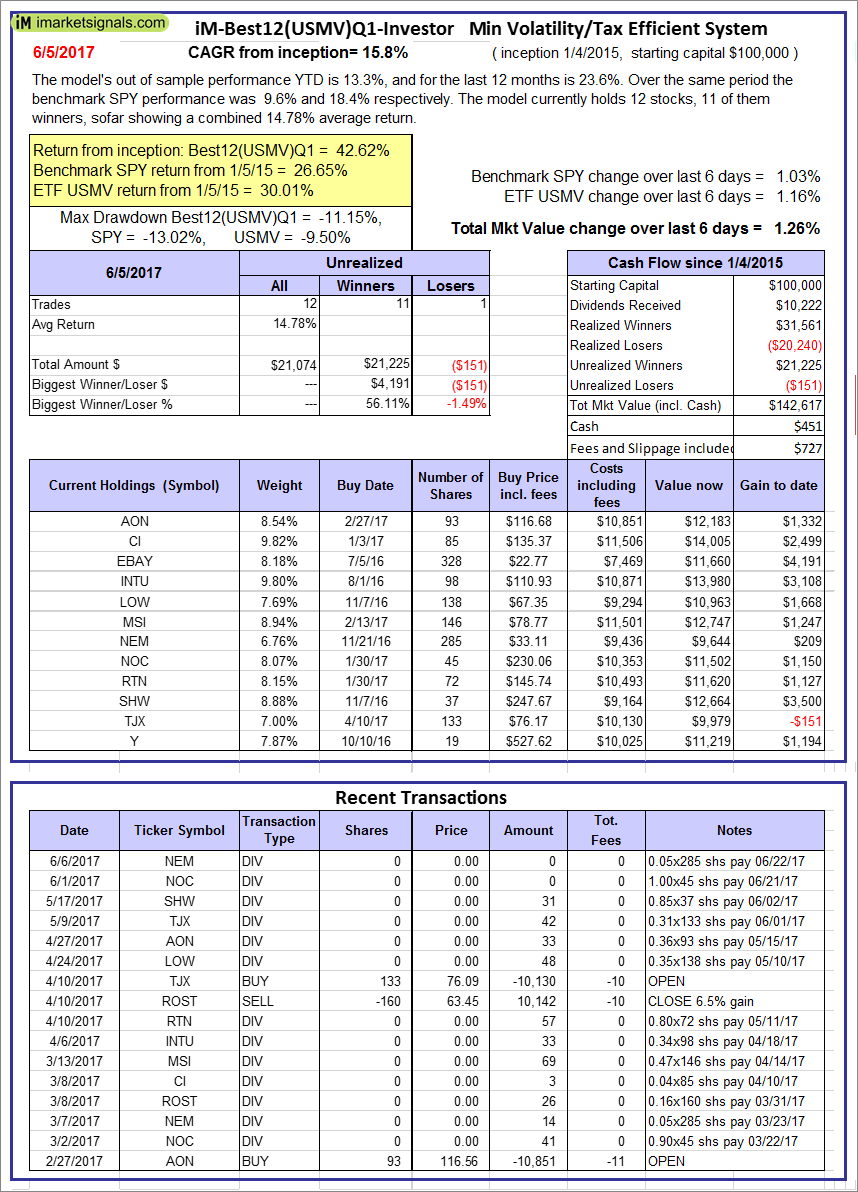 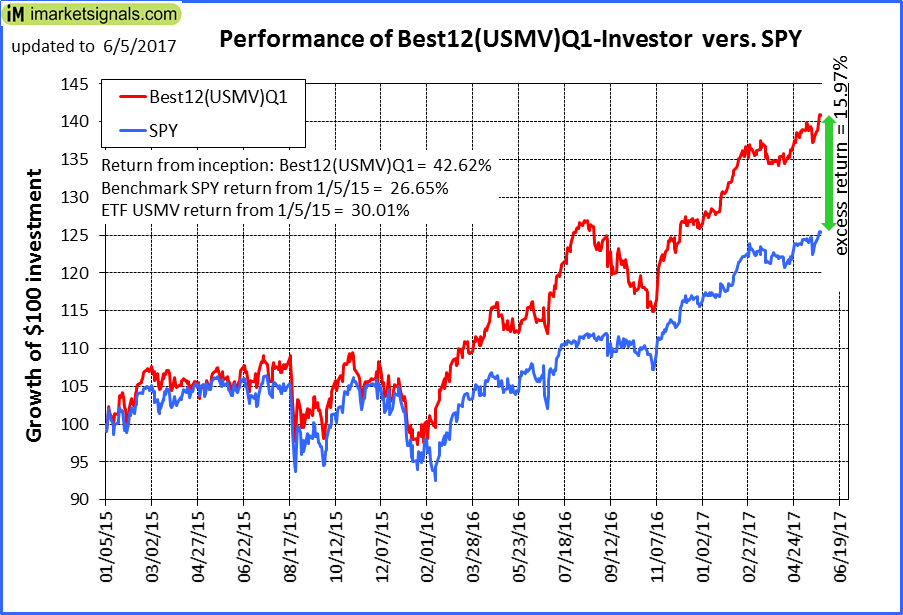 |
iM-Best12(USMV)Q1-Investor: The model’s out of sample performance YTD is 13.3%, and for the last 12 months is 23.6%. Over the same period the benchmark SPY performance was 9.6% and 18.4% respectively. Since inception, on 1/5/2015, the model gained 42.62% while the benchmark SPY gained 26.65% and the ETF USMV gained 30.01% over the same period. Over the previous week the market value of iM-Best12(USMV)Q1 gained 1.26% at a time when SPY gained 1.03%. A starting capital of $100,000 at inception on 1/5/2015 would have grown to $142,617 which includes $451 cash and excludes $727 spent on fees and slippage. |
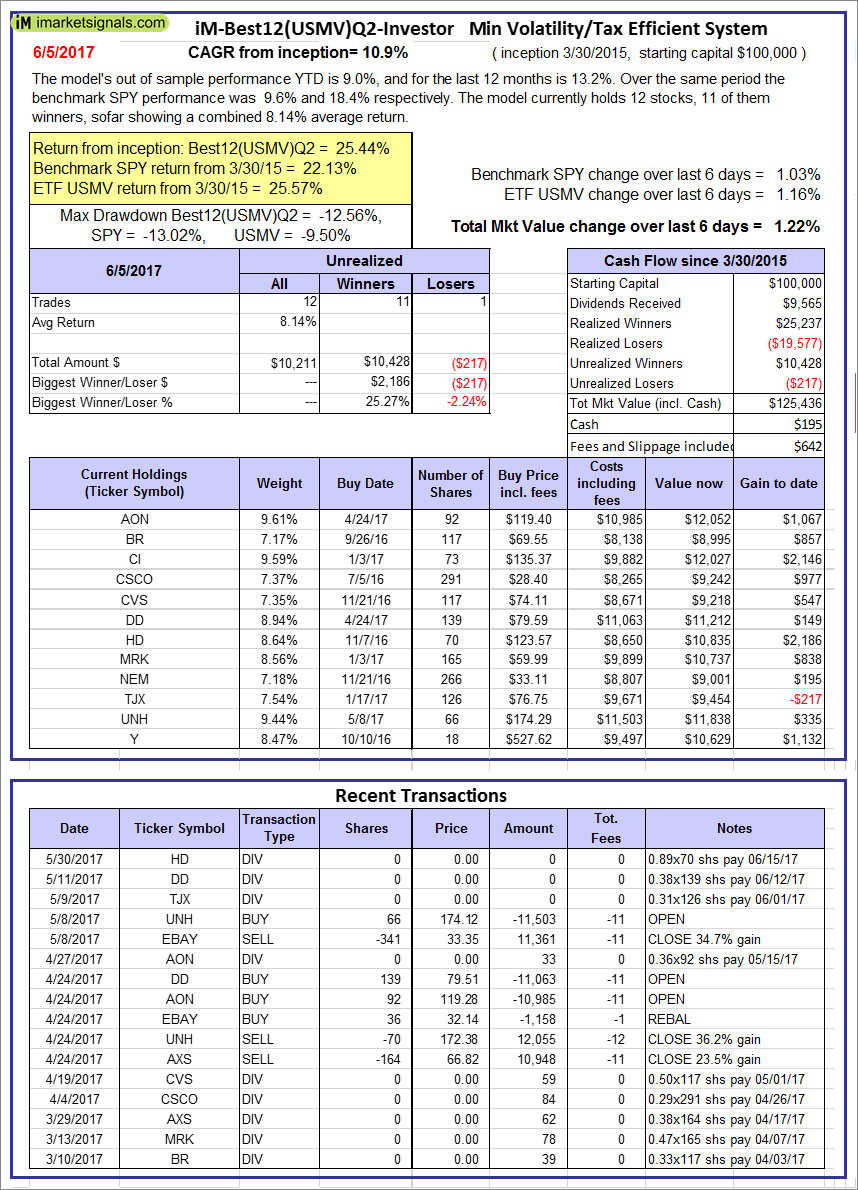 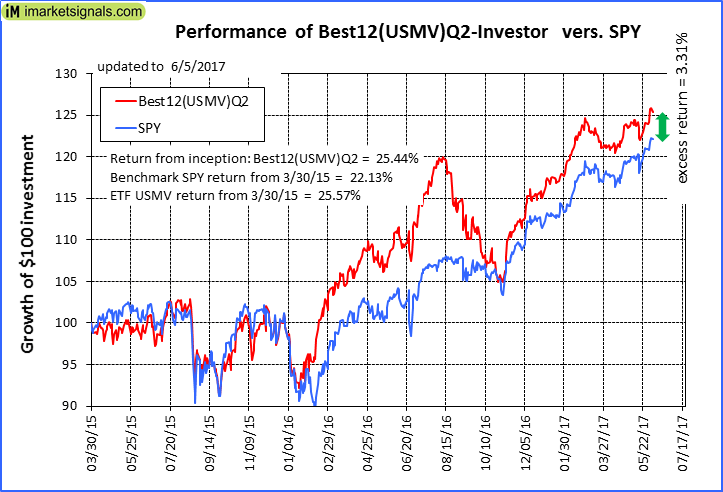 |
iM-Best12(USMV)Q2-Investor: The model’s out of sample performance YTD is 9.0%, and for the last 12 months is 13.2%. Over the same period the benchmark SPY performance was 9.6% and 18.4% respectively. Since inception, on 3/31/2015, the model gained 25.44% while the benchmark SPY gained 22.13% and the ETF USMV gained 25.57% over the same period. Over the previous week the market value of iM-Best12(USMV)Q2 gained 1.22% at a time when SPY gained 1.03%. A starting capital of $100,000 at inception on 3/31/2015 would have grown to $125,436 which includes $195 cash and excludes $642 spent on fees and slippage. |
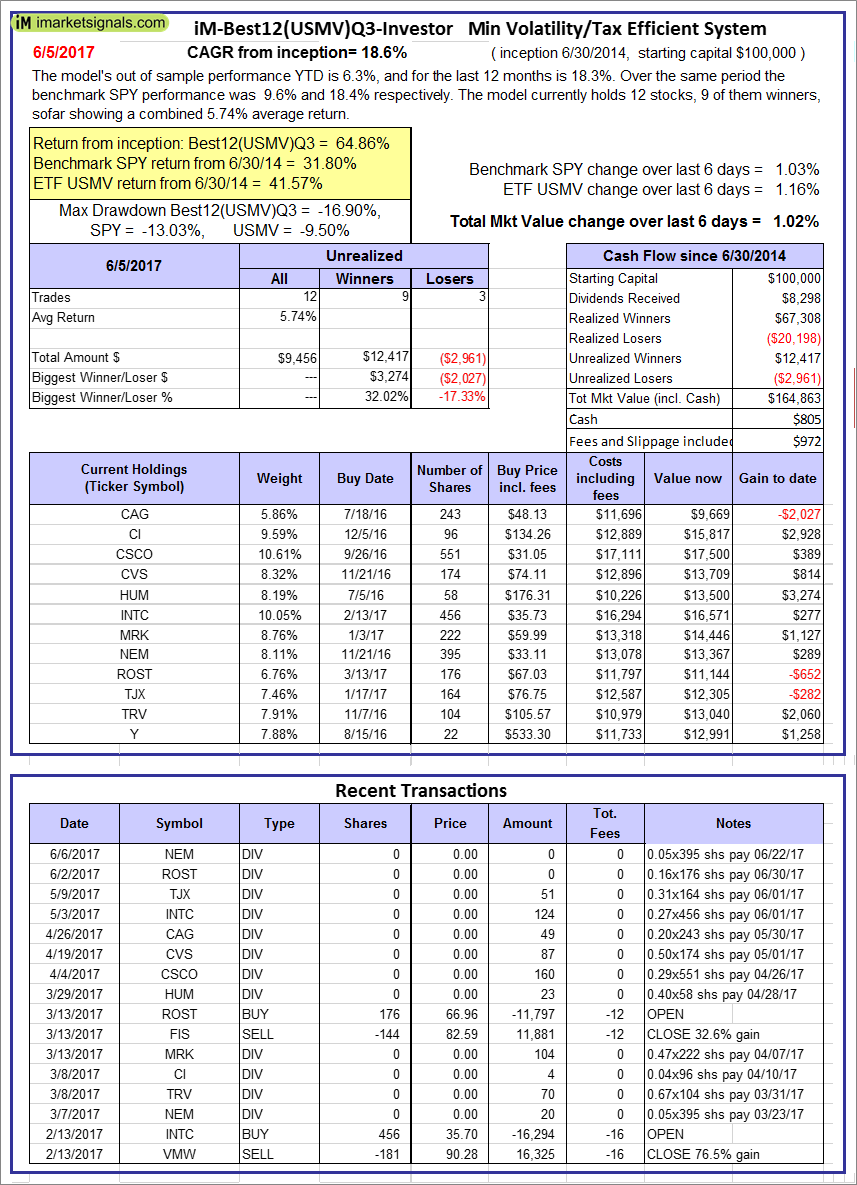  |
iM-Best12(USMV)Q3-Investor: The model’s out of sample performance YTD is 6.3%, and for the last 12 months is 18.3%. Over the same period the benchmark SPY performance was 9.6% and 18.4% respectively. Since inception, on 7/1/2014, the model gained 64.86% while the benchmark SPY gained 31.80% and the ETF USMV gained 41.57% over the same period. Over the previous week the market value of iM-Best12(USMV)Q3 gained 1.02% at a time when SPY gained 1.03%. A starting capital of $100,000 at inception on 7/1/2014 would have grown to $164,863 which includes $805 cash and excludes $972 spent on fees and slippage. |
 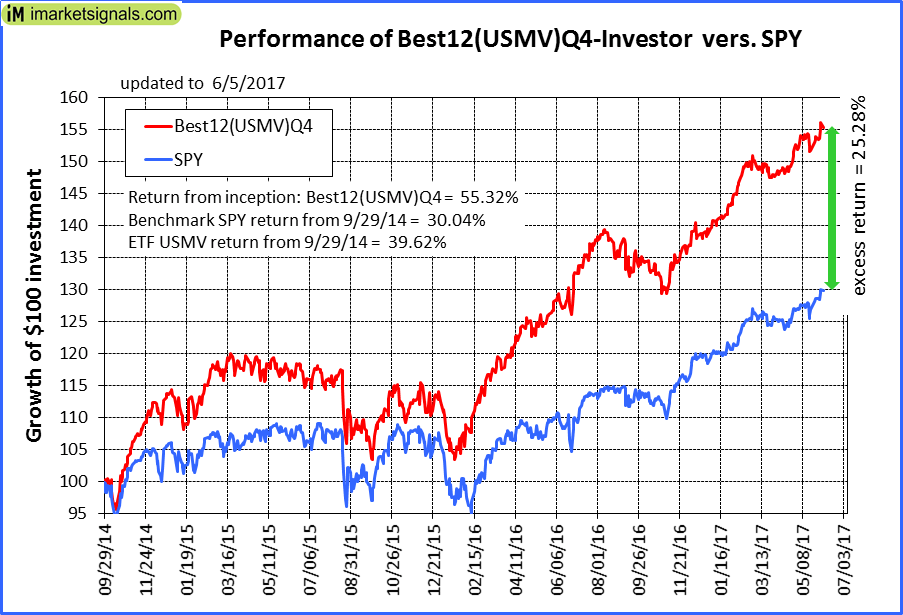 |
iM-Best12(USMV)Q4-Investor: Since inception, on 9/30/2014, the model gained 55.32% while the benchmark SPY gained 30.04% and the ETF USMV gained 39.62% over the same period. Over the previous week the market value of iM-Best12(USMV)Q4 gained 1.23% at a time when SPY gained 1.03%. A starting capital of $100,000 at inception on 9/30/2014 would have grown to $155,317 which includes $742 cash and excludes $827 spent on fees and slippage. |
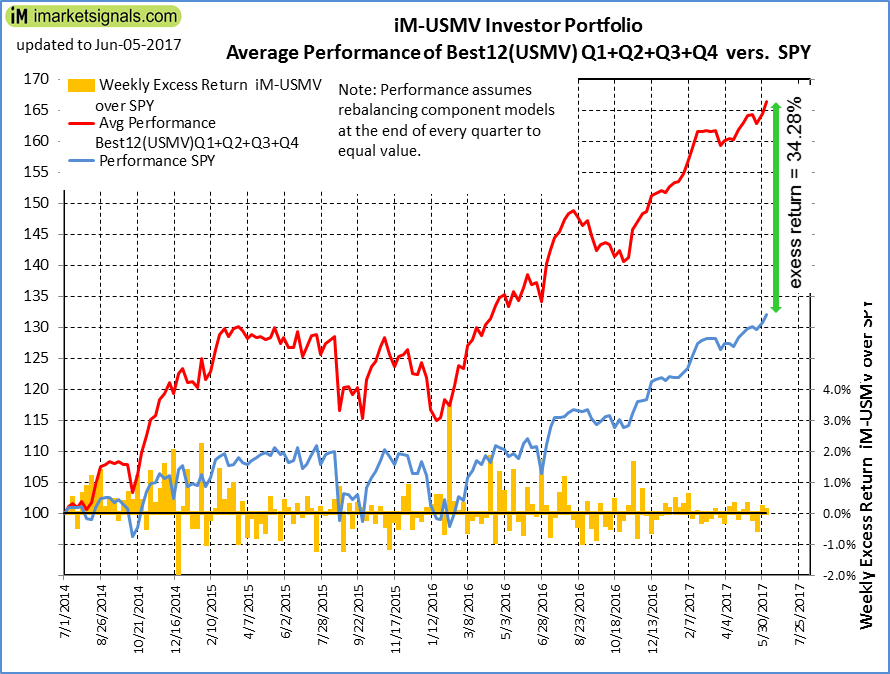 |
Average Performance of iM-Best12(USMV)Q1+Q2+Q3+Q4-Investor resulted in an excess return of 34.28% over SPY. (see iM-USMV Investor Portfolio) |
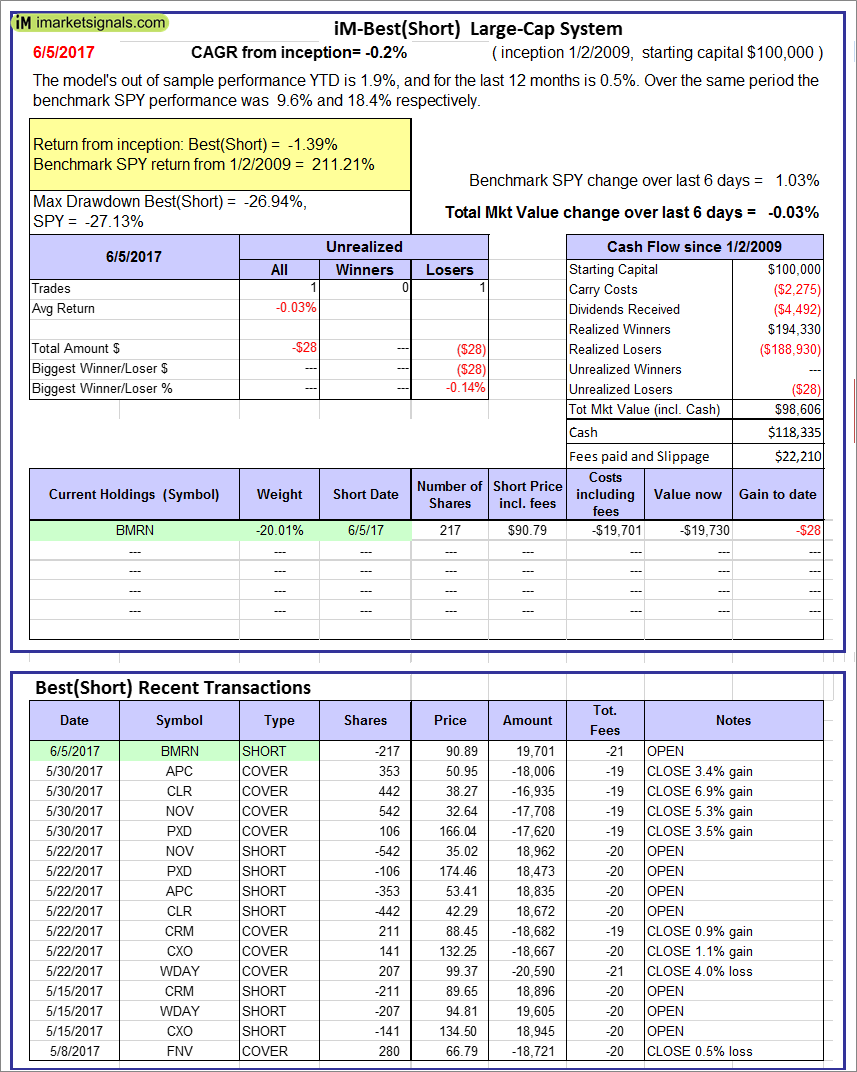 |
iM-Best(Short): The model’s out of sample performance YTD is 1.9%, and for the last 12 months is 0.5%. Over the same period the benchmark SPY performance was 9.6% and 18.4% respectively. Over the previous week the market value of iM-Best(Short) gained -0.03% at a time when SPY gained 1.03%. Over the period 1/2/2009 to 6/5/2017 the starting capital of $100,000 would have grown to $98,606 which includes $118,335 cash and excludes $22,210 spent on fees and slippage. |
iM-Best Reports – 6/6/2017
Posted in pmp SPY-SH
Leave a Reply
You must be logged in to post a comment.