
  |
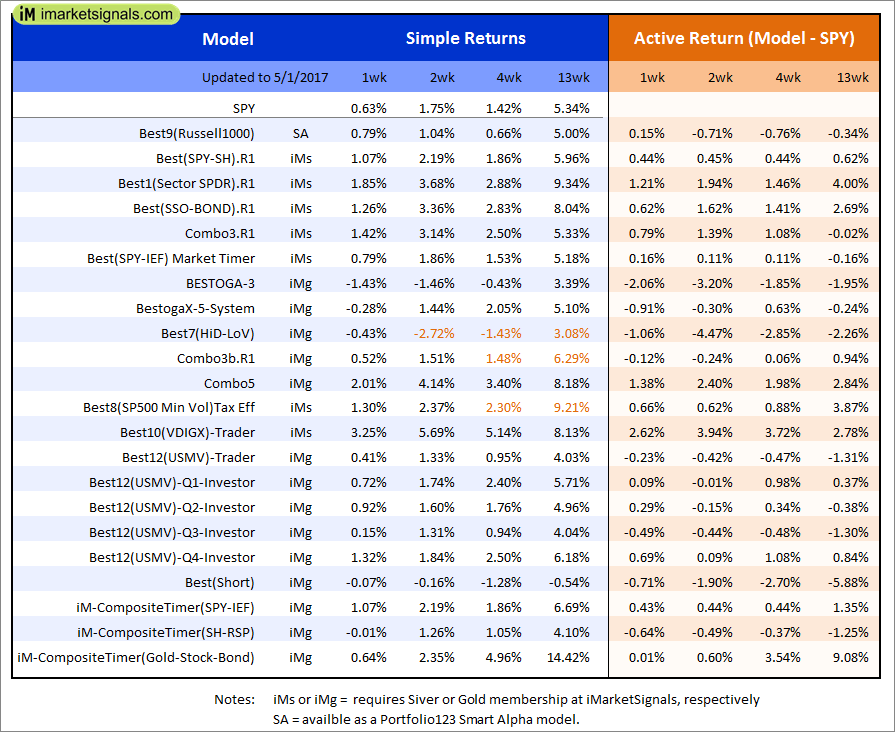
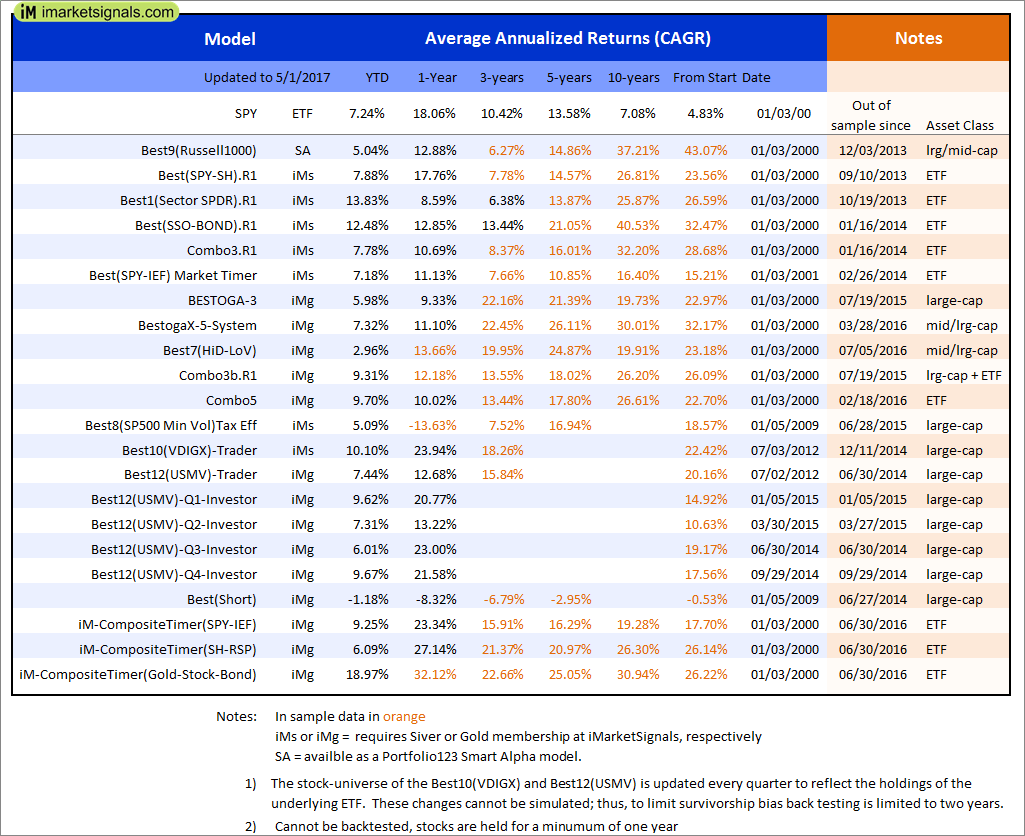
Out of sample performance summary of our models for the past 1, 2, 4 and 13 week periods. The active active return indicates how the models over- or underperformed the benchmark ETF SPY. Also the YTD, and the 1-, 3-, 5- and 10-year annualized returns are shown in the second table |
 |
iM-Best(SPY-SH).R1: The model’s out of sample performance YTD is 7.9%, and for the last 12 months is 17.8%. Over the same period the benchmark SPY performance was 7.2% and 18.1% respectively. Over the previous week the market value of Best(SPY-SH) gained 1.07% at a time when SPY gained 0.64%. A starting capital of $100,000 at inception on 1/2/2009 would have grown to $498,647 which includes $2,193 cash and excludes $15,358 spent on fees and slippage. |
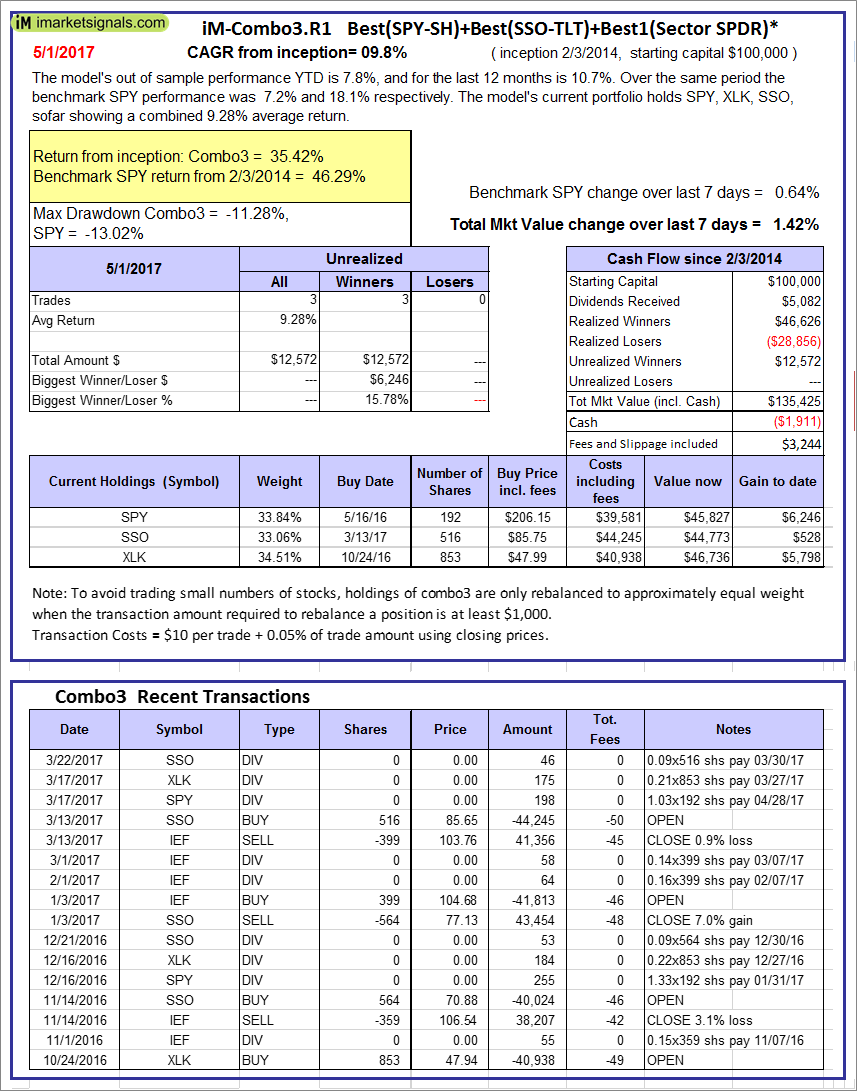 |
iM-Combo3.R1: The model’s out of sample performance YTD is 7.8%, and for the last 12 months is 10.7%. Over the same period the benchmark SPY performance was 7.2% and 18.1% respectively. Over the previous week the market value of iM-Combo3.R1 gained 1.42% at a time when SPY gained 0.64%. A starting capital of $100,000 at inception on 2/3/2014 would have grown to $135,425 which includes -$1,911 cash and excludes $3,244 spent on fees and slippage. |
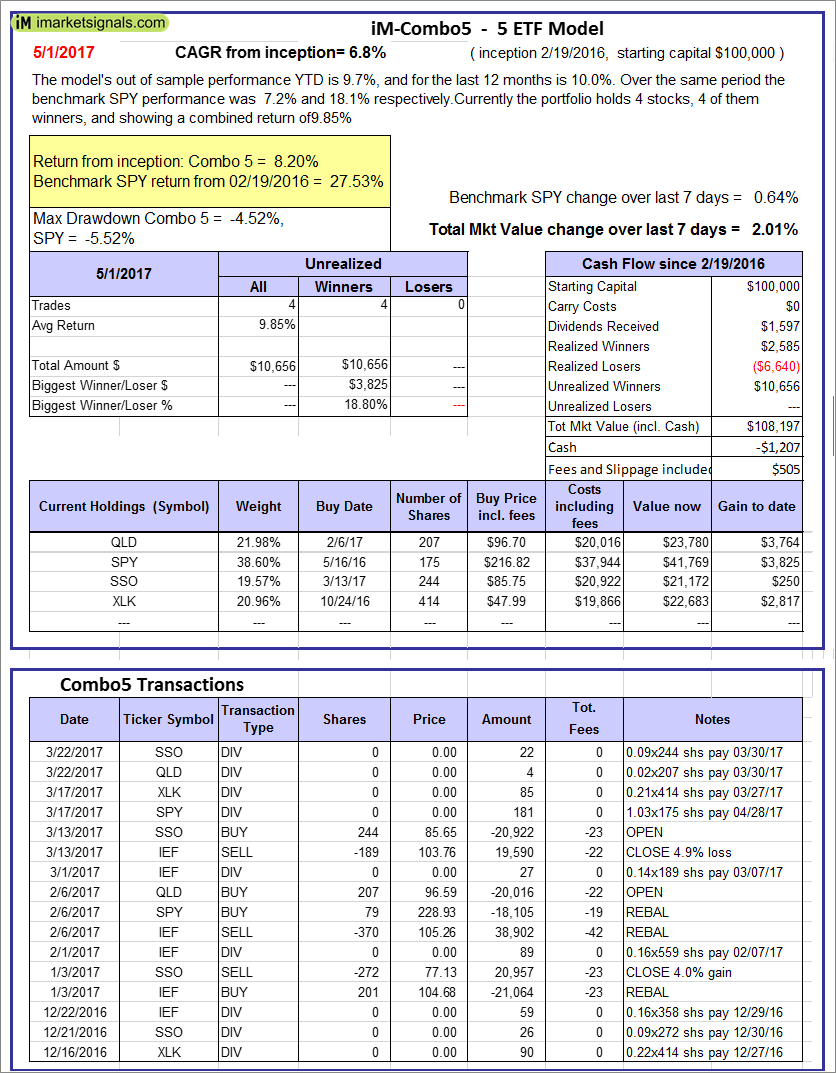 |
iM-Combo5: The model’s out of sample performance YTD is 9.7%, and for the last 12 months is 10.0%. Over the same period the benchmark SPY performance was 7.2% and 18.1% respectively. Over the previous week the market value of iM-Combo5 gained 2.01% at a time when SPY gained 0.64%. A starting capital of $100,000 at inception on 2/22/2016 would have grown to $108,197 which includes -$1,207 cash and excludes $505 spent on fees and slippage. |
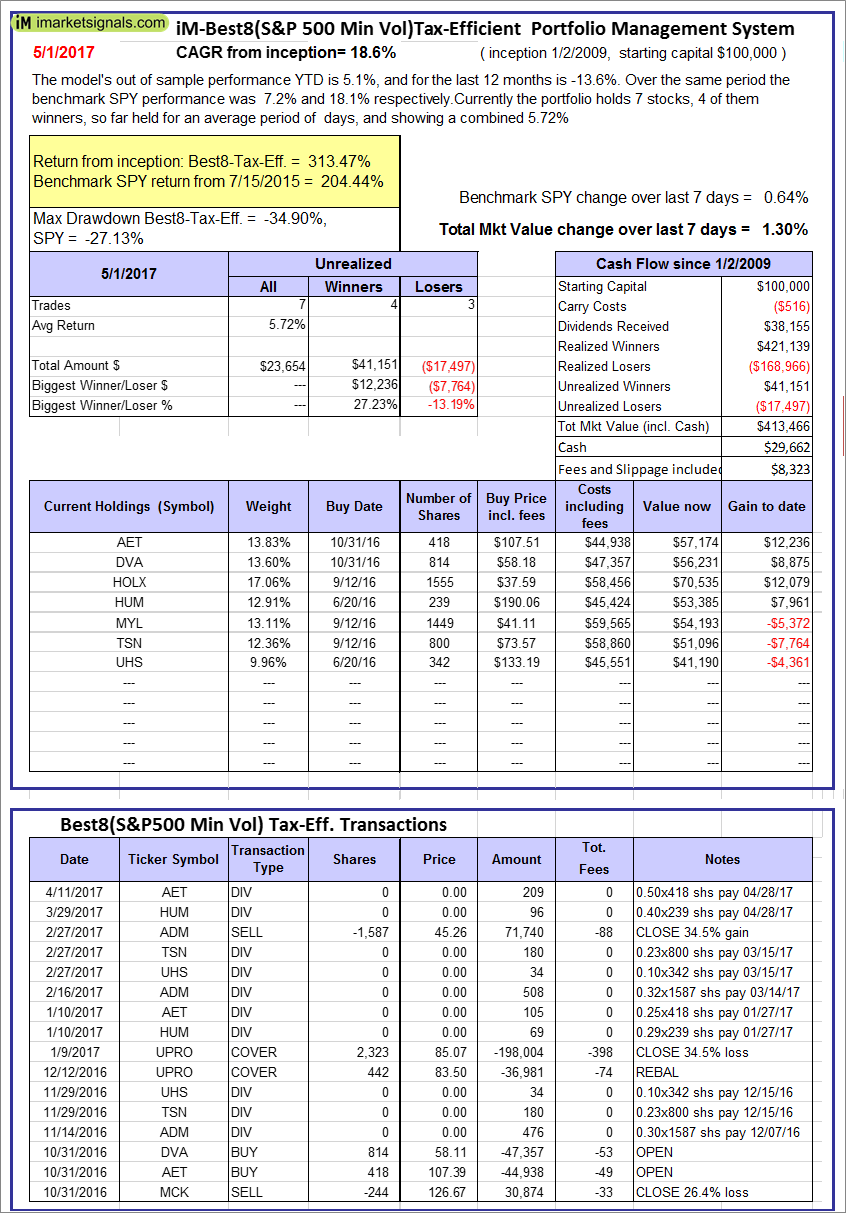 |
The iM-Best8(S&P500 Min Vol)Tax-Efficient The model’s out of sample performance YTD is 5.1%, and for the last 12 months is -13.6%. Over the same period the benchmark SPY performance was 7.2% and 18.1% respectively. Over the previous week the market value of iM-Best8(S&P 500)Tax-Eff. gained 1.30% at a time when SPY gained 0.64%. A starting capital of $100,000 at inception on 1/2/2009 would have grown to $413,466 which includes $29,662 cash and excludes $8,323 spent on fees and slippage. |
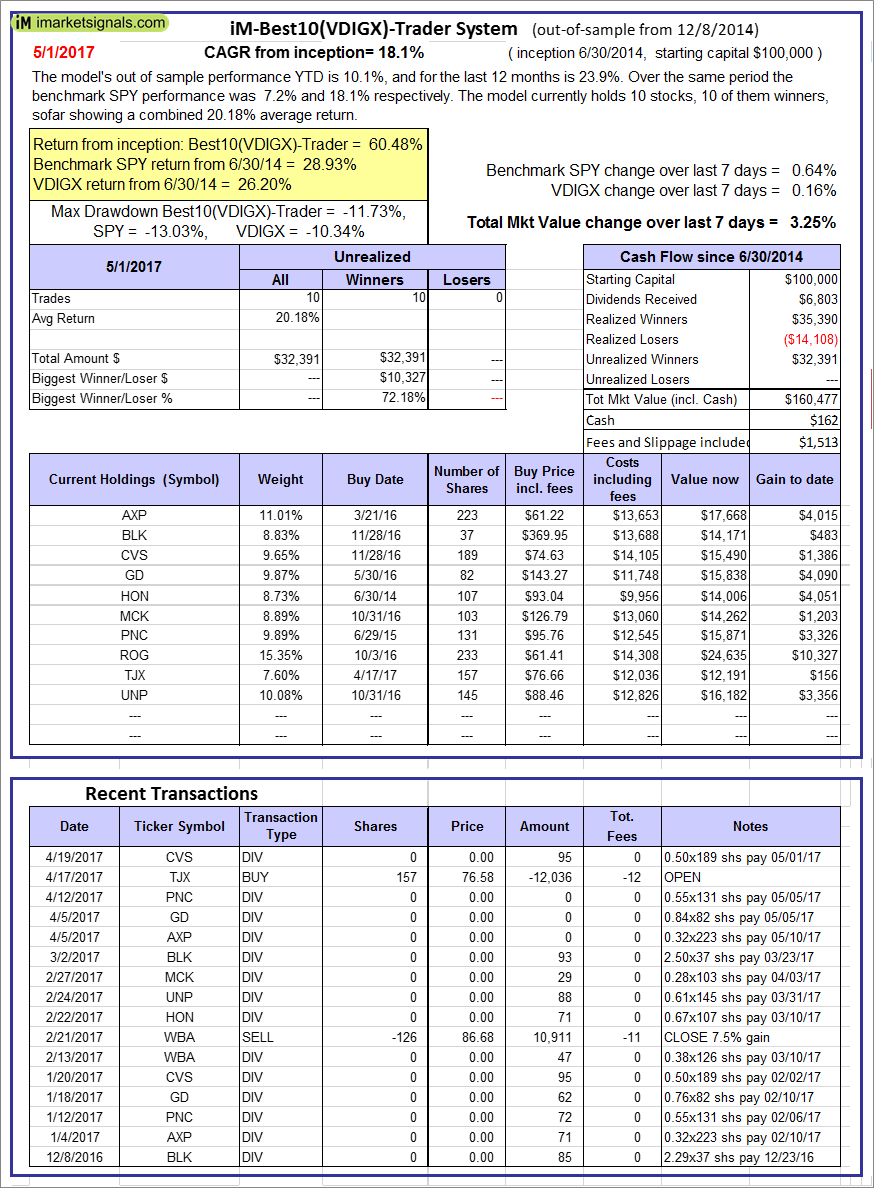 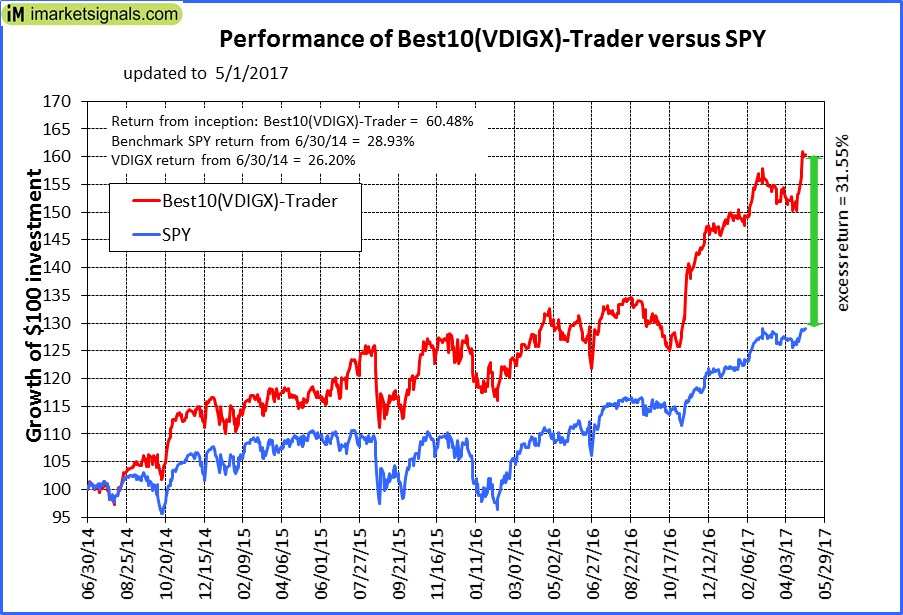 |
iM-Best10(VDIGX)-Trader: The model’s out of sample performance YTD is 10.1%, and for the last 12 months is 23.9%. Over the same period the benchmark SPY performance was 7.2% and 18.1% respectively. Since inception, on 7/1/2014, the model gained 60.48% while the benchmark SPY gained 28.93% and VDIGX gained 26.20% over the same period. Over the previous week the market value of iM-Best10(VDIGX) gained 3.25% at a time when SPY gained 0.64%. A starting capital of $100,000 at inception on 7/1/2014 would have grown to $160,477 which includes $162 cash and excludes $1,513 spent on fees and slippage. |
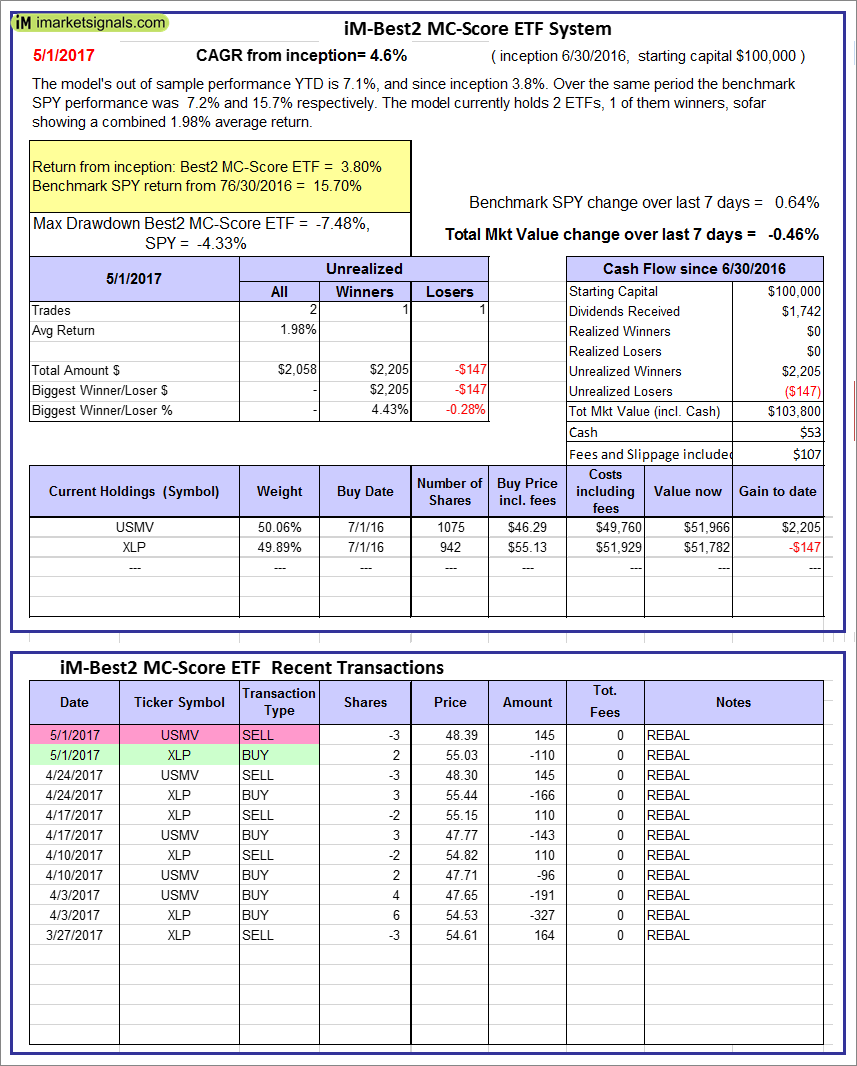 |
iM-Best2 MC-Score ETF System: The model’s out of sample performance YTD is 7.1%, and since inception 3.8%. Over the same period the benchmark SPY performance was 7.2% and 15.7% respectively. Over the previous week the market value of iM-BESTOGA-3 gained -0.46% at a time when SPY gained 0.64%. A starting capital of $100,000 at inception on 6/30/2016 would have grown to $53 which includes $107 cash and excludes Gain to date spent on fees and slippage. |
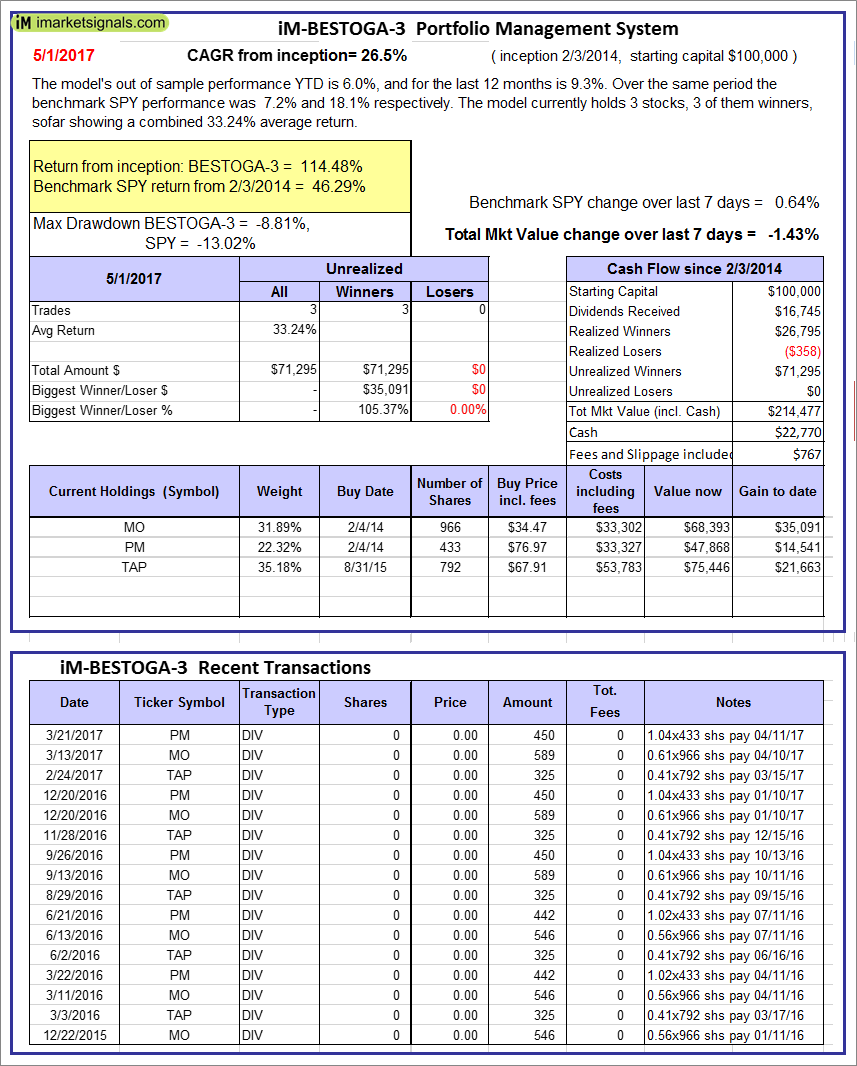 |
iM-BESTOGA-3: The model’s out of sample performance YTD is 6.0%, and for the last 12 months is 9.3%. Over the same period the benchmark SPY performance was 7.2% and 18.1% respectively. Over the previous week the market value of iM-BESTOGA-3 gained -1.43% at a time when SPY gained 0.64%. A starting capital of $100,000 at inception on 2/3/2014 would have grown to $214,477 which includes $22,770 cash and excludes $767 spent on fees and slippage. |
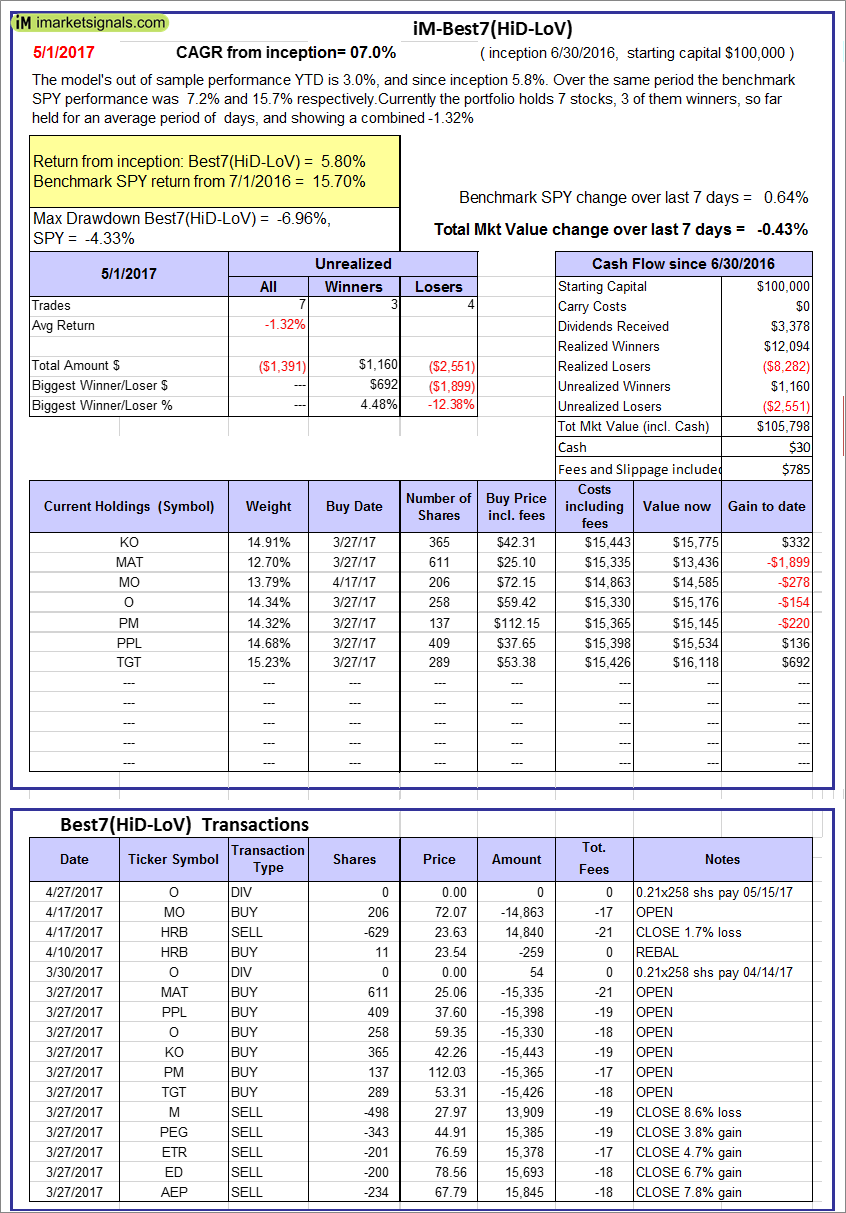 |
iM-Best7(HiD-LoV): The model’s out of sample performance YTD is 3.0%, and since inception 5.8%. Over the same period the benchmark SPY performance was 7.2% and 15.7% respectively. Over the previous week the market value of iM-BESTOGA-3 gained -0.43% at a time when SPY gained 0.64%. A starting capital of $100,000 at inception on 6/30/2016 would have grown to $105,798 which includes $30 cash and excludes $785 spent on fees and slippage. |
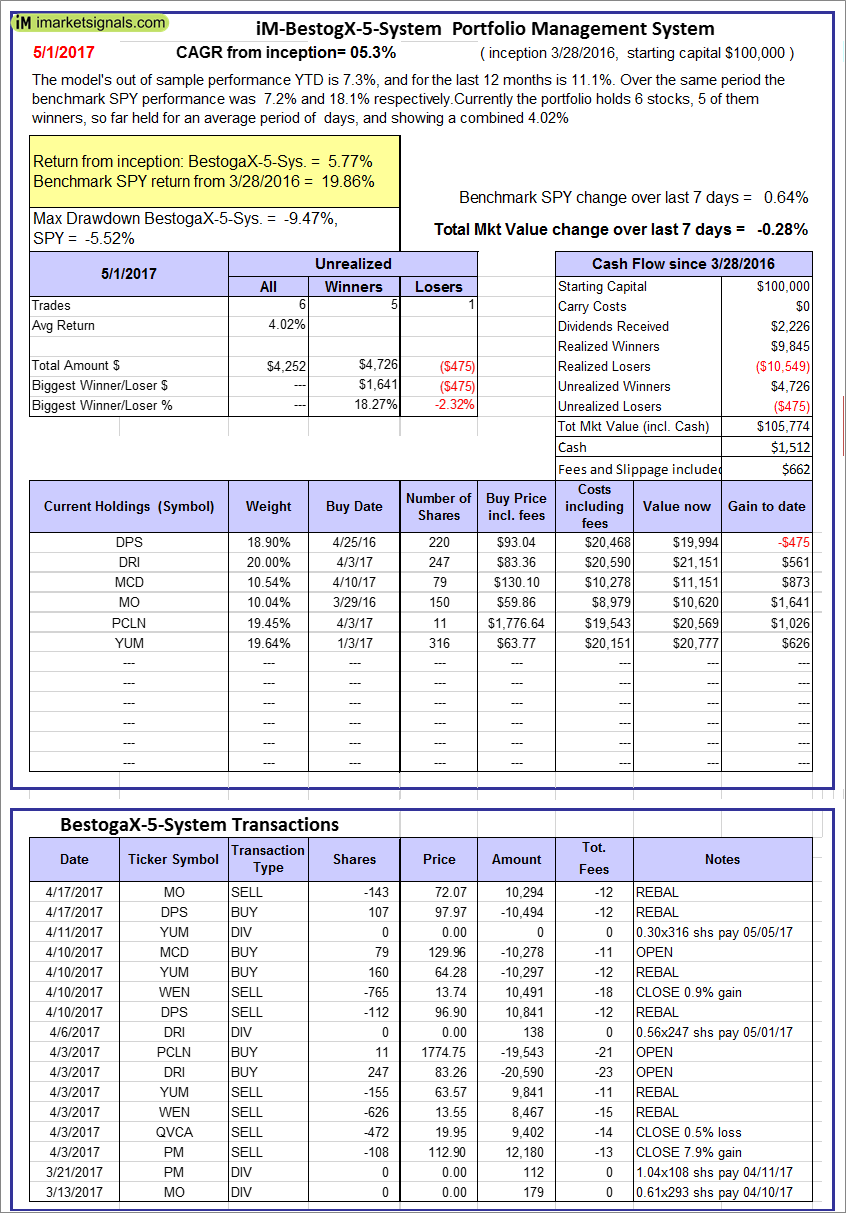 |
iM-BestogaX5-System: The model’s out of sample performance YTD is 7.3%, and for the last 12 months is 11.1%. Over the same period the benchmark SPY performance was 7.2% and 18.1% respectively. Over the previous week the market value of iM-Best8(S&P 500)Tax-Eff. gained -0.28% at a time when SPY gained 0.64%. A starting capital of $100,000 at inception on 3/28/2016 would have grown to $105,774 which includes $1,512 cash and excludes $662 spent on fees and slippage. |
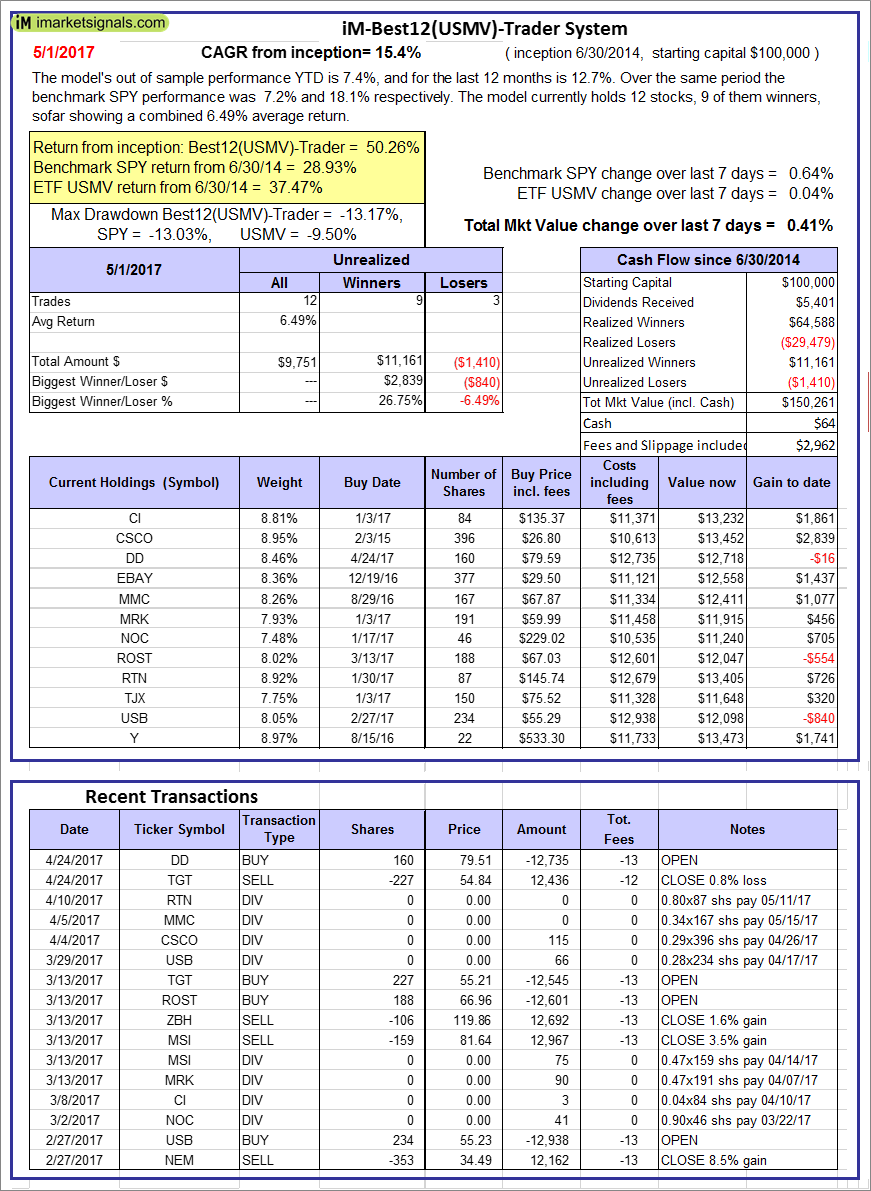 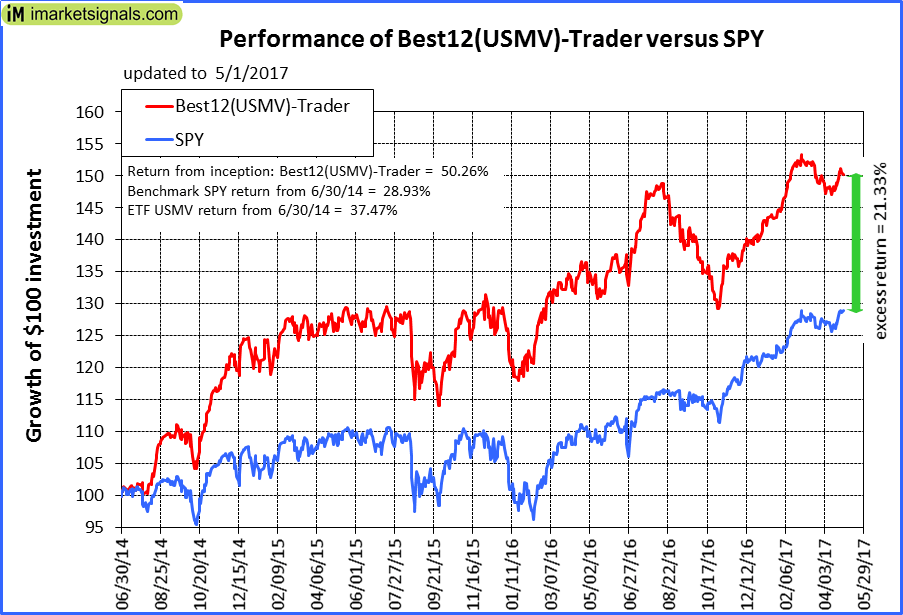 |
iM-Best12(USMV)-Trader: The model’s out of sample performance YTD is 7.4%, and for the last 12 months is 12.7%. Over the same period the benchmark SPY performance was 7.2% and 18.1% respectively. Since inception, on 7/1/2014, the model gained 50.26% while the benchmark SPY gained 28.93% and the ETF USMV gained 37.47% over the same period. Over the previous week the market value of iM-Best12(USMV)-Trader gained 0.41% at a time when SPY gained 0.64%. A starting capital of $100,000 at inception on 7/1/2014 would have grown to $150,261 which includes $64 cash and excludes $2,962 spent on fees and slippage. |
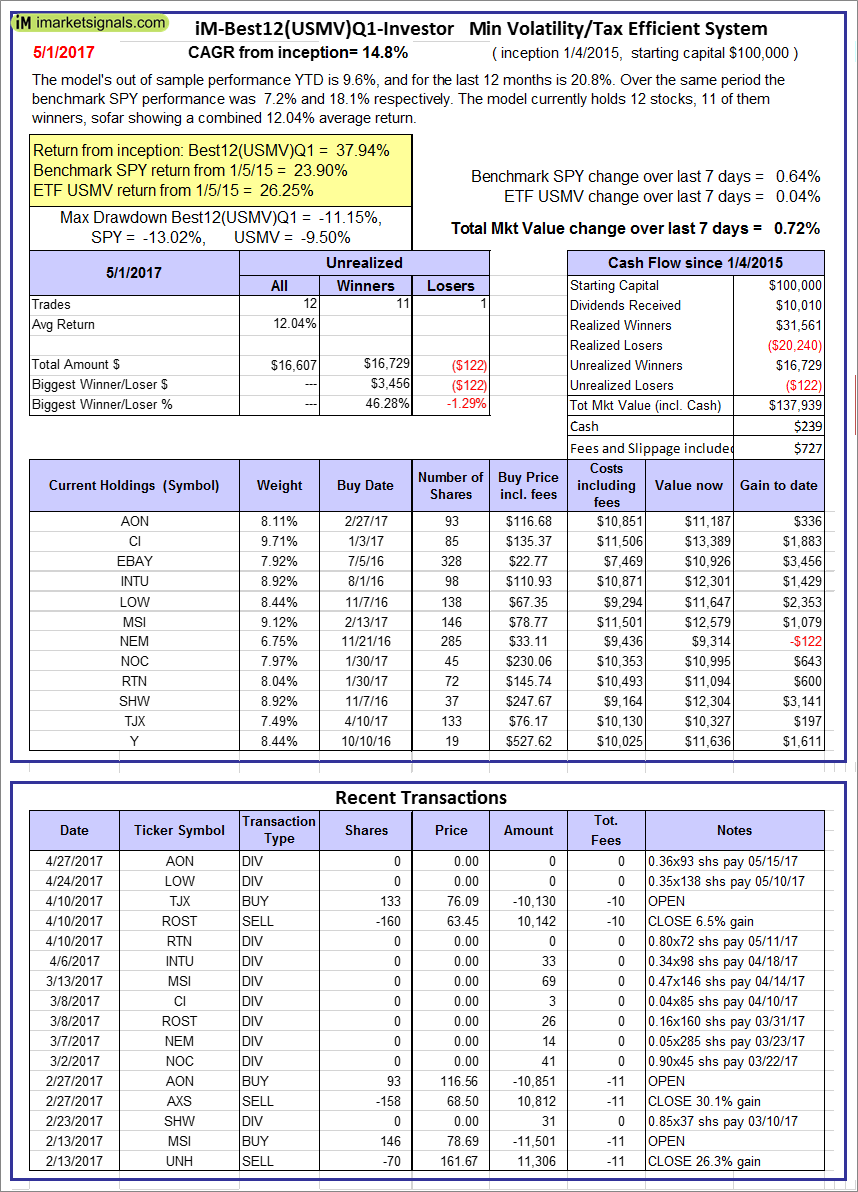 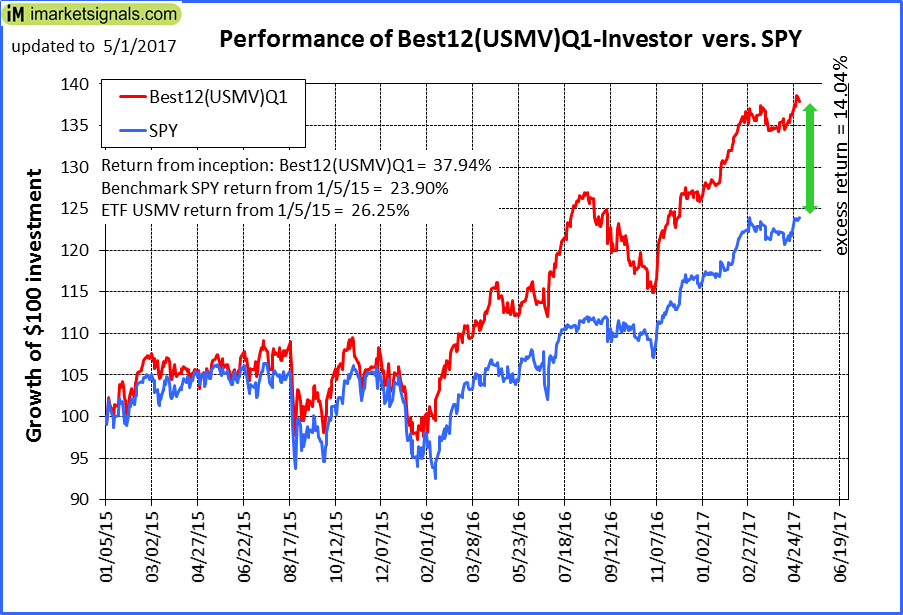 |
iM-Best12(USMV)Q1-Investor: The model’s out of sample performance YTD is 9.6%, and for the last 12 months is 20.8%. Over the same period the benchmark SPY performance was 7.2% and 18.1% respectively. Since inception, on 1/5/2015, the model gained 37.94% while the benchmark SPY gained 23.90% and the ETF USMV gained 26.25% over the same period. Over the previous week the market value of iM-Best12(USMV)Q1 gained 0.72% at a time when SPY gained 0.64%. A starting capital of $100,000 at inception on 1/5/2015 would have grown to $137,939 which includes $239 cash and excludes $727 spent on fees and slippage. |
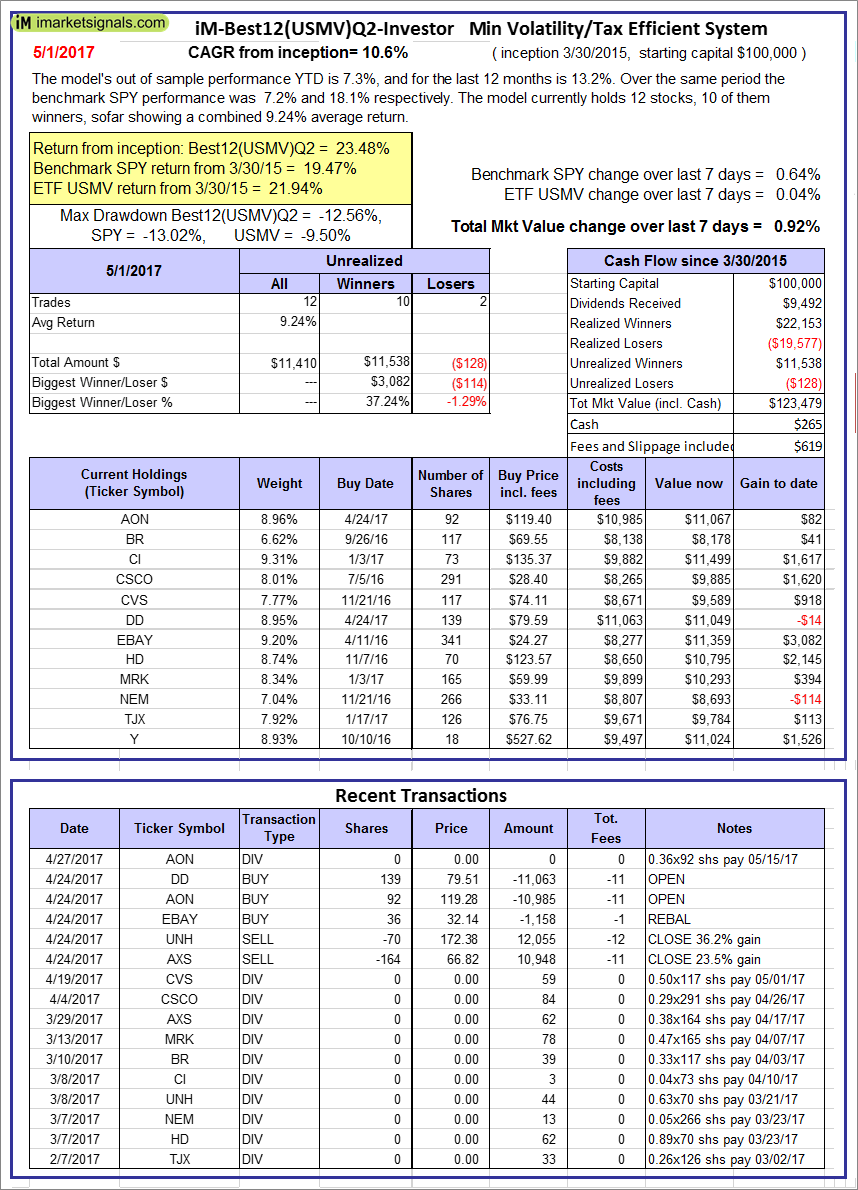 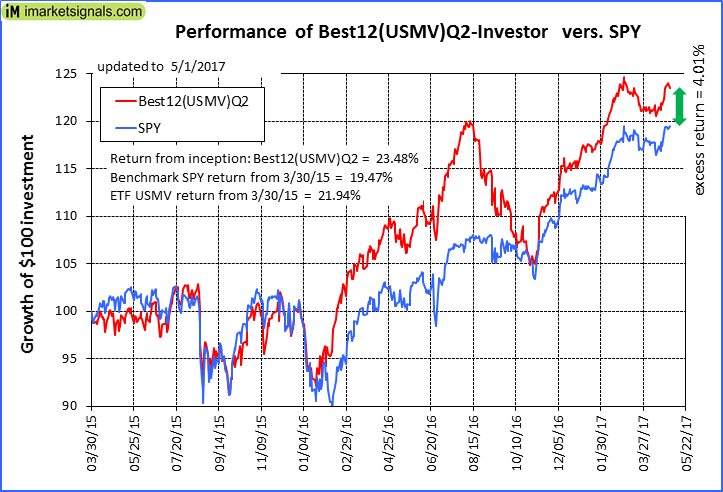 |
iM-Best12(USMV)Q2-Investor: The model’s out of sample performance YTD is 7.3%, and for the last 12 months is 13.2%. Over the same period the benchmark SPY performance was 7.2% and 18.1% respectively. Since inception, on 3/31/2015, the model gained 23.48% while the benchmark SPY gained 19.47% and the ETF USMV gained 21.94% over the same period. Over the previous week the market value of iM-Best12(USMV)Q2 gained 0.92% at a time when SPY gained 0.64%. A starting capital of $100,000 at inception on 3/31/2015 would have grown to $123,479 which includes $265 cash and excludes $619 spent on fees and slippage. |
 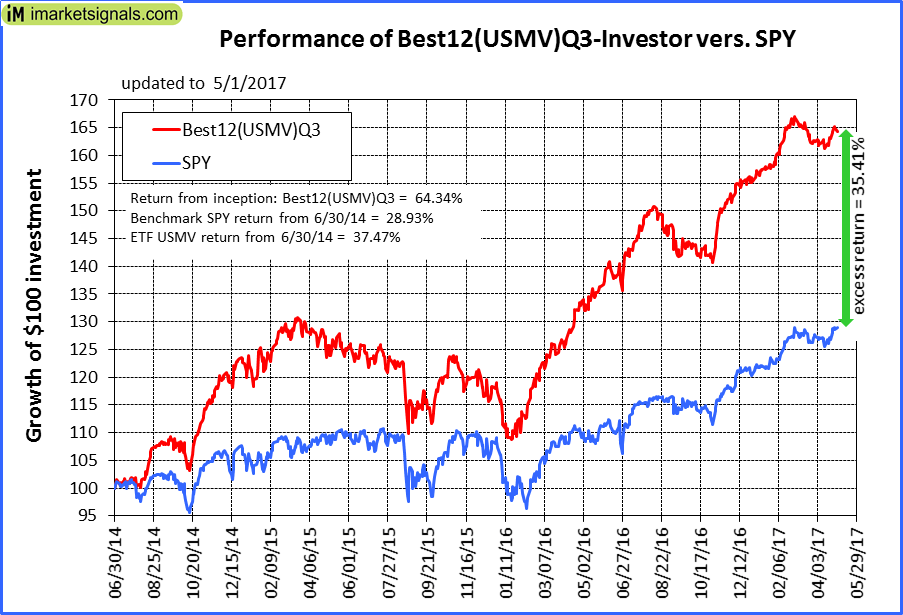 |
iM-Best12(USMV)Q3-Investor: The model’s out of sample performance YTD is 6.0%, and for the last 12 months is 23.0%. Over the same period the benchmark SPY performance was 7.2% and 18.1% respectively. Since inception, on 7/1/2014, the model gained 64.34% while the benchmark SPY gained 28.93% and the ETF USMV gained 37.47% over the same period. Over the previous week the market value of iM-Best12(USMV)Q3 gained 0.15% at a time when SPY gained 0.64%. A starting capital of $100,000 at inception on 7/1/2014 would have grown to $164,344 which includes $581 cash and excludes $972 spent on fees and slippage. |
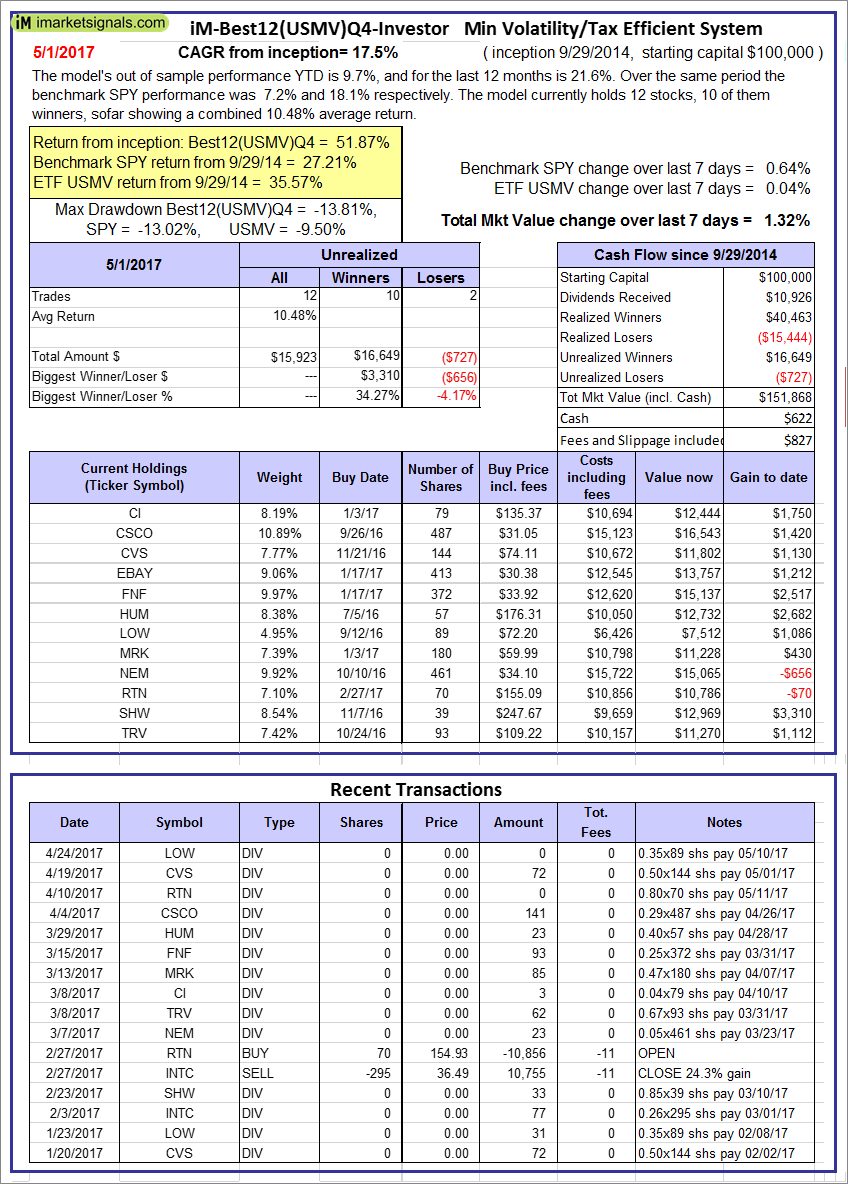 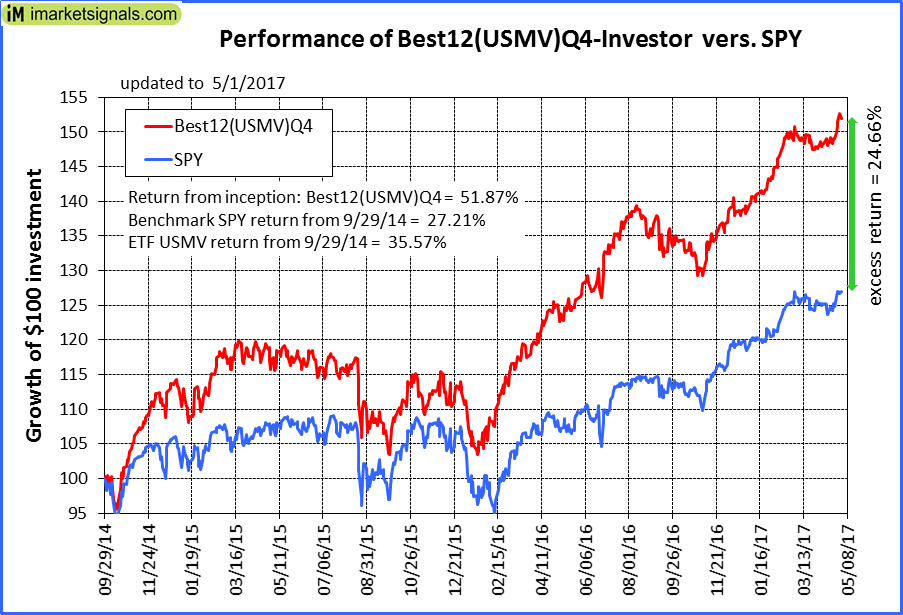 |
iM-Best12(USMV)Q4-Investor: Since inception, on 9/30/2014, the model gained 51.87% while the benchmark SPY gained 27.21% and the ETF USMV gained 35.57% over the same period. Over the previous week the market value of iM-Best12(USMV)Q4 gained 1.32% at a time when SPY gained 0.64%. A starting capital of $100,000 at inception on 9/30/2014 would have grown to $151,868 which includes $622 cash and excludes $827 spent on fees and slippage. |
 |
Average Performance of iM-Best12(USMV)Q1+Q2+Q3+Q4-Investor resulted in an excess return of 33.81% over SPY. (see iM-USMV Investor Portfolio) |
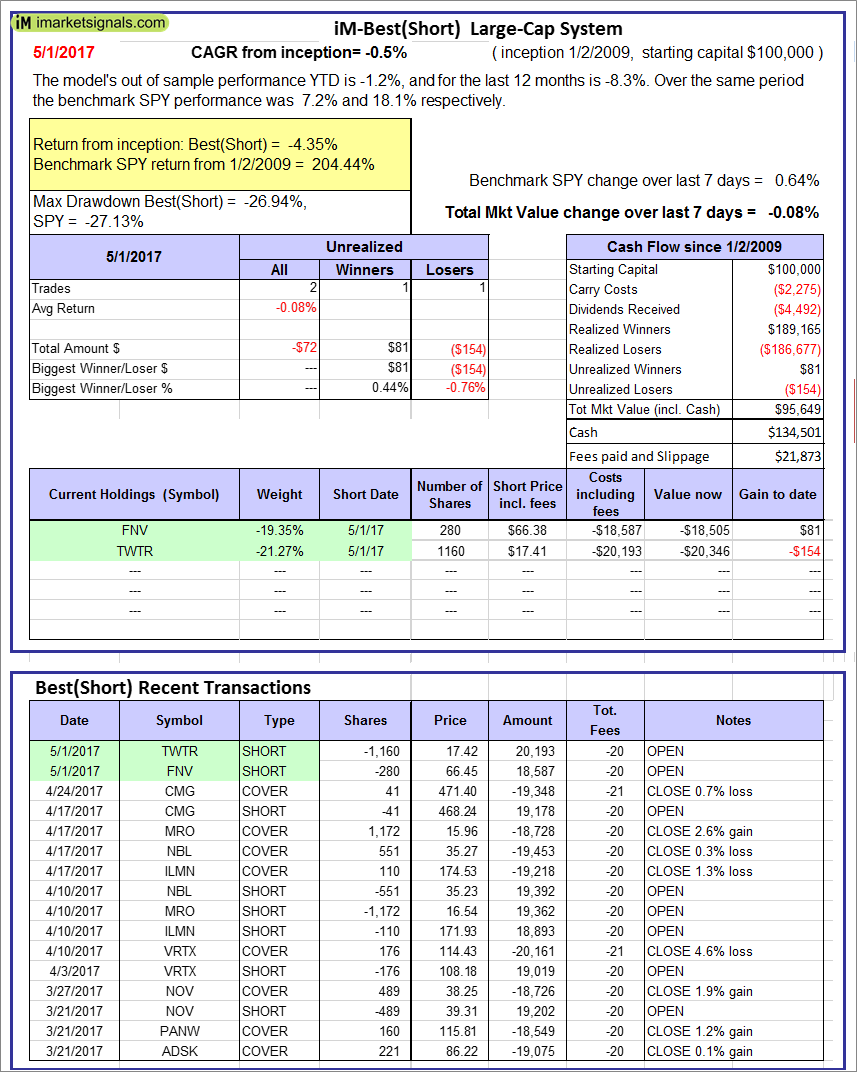 |
iM-Best(Short): The model’s out of sample performance YTD is -1.2%, and for the last 12 months is -8.3%. Over the same period the benchmark SPY performance was 7.2% and 18.1% respectively. Over the previous week the market value of iM-Best(Short) gained -0.08% at a time when SPY gained 0.64%. Over the period 1/2/2009 to 5/1/2017 the starting capital of $100,000 would have grown to $95,649 which includes $134,501 cash and excludes $21,873 spent on fees and slippage. |
iM-Best Reports – 5/1/2017
Posted in pmp SPY-SH
Leave a Reply
You must be logged in to post a comment.