
  |
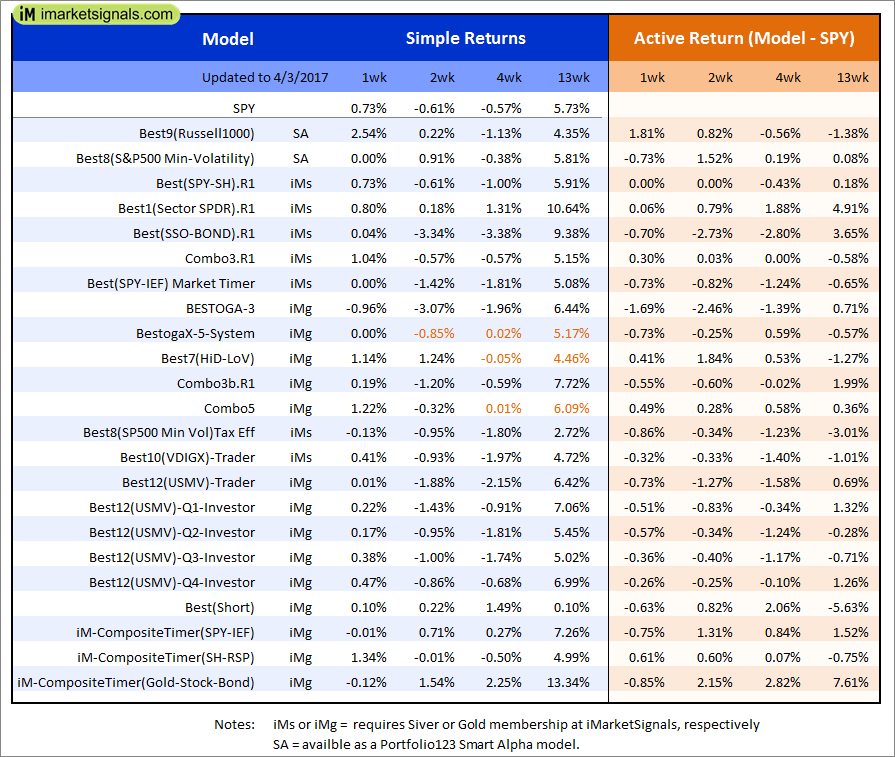
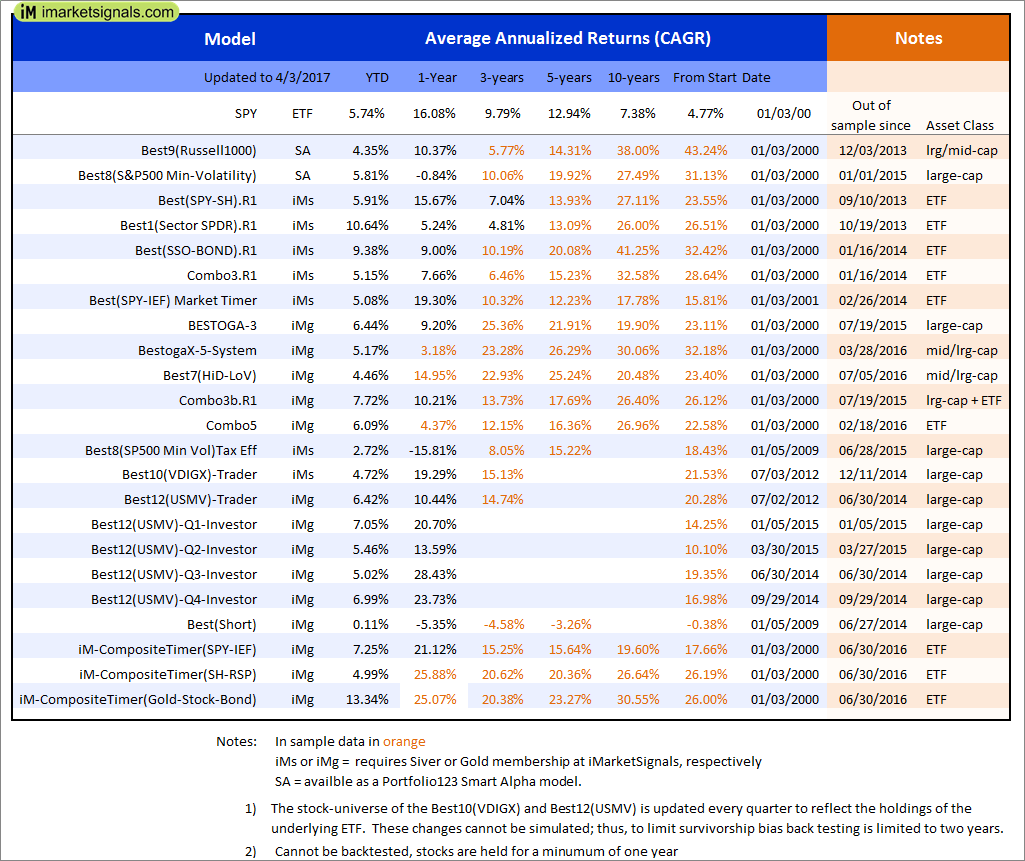
Out of sample performance summary of our models for the past 1, 2, 4 and 13 week periods. The active active return indicates how the models over- or underperformed the benchmark ETF SPY. Also the YTD, and the 1-, 3-, 5- and 10-year annualized returns are shown in the second table |
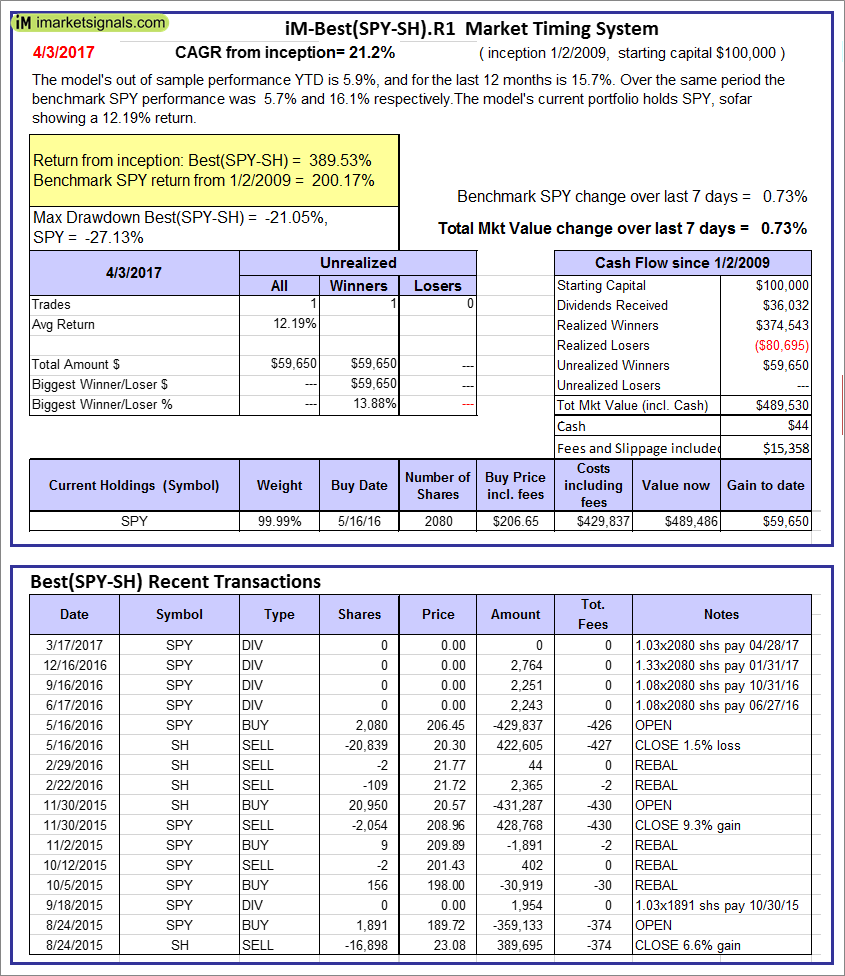 |
iM-Best(SPY-SH).R1: The model’s out of sample performance YTD is 5.9%, and for the last 12 months is 15.7%. Over the same period the benchmark SPY performance was 5.7% and 16.1% respectively. Over the previous week the market value of Best(SPY-SH) gained 0.73% at a time when SPY gained 0.73%. A starting capital of $100,000 at inception on 1/2/2009 would have grown to $489,530 which includes $44 cash and excludes $15,358 spent on fees and slippage. |
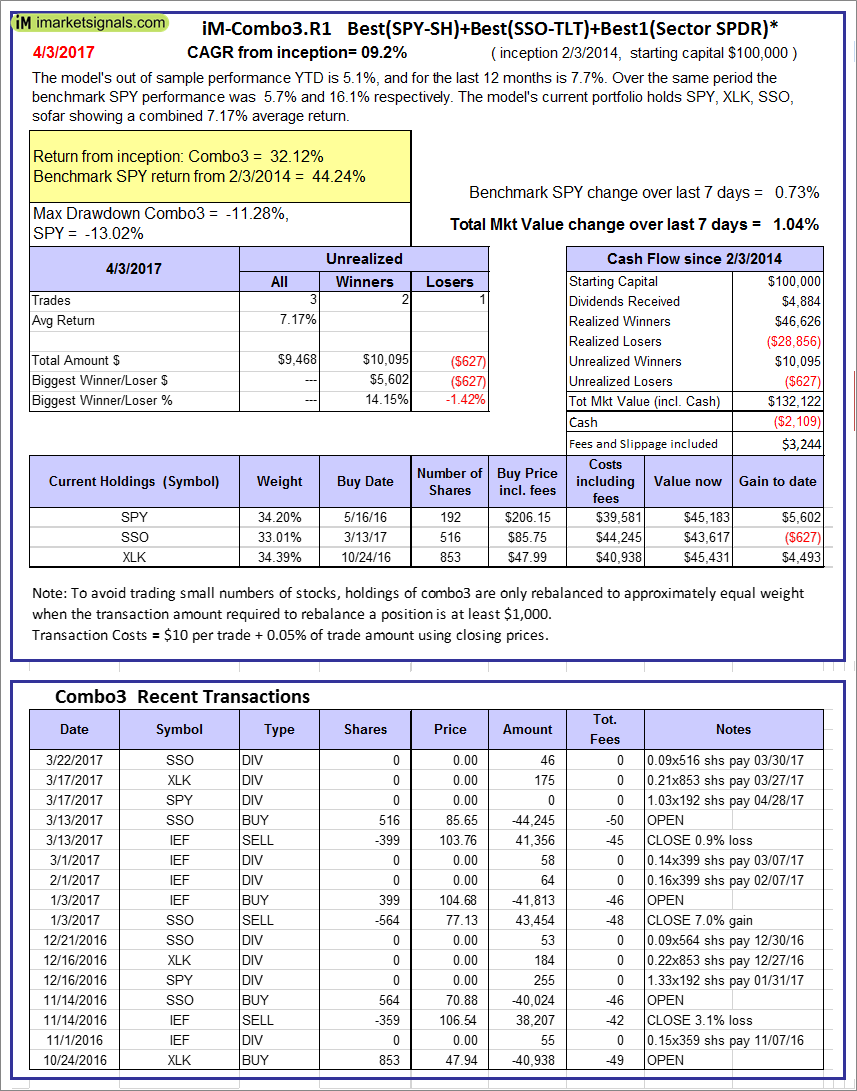 |
iM-Combo3.R1: The model’s out of sample performance YTD is 5.1%, and for the last 12 months is 7.7%. Over the same period the benchmark SPY performance was 5.7% and 16.1% respectively. Over the previous week the market value of iM-Combo3.R1 gained 1.04% at a time when SPY gained 0.73%. A starting capital of $100,000 at inception on 2/3/2014 would have grown to $132,122 which includes -$2,109 cash and excludes $3,244 spent on fees and slippage. |
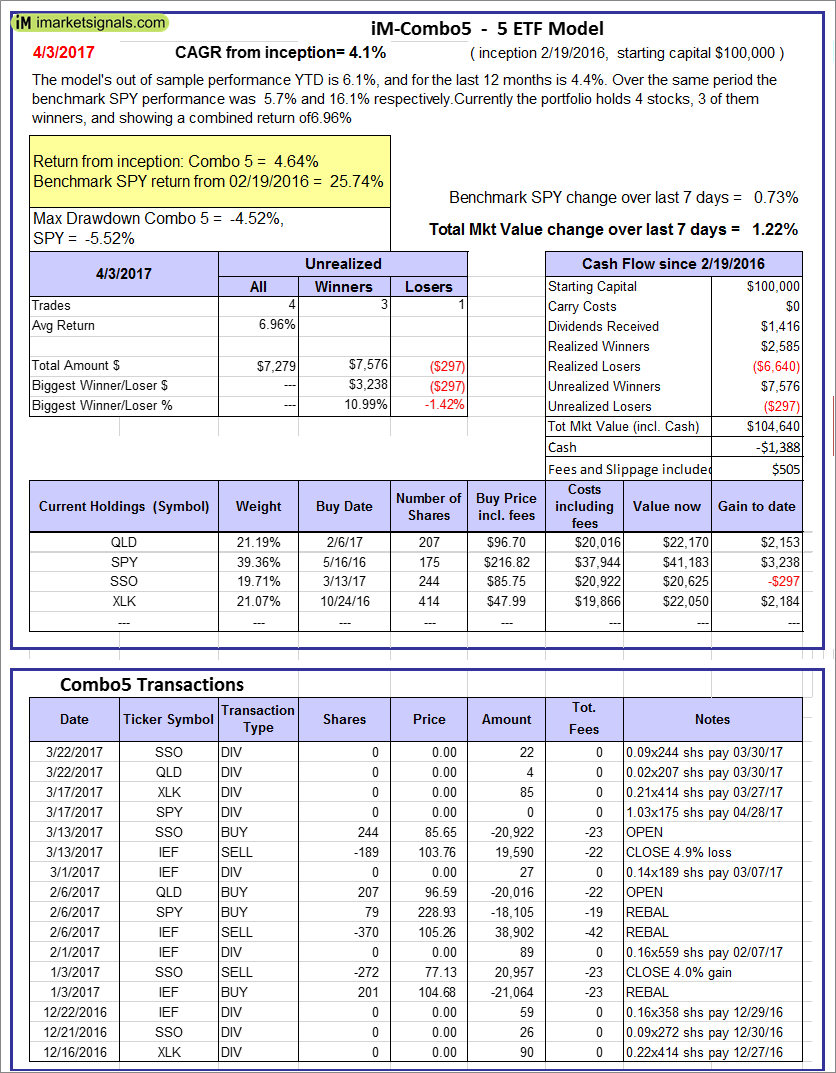 |
iM-Combo5: The model’s out of sample performance YTD is 6.1%, and for the last 12 months is 4.4%. Over the same period the benchmark SPY performance was 5.7% and 16.1% respectively. Over the previous week the market value of iM-Combo5 gained 1.22% at a time when SPY gained 0.73%. A starting capital of $100,000 at inception on 2/22/2016 would have grown to $104,640 which includes -$1,388 cash and excludes $505 spent on fees and slippage. |
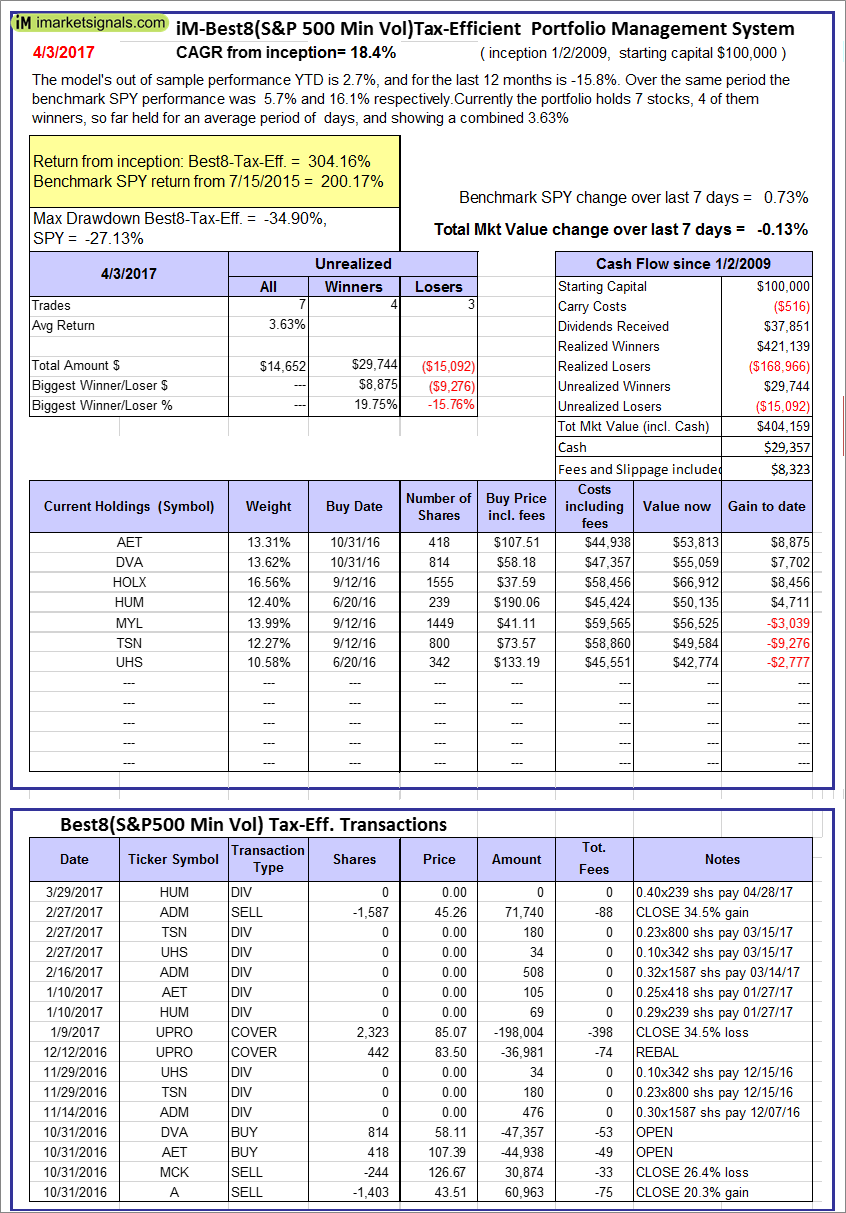 |
The iM-Best8(S&P500 Min Vol)Tax-Efficient The model’s out of sample performance YTD is 2.7%, and for the last 12 months is -15.8%. Over the same period the benchmark SPY performance was 5.7% and 16.1% respectively. Over the previous week the market value of iM-Best8(S&P 500)Tax-Eff. gained -0.13% at a time when SPY gained 0.73%. A starting capital of $100,000 at inception on 1/2/2009 would have grown to $404,159 which includes $29,357 cash and excludes $8,323 spent on fees and slippage. |
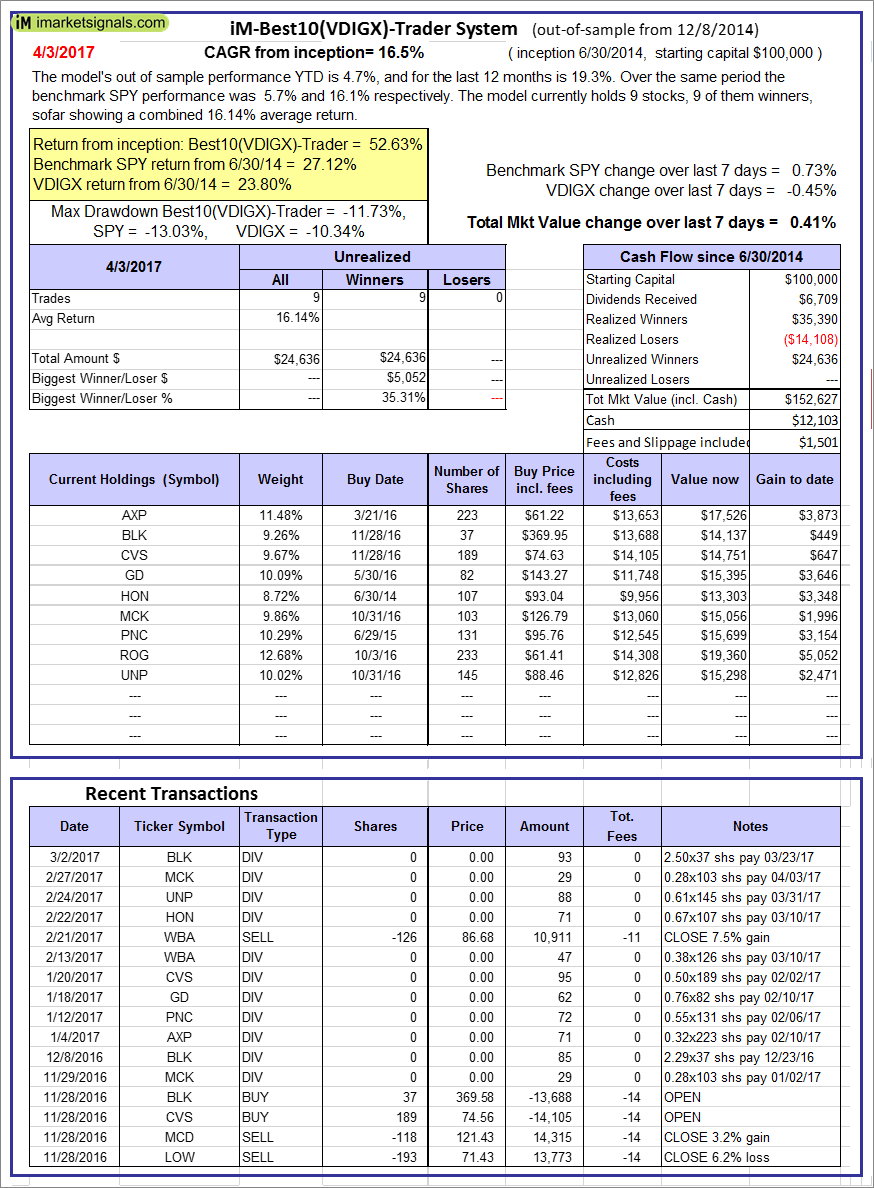 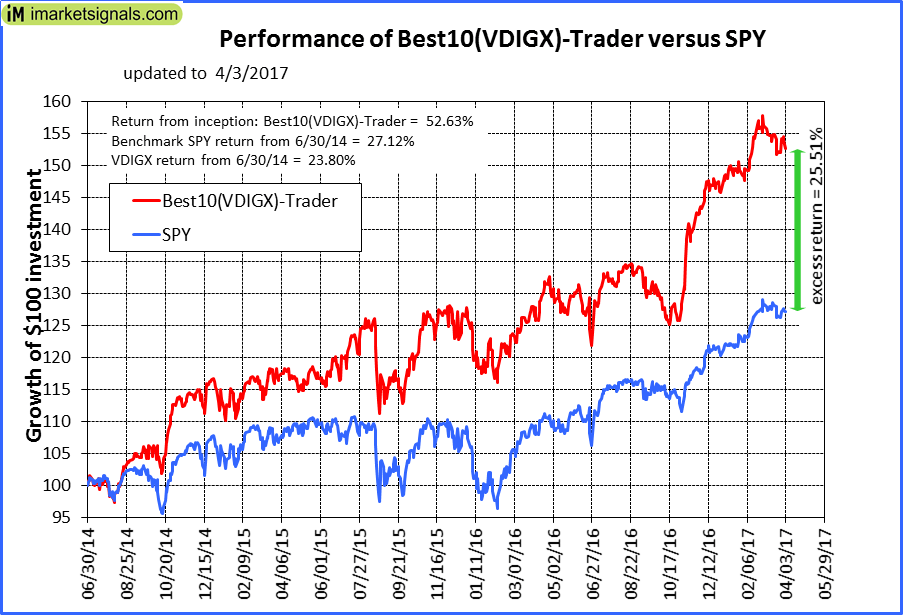 |
iM-Best10(VDIGX)-Trader: The model’s out of sample performance YTD is 4.7%, and for the last 12 months is 19.3%. Over the same period the benchmark SPY performance was 5.7% and 16.1% respectively. Since inception, on 7/1/2014, the model gained 52.63% while the benchmark SPY gained 27.12% and VDIGX gained 23.80% over the same period. Over the previous week the market value of iM-Best10(VDIGX) gained 0.41% at a time when SPY gained 0.73%. A starting capital of $100,000 at inception on 7/1/2014 would have grown to $152,627 which includes $12,103 cash and excludes $1,501 spent on fees and slippage. |
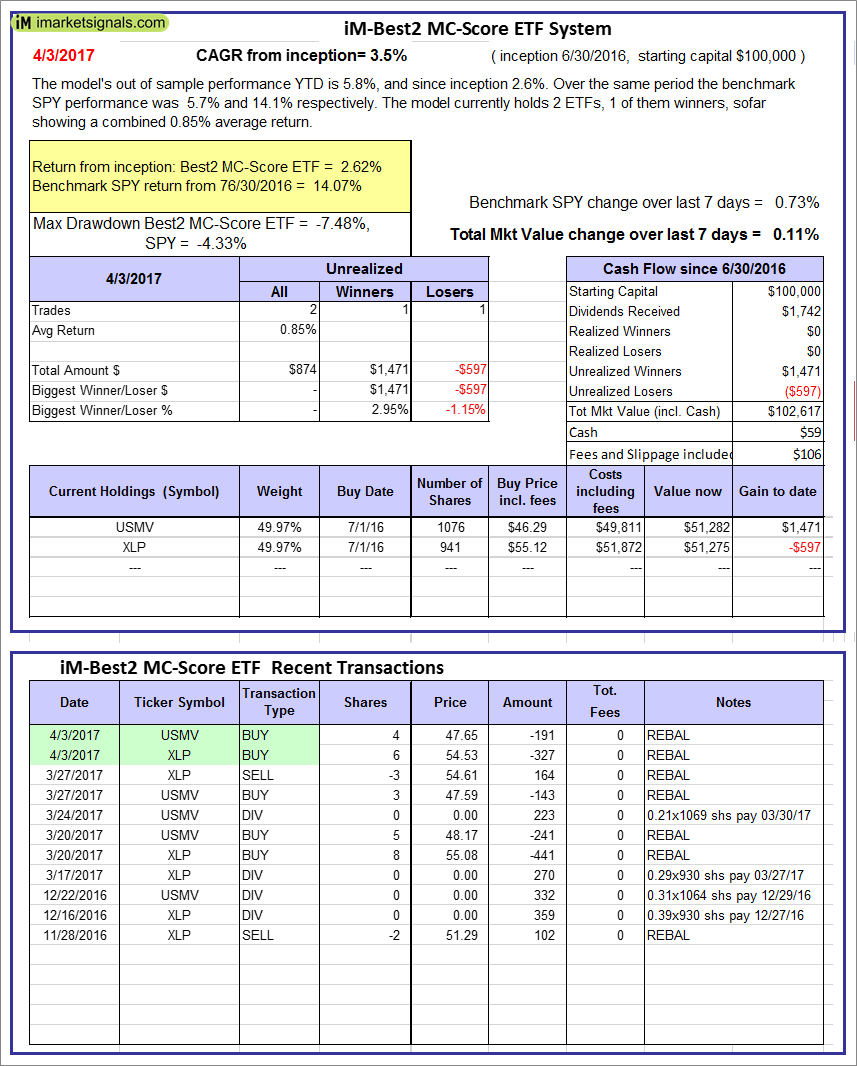 |
iM-Best2 MC-Score ETF System: The model’s out of sample performance YTD is 5.8%, and since inception 2.6%. Over the same period the benchmark SPY performance was 5.7% and 14.1% respectively. Over the previous week the market value of iM-BESTOGA-3 gained 0.11% at a time when SPY gained 0.73%. A starting capital of $100,000 at inception on 6/30/2016 would have grown to $59 which includes $106 cash and excludes Gain to date spent on fees and slippage. |
 |
iM-BESTOGA-3: The model’s out of sample performance YTD is 6.4%, and for the last 12 months is 9.2%. Over the same period the benchmark SPY performance was 5.7% and 16.1% respectively. Over the previous week the market value of iM-BESTOGA-3 gained -0.96% at a time when SPY gained 0.73%. A starting capital of $100,000 at inception on 2/3/2014 would have grown to $215,410 which includes $21,730 cash and excludes $767 spent on fees and slippage. |
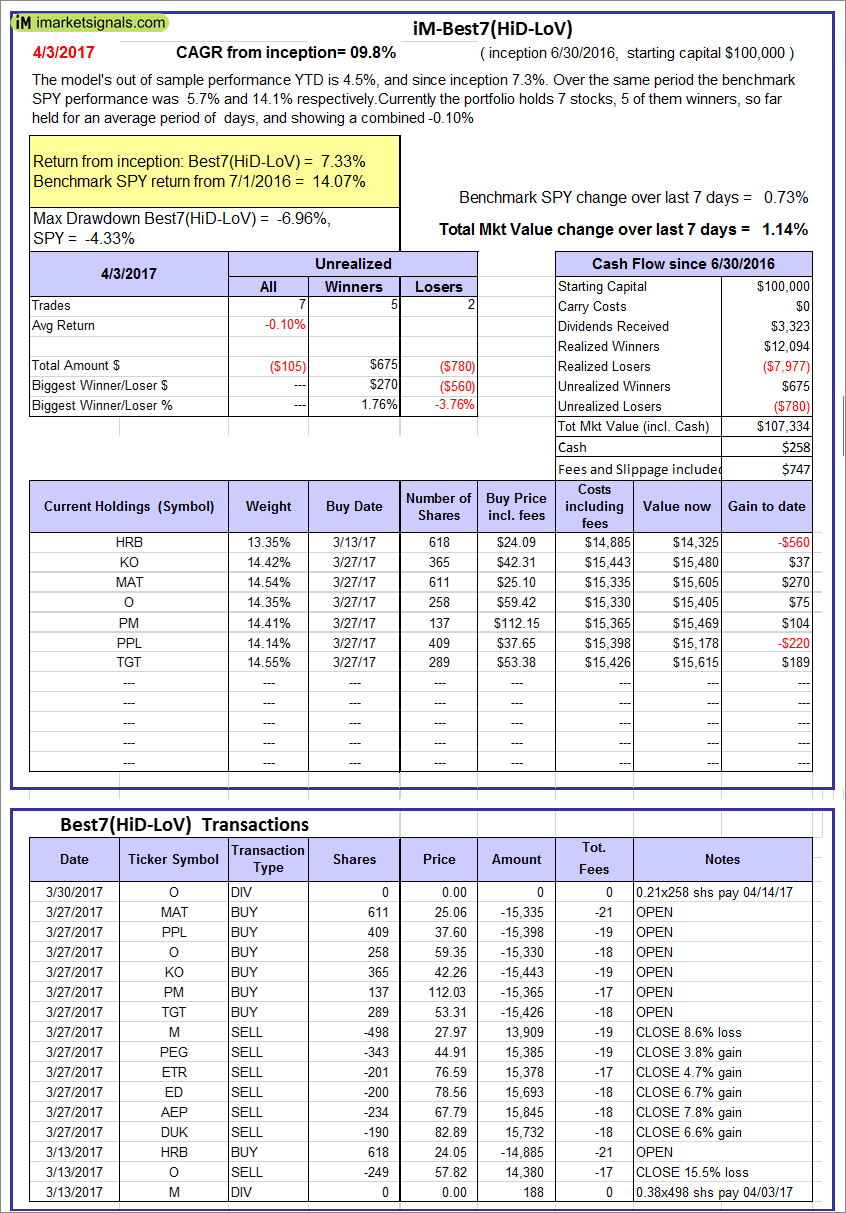 |
iM-Best7(HiD-LoV): The model’s out of sample performance YTD is 4.5%, and since inception 7.3%. Over the same period the benchmark SPY performance was 5.7% and 14.1% respectively. Over the previous week the market value of iM-BESTOGA-3 gained 1.14% at a time when SPY gained 0.73%. A starting capital of $100,000 at inception on 6/30/2016 would have grown to $107,334 which includes $258 cash and excludes $747 spent on fees and slippage. |
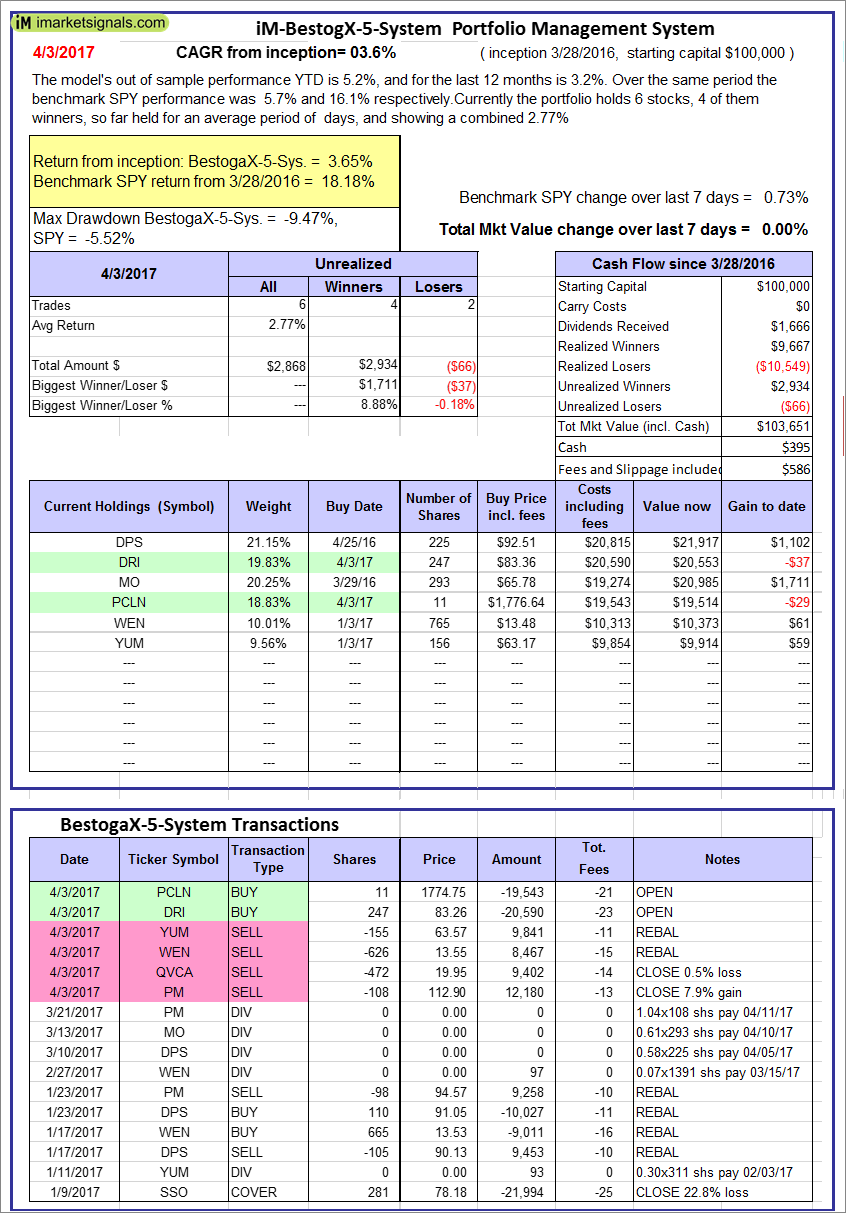 |
iM-BestogaX5-System: The model’s out of sample performance YTD is 5.2%, and for the last 12 months is 3.2%. Over the same period the benchmark SPY performance was 5.7% and 16.1% respectively. Over the previous week the market value of iM-Best8(S&P 500)Tax-Eff. gained 0.00% at a time when SPY gained 0.73%. A starting capital of $100,000 at inception on 3/28/2016 would have grown to $103,651 which includes $395 cash and excludes $586 spent on fees and slippage. |
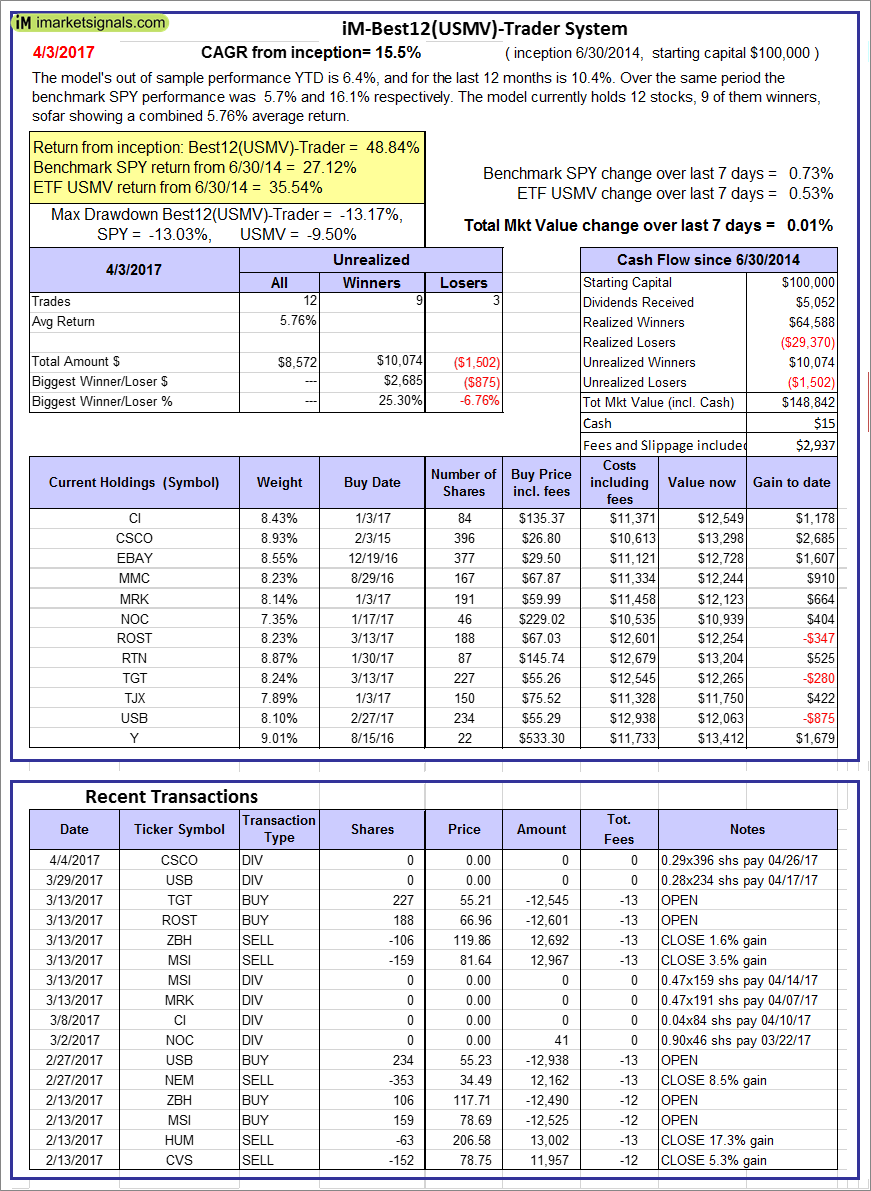 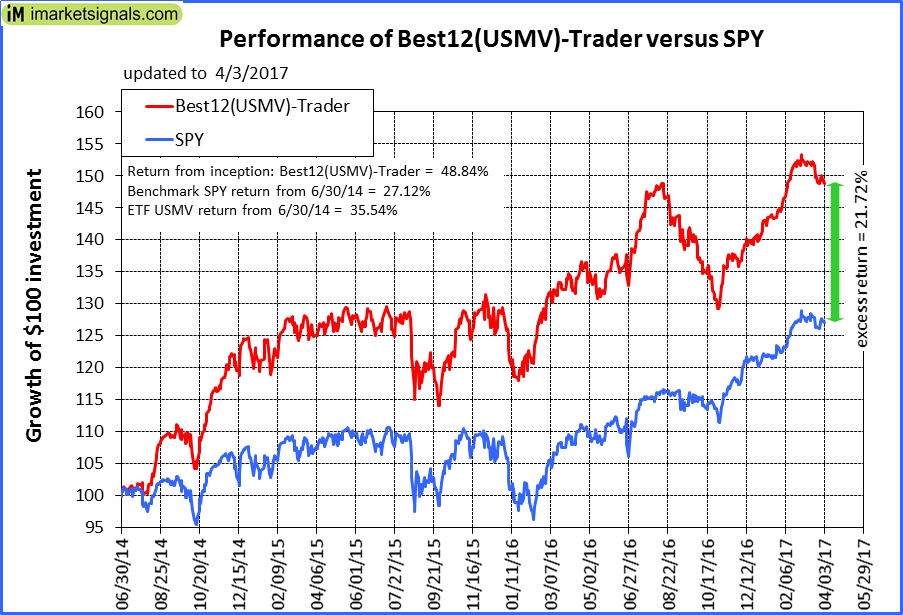 |
iM-Best12(USMV)-Trader: The model’s out of sample performance YTD is 6.4%, and for the last 12 months is 10.4%. Over the same period the benchmark SPY performance was 5.7% and 16.1% respectively. Since inception, on 7/1/2014, the model gained 48.84% while the benchmark SPY gained 27.12% and the ETF USMV gained 35.54% over the same period. Over the previous week the market value of iM-Best12(USMV)-Trader gained 0.01% at a time when SPY gained 0.73%. A starting capital of $100,000 at inception on 7/1/2014 would have grown to $148,842 which includes $15 cash and excludes $2,937 spent on fees and slippage. |
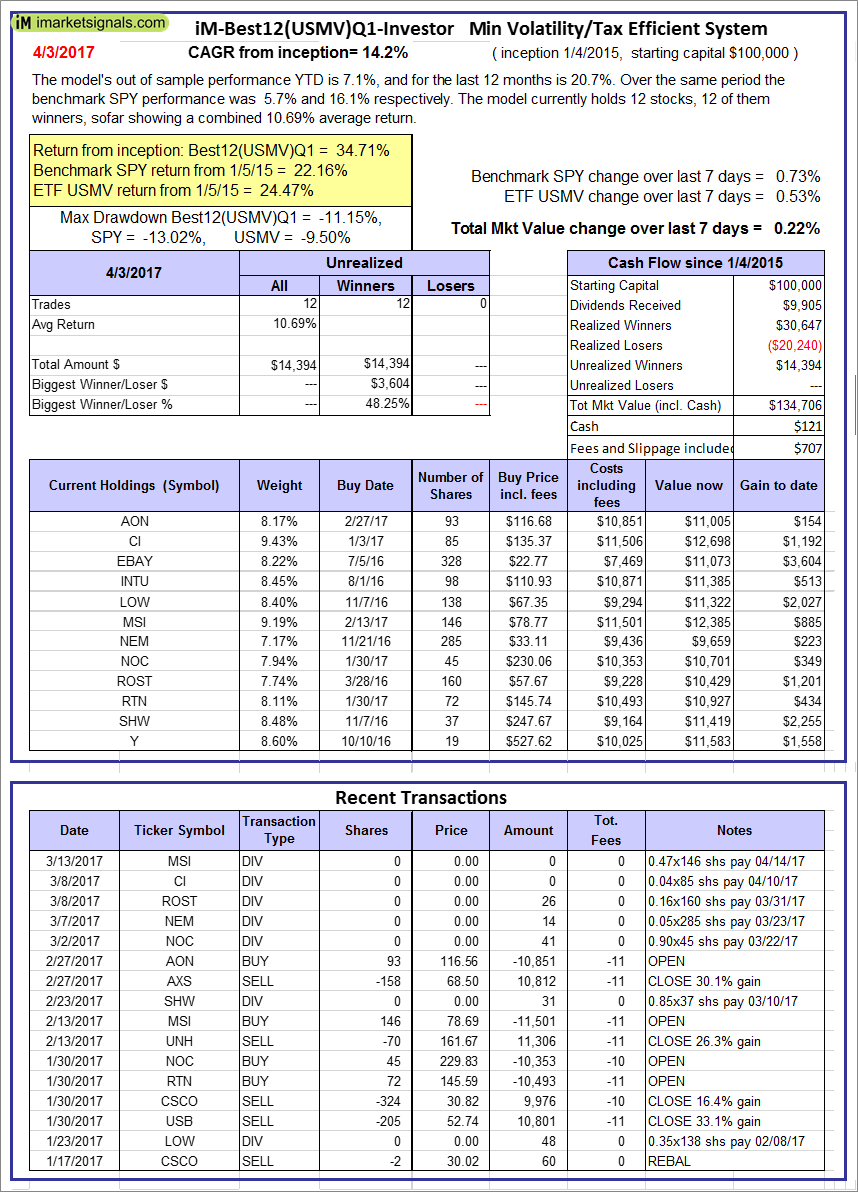 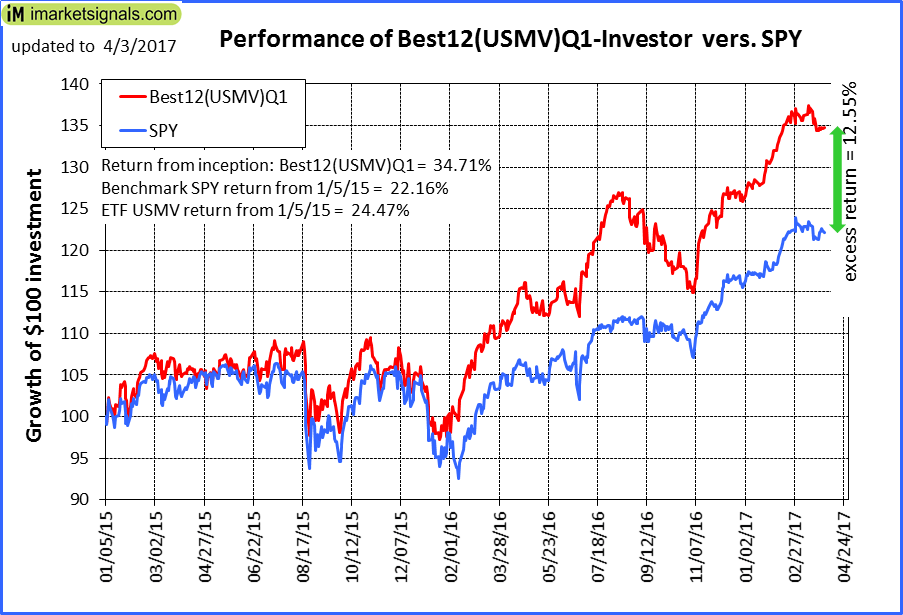 |
iM-Best12(USMV)Q1-Investor: The model’s out of sample performance YTD is 7.1%, and for the last 12 months is 20.7%. Over the same period the benchmark SPY performance was 5.7% and 16.1% respectively. Since inception, on 1/5/2015, the model gained 34.71% while the benchmark SPY gained 22.16% and the ETF USMV gained 24.47% over the same period. Over the previous week the market value of iM-Best12(USMV)Q1 gained 0.22% at a time when SPY gained 0.73%. A starting capital of $100,000 at inception on 1/5/2015 would have grown to $134,706 which includes $121 cash and excludes $707 spent on fees and slippage. |
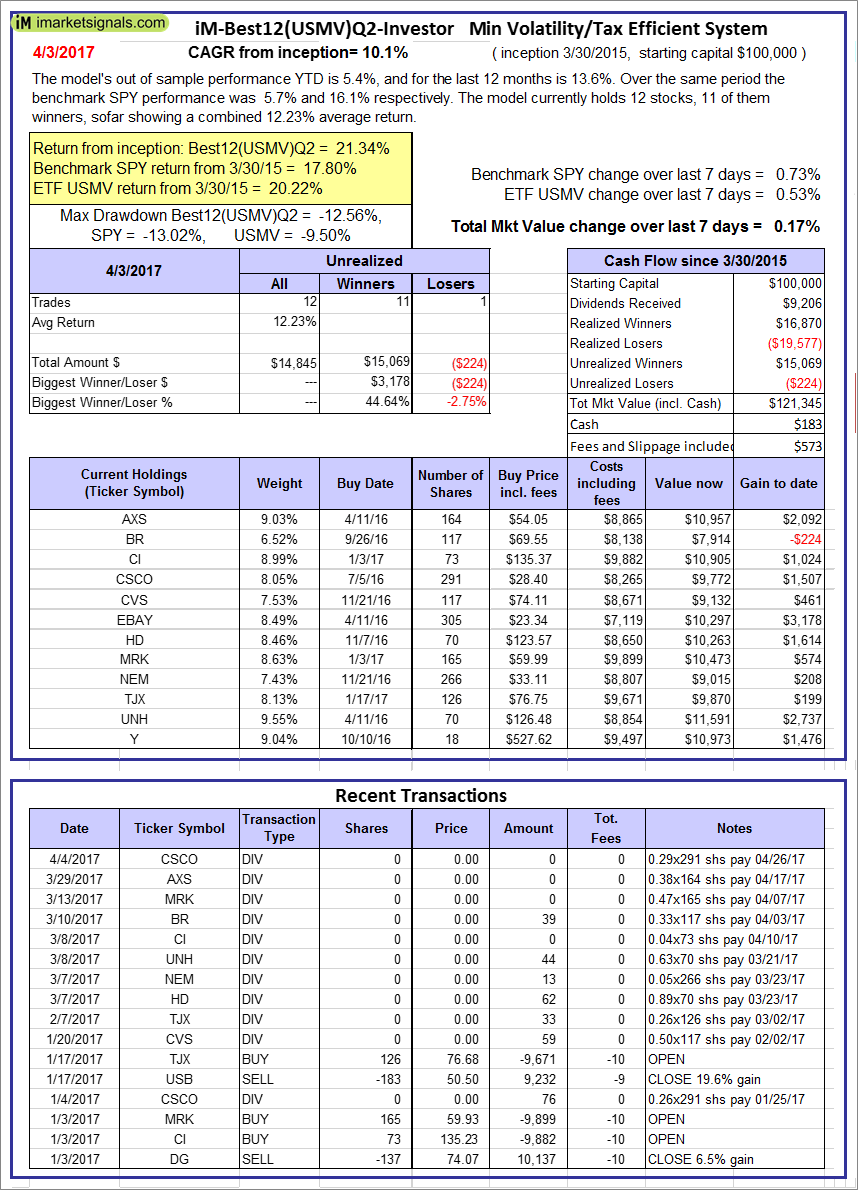  |
iM-Best12(USMV)Q2-Investor: The model’s out of sample performance YTD is 5.4%, and for the last 12 months is 13.6%. Over the same period the benchmark SPY performance was 5.7% and 16.1% respectively. Since inception, on 3/31/2015, the model gained 21.34% while the benchmark SPY gained 17.80% and the ETF USMV gained 20.22% over the same period. Over the previous week the market value of iM-Best12(USMV)Q2 gained 0.17% at a time when SPY gained 0.73%. A starting capital of $100,000 at inception on 3/31/2015 would have grown to $121,345 which includes $183 cash and excludes $573 spent on fees and slippage. |
 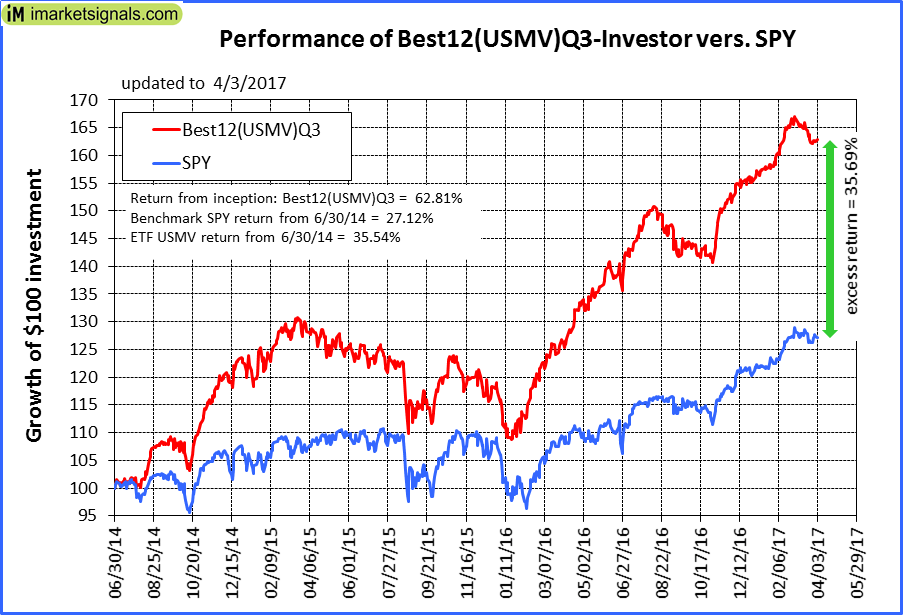 |
iM-Best12(USMV)Q3-Investor: The model’s out of sample performance YTD is 5.0%, and for the last 12 months is 28.4%. Over the same period the benchmark SPY performance was 5.7% and 16.1% respectively. Since inception, on 7/1/2014, the model gained 62.81% while the benchmark SPY gained 27.12% and the ETF USMV gained 35.54% over the same period. Over the previous week the market value of iM-Best12(USMV)Q3 gained 0.38% at a time when SPY gained 0.73%. A starting capital of $100,000 at inception on 7/1/2014 would have grown to $162,814 which includes $202 cash and excludes $972 spent on fees and slippage. |
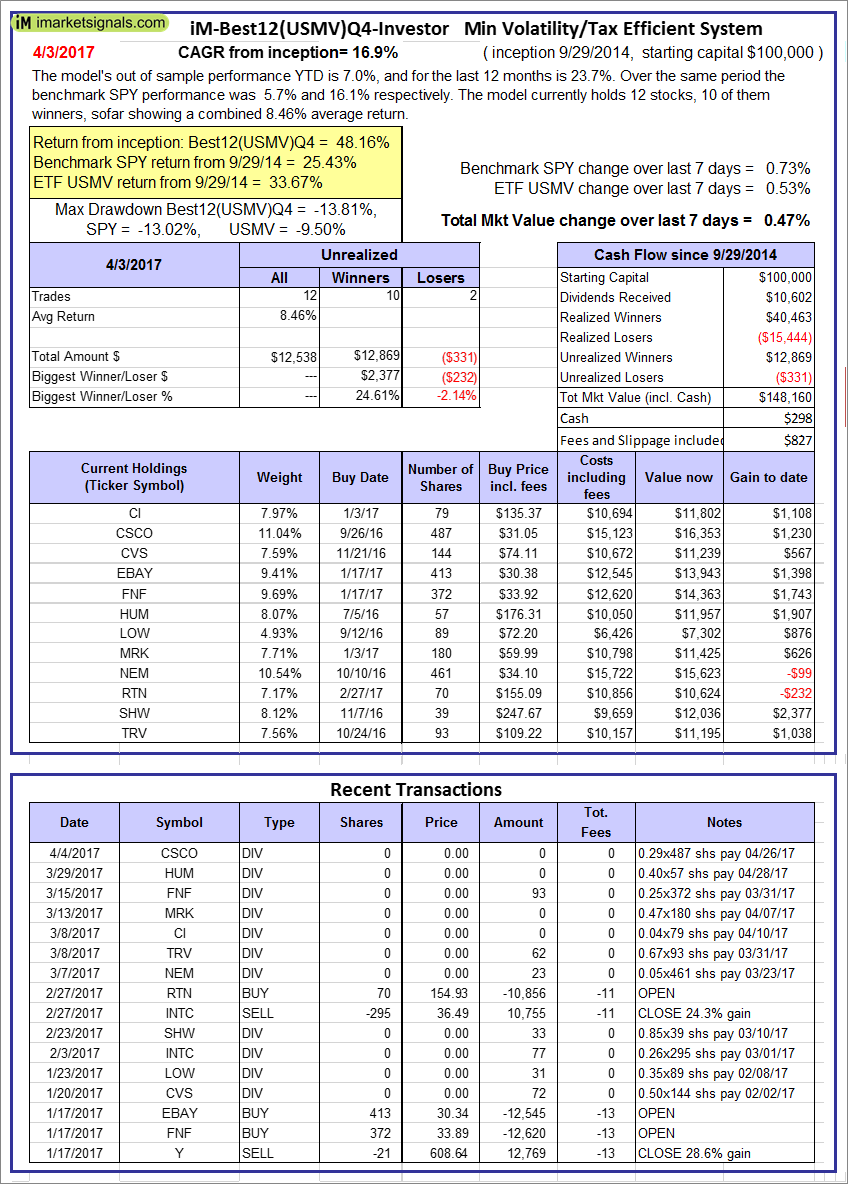 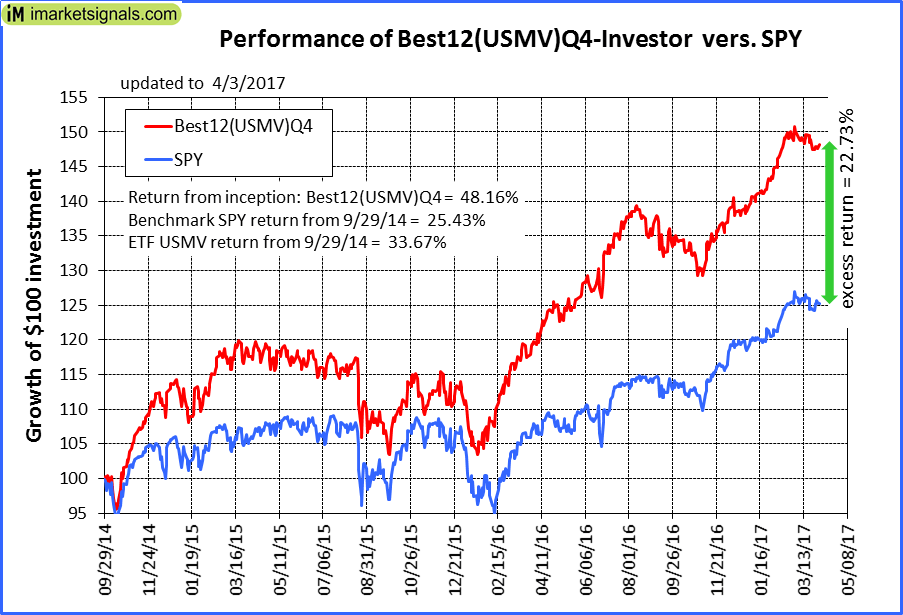 |
iM-Best12(USMV)Q4-Investor: Since inception, on 9/30/2014, the model gained 48.16% while the benchmark SPY gained 25.43% and the ETF USMV gained 33.67% over the same period. Over the previous week the market value of iM-Best12(USMV)Q4 gained 0.47% at a time when SPY gained 0.73%. A starting capital of $100,000 at inception on 9/30/2014 would have grown to $148,160 which includes $298 cash and excludes $827 spent on fees and slippage. |
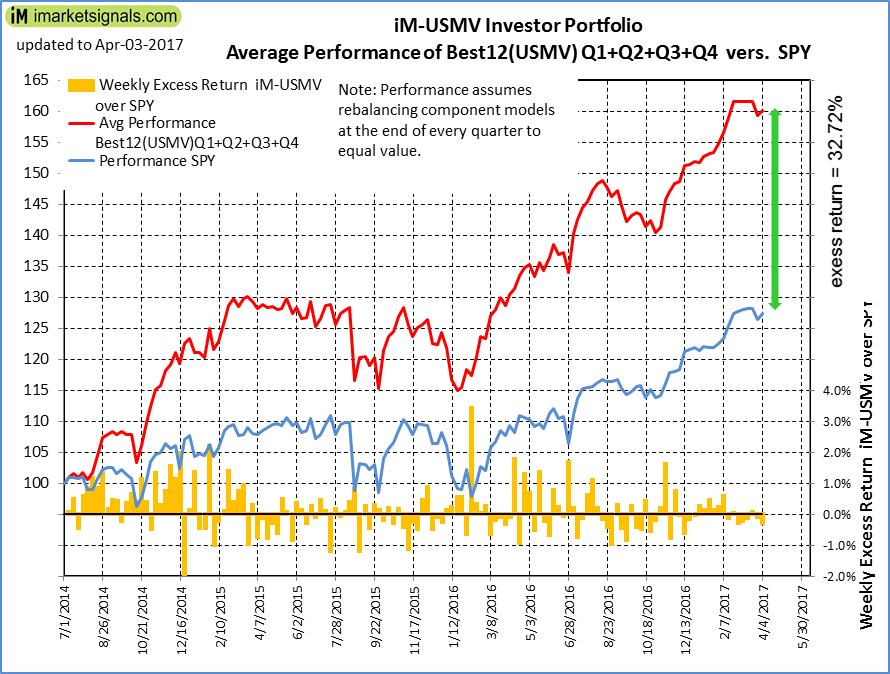 |
Average Performance of iM-Best12(USMV)Q1+Q2+Q3+Q4-Investor resulted in an excess return of 32.72% over SPY. (see iM-USMV Investor Portfolio) |
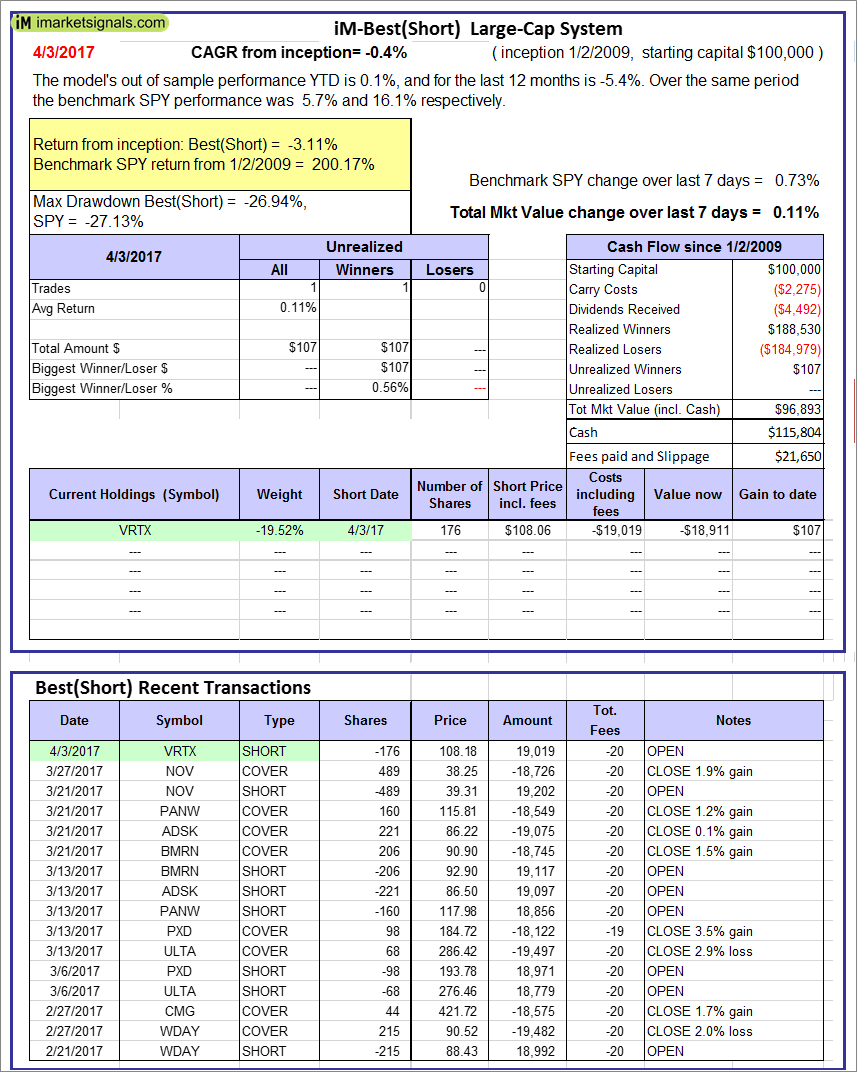 |
iM-Best(Short): The model’s out of sample performance YTD is 0.1%, and for the last 12 months is -5.4%. Over the same period the benchmark SPY performance was 5.7% and 16.1% respectively. Over the previous week the market value of iM-Best(Short) gained 0.11% at a time when SPY gained 0.73%. Over the period 1/2/2009 to 4/3/2017 the starting capital of $100,000 would have grown to $96,893 which includes $115,804 cash and excludes $21,650 spent on fees and slippage. |
iM-Best Reports – 4/3/2017
Posted in pmp SPY-SH
Leave a Reply
You must be logged in to post a comment.