  |
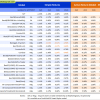
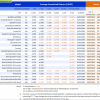
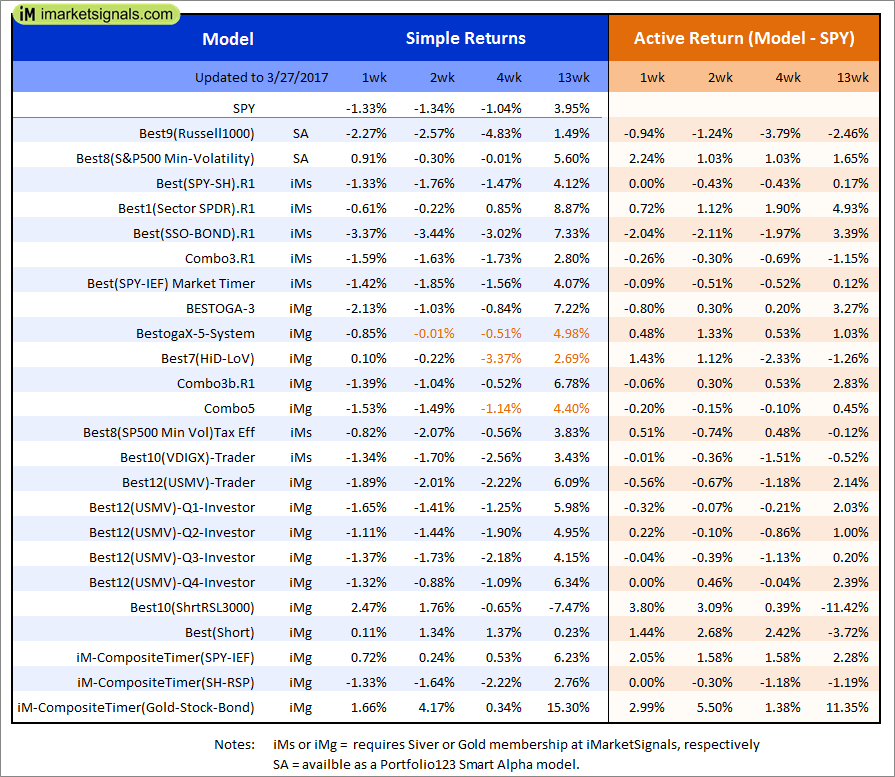
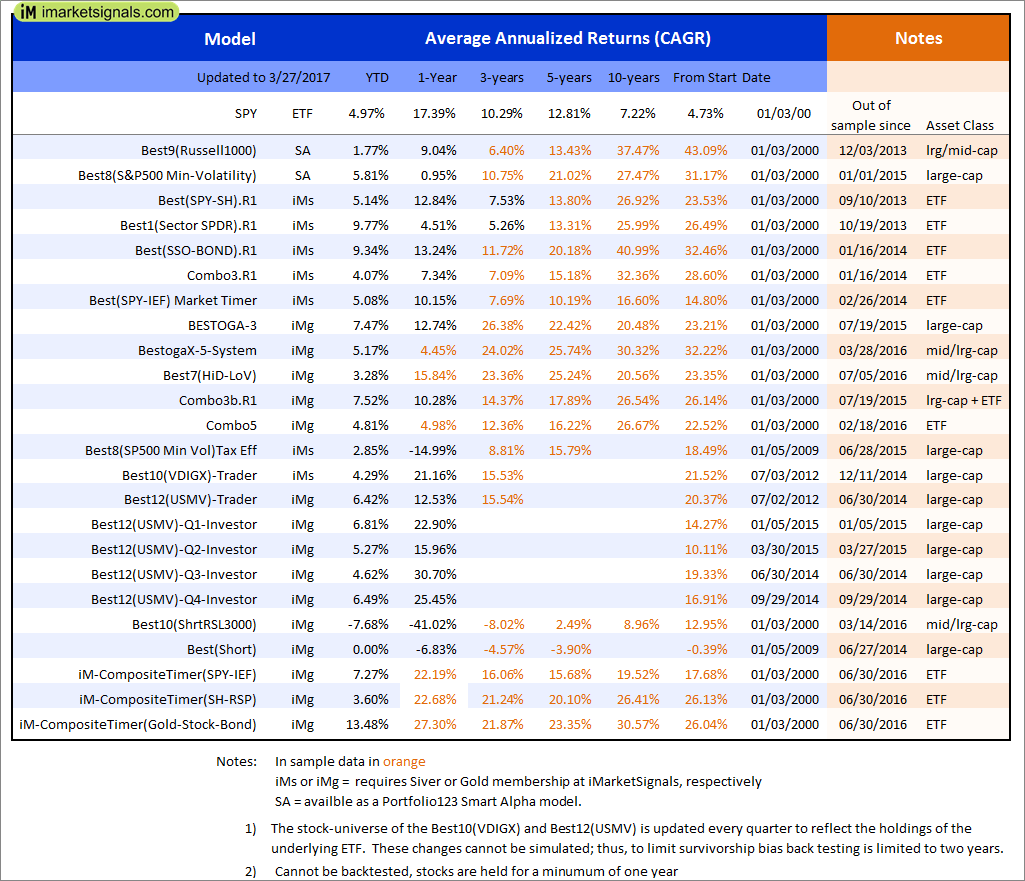
Out of sample performance summary of our models for the past 1, 2, 4 and 13 week periods. The active active return indicates how the models over- or underperformed the benchmark ETF SPY. Also the YTD, and the 1-, 3-, 5- and 10-year annualized returns are shown in the second table |
|
|
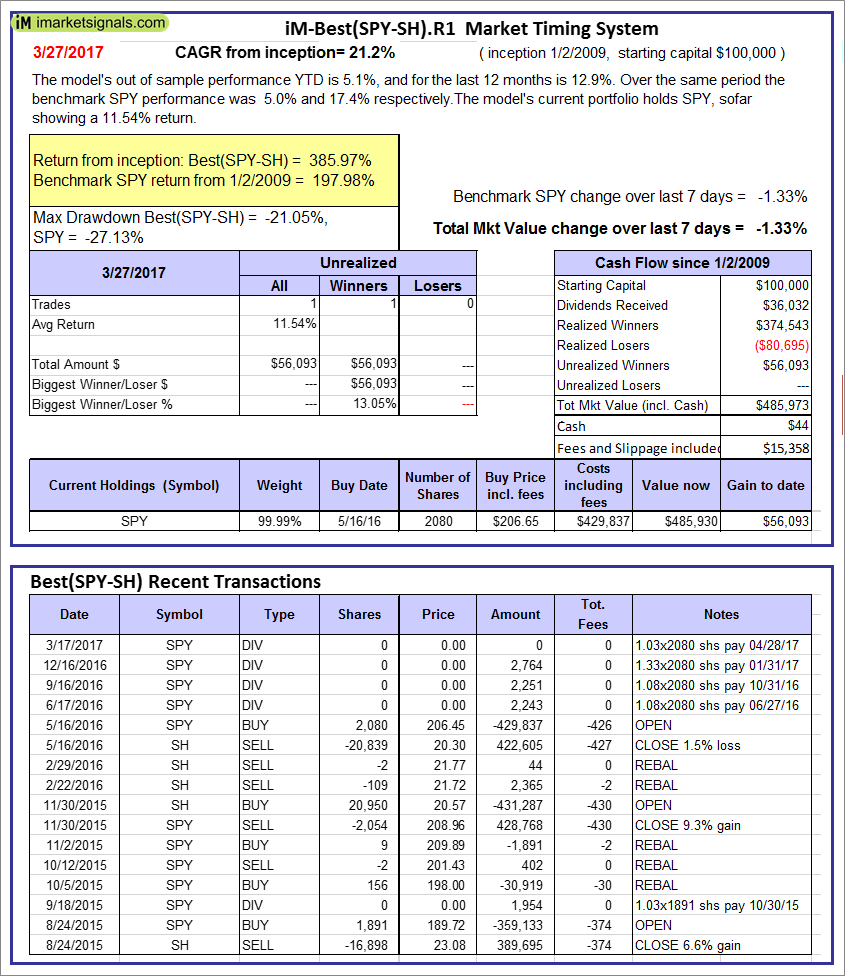
iM-Best(SPY-SH).R1: The model’s out of sample performance YTD is 5.1%, and for the last 12 months is 12.9%. Over the same period the benchmark SPY performance was 5.0% and 17.4% respectively. Over the previous week the market value of Best(SPY-SH) gained -1.33% at a time when SPY gained -1.33%. A starting capital of $100,000 at inception on 1/2/2009 would have grown to $485,973 which includes $44 cash and excludes $15,358 spent on fees and slippage. |
|
|
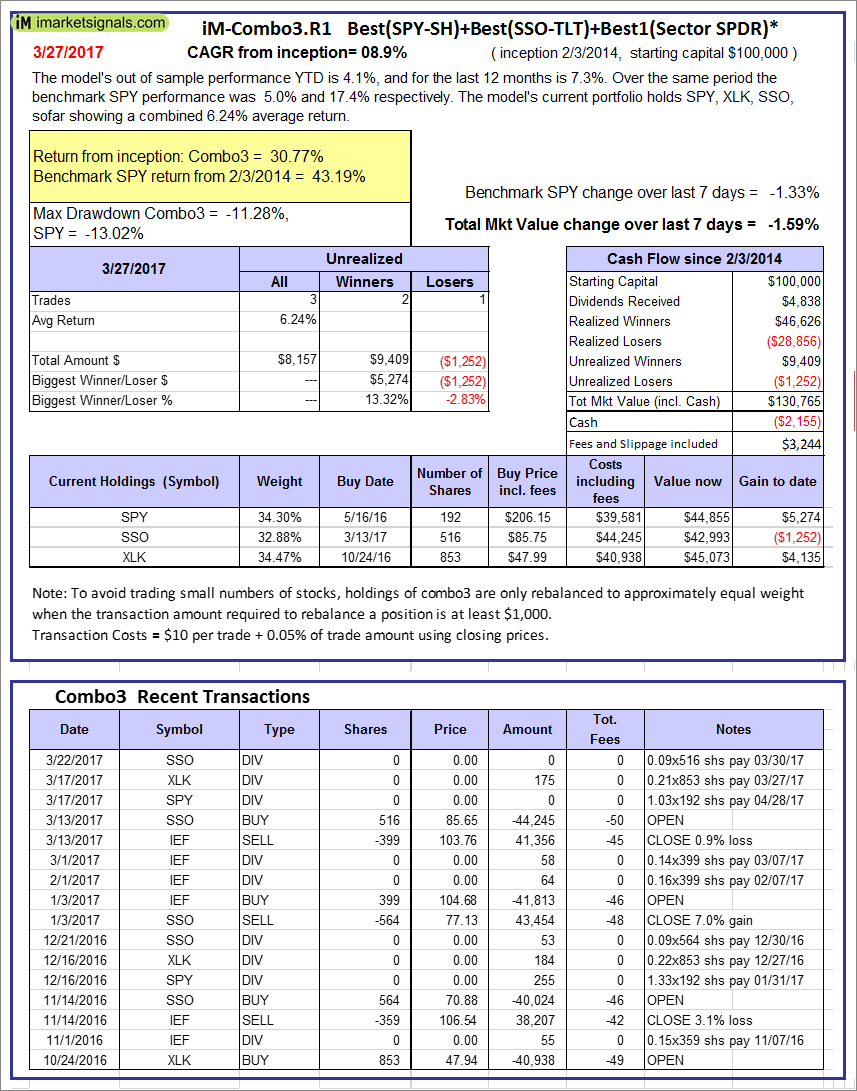
iM-Combo3.R1: The model’s out of sample performance YTD is 4.1%, and for the last 12 months is 7.3%. Over the same period the benchmark SPY performance was 5.0% and 17.4% respectively. Over the previous week the market value of iM-Combo3.R1 gained -1.59% at a time when SPY gained -1.33%. A starting capital of $100,000 at inception on 2/3/2014 would have grown to $130,765 which includes -$2,155 cash and excludes $3,244 spent on fees and slippage. |
|
|
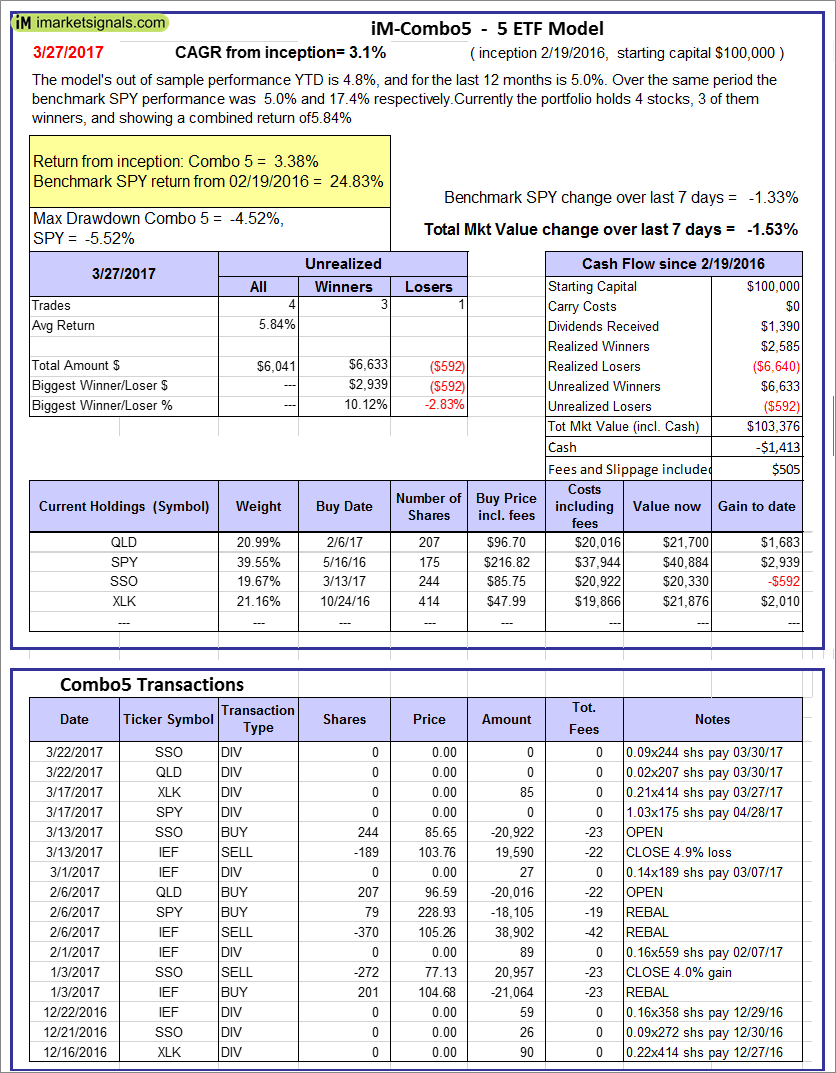
iM-Combo5: The model’s out of sample performance YTD is 4.8%, and for the last 12 months is 5.0%. Over the same period the benchmark SPY performance was 5.0% and 17.4% respectively. Over the previous week the market value of iM-Combo5 gained -1.53% at a time when SPY gained -1.33%. A starting capital of $100,000 at inception on 2/22/2016 would have grown to $103,376 which includes -$1,413 cash and excludes $505 spent on fees and slippage. |
|
|
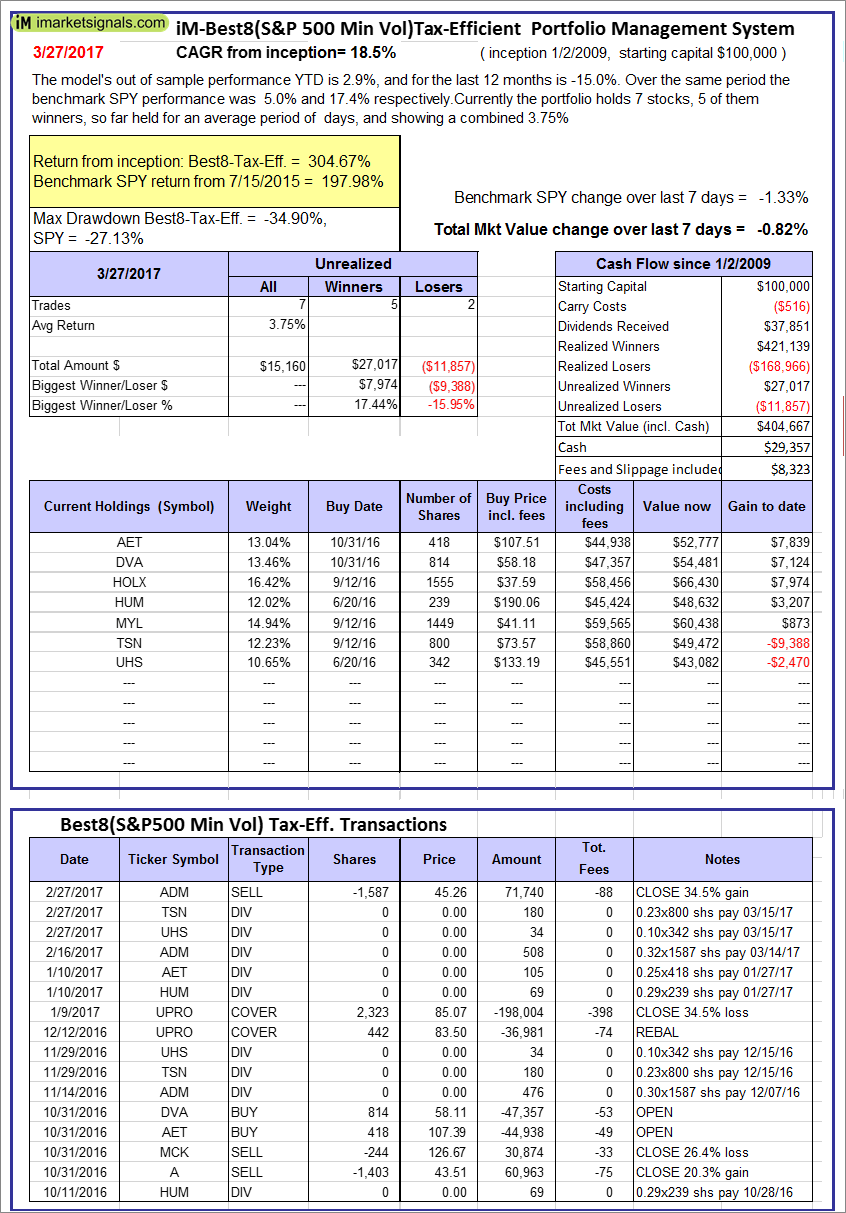
The iM-Best8(S&P500 Min Vol)Tax-Efficient The model’s out of sample performance YTD is 2.9%, and for the last 12 months is -15.0%. Over the same period the benchmark SPY performance was 5.0% and 17.4% respectively. Over the previous week the market value of iM-Best8(S&P 500)Tax-Eff. gained -0.82% at a time when SPY gained -1.33%. A starting capital of $100,000 at inception on 1/2/2009 would have grown to $404,667 which includes $29,357 cash and excludes $8,323 spent on fees and slippage. |
|
|
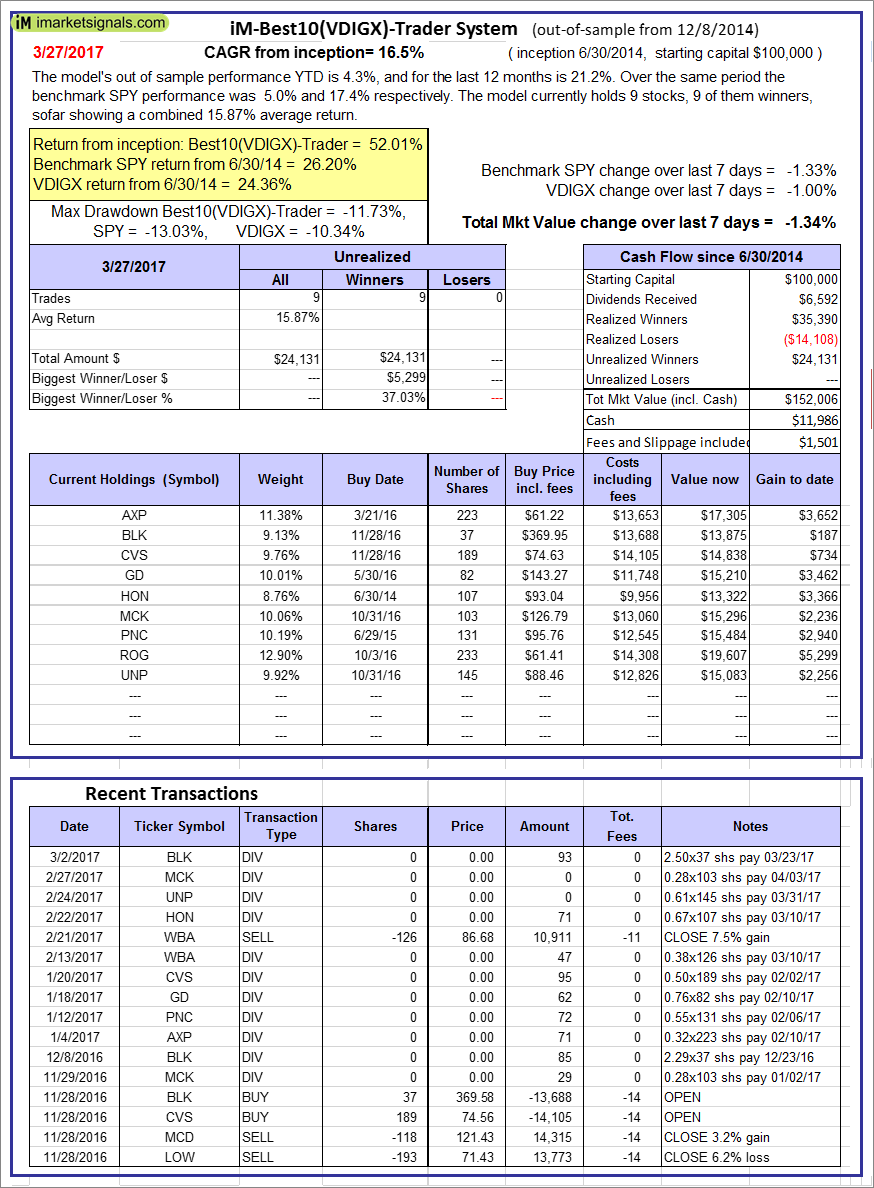
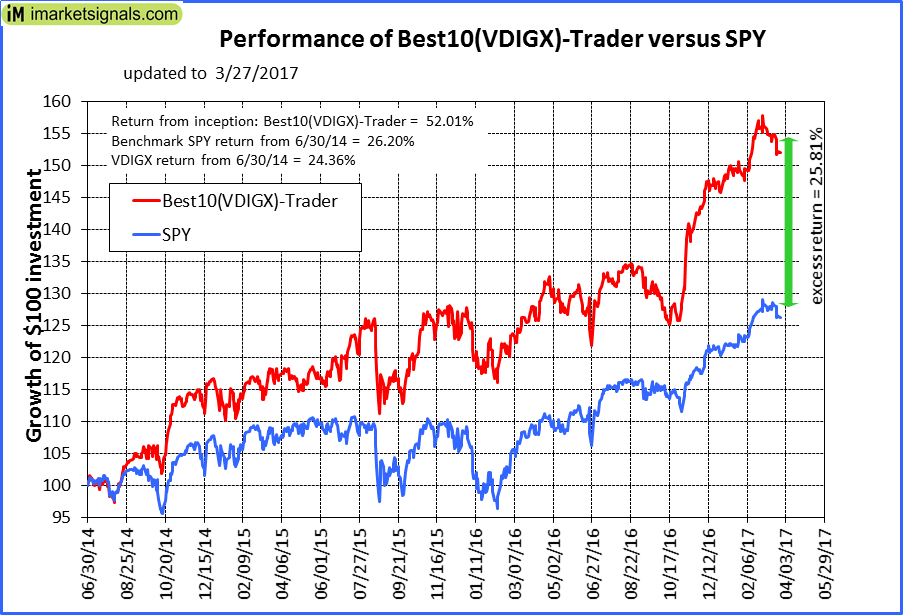
iM-Best10(VDIGX)-Trader: The model’s out of sample performance YTD is 4.3%, and for the last 12 months is 21.2%. Over the same period the benchmark SPY performance was 5.0% and 17.4% respectively. Since inception, on 7/1/2014, the model gained 52.01% while the benchmark SPY gained 26.20% and VDIGX gained 24.36% over the same period. Over the previous week the market value of iM-Best10(VDIGX) gained -1.34% at a time when SPY gained -1.33%. A starting capital of $100,000 at inception on 7/1/2014 would have grown to $152,006 which includes $11,986 cash and excludes $1,501 spent on fees and slippage. |
|
|
iM-Best2 MC-Score ETF System: The model’s out of sample performance YTD is 5.7%, and since inception 2.5%. Over the same period the benchmark SPY performance was 5.0% and 13.2% respectively. Over the previous week the market value of iM-BESTOGA-3 gained -0.68% at a time when SPY gained -1.33%. A starting capital of $100,000 at inception on 6/30/2016 would have grown to $354 which includes $106 cash and excludes Gain to date spent on fees and slippage. |
|
|
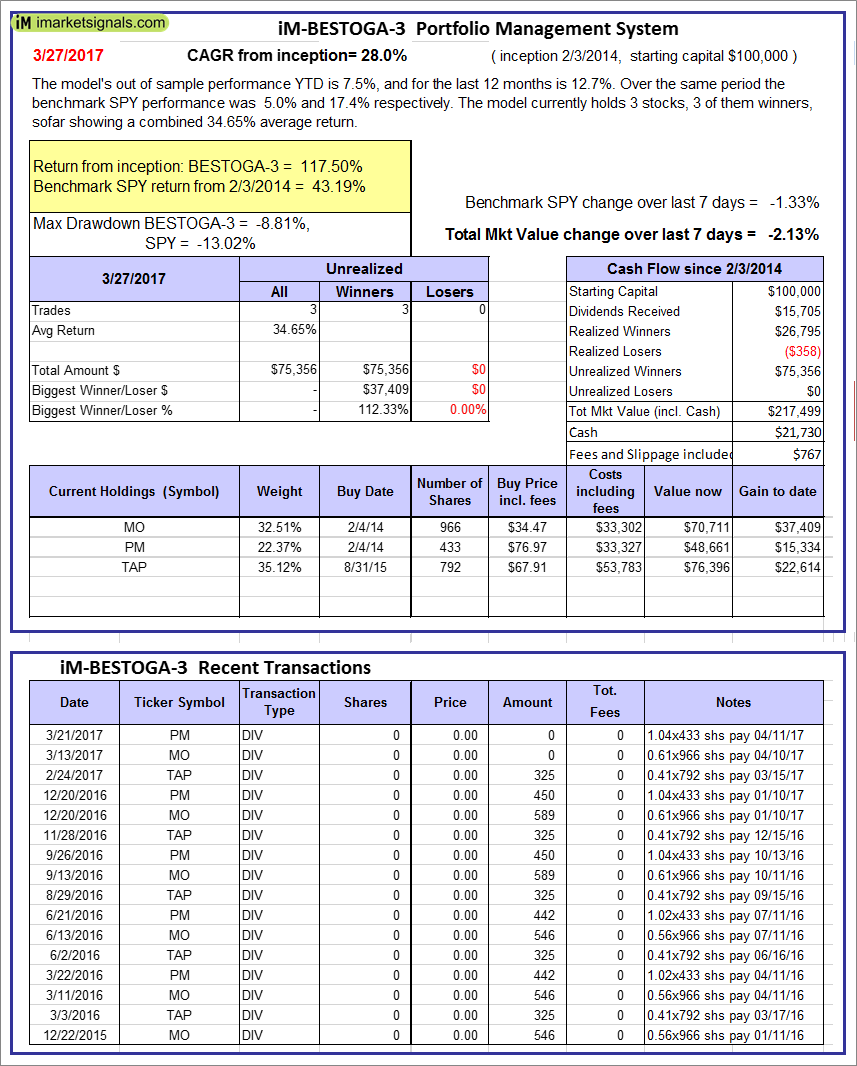
iM-BESTOGA-3: The model’s out of sample performance YTD is 7.5%, and for the last 12 months is 12.7%. Over the same period the benchmark SPY performance was 5.0% and 17.4% respectively. Over the previous week the market value of iM-BESTOGA-3 gained -2.13% at a time when SPY gained -1.33%. A starting capital of $100,000 at inception on 2/3/2014 would have grown to $217,499 which includes $21,730 cash and excludes $767 spent on fees and slippage. |
|
|
iM-Best7(HiD-LoV): The model’s out of sample performance YTD is 3.3%, and since inception 6.1%. Over the same period the benchmark SPY performance was 5.0% and 13.2% respectively. Over the previous week the market value of iM-Best7(HiD-LoV) gained 0.10% at a time when SPY gained -1.33%. A starting capital of $100,000 at inception on 6/30/2016 would have grown to $106,126 which includes -$77 cash and excludes $747 spent on fees and slippage. |
|
|
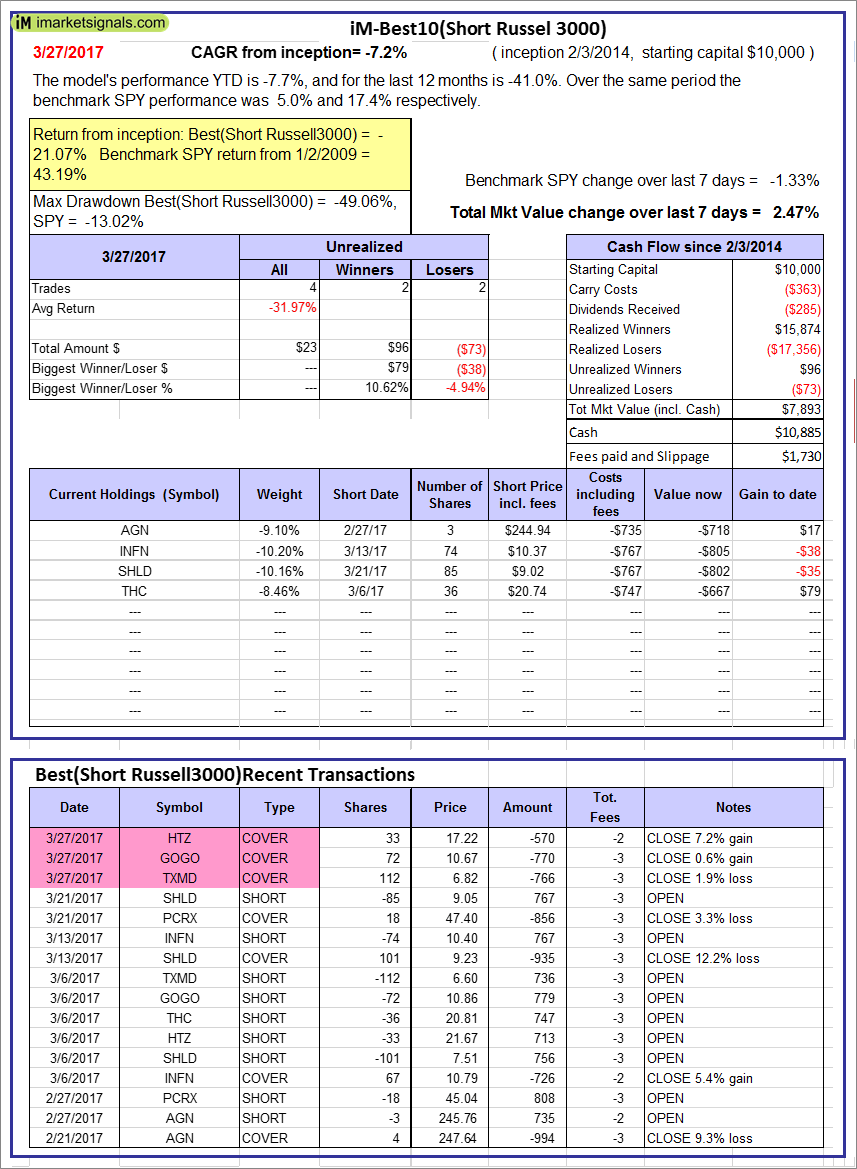
iM-Best10(Short Russell3000): The model’s performance YTD is -7.7%, and for the last 12 months is -41.0%. Over the same period the benchmark SPY performance was 5.0% and 17.4% respectively. Over the previous week the market value of iM-Best10(Short Russell3000) gained 2.47% at a time when SPY gained -1.33%. Over the period 2/3/2014 to 3/27/2017 the starting capital of $100,000 would have grown to $7,893 which includes $10,885 cash and excludes $1,730 spent on fees and slippage. |
|
|
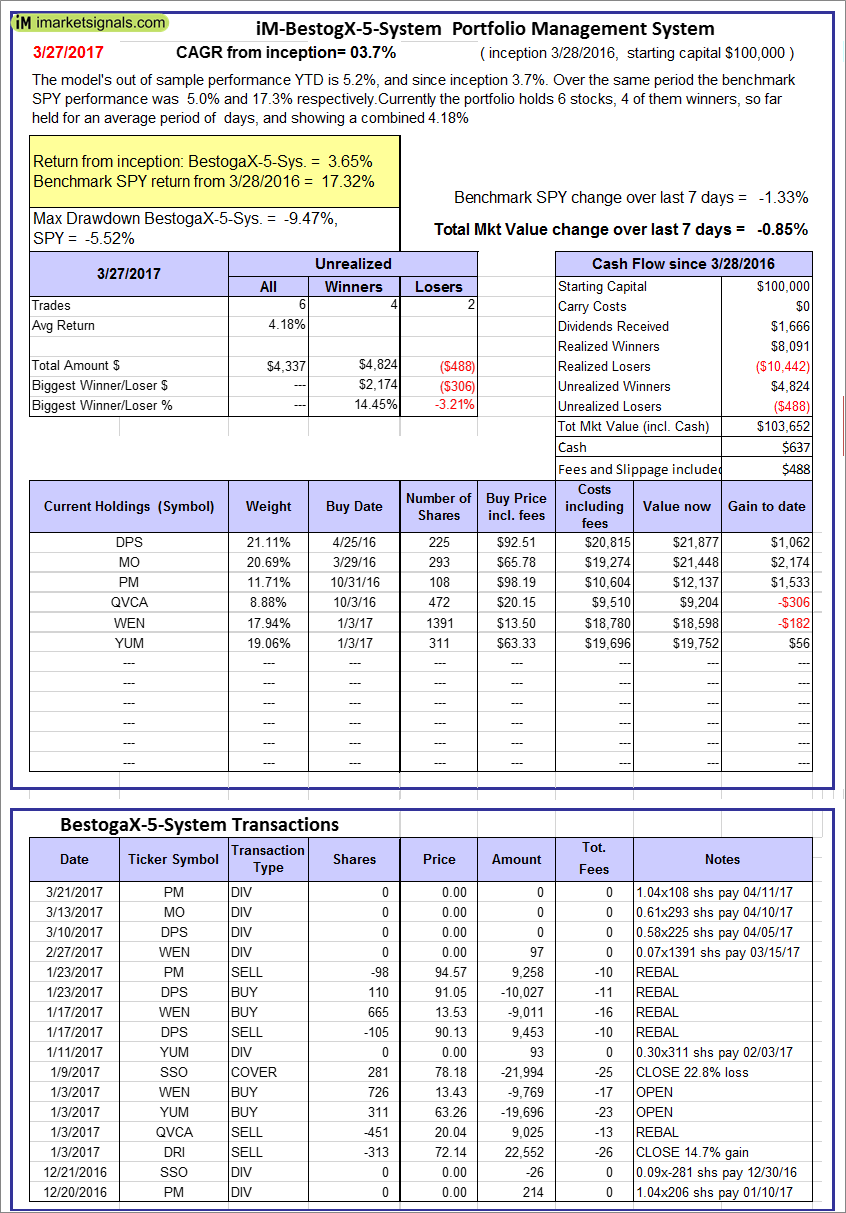
iM-BestogaX5-System: The model’s out of sample performance YTD is 5.2%, and since inception 3.7%. Over the same period the benchmark SPY performance was 5.0% and 17.3% respectively. Over the previous week the market value of iM-Best8(S&P 500)Tax-Eff. gained -0.85% at a time when SPY gained -1.33%. A starting capital of $100,000 at inception on 3/28/2016 would have grown to $103,652 which includes $637 cash and excludes $488 spent on fees and slippage. |
|
|
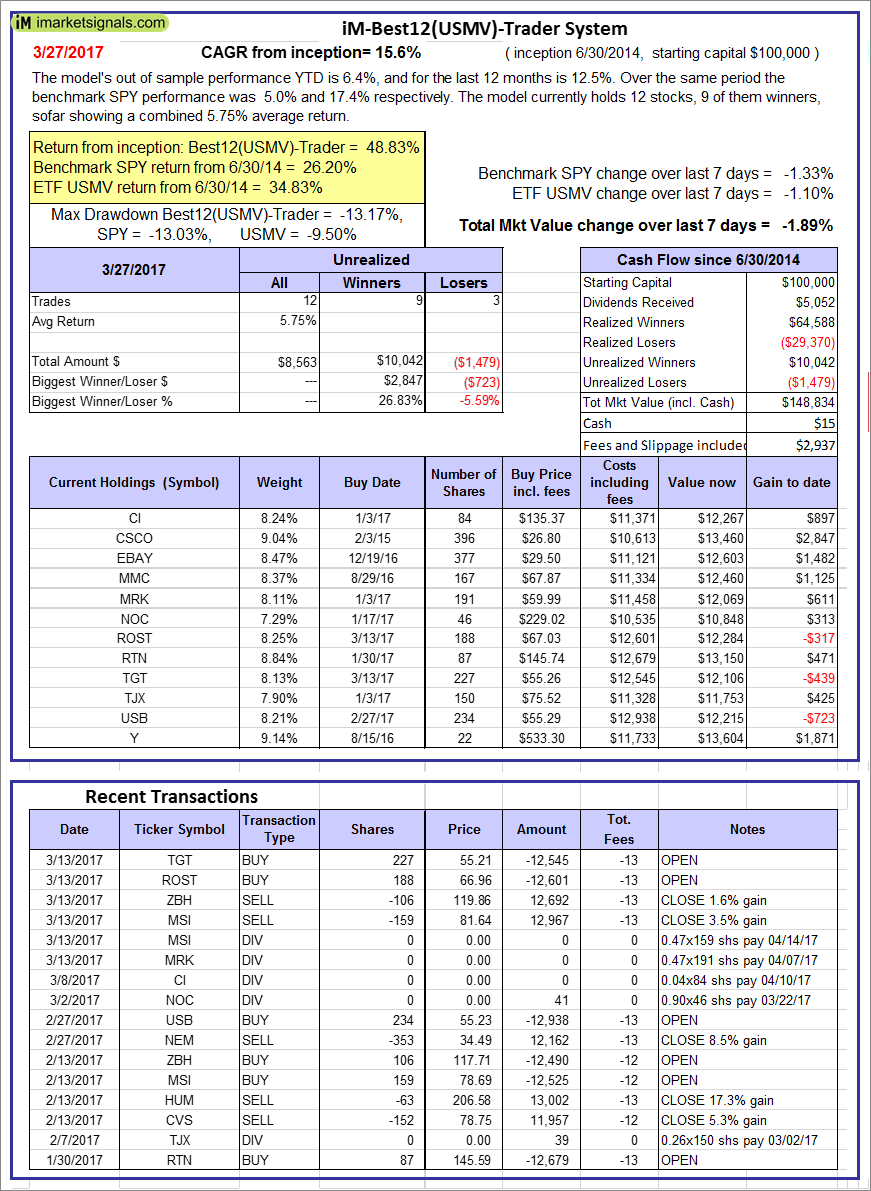
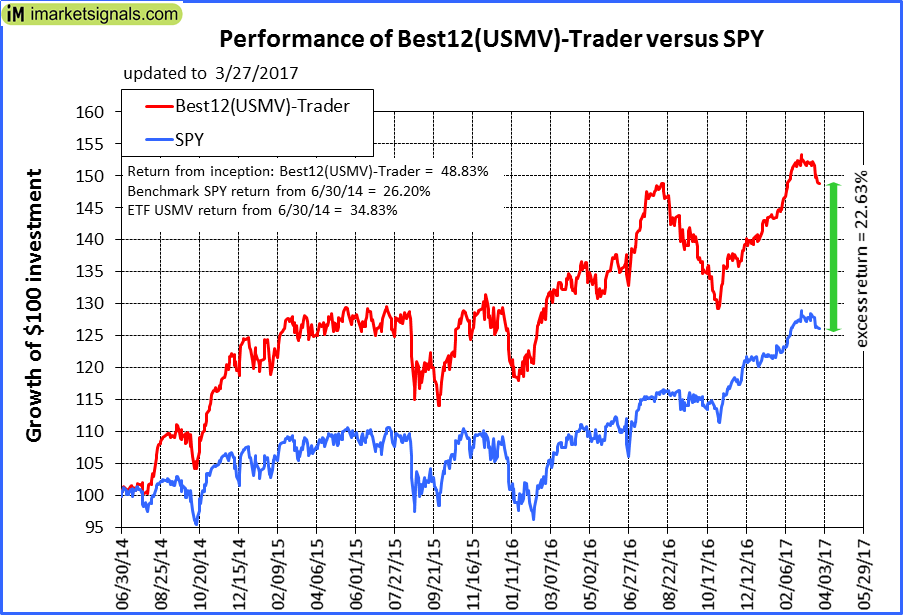
iM-Best12(USMV)-Trader: The model’s out of sample performance YTD is 6.4%, and for the last 12 months is 12.5%. Over the same period the benchmark SPY performance was 5.0% and 17.4% respectively. Since inception, on 7/1/2014, the model gained 48.83% while the benchmark SPY gained 26.20% and the ETF USMV gained 34.83% over the same period. Over the previous week the market value of iM-Best12(USMV)-Trader gained -1.89% at a time when SPY gained -1.33%. A starting capital of $100,000 at inception on 7/1/2014 would have grown to $148,834 which includes $15 cash and excludes $2,937 spent on fees and slippage. |
|
|
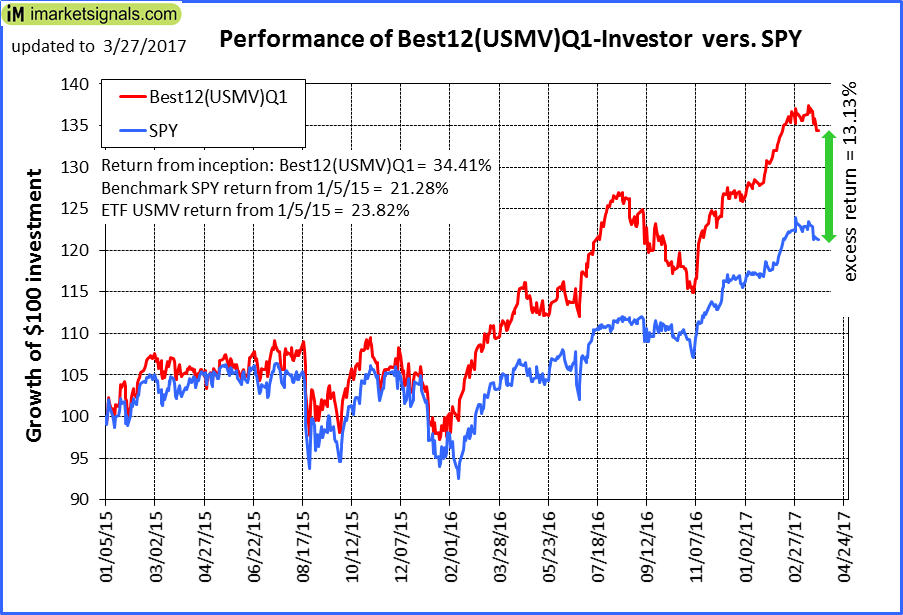
iM-Best12(USMV)Q1-Investor: The model’s out of sample performance YTD is 6.8%, and for the last 12 months is 22.9%. Over the same period the benchmark SPY performance was 5.0% and 17.4% respectively. Since inception, on 1/5/2015, the model gained 34.41% while the benchmark SPY gained 21.28% and the ETF USMV gained 23.82% over the same period. Over the previous week the market value of iM-Best12(USMV)Q1 gained -1.66% at a time when SPY gained -1.33%. A starting capital of $100,000 at inception on 1/5/2015 would have grown to $134,406 which includes $96 cash and excludes $707 spent on fees and slippage. |
|
|
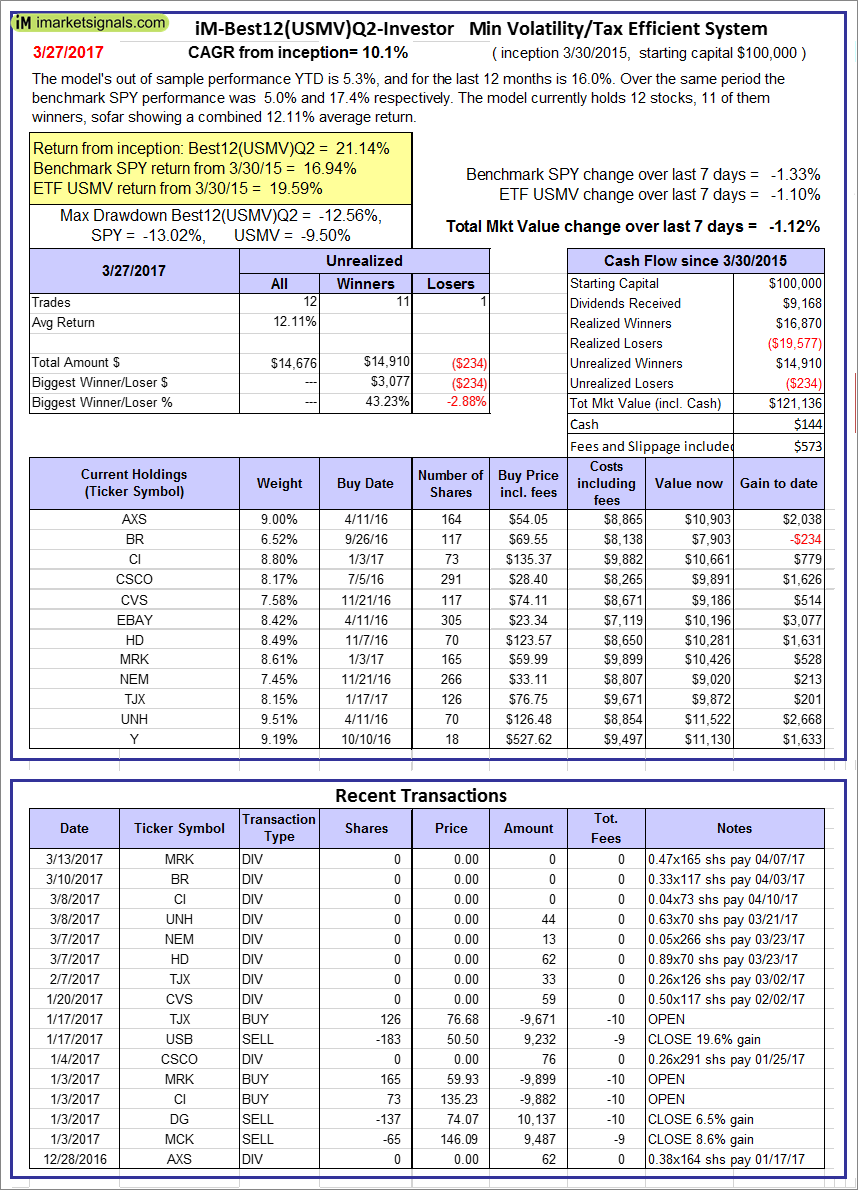
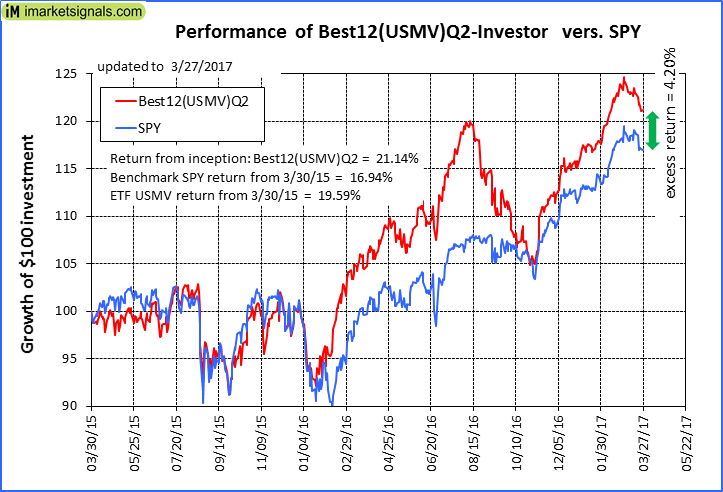
iM-Best12(USMV)Q2-Investor: The model’s out of sample performance YTD is 5.3%, and for the last 12 months is 16.0%. Over the same period the benchmark SPY performance was 5.0% and 17.4% respectively. Since inception, on 3/31/2015, the model gained 21.14% while the benchmark SPY gained 16.94% and the ETF USMV gained 19.59% over the same period. Over the previous week the market value of iM-Best12(USMV)Q2 gained -1.12% at a time when SPY gained -1.33%. A starting capital of $100,000 at inception on 3/31/2015 would have grown to $121,136 which includes $144 cash and excludes $573 spent on fees and slippage. |
|
|
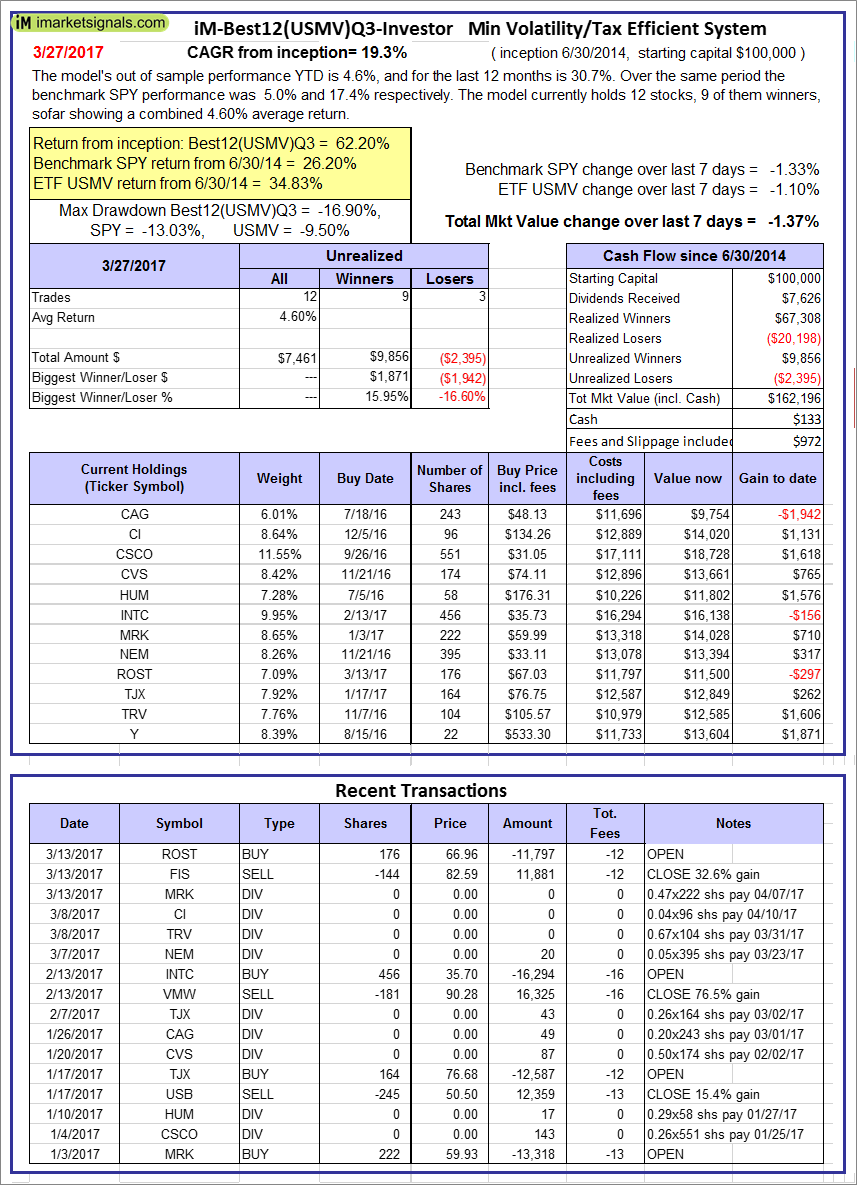
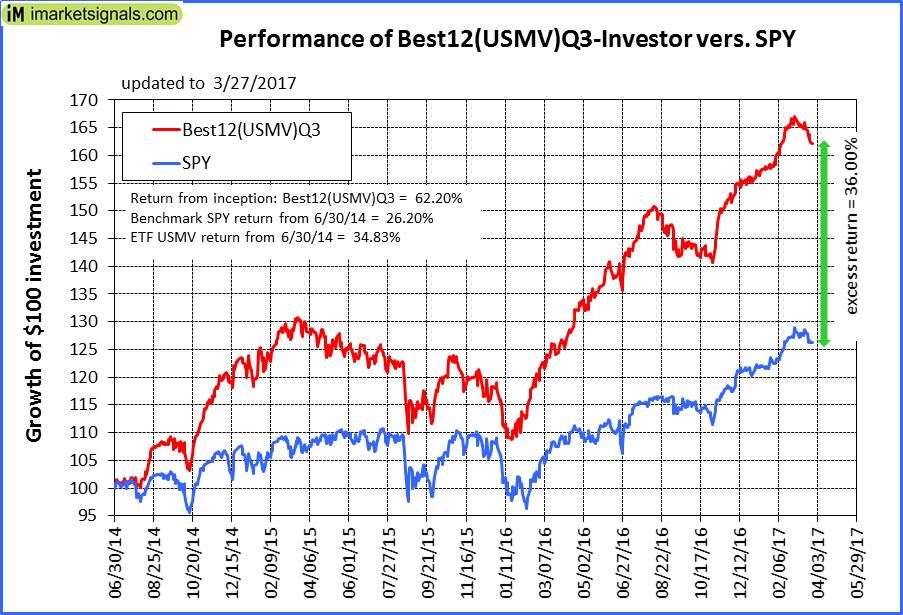
iM-Best12(USMV)Q3-Investor: The model’s out of sample performance YTD is 4.6%, and for the last 12 months is 30.7%. Over the same period the benchmark SPY performance was 5.0% and 17.4% respectively. Since inception, on 7/1/2014, the model gained 62.20% while the benchmark SPY gained 26.20% and the ETF USMV gained 34.83% over the same period. Over the previous week the market value of iM-Best12(USMV)Q3 gained -1.37% at a time when SPY gained -1.33%. A starting capital of $100,000 at inception on 7/1/2014 would have grown to $162,196 which includes $133 cash and excludes $972 spent on fees and slippage. |
|
|
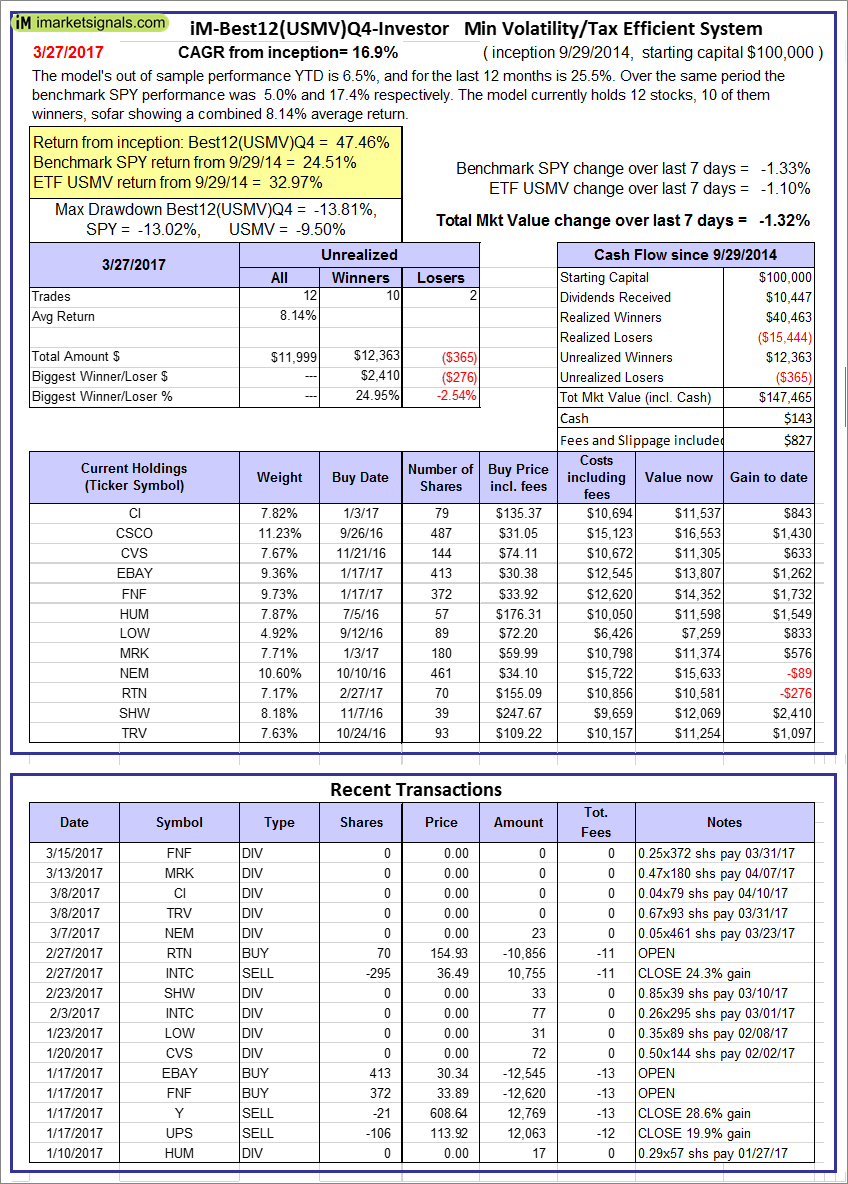
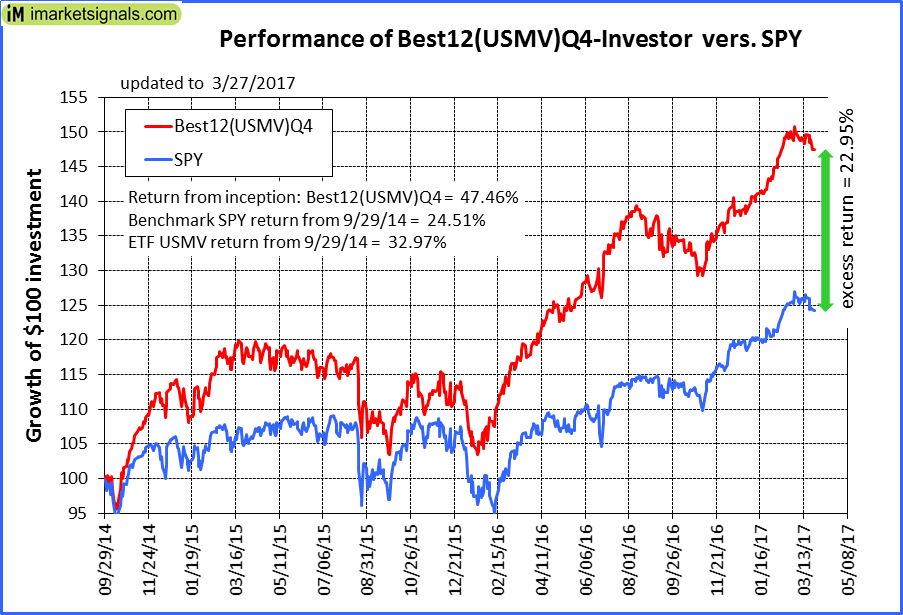
iM-Best12(USMV)Q4-Investor: Since inception, on 9/30/2014, the model gained 47.46% while the benchmark SPY gained 24.51% and the ETF USMV gained 32.97% over the same period. Over the previous week the market value of iM-Best12(USMV)Q4 gained -1.32% at a time when SPY gained -1.33%. A starting capital of $100,000 at inception on 9/30/2014 would have grown to $147,465 which includes $143 cash and excludes $827 spent on fees and slippage. |
|
|
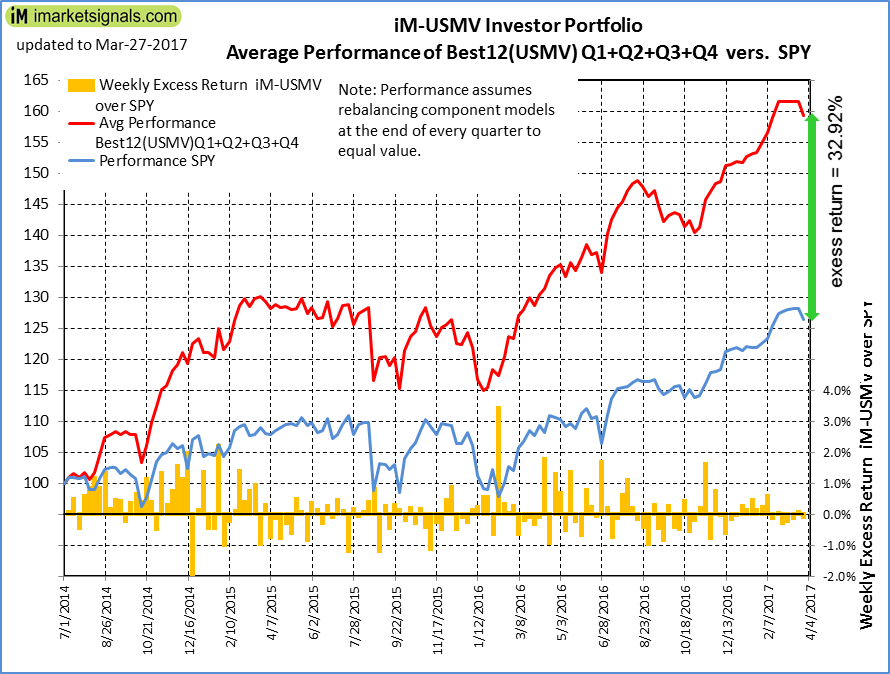
Average Performance of iM-Best12(USMV)Q1+Q2+Q3+Q4-Investor resulted in an excess return of 32.92% over SPY. (see iM-USMV Investor Portfolio) |
|
|
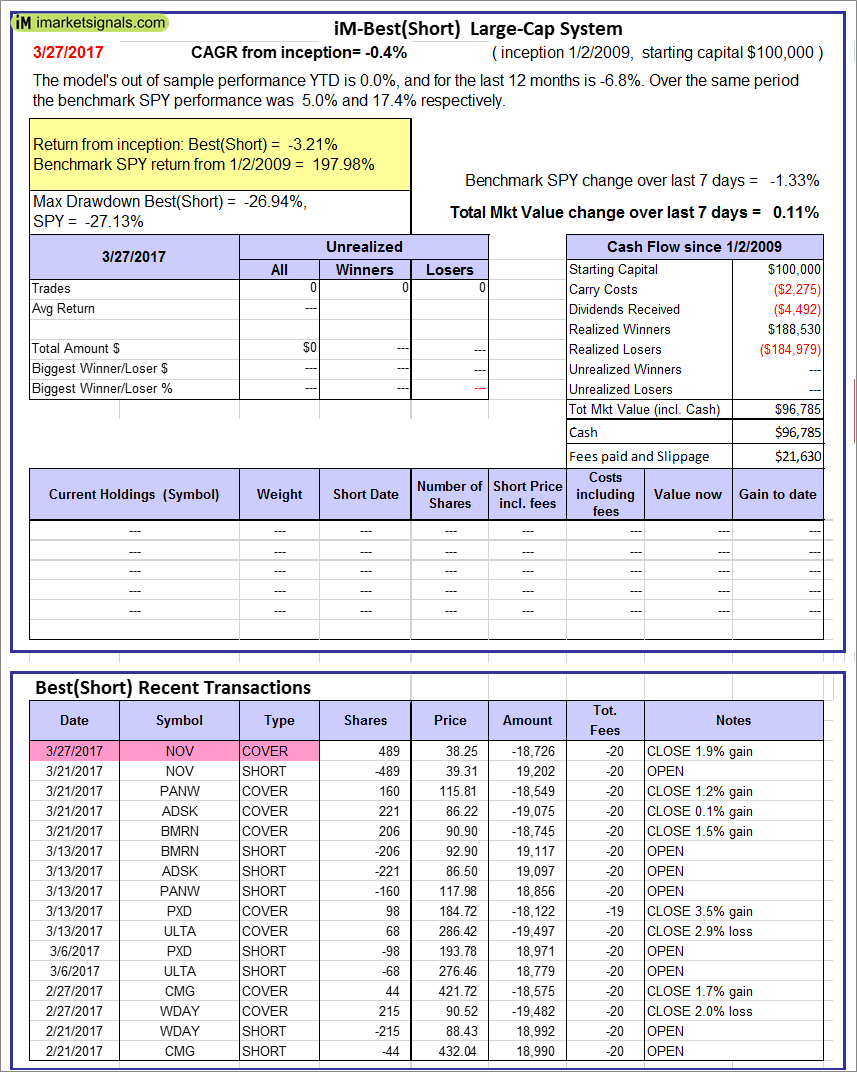
iM-Best(Short): The model’s out of sample performance YTD is 0.0%, and for the last 12 months is -6.8%. Over the same period the benchmark SPY performance was 5.0% and 17.4% respectively. Over the previous week the market value of iM-Best(Short) gained 0.11% at a time when SPY gained -1.33%. Over the period 1/2/2009 to 3/27/2017 the starting capital of $100,000 would have grown to $96,785 which includes $96,785 cash and excludes $21,630 spent on fees and slippage. |


Leave a Reply
You must be logged in to post a comment.