  |
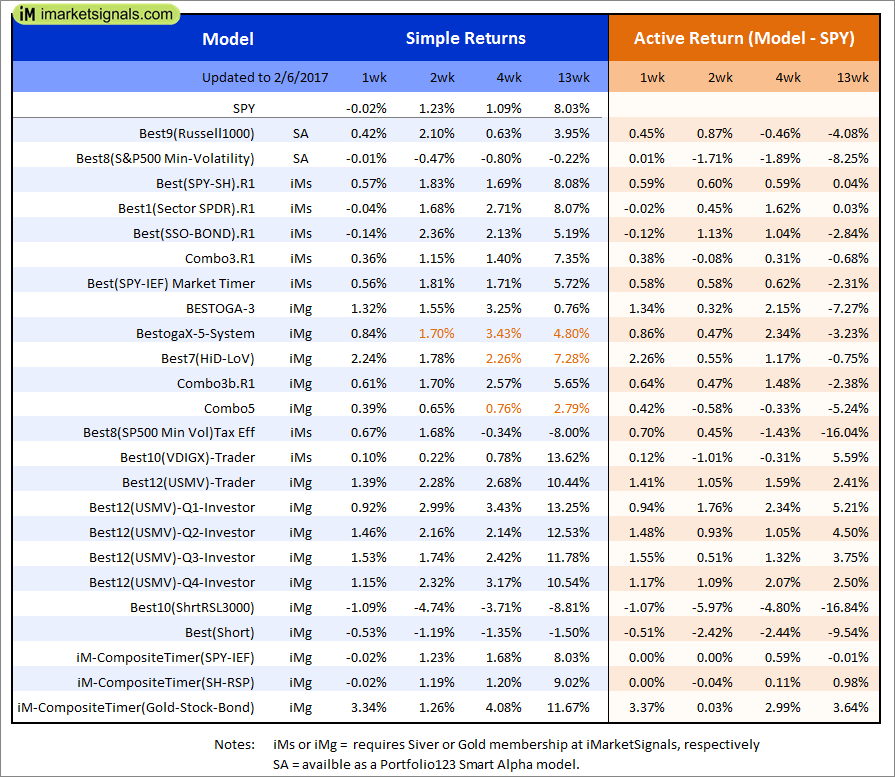
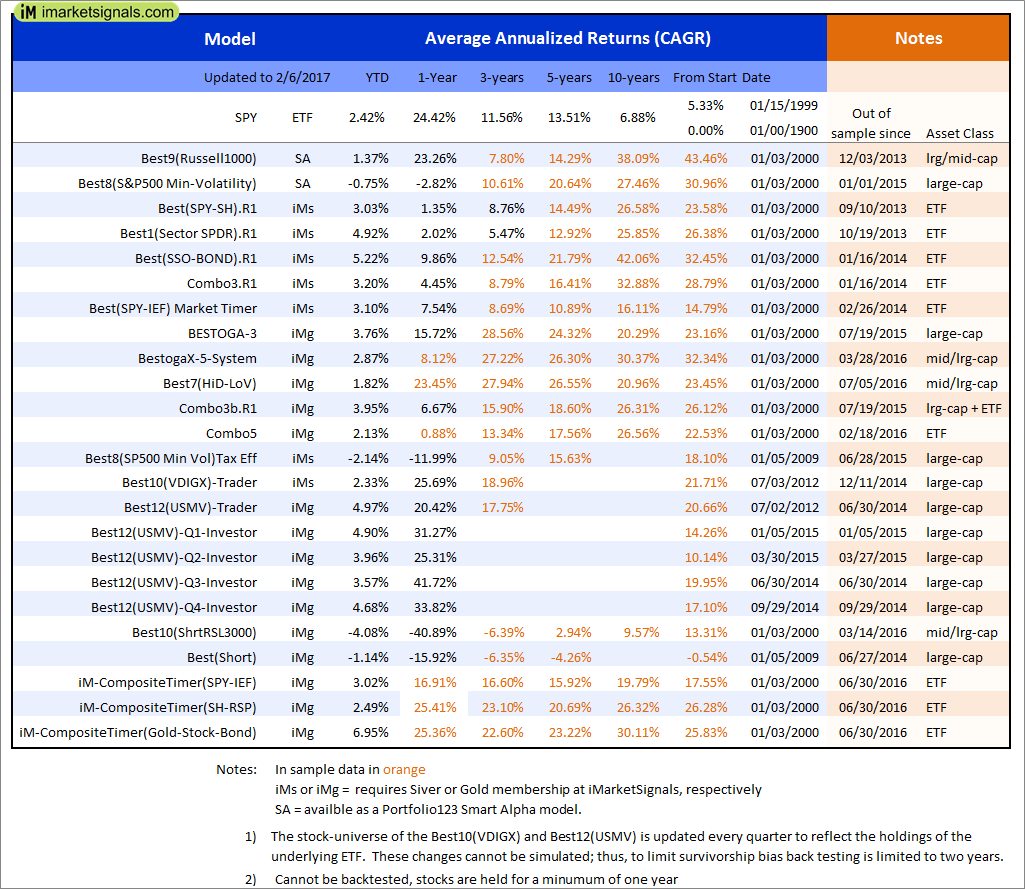
Out of sample performance summary of our models for the past 1, 2, 4 and 13 week periods. The active active return indicates how the models over- or underperformed the benchmark ETF SPY. Also the YTD, and the 1-, 3-, 5- and 10-year annualized returns are shown in the second table |
|
|
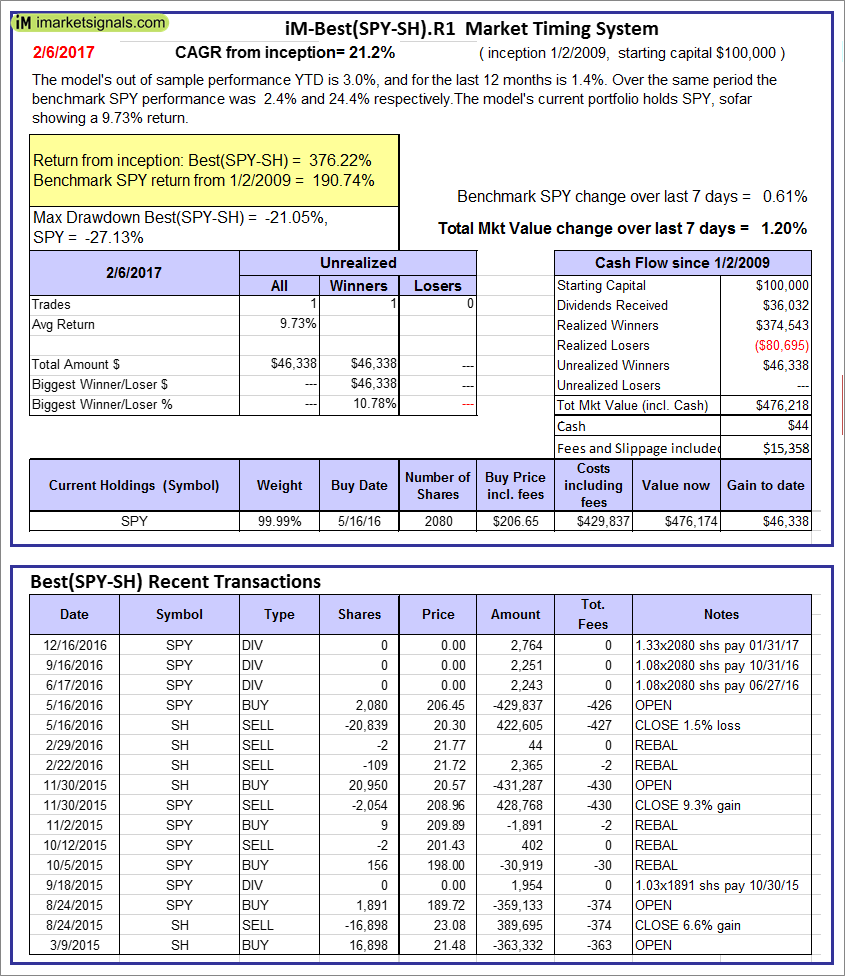
iM-Best(SPY-SH).R1: The model’s out of sample performance YTD is 3.0%, and for the last 12 months is 1.4%. Over the same period the benchmark SPY performance was 2.4% and 24.4% respectively. Over the previous week the market value of Best(SPY-SH) gained 1.20% at a time when SPY gained 0.61%. A starting capital of $100,000 at inception on 1/2/2009 would have grown to $476,218 which includes $44 cash and excludes $15,358 spent on fees and slippage. |
|
|
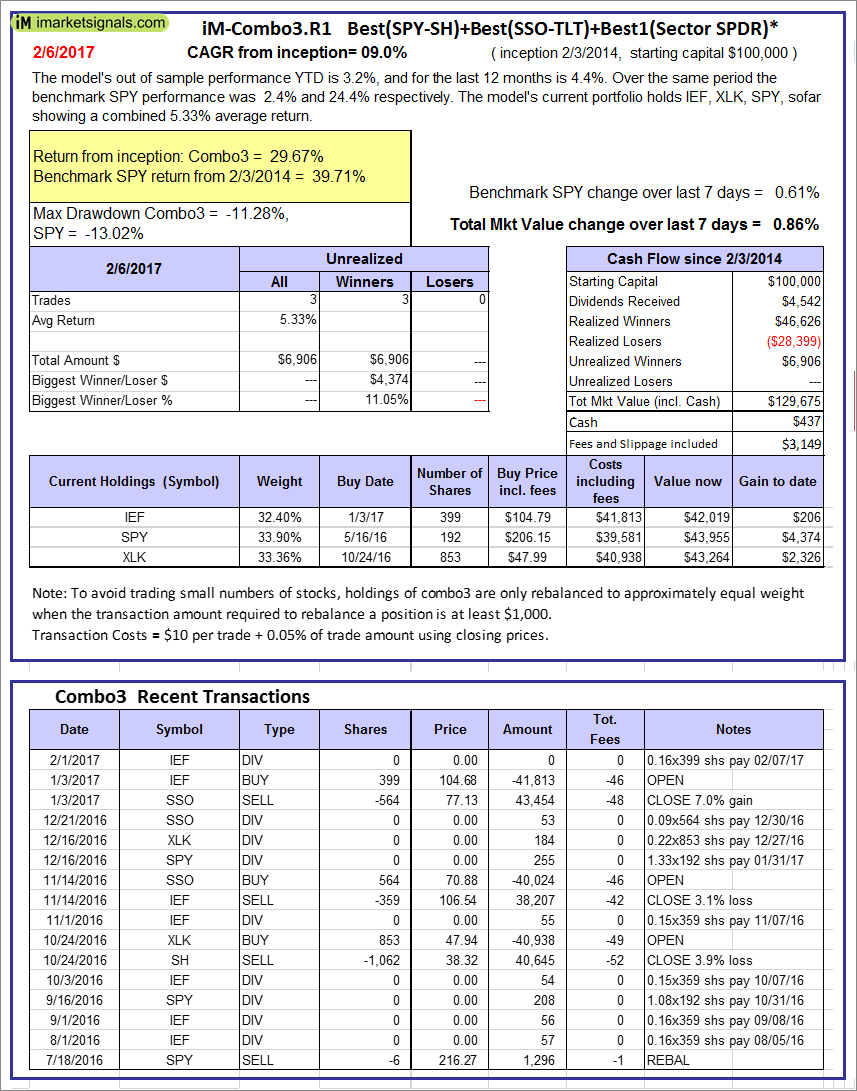
iM-Combo3.R1: The model’s out of sample performance YTD is 3.2%, and for the last 12 months is 4.4%. Over the same period the benchmark SPY performance was 2.4% and 24.4% respectively. Over the previous week the market value of iM-Combo3.R1 gained 0.86% at a time when SPY gained 0.61%. A starting capital of $100,000 at inception on 2/3/2014 would have grown to $129,675 which includes $437 cash and excludes $3,149 spent on fees and slippage. |
|
|
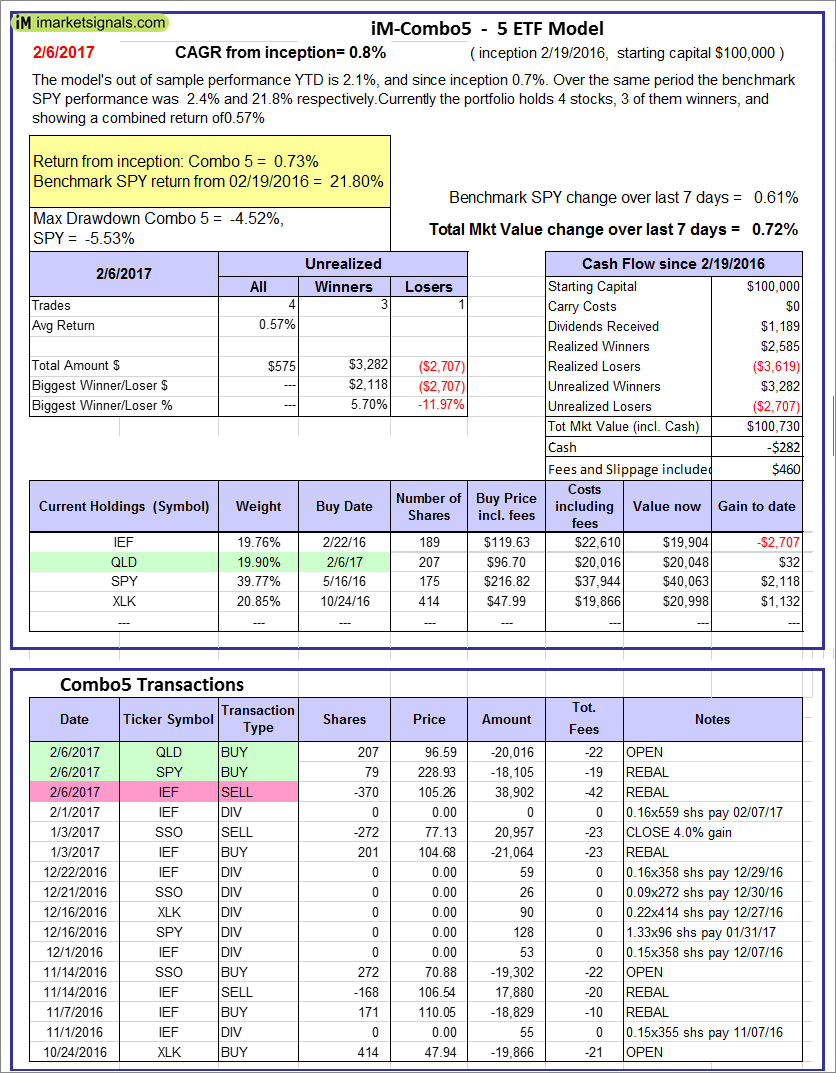
iM-Combo5: The model’s out of sample performance YTD is 2.1%, and since inception 0.7%. Over the same period the benchmark SPY performance was 2.4% and 21.8% respectively. Over the previous week the market value of iM-Combo5 gained 0.72% at a time when SPY gained 0.61%. A starting capital of $100,000 at inception on 2/22/2016 would have grown to $100,730 which includes -$282 cash and excludes $460 spent on fees and slippage. |
|
|
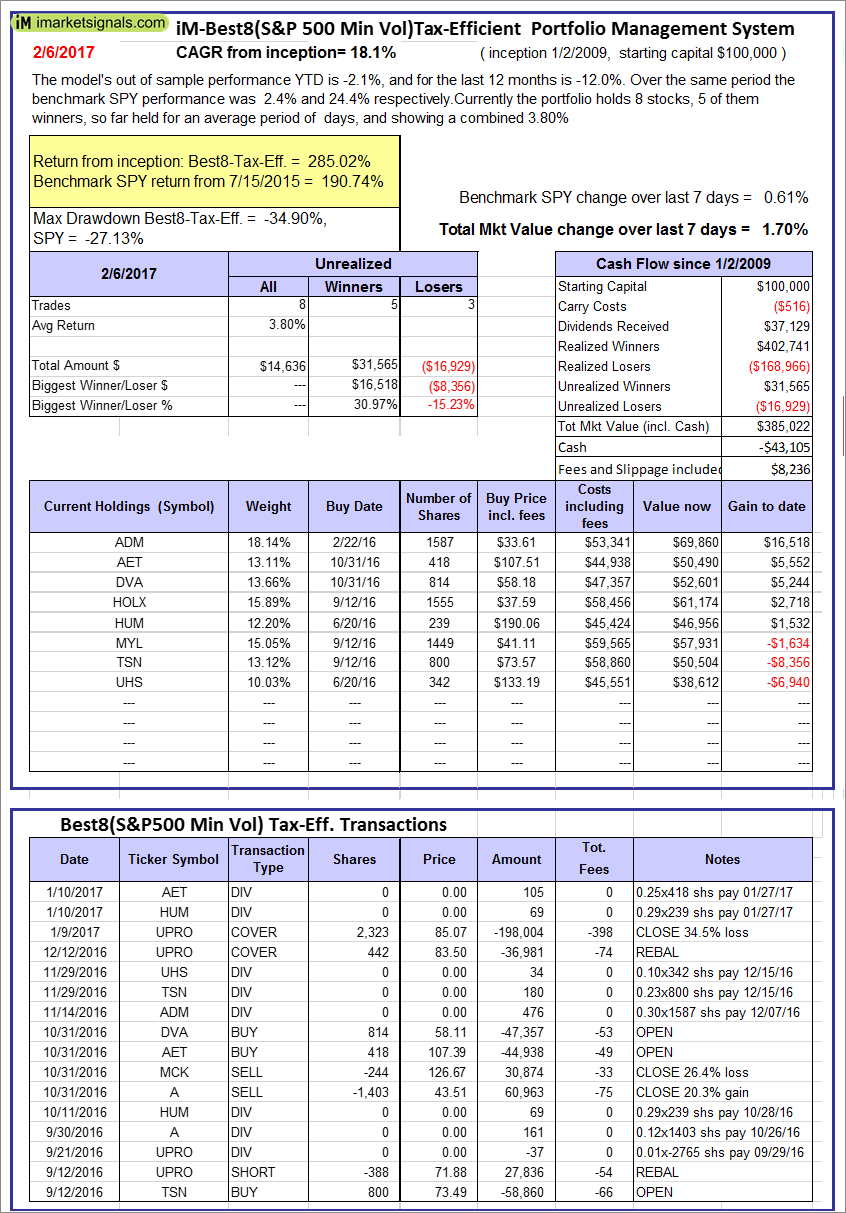
The iM-Best8(S&P500 Min Vol)Tax-Efficient The model’s out of sample performance YTD is -2.1%, and for the last 12 months is -12.0%. Over the same period the benchmark SPY performance was 2.4% and 24.4% respectively. Over the previous week the market value of iM-Best8(S&P 500)Tax-Eff. gained 1.70% at a time when SPY gained 0.61%. A starting capital of $100,000 at inception on 1/2/2009 would have grown to $385,022 which includes -$43,105 cash and excludes $8,236 spent on fees and slippage. |
|
|
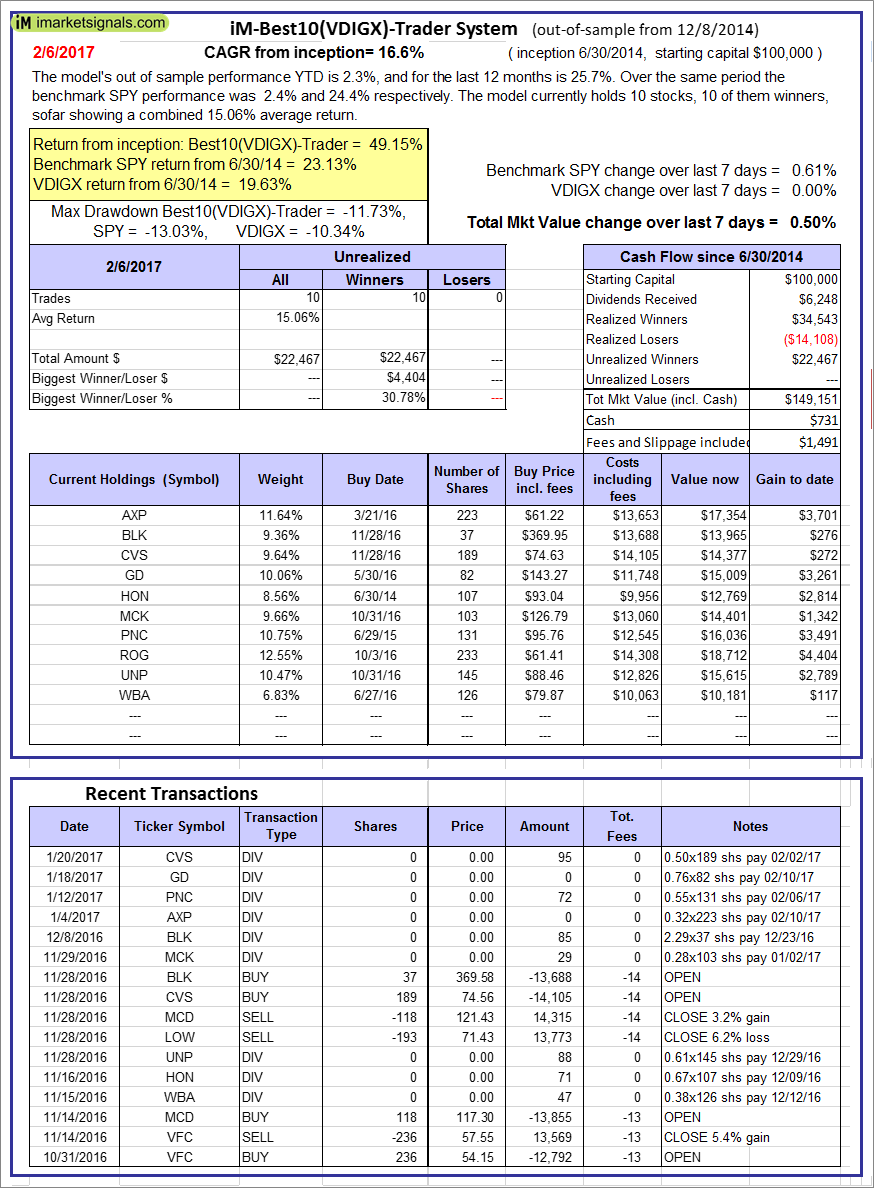
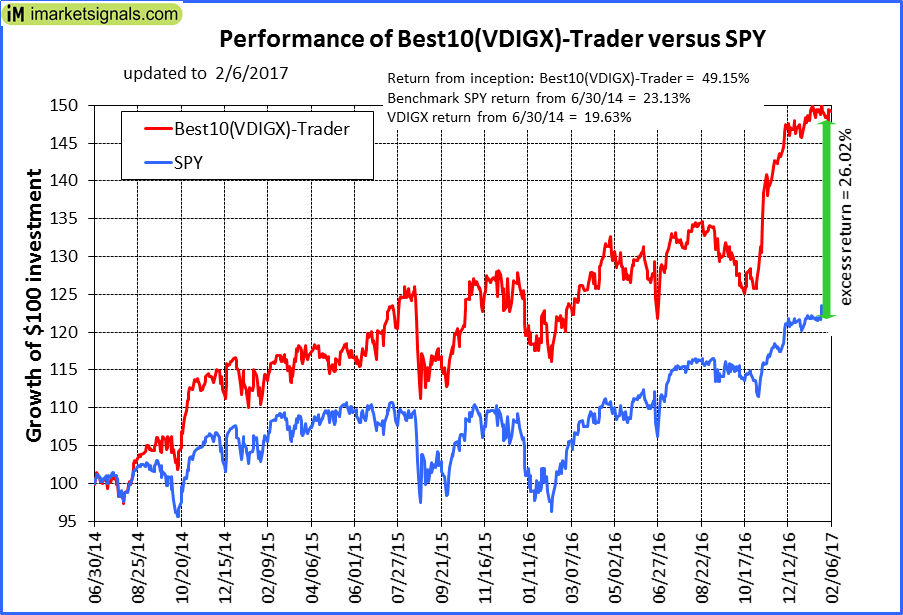
iM-Best10(VDIGX)-Trader: The model’s out of sample performance YTD is 2.3%, and for the last 12 months is 25.7%. Over the same period the benchmark SPY performance was 2.4% and 24.4% respectively. Since inception, on 7/1/2014, the model gained 49.15% while the benchmark SPY gained 23.13% and VDIGX gained 19.63% over the same period. Over the previous week the market value of iM-Best10(VDIGX) gained 0.50% at a time when SPY gained 0.61%. A starting capital of $100,000 at inception on 7/1/2014 would have grown to $149,151 which includes $731 cash and excludes $1,491 spent on fees and slippage. |
|
|
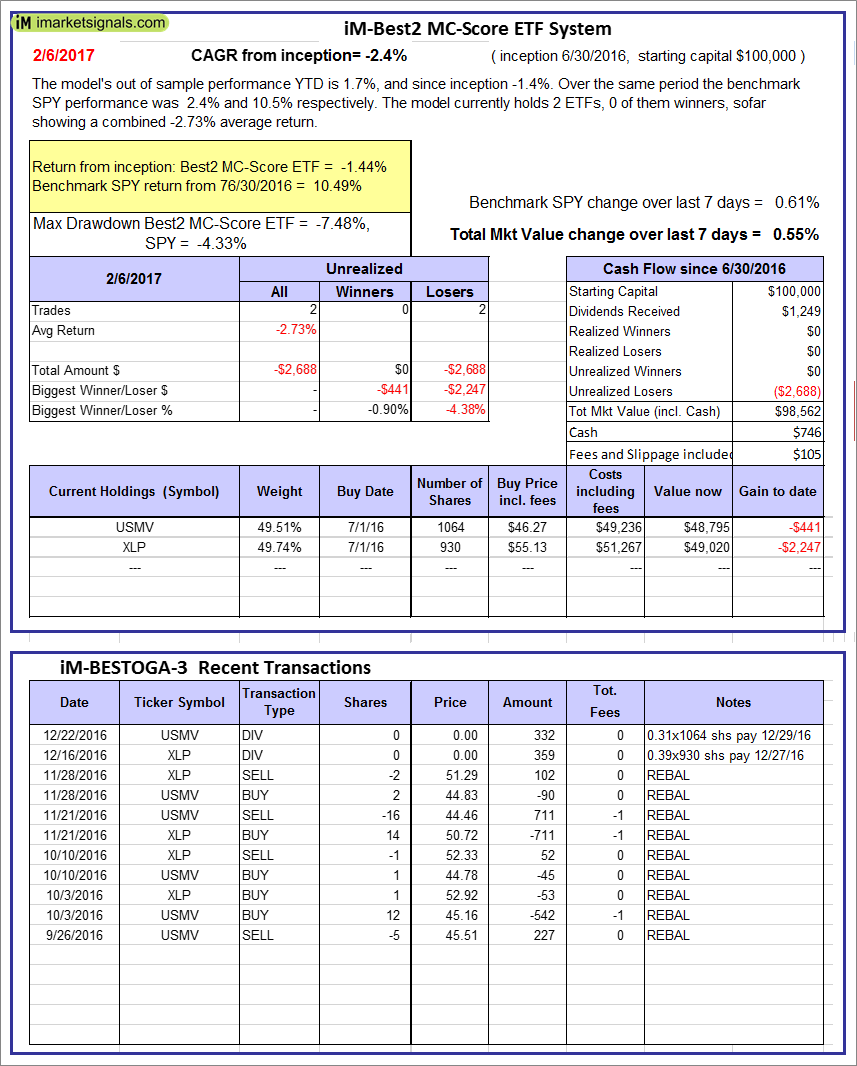
iM-Best2 MC-Score ETF System: The model’s out of sample performance YTD is 1.7%, and since inception -1.4%. Over the same period the benchmark SPY performance was 2.4% and 10.5% respectively. Over the previous week the market value of iM-BESTOGA-3 gained 0.55% at a time when SPY gained 0.61%. A starting capital of $100,000 at inception on 2/3/2014 would have grown to $746 which includes $105 cash and excludes Gain to date spent on fees and slippage. |
|
|
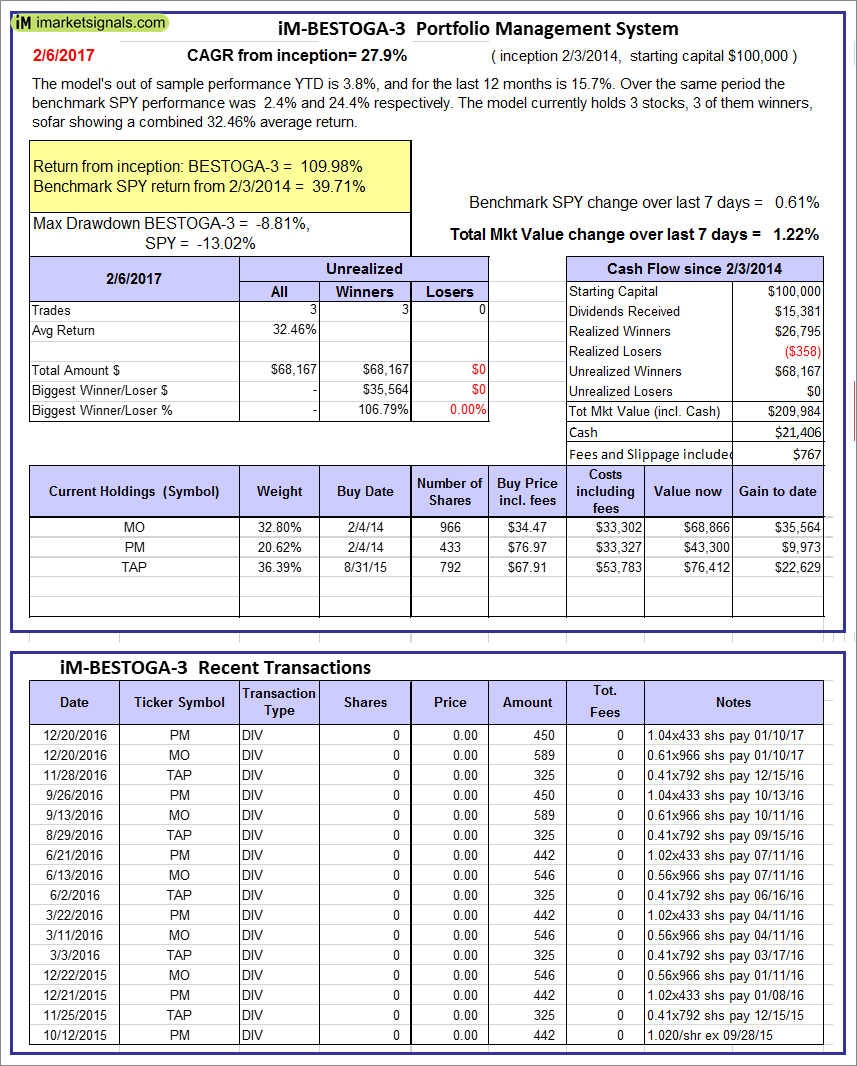
iM-BESTOGA-3: The model’s out of sample performance YTD is 3.8%, and for the last 12 months is 15.7%. Over the same period the benchmark SPY performance was 2.4% and 24.4% respectively. Over the previous week the market value of iM-BESTOGA-3 gained 1.22% at a time when SPY gained 0.61%. A starting capital of $100,000 at inception on 2/3/2014 would have grown to $209,984 which includes $21,406 cash and excludes $767 spent on fees and slippage. |
|
|
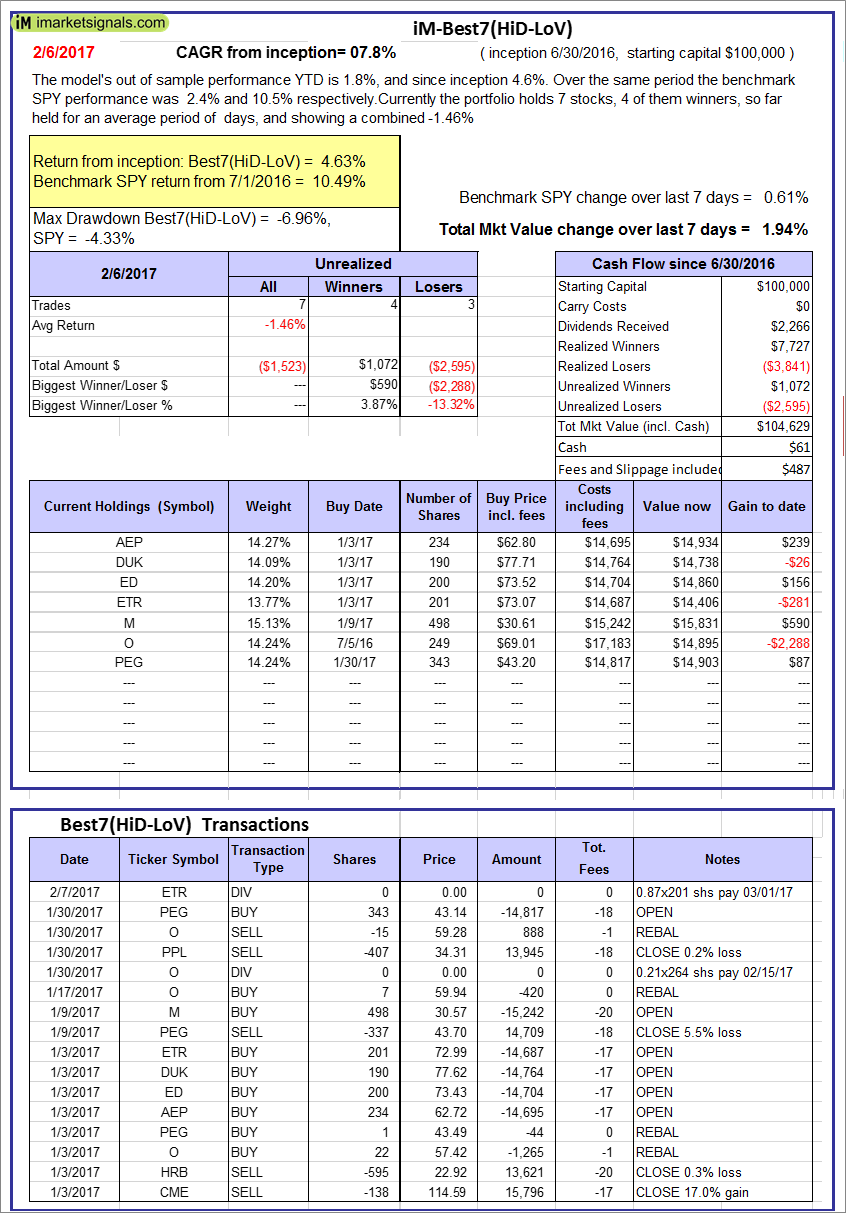
iM-Best7(HiD-LoV): The model’s out of sample performance YTD is 1.8%, and since inception 4.6%. Over the same period the benchmark SPY performance was 2.4% and 10.5% respectively. Over the previous week the market value of iM-BESTOGA-3 gained 1.94% at a time when SPY gained 0.61%. A starting capital of $100,000 at inception on 2/3/2014 would have grown to $104,629 which includes $61 cash and excludes $487 spent on fees and slippage. |
|
|
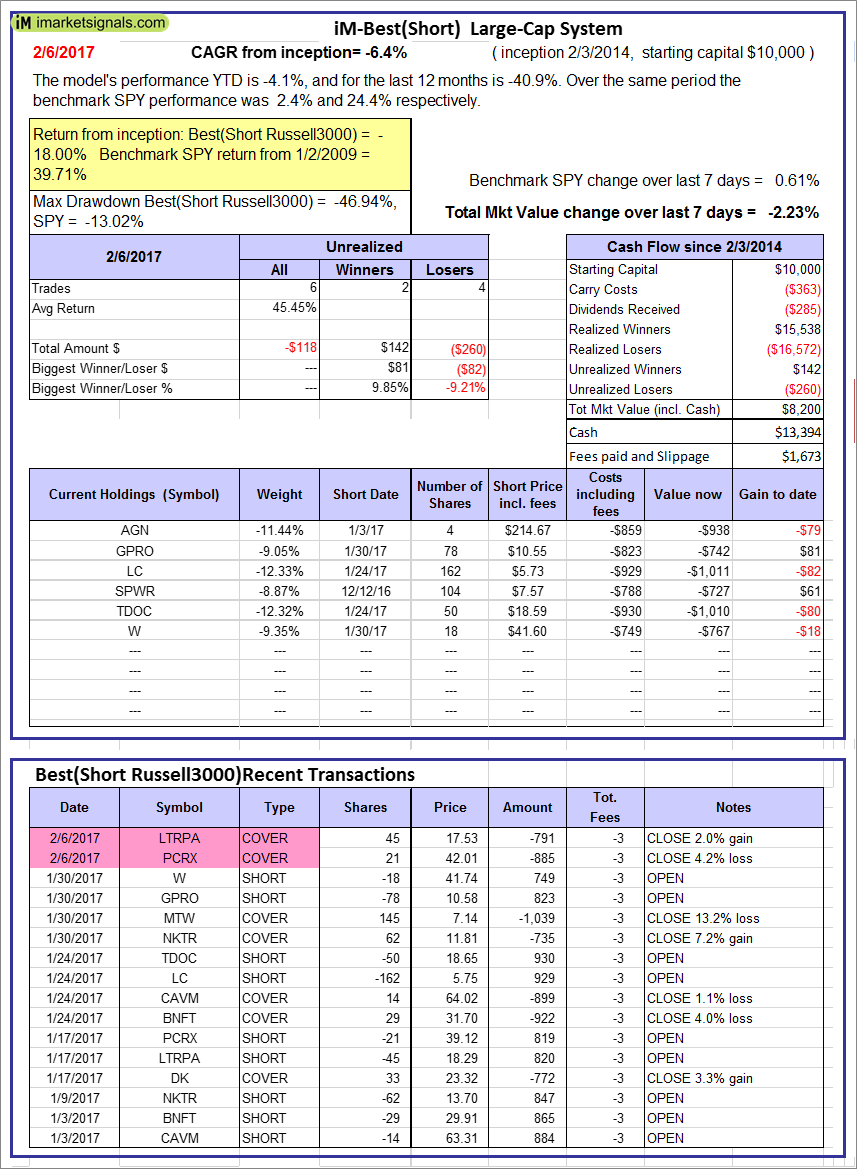
iM-Best10(Short Russell3000): The model’s performance YTD is -4.1%, and for the last 12 months is -40.9%. Over the same period the benchmark SPY performance was 2.4% and 24.4% respectively. Over the previous week the market value of iM-Best10(Short Russell3000) gained -2.23% at a time when SPY gained 0.61%. Over the period 2/3/2014 to 2/6/2017 the starting capital of $100,000 would have grown to $8,200 which includes $13,394 cash and excludes $1,673 spent on fees and slippage. |
|
|
iM-BestogaX5-System: The model’s out of sample performance YTD is 2.9%, and since inception 1.4%. Over the same period the benchmark SPY performance was 2.4% and 14.5% respectively. Over the previous week the market value of iM-Best8(S&P 500)Tax-Eff. gained 0.75% at a time when SPY gained 0.61%. A starting capital of $100,000 at inception on 1/2/2009 would have grown to $101,390 which includes $540 cash and excludes $488 spent on fees and slippage. |
|
|
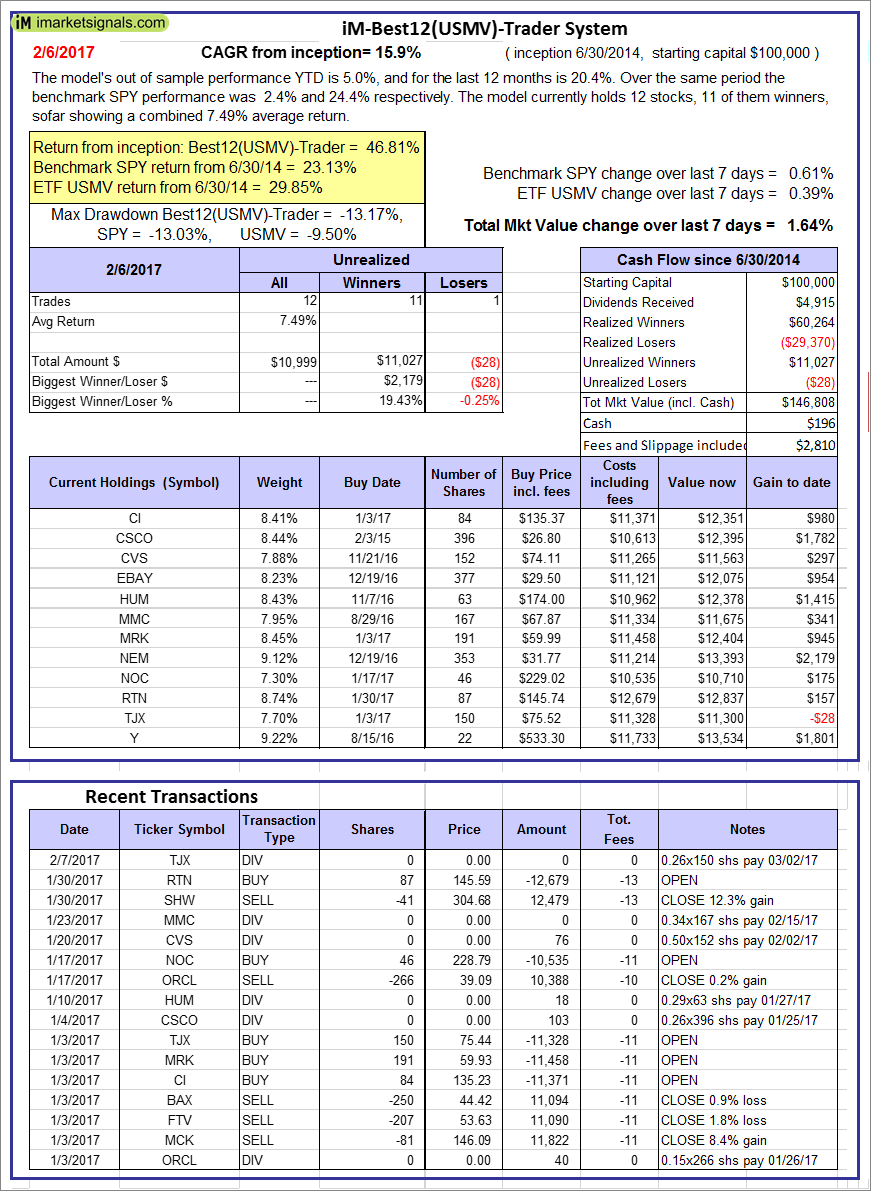
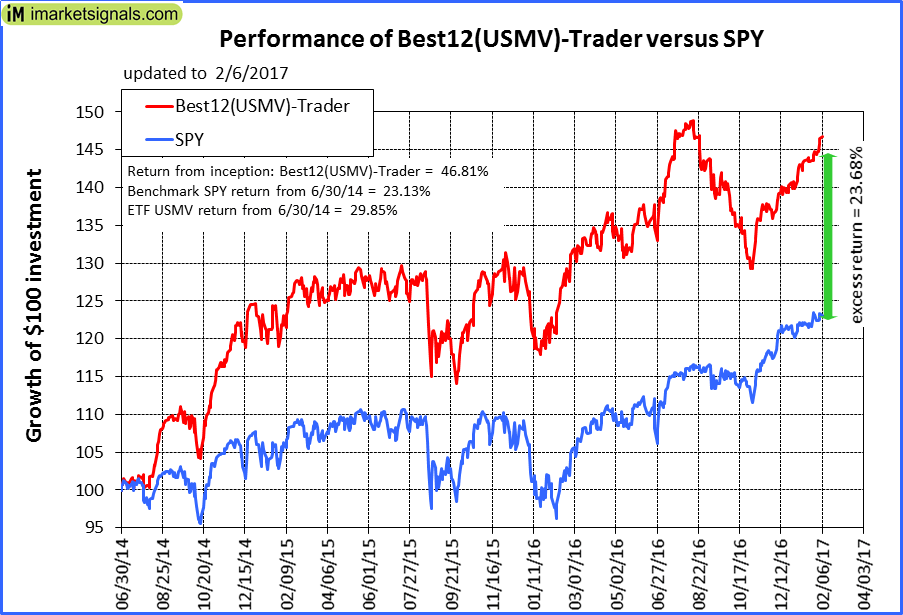
iM-Best12(USMV)-Trader: The model’s out of sample performance YTD is 5.0%, and for the last 12 months is 20.4%. Over the same period the benchmark SPY performance was 2.4% and 24.4% respectively. Since inception, on 7/1/2014, the model gained 46.81% while the benchmark SPY gained 23.13% and the ETF USMV gained 29.85% over the same period. Over the previous week the market value of iM-Best12(USMV)-Trader gained 1.64% at a time when SPY gained 0.61%. A starting capital of $100,000 at inception on 7/1/2014 would have grown to $146,808 which includes $196 cash and excludes $2,810 spent on fees and slippage. |
|
|
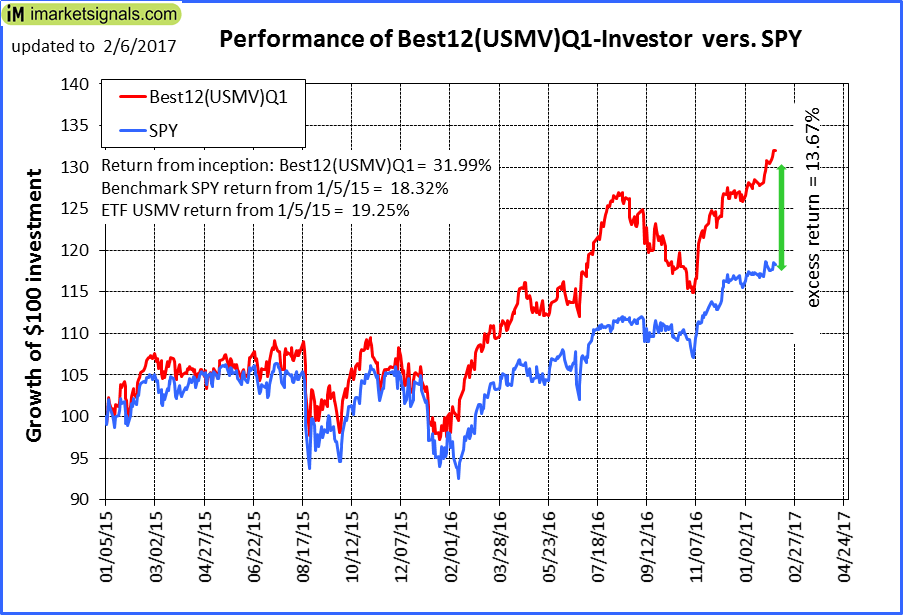
iM-Best12(USMV)Q1-Investor: The model’s out of sample performance YTD is 4.9%, and for the last 12 months is 31.3%. Over the same period the benchmark SPY performance was 2.4% and 24.4% respectively. Since inception, on 1/5/2015, the model gained 31.99% while the benchmark SPY gained 18.32% and the ETF USMV gained 19.25% over the same period. Over the previous week the market value of iM-Best12(USMV)Q1 gained 1.15% at a time when SPY gained 0.61%. A starting capital of $100,000 at inception on 1/5/2015 would have grown to $131,993 which includes $195 cash and excludes $662 spent on fees and slippage. |
|
|
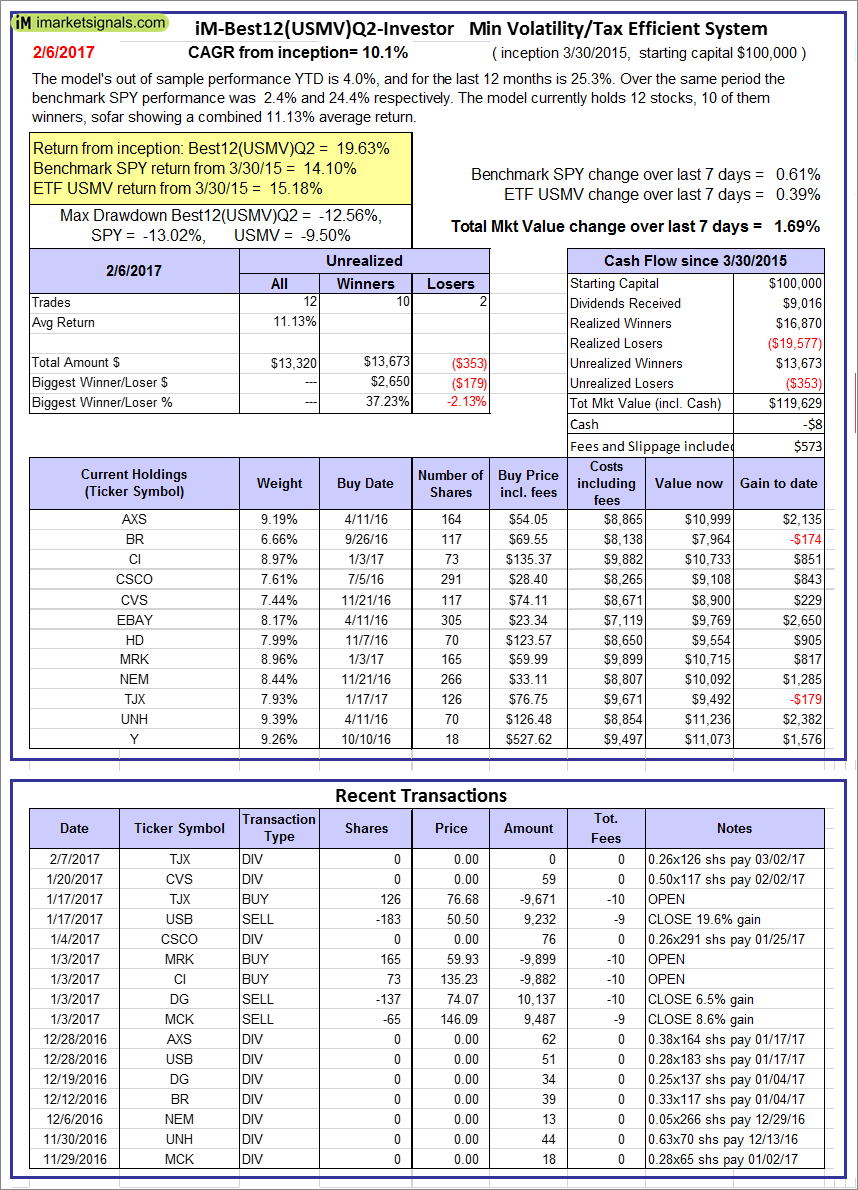
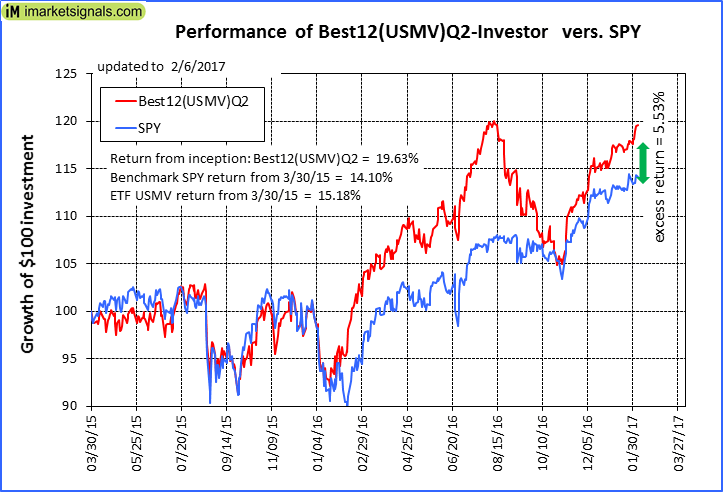
iM-Best12(USMV)Q2-Investor: The model’s out of sample performance YTD is 4.0%, and for the last 12 months is 25.3%. Over the same period the benchmark SPY performance was 2.4% and 24.4% respectively. Since inception, on 3/31/2015, the model gained 19.63% while the benchmark SPY gained 14.10% and the ETF USMV gained 15.18% over the same period. Over the previous week the market value of iM-Best12(USMV)Q2 gained 1.69% at a time when SPY gained 0.61%. A starting capital of $100,000 at inception on 3/31/2015 would have grown to $119,629 which includes -$8 cash and excludes $573 spent on fees and slippage. |
|
|
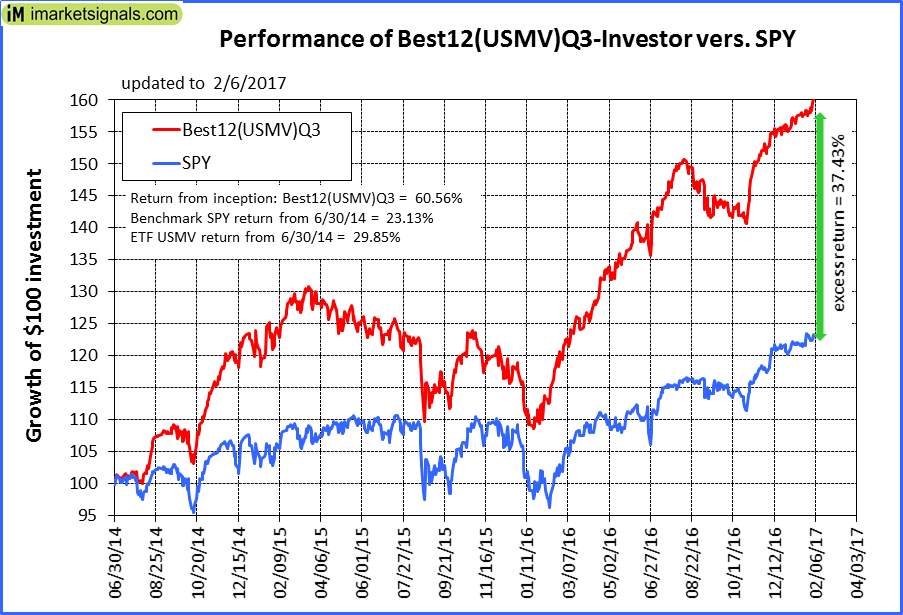
iM-Best12(USMV)Q3-Investor: The model’s out of sample performance YTD is 3.6%, and for the last 12 months is 41.7%. Over the same period the benchmark SPY performance was 2.4% and 24.4% respectively. Since inception, on 7/1/2014, the model gained 60.56% while the benchmark SPY gained 23.13% and the ETF USMV gained 29.85% over the same period. Over the previous week the market value of iM-Best12(USMV)Q3 gained 1.65% at a time when SPY gained 0.61%. A starting capital of $100,000 at inception on 7/1/2014 would have grown to $160,564 which includes -$93 cash and excludes $916 spent on fees and slippage. |
|
|
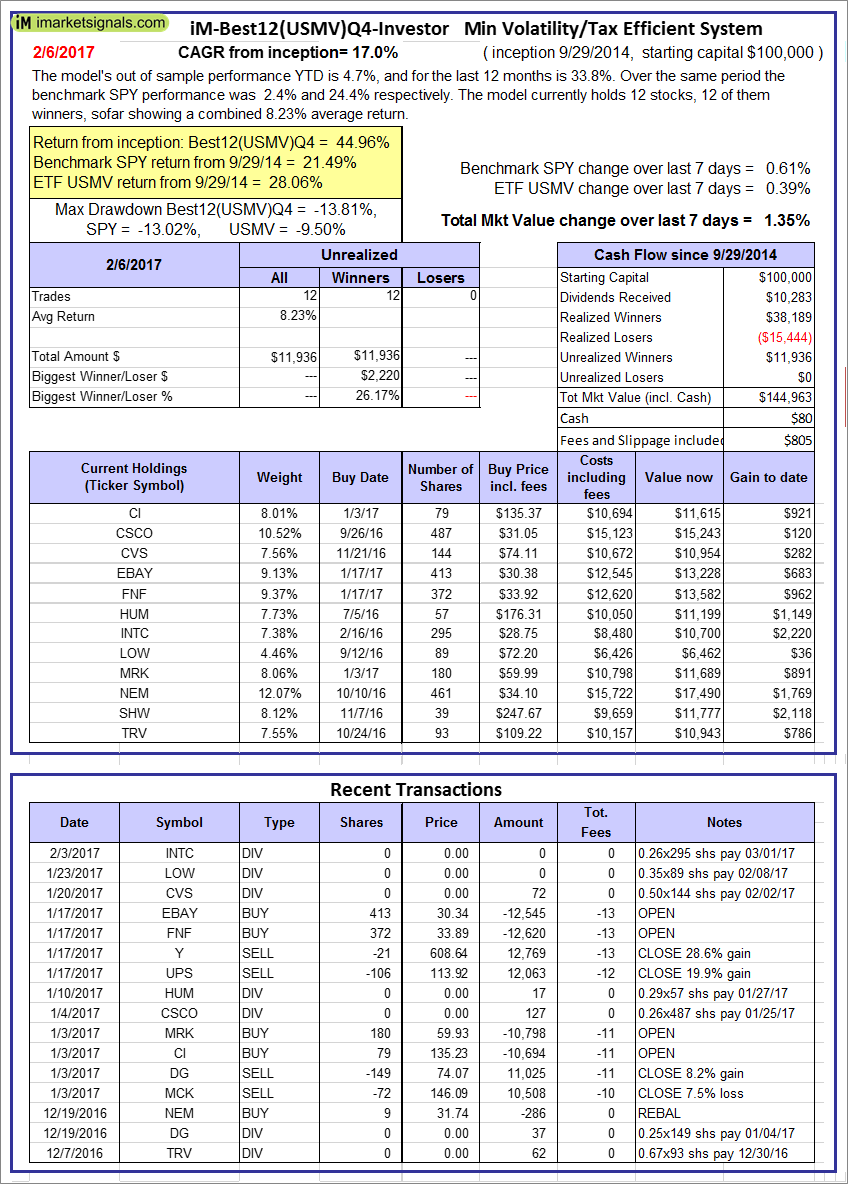
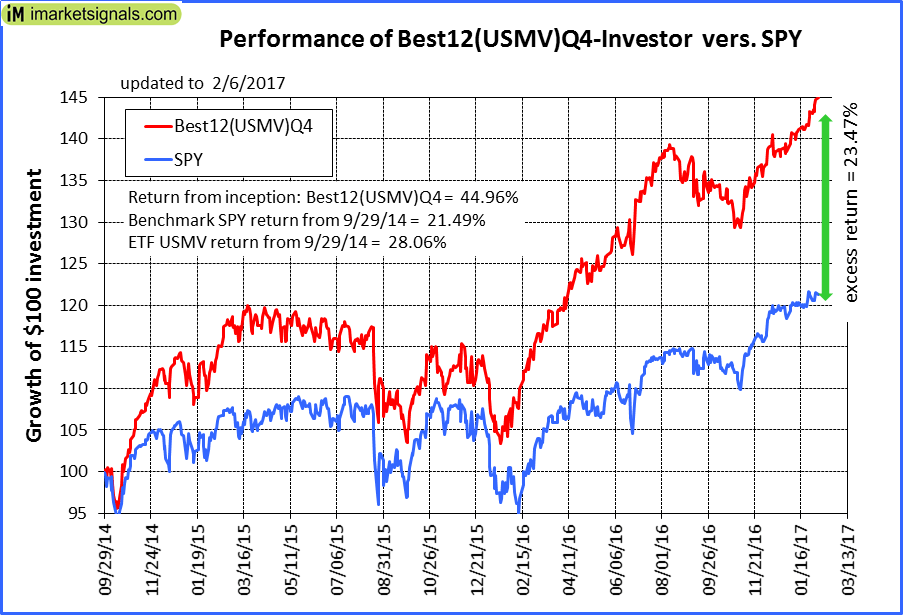
iM-Best12(USMV)Q4-Investor: Since inception, on 9/30/2014, the model gained 44.96% while the benchmark SPY gained 21.49% and the ETF USMV gained 28.06% over the same period. Over the previous week the market value of iM-Best12(USMV)Q4 gained 1.35% at a time when SPY gained 0.61%. A starting capital of $100,000 at inception on 9/30/2014 would have grown to $144,963 which includes $80 cash and excludes $805 spent on fees and slippage. |
|
|
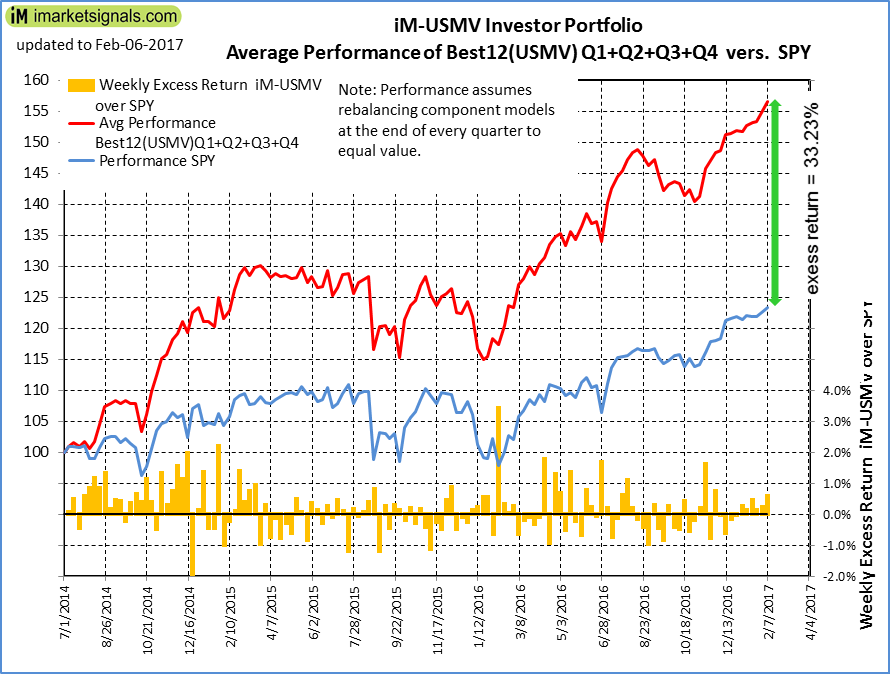
Average Performance of iM-Best12(USMV)Q1+Q2+Q3+Q4-Investor resulted in an excess return of 33.23% over SPY. (see iM-USMV Investor Portfolio) |
|
|
iM-Best(Short): The model’s out of sample performance YTD is -1.1%, and for the last 12 months is -15.9%. Over the same period the benchmark SPY performance was 2.4% and 24.4% respectively. Over the previous week the market value of iM-Best(Short) gained -0.51% at a time when SPY gained 0.61%. Over the period 1/2/2009 to 2/6/2017 the starting capital of $100,000 would have grown to $95,684 which includes $114,996 cash and excludes $21,291 spent on fees and slippage. |


Leave a Reply
You must be logged in to post a comment.