
  |
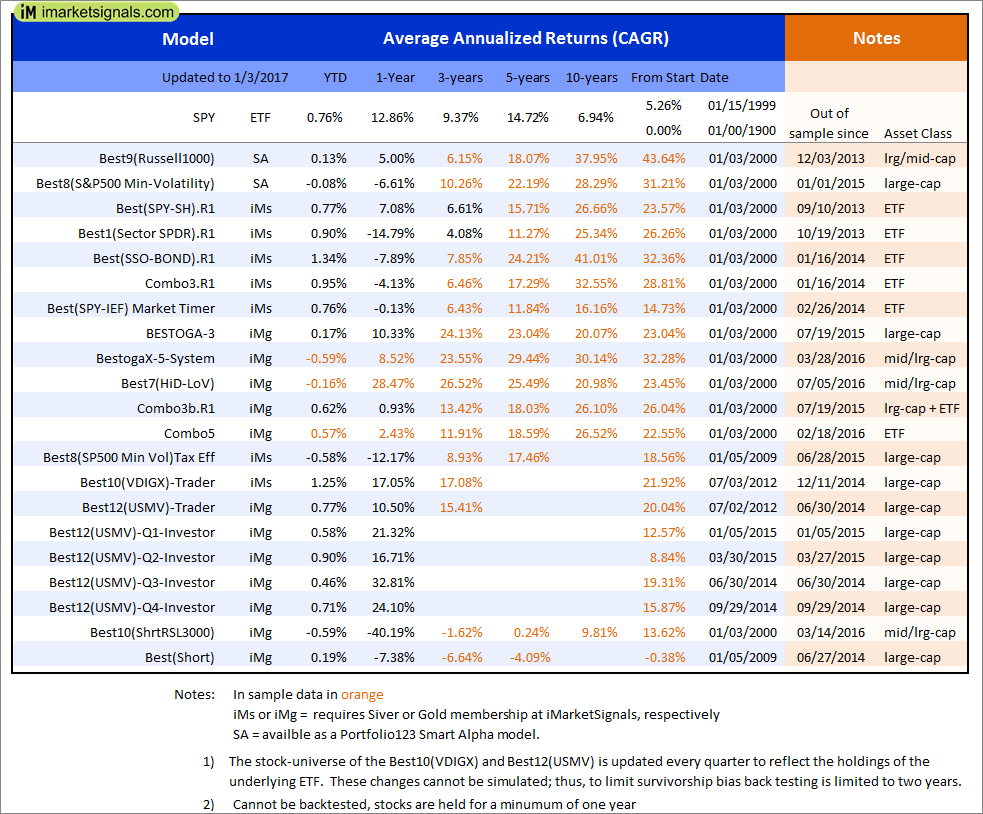
Out of sample performance summary of our models for the past 1, 2, 4 and 13 week periods. The active active return indicates how the models over- or underperformed the benchmark ETF SPY. Also the YTD, and the 1-, 3-, 5- and 10-year annualized returns are shown in the second table |
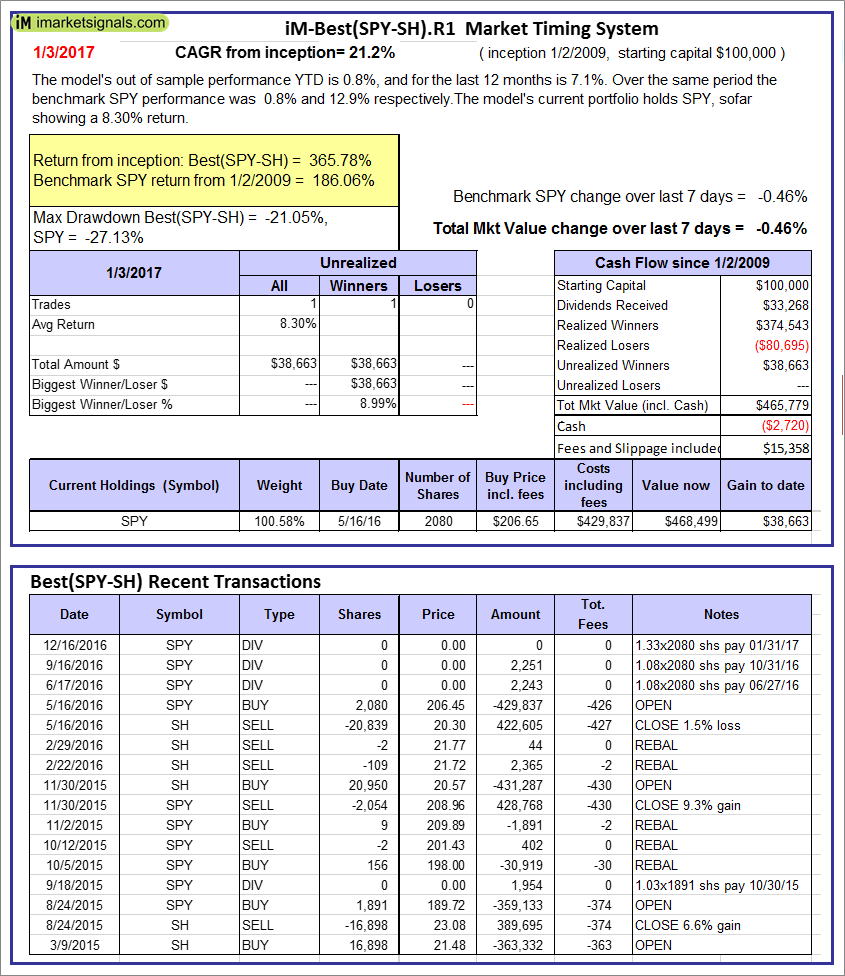 |
iM-Best(SPY-SH).R1: The model’s out of sample performance YTD is 0.8%, and for the last 12 months is 7.1%. Over the same period the benchmark SPY performance was 0.8% and 12.9% respectively. Over the previous week the market value of Best(SPY-SH) gained -0.46% at a time when SPY gained -0.46%. A starting capital of $100,000 at inception on 1/2/2009 would have grown to $465,779 which includes -$2,720 cash and excludes $15,358 spent on fees and slippage. |
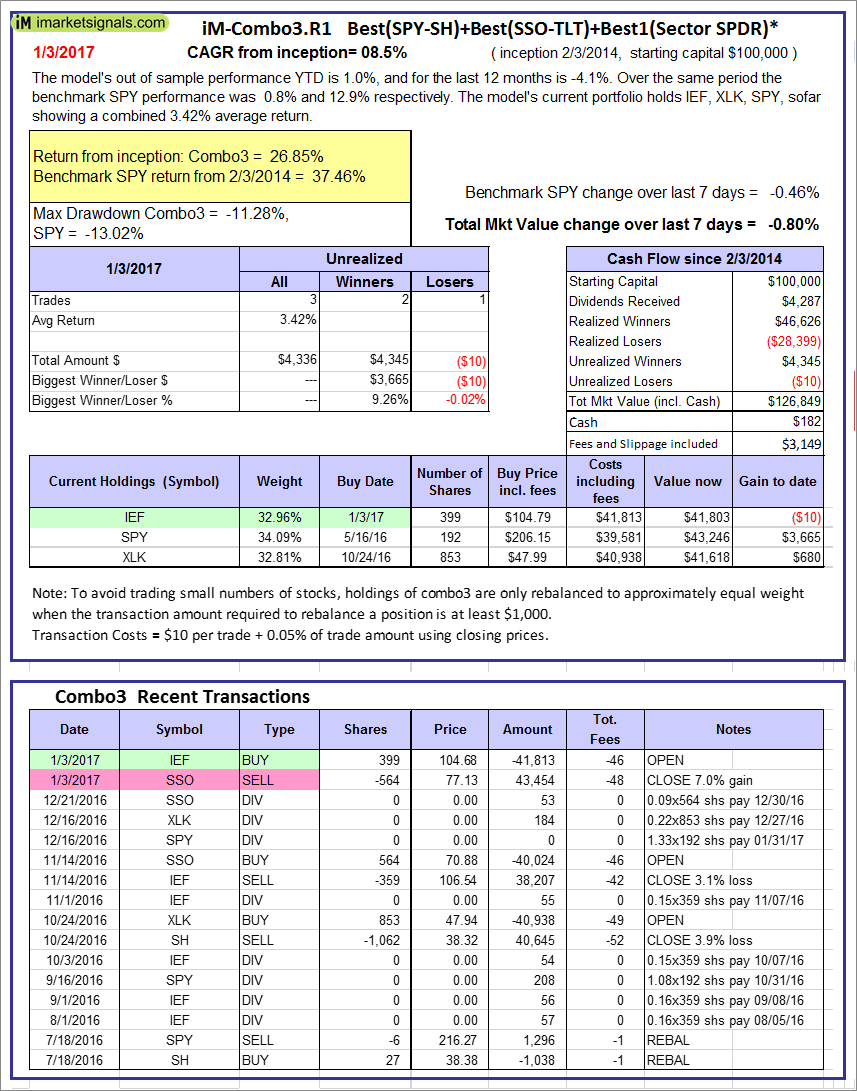 |
iM-Combo3.R1: The model’s out of sample performance YTD is 1.0%, and for the last 12 months is -4.1%. Over the same period the benchmark SPY performance was 0.8% and 12.9% respectively. Over the previous week the market value of iM-Combo3.R1 gained -0.80% at a time when SPY gained -0.46%. A starting capital of $100,000 at inception on 2/3/2014 would have grown to $126,849 which includes $182 cash and excludes $3,149 spent on fees and slippage. |
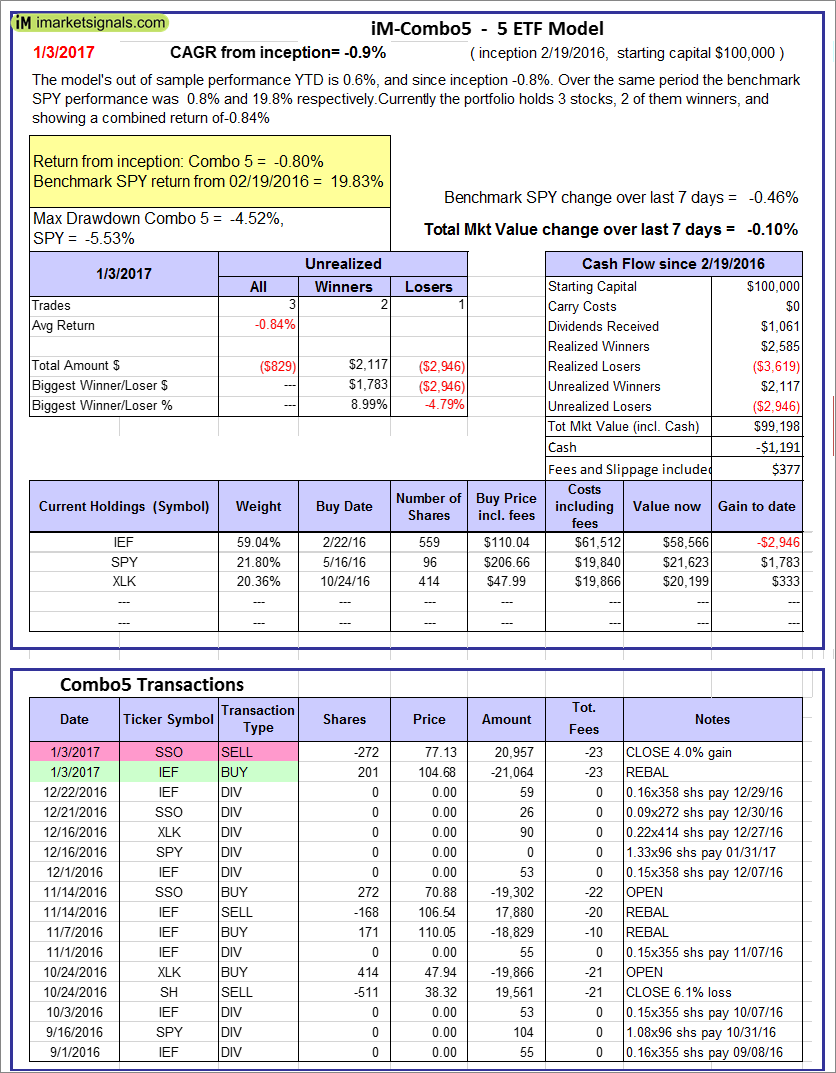 |
iM-Combo5: The model’s out of sample performance YTD is 0.6%, and since inception -0.8%. Over the same period the benchmark SPY performance was 0.8% and 19.8% respectively. Over the previous week the market value of iM-Combo5 gained -0.10% at a time when SPY gained -0.46%. A starting capital of $100,000 at inception on 2/22/2016 would have grown to $99,198 which includes -$1,191 cash and excludes $377 spent on fees and slippage. |
 |
The iM-Best8(S&P500 Min Vol)Tax-Efficient The model’s out of sample performance YTD is -0.6%, and for the last 12 months is -12.2%. Over the same period the benchmark SPY performance was 0.8% and 12.9% respectively. Over the previous week the market value of iM-Best8(S&P 500)Tax-Eff. gained 0.60% at a time when SPY gained -0.46%. A starting capital of $100,000 at inception on 1/2/2009 would have grown to $391,164 which includes $154,726 cash and excludes $7,837 spent on fees and slippage. |
 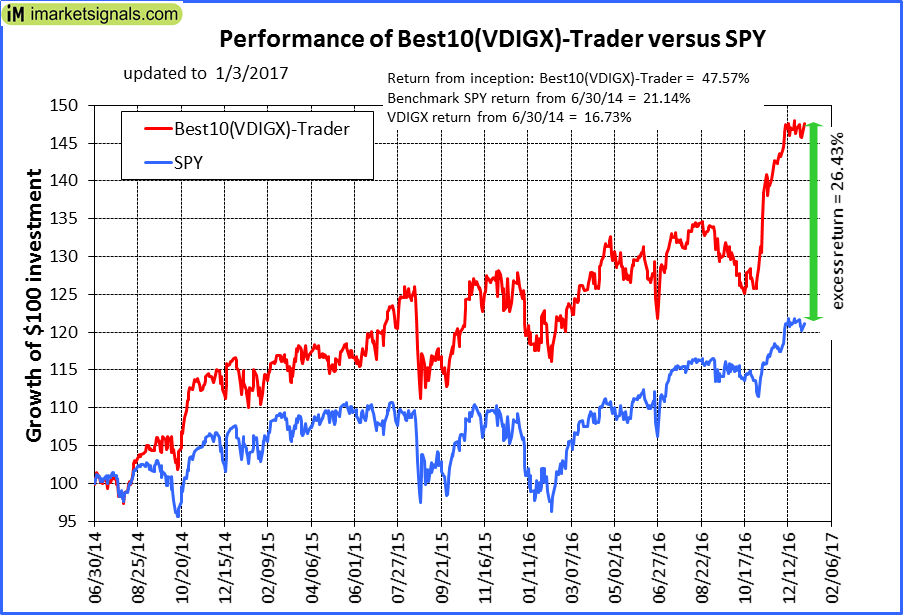 |
iM-Best10(VDIGX)-Trader: The model’s out of sample performance YTD is 1.2%, and for the last 12 months is 17.1%. Over the same period the benchmark SPY performance was 0.8% and 12.9% respectively. Since inception, on 7/1/2014, the model gained 47.57% while the benchmark SPY gained 21.14% and the ETF VDIGX gained 16.73% over the same period. Over the previous week the market value of iM-Best10(VDIGX) gained 0.09% at a time when SPY gained -0.46%. A starting capital of $100,000 at inception on 7/1/2014 would have grown to $147,429 which includes $428 cash and excludes $1,491 spent on fees and slippage. |
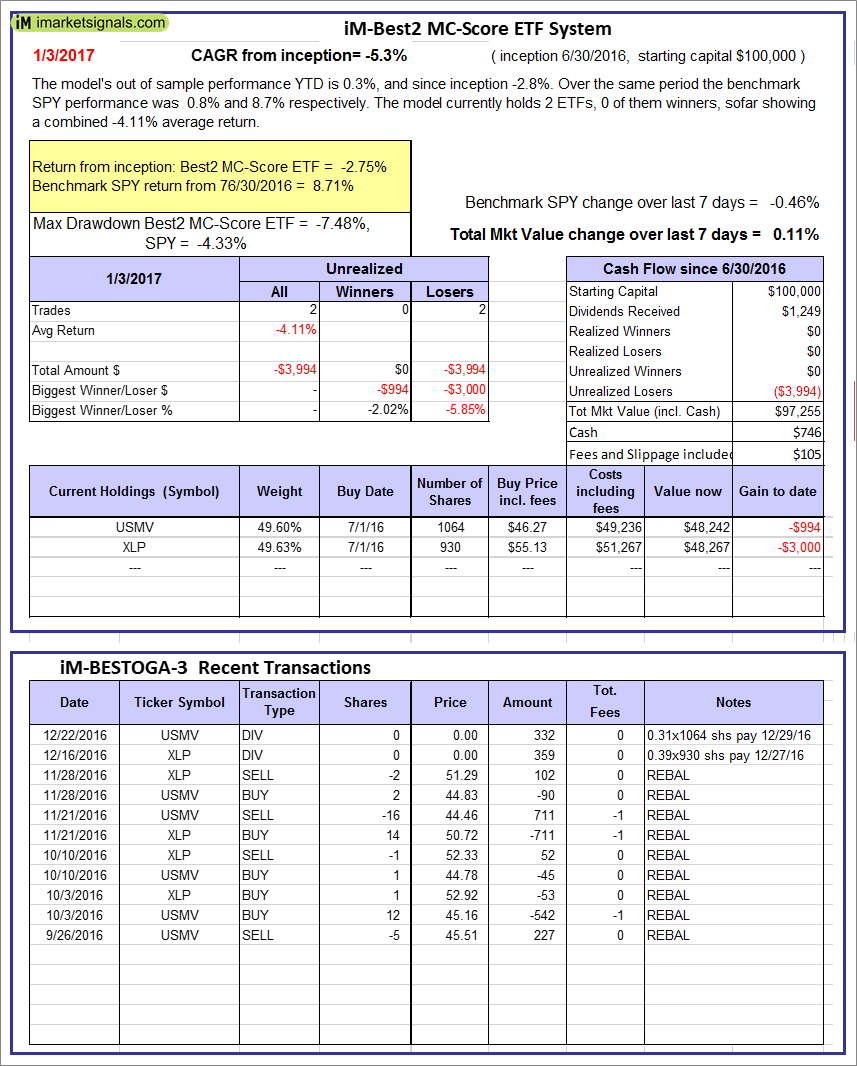 |
iM-Best2 MC-Score ETF System: The model’s out of sample performance YTD is 0.3%, and since inception -2.8%. Over the same period the benchmark SPY performance was 0.8% and 8.7% respectively. Over the previous week the market value of iM-BESTOGA-3 gained 0.11% at a time when SPY gained -0.46%. A starting capital of $100,000 at inception on 2/3/2014 would have grown to $746 which includes $105 cash and excludes Gain to date spent on fees and slippage. |
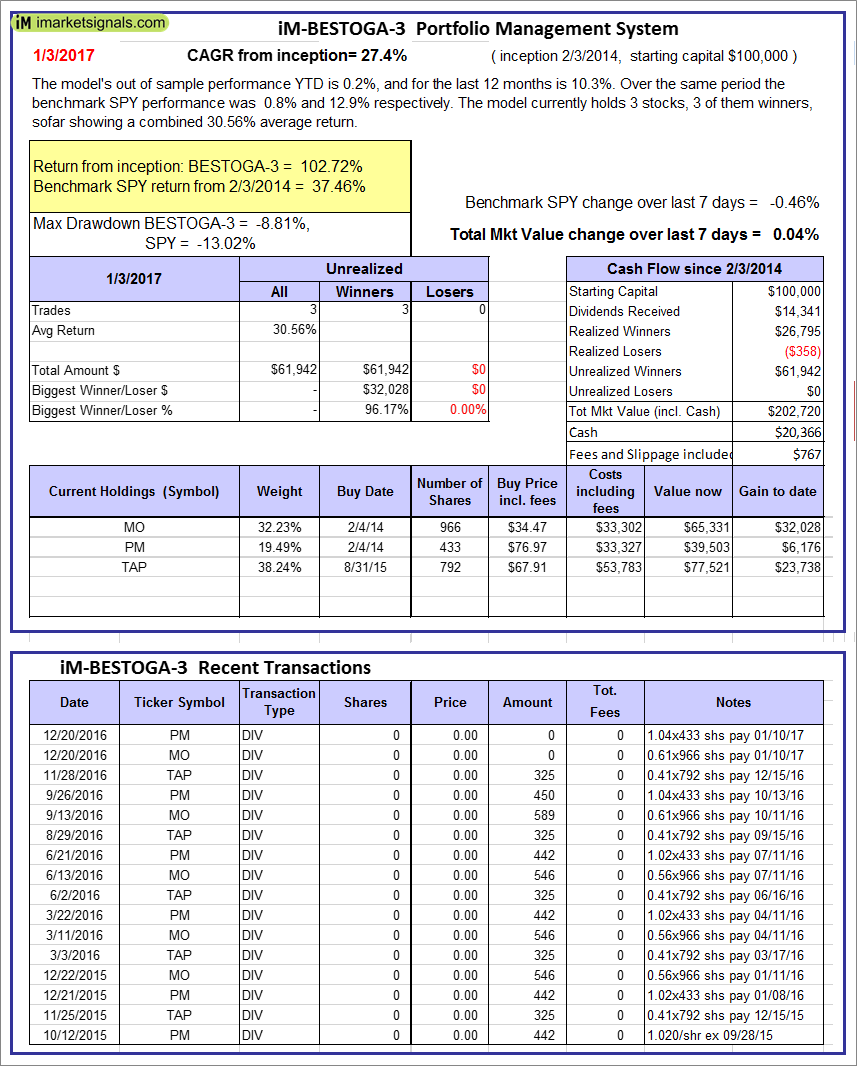 |
iM-BESTOGA-3: The model’s out of sample performance YTD is 0.2%, and for the last 12 months is 10.3%. Over the same period the benchmark SPY performance was 0.8% and 12.9% respectively. Over the previous week the market value of iM-BESTOGA-3 gained 0.04% at a time when SPY gained -0.46%. A starting capital of $100,000 at inception on 2/3/2014 would have grown to $202,720 which includes $20,366 cash and excludes $767 spent on fees and slippage. |
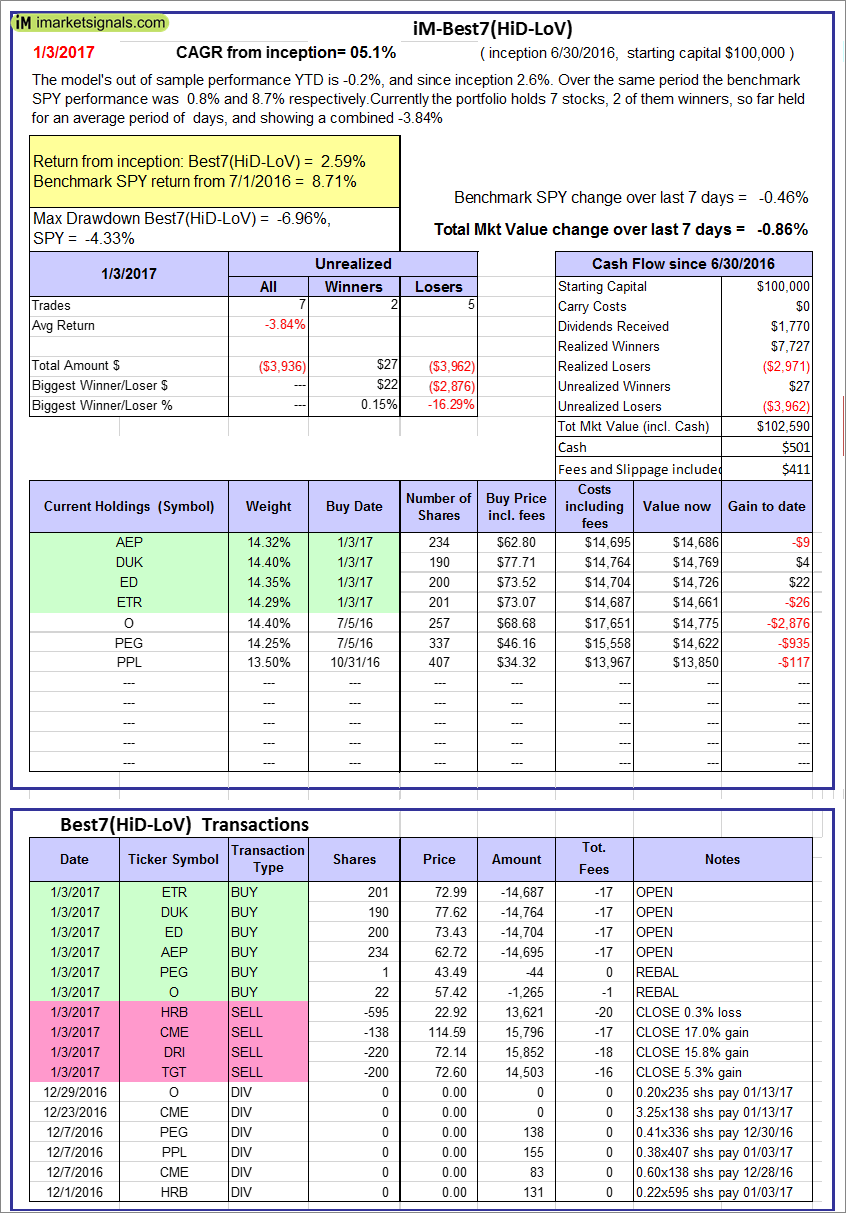 |
iM-Best7(HiD-LoV): The model’s out of sample performance YTD is -0.2%, and since inception 2.6%. Over the same period the benchmark SPY performance was 0.8% and 8.7% respectively. Over the previous week the market value of iM-BESTOGA-3 gained -0.86% at a time when SPY gained -0.46%. A starting capital of $100,000 at inception on 2/3/2014 would have grown to $102,590 which includes $501 cash and excludes $411 spent on fees and slippage. |
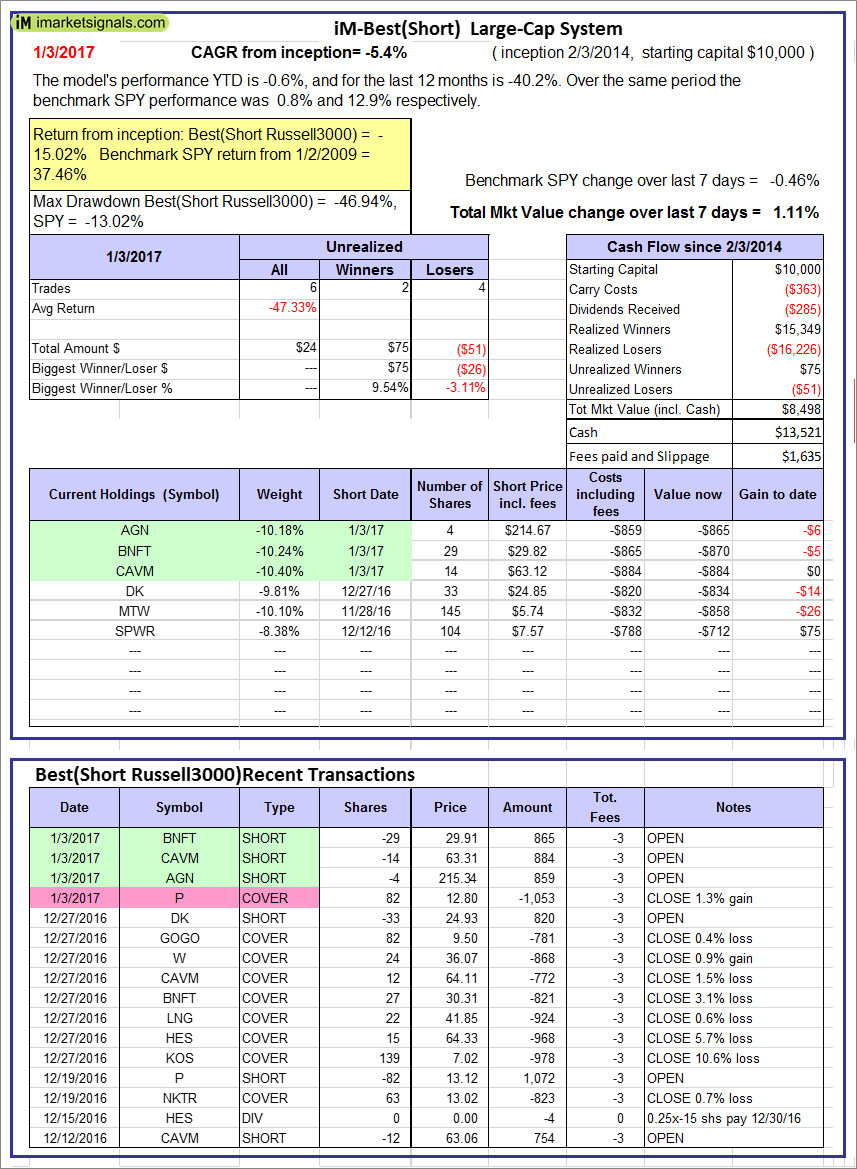 |
iM-Best10(Short Russell3000): The model’s performance YTD is -0.6%, and for the last 12 months is -40.2%. Over the same period the benchmark SPY performance was 0.8% and 12.9% respectively. Over the previous week the market value of iM-Best10(Short Russell3000) gained 1.11% at a time when SPY gained -0.46%. Over the period 2/3/2014 to 1/3/2017 the starting capital of $100,000 would have grown to $8,498 which includes $13,521 cash and excludes $1,635 spent on fees and slippage. |
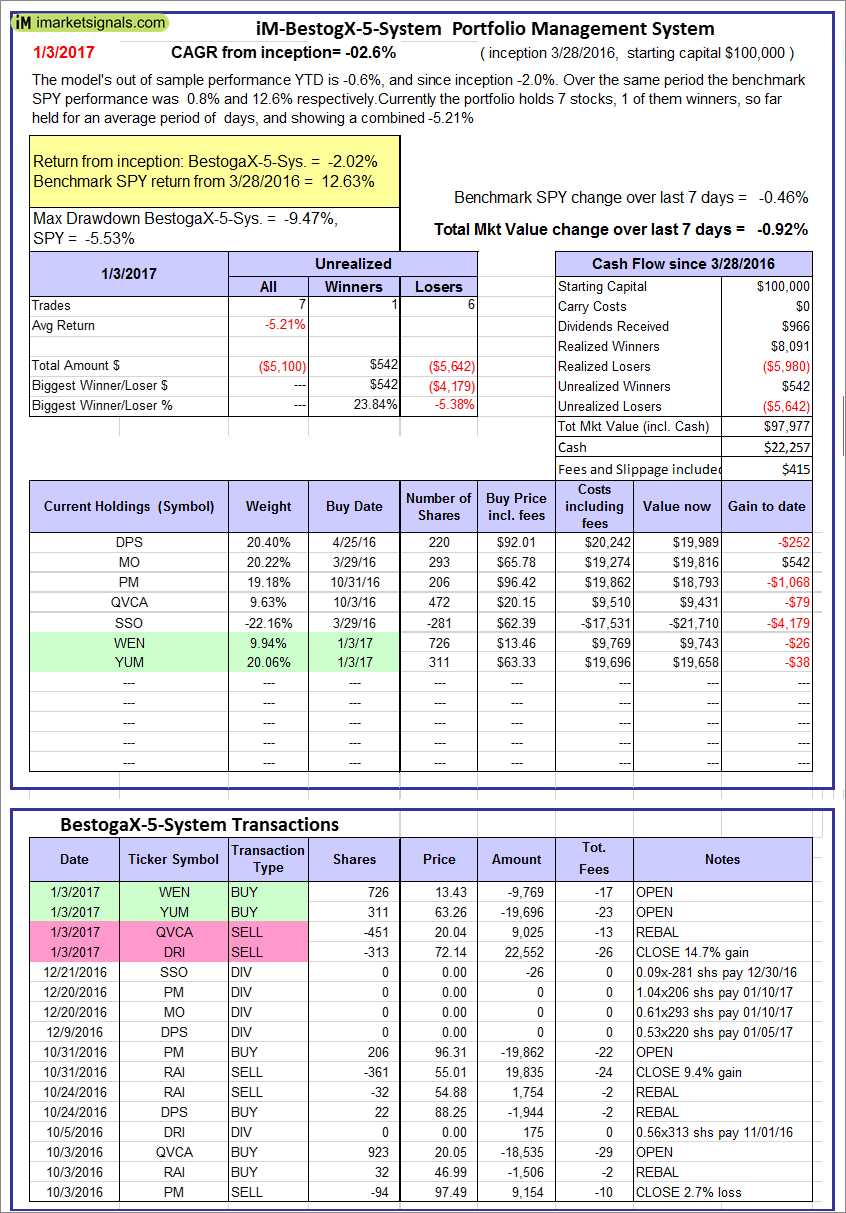 |
iM-BestogaX5-System: The model’s out of sample performance YTD is -0.6%, and since inception -2.0%. Over the same period the benchmark SPY performance was 0.8% and 12.6% respectively. Over the previous week the market value of iM-Best8(S&P 500)Tax-Eff. gained -0.92% at a time when SPY gained -0.46%. A starting capital of $100,000 at inception on 1/2/2009 would have grown to $97,977 which includes $22,257 cash and excludes $415 spent on fees and slippage. |
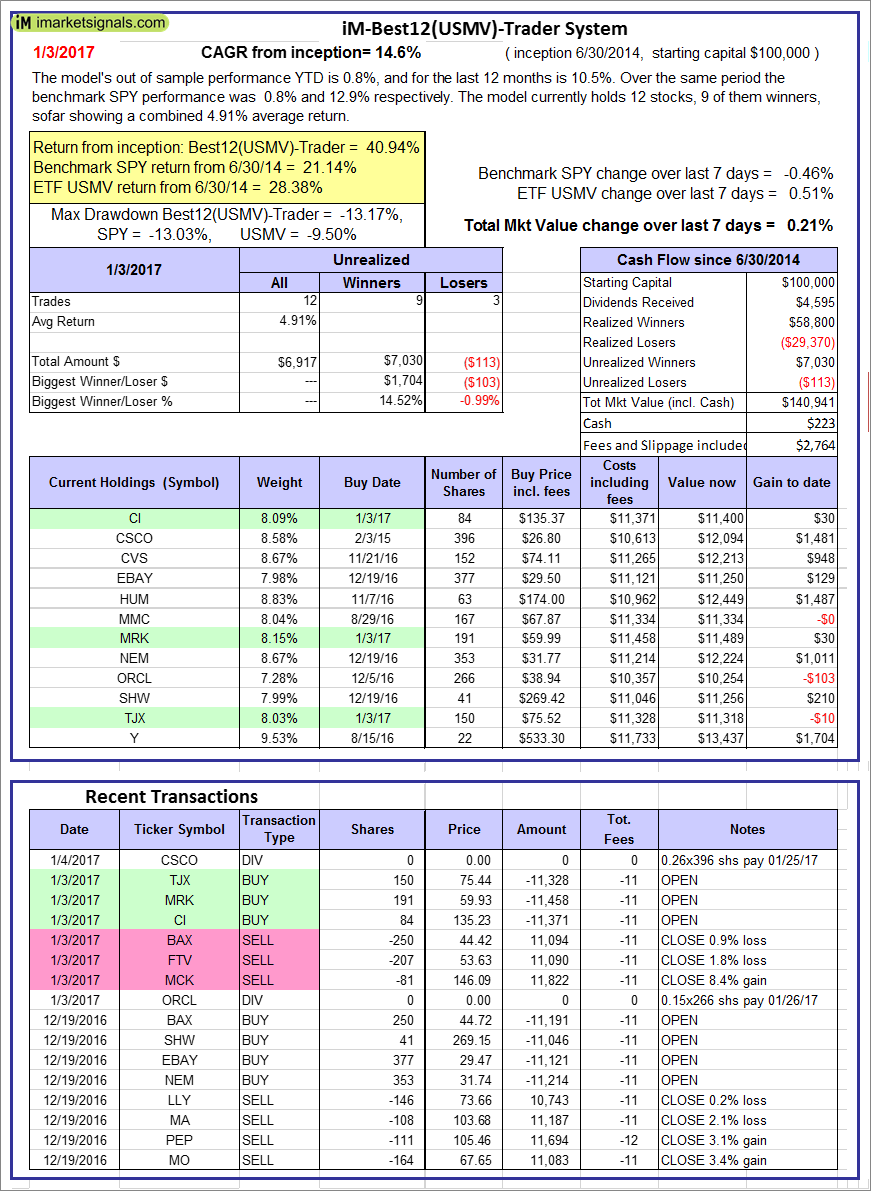  |
iM-Best12(USMV)-Trader: The model’s out of sample performance YTD is 0.8%, and for the last 12 months is 10.5%. Over the same period the benchmark SPY performance was 0.8% and 12.9% respectively. Since inception, on 7/1/2014, the model gained 40.94% while the benchmark SPY gained 21.14% and the ETF USMV gained 28.38% over the same period. Over the previous week the market value of iM-Best12(USMV)-Trader gained 0.21% at a time when SPY gained -0.46%. A starting capital of $100,000 at inception on 7/1/2014 would have grown to $140,941 which includes $223 cash and excludes $2,764 spent on fees and slippage. |
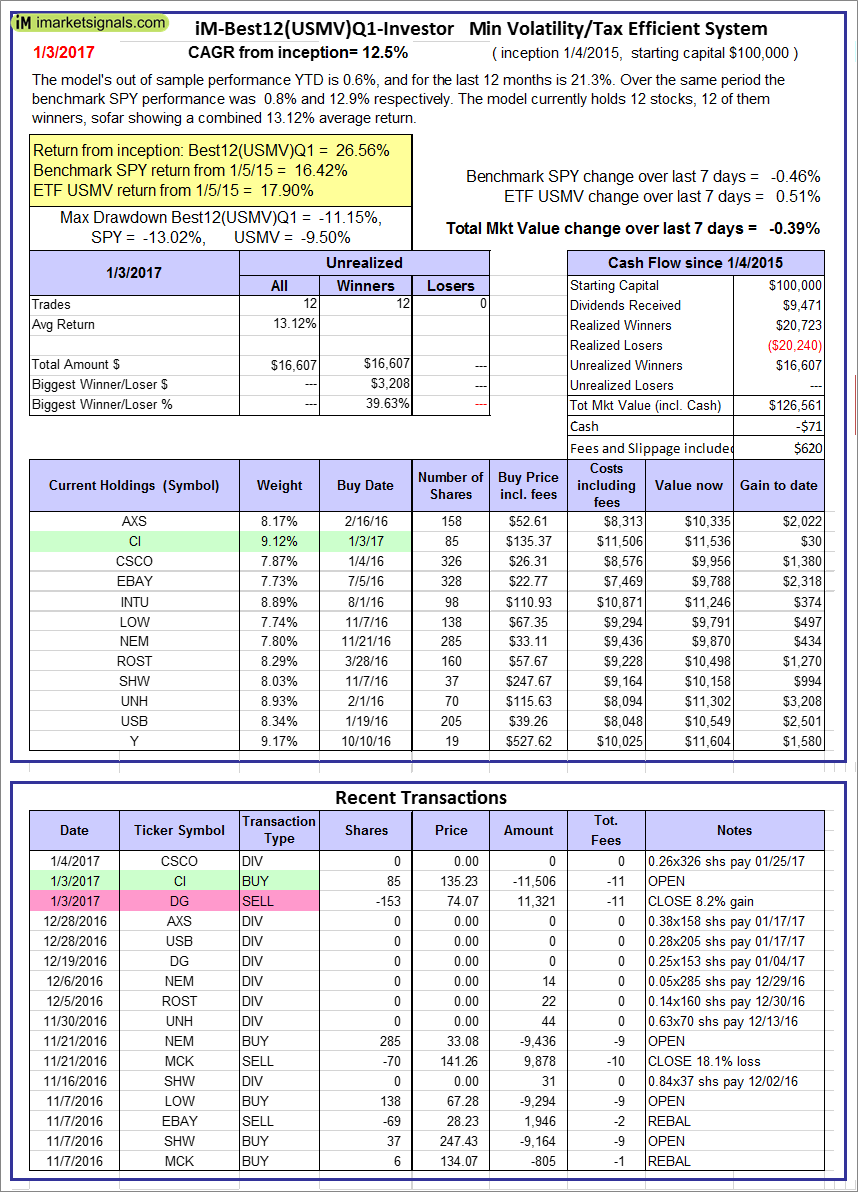 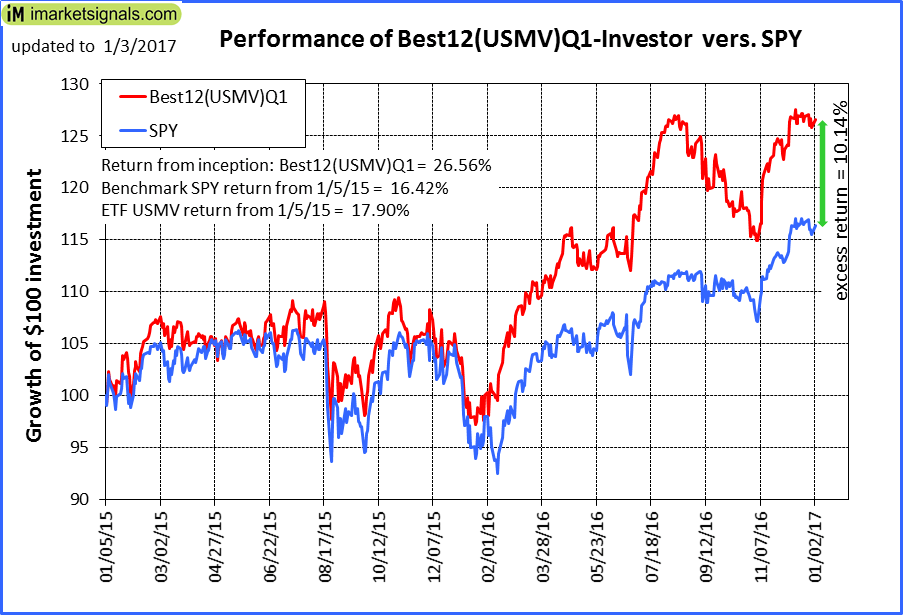 |
iM-Best12(USMV)Q1-Investor: The model’s out of sample performance YTD is 0.6%, and for the last 12 months is 21.3%. Over the same period the benchmark SPY performance was 0.8% and 12.9% respectively. Since inception, on 1/5/2015, the model gained 26.56% while the benchmark SPY gained 16.42% and the ETF USMV gained 17.90% over the same period. Over the previous week the market value of iM-Best12(USMV)Q1 gained -0.39% at a time when SPY gained -0.46%. A starting capital of $100,000 at inception on 1/5/2015 would have grown to $126,561 which includes -$71 cash and excludes $620 spent on fees and slippage. |
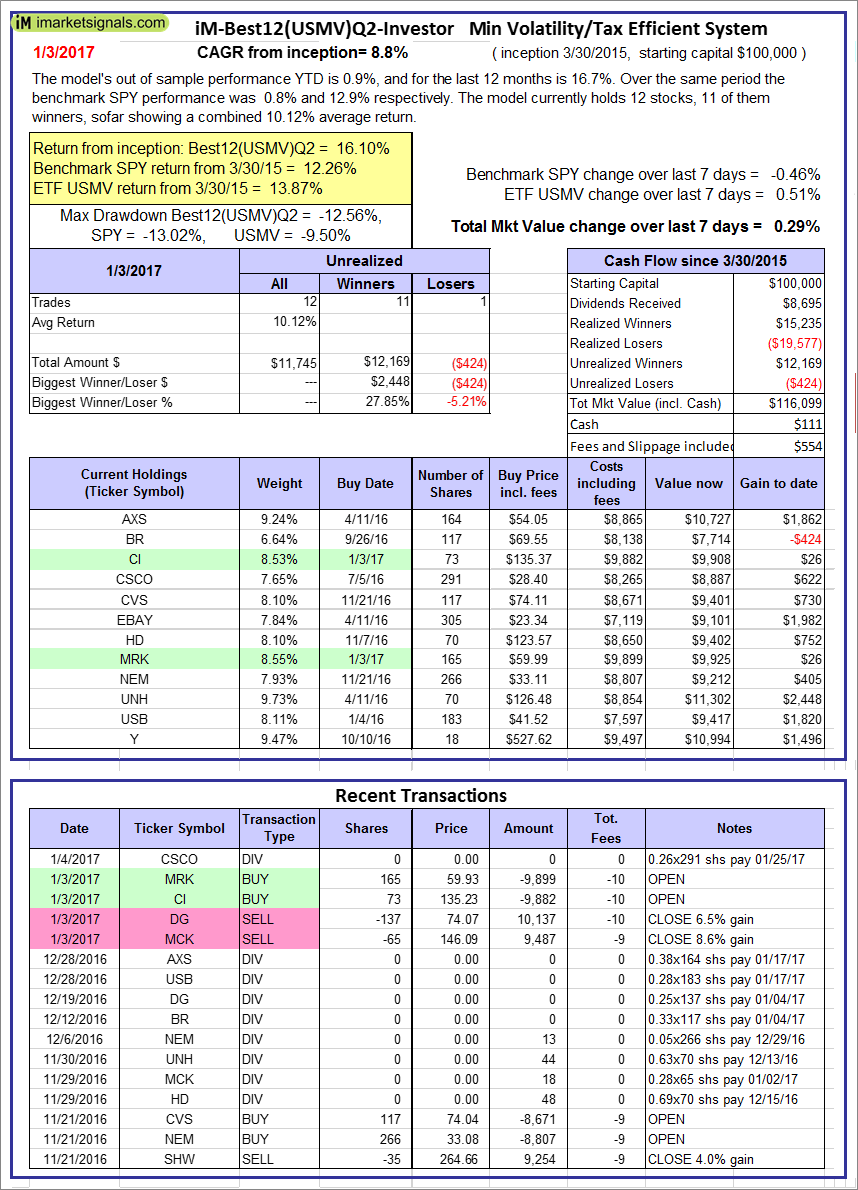 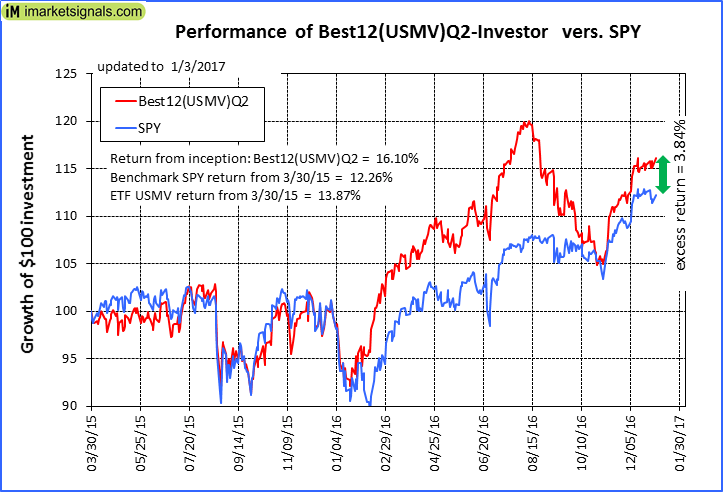 |
iM-Best12(USMV)Q2-Investor: The model’s out of sample performance YTD is 0.9%, and for the last 12 months is 16.7%. Over the same period the benchmark SPY performance was 0.8% and 12.9% respectively. Since inception, on 3/31/2015, the model gained 16.10% while the benchmark SPY gained 12.26% and the ETF USMV gained 13.87% over the same period. Over the previous week the market value of iM-Best12(USMV)Q2 gained 0.29% at a time when SPY gained -0.46%. A starting capital of $100,000 at inception on 3/31/2015 would have grown to $116,099 which includes $111 cash and excludes $554 spent on fees and slippage. |
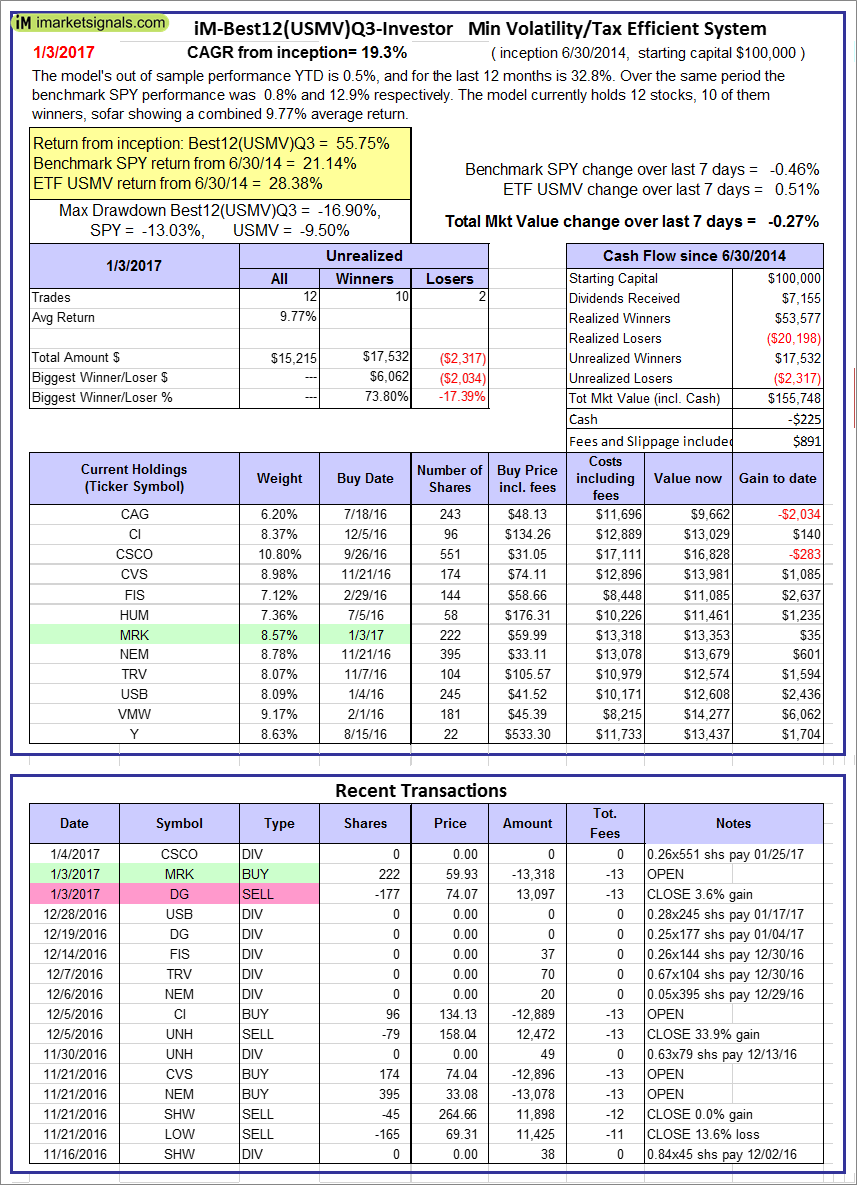 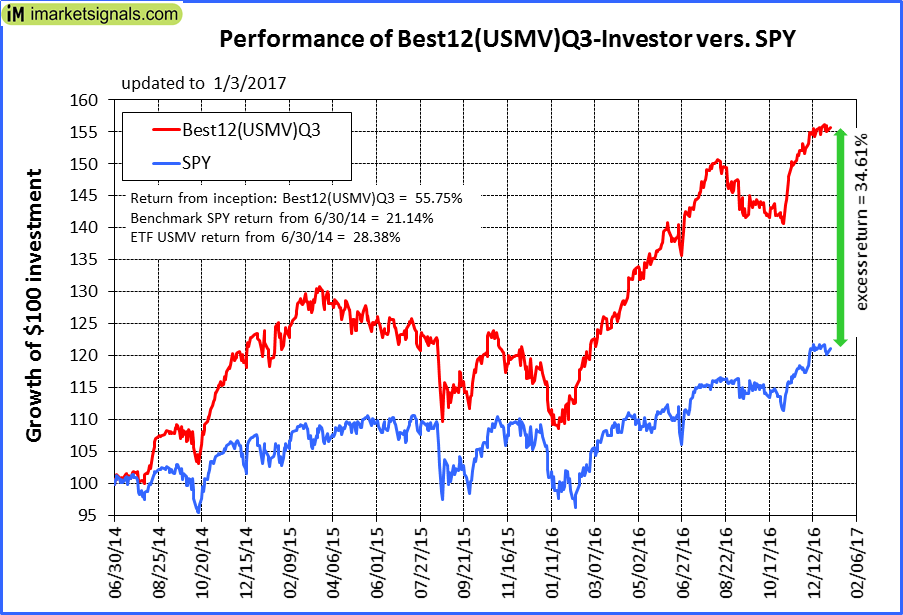 |
iM-Best12(USMV)Q3-Investor: The model’s out of sample performance YTD is 0.5%, and for the last 12 months is 32.8%. Over the same period the benchmark SPY performance was 0.8% and 12.9% respectively. Since inception, on 7/1/2014, the model gained 55.75% while the benchmark SPY gained 21.14% and the ETF USMV gained 28.38% over the same period. Over the previous week the market value of iM-Best12(USMV)Q3 gained -0.27% at a time when SPY gained -0.46%. A starting capital of $100,000 at inception on 7/1/2014 would have grown to $155,748 which includes -$225 cash and excludes $891 spent on fees and slippage. |
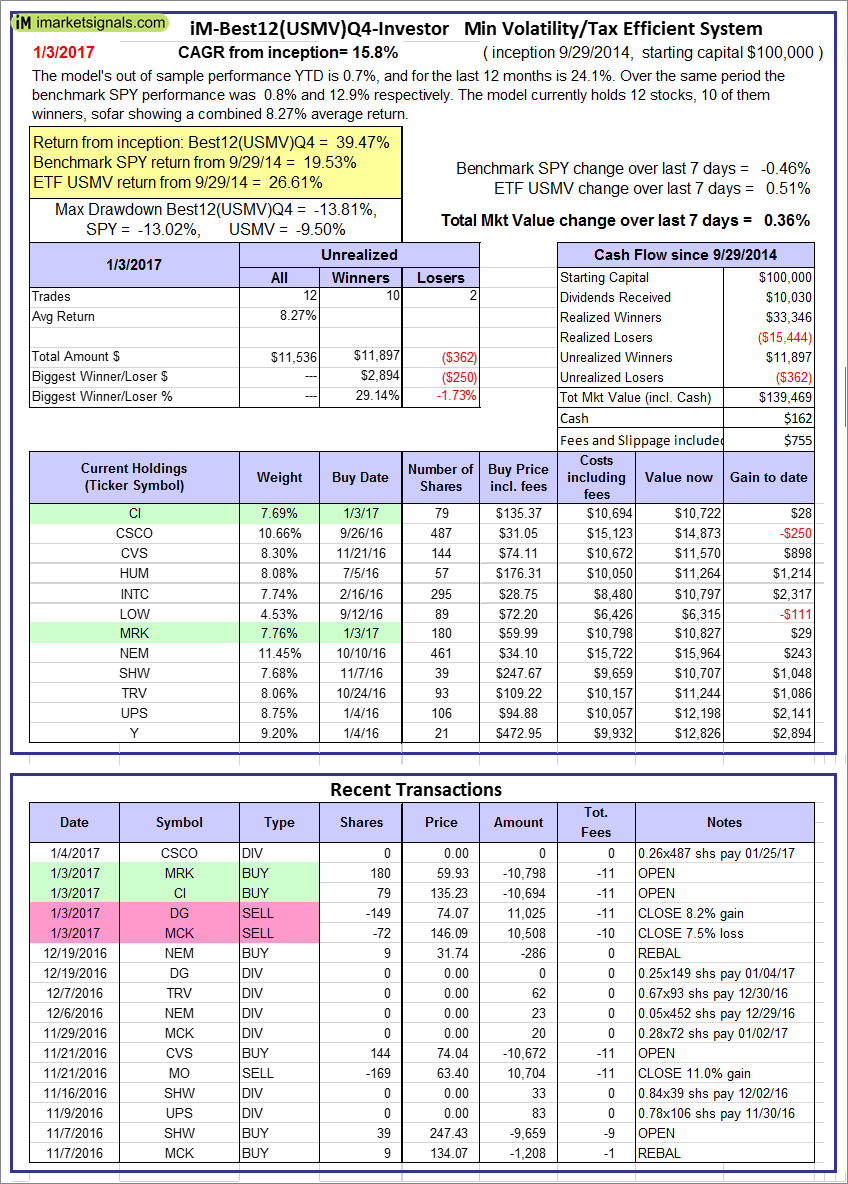 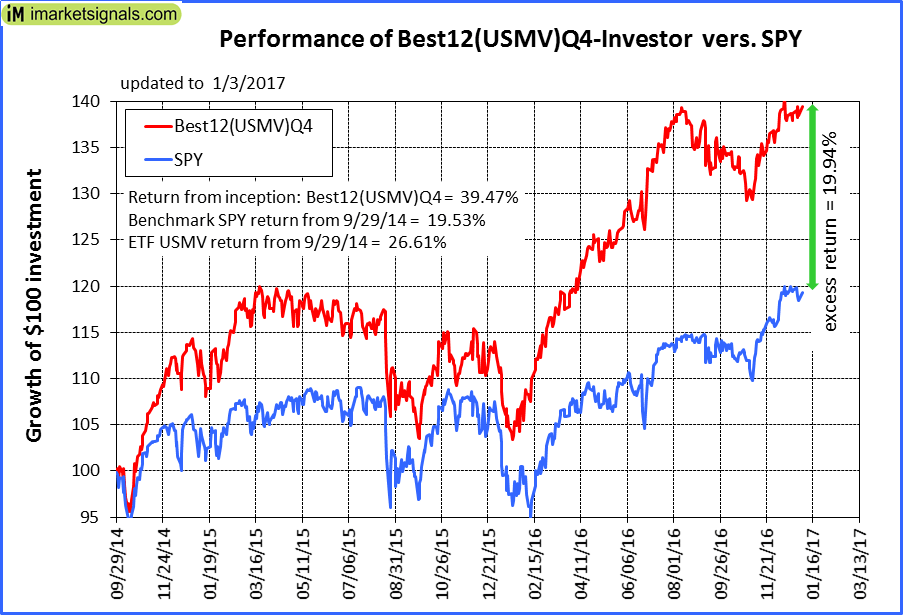 |
iM-Best12(USMV)Q4-Investor: Since inception, on 9/30/2014, the model gained 39.47% while the benchmark SPY gained 19.53% and the ETF USMV gained 26.61% over the same period. Over the previous week the market value of iM-Best12(USMV)Q4 gained 0.36% at a time when SPY gained -0.46%. A starting capital of $100,000 at inception on 9/30/2014 would have grown to $139,469 which includes $162 cash and excludes $755 spent on fees and slippage. |
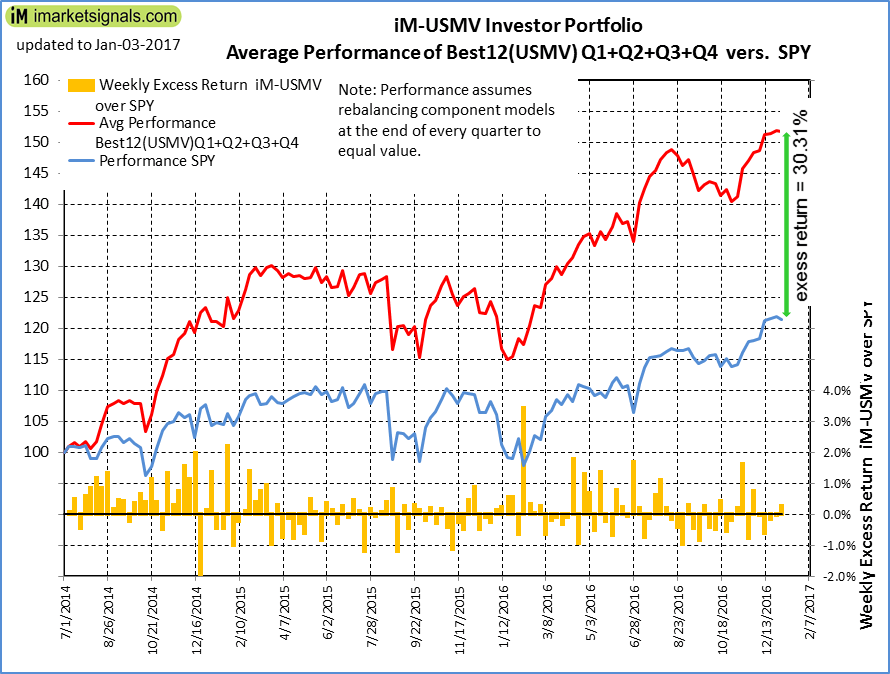 |
Average Performance of iM-Best12(USMV)Q1+Q2+Q3+Q4-Investor resulted in an excess return of 30.31% over SPY. (see iM-USMV Investor Portfolio) |
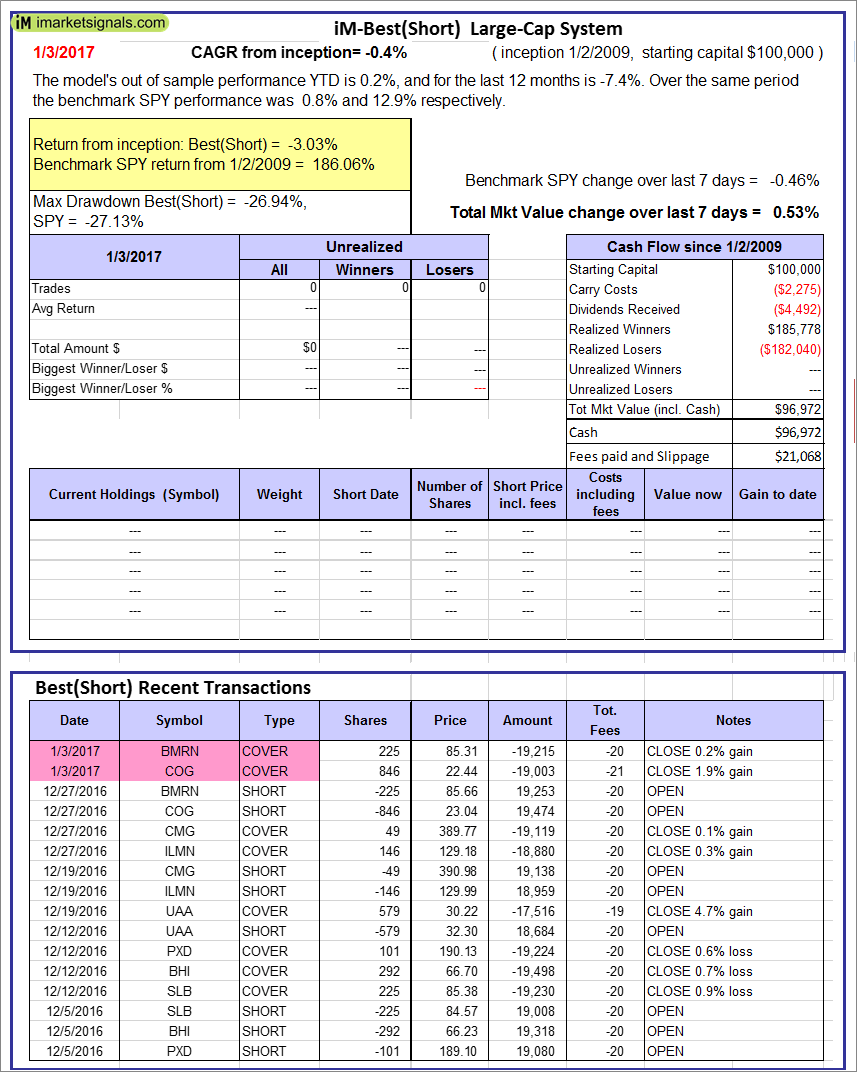 |
iM-Best(Short): The model’s out of sample performance YTD is 0.2%, and for the last 12 months is -7.4%. Over the same period the benchmark SPY performance was 0.8% and 12.9% respectively. Over the previous week the market value of iM-Best(Short) gained 0.53% at a time when SPY gained -0.46%. Over the period 1/2/2009 to 1/3/2017 the starting capital of $100,000 would have grown to $96,972 which includes $96,972 cash and excludes $21,068 spent on fees and slippage. |
iM-Best Reports – 1/3/2-17
Posted in pmp SPY-SH
Leave a Reply
You must be logged in to post a comment.