
  |
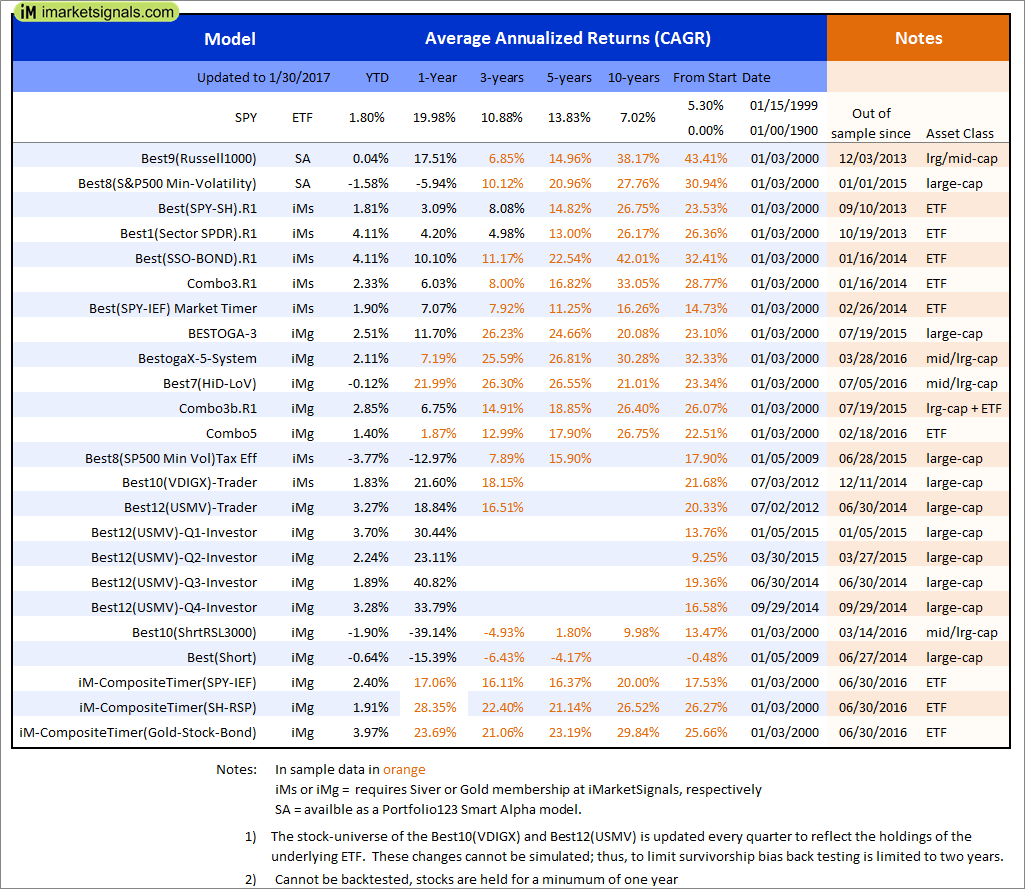
Out of sample performance summary of our models for the past 1, 2, 4 and 13 week periods. The active active return indicates how the models over- or underperformed the benchmark ETF SPY. Also the YTD, and the 1-, 3-, 5- and 10-year annualized returns are shown in the second table |
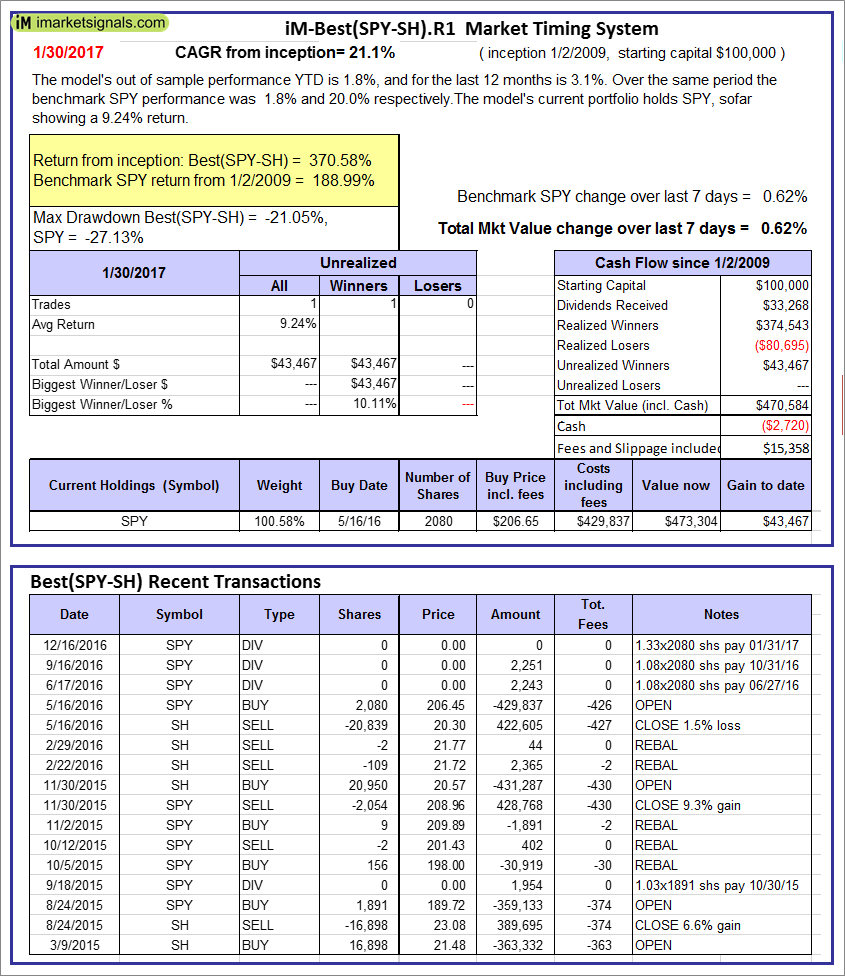 |
iM-Best(SPY-SH).R1: The model’s out of sample performance YTD is 1.8%, and for the last 12 months is 3.1%. Over the same period the benchmark SPY performance was 1.8% and 20.0% respectively. Over the previous week the market value of Best(SPY-SH) gained 0.62% at a time when SPY gained 0.62%. A starting capital of $100,000 at inception on 1/2/2009 would have grown to $470,584 which includes -$2,720 cash and excludes $15,358 spent on fees and slippage. |
 |
iM-Combo3.R1: The model’s out of sample performance YTD is 2.3%, and for the last 12 months is 6.0%. Over the same period the benchmark SPY performance was 1.8% and 20.0% respectively. Over the previous week the market value of iM-Combo3.R1 gained 0.29% at a time when SPY gained 0.62%. A starting capital of $100,000 at inception on 2/3/2014 would have grown to $128,574 which includes $182 cash and excludes $3,149 spent on fees and slippage. |
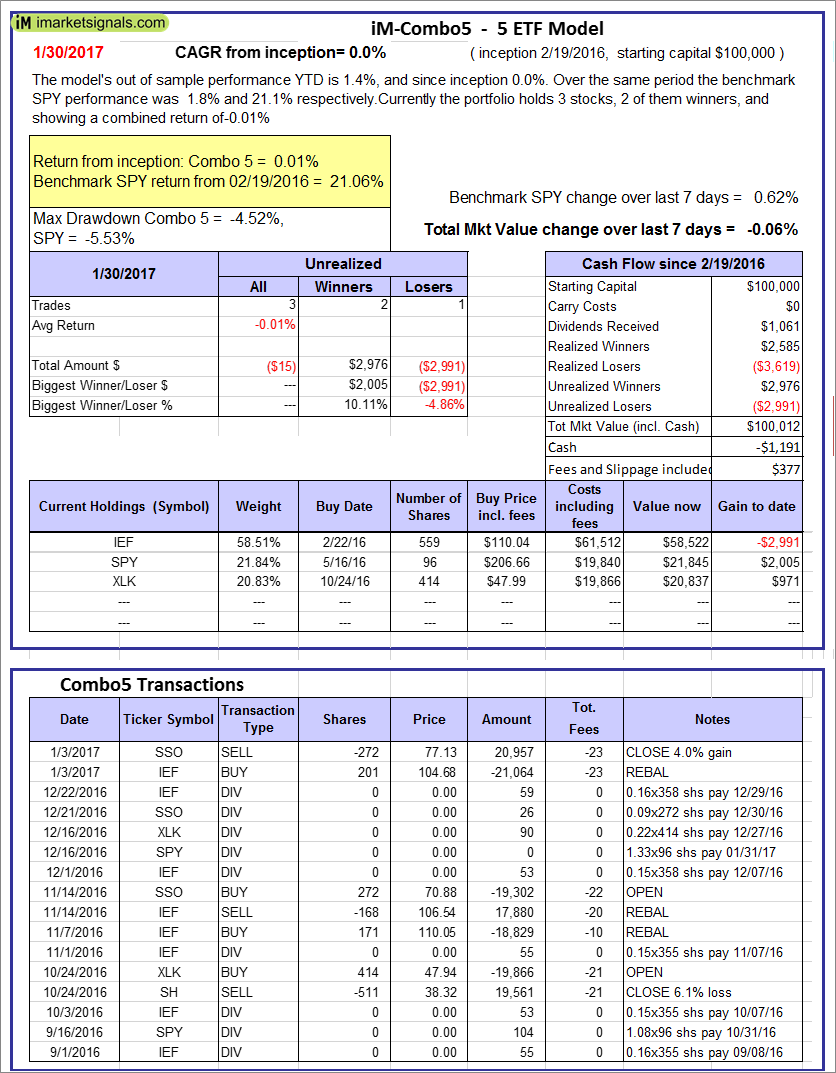 |
iM-Combo5: The model’s out of sample performance YTD is 1.4%, and since inception 0.0%. Over the same period the benchmark SPY performance was 1.8% and 21.1% respectively. Over the previous week the market value of iM-Combo5 gained -0.06% at a time when SPY gained 0.62%. A starting capital of $100,000 at inception on 2/22/2016 would have grown to $100,012 which includes -$1,191 cash and excludes $377 spent on fees and slippage. |
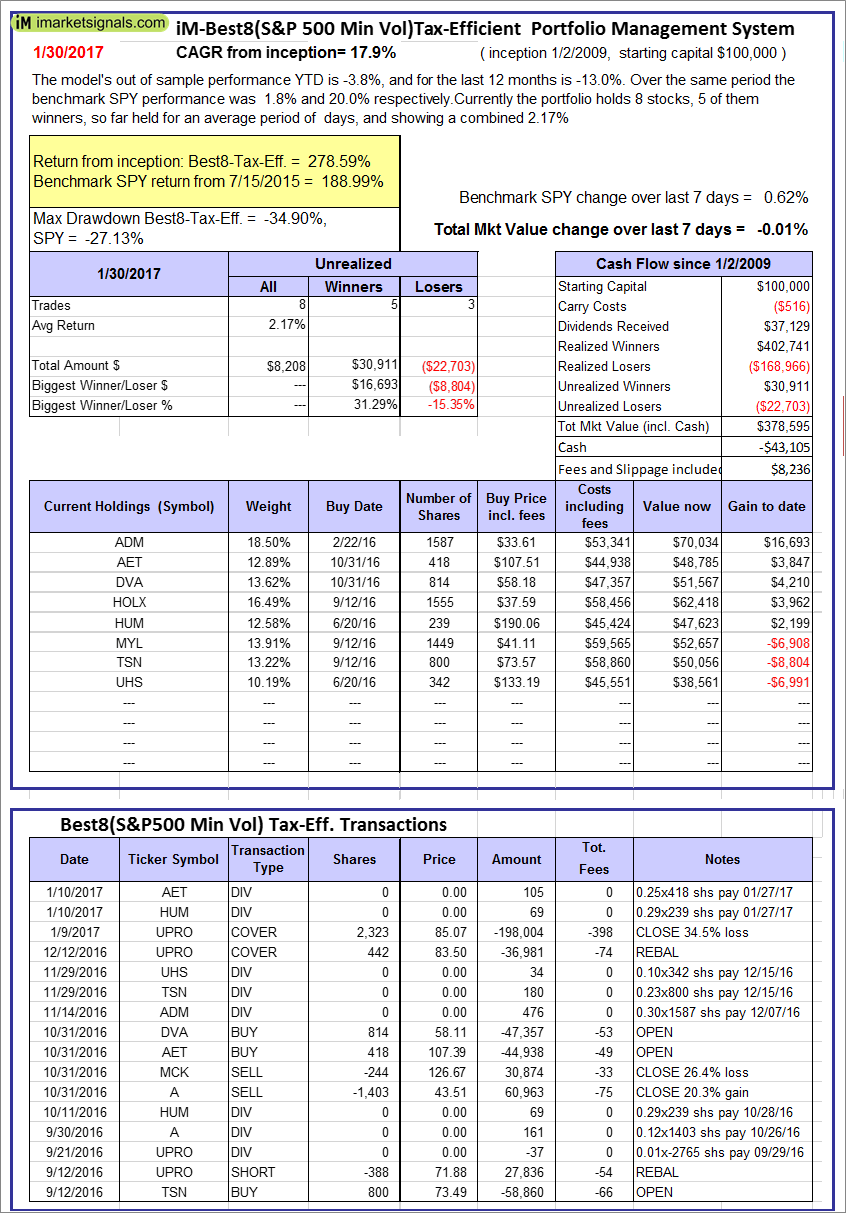 |
The iM-Best8(S&P500 Min Vol)Tax-Efficient The model’s out of sample performance YTD is -3.8%, and for the last 12 months is -13.0%. Over the same period the benchmark SPY performance was 1.8% and 20.0% respectively. Over the previous week the market value of iM-Best8(S&P 500)Tax-Eff. gained -0.01% at a time when SPY gained 0.62%. A starting capital of $100,000 at inception on 1/2/2009 would have grown to $378,595 which includes -$43,105 cash and excludes $8,236 spent on fees and slippage. |
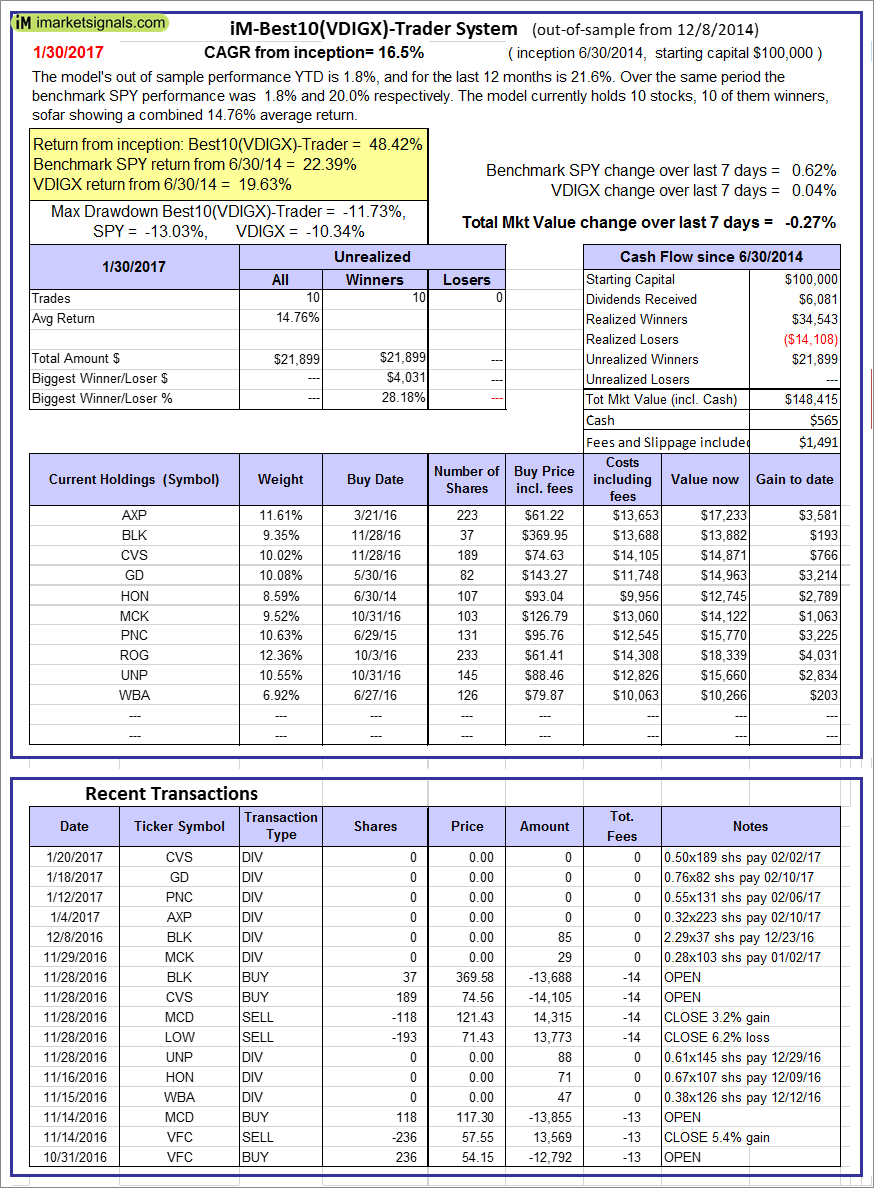  |
iM-Best10(VDIGX)-Trader: The model’s out of sample performance YTD is 1.8%, and for the last 12 months is 21.6%. Over the same period the benchmark SPY performance was 1.8% and 20.0% respectively. Since inception, on 7/1/2014, the model gained 48.42% while the benchmark SPY gained 22.39% and the ETF VDIGX gained 19.63% over the same period. Over the previous week the market value of iM-Best10(VDIGX) gained -0.27% at a time when SPY gained 0.62%. A starting capital of $100,000 at inception on 7/1/2014 would have grown to $148,415 which includes $565 cash and excludes $1,491 spent on fees and slippage. |
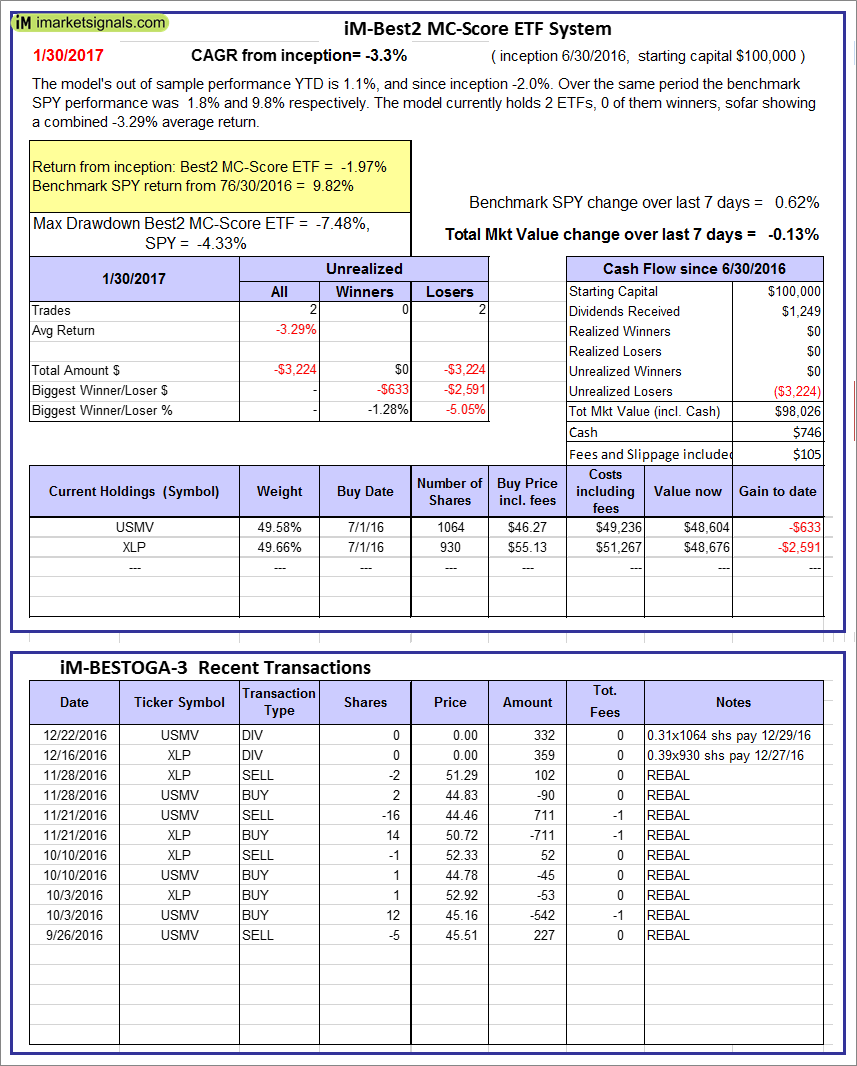 |
iM-Best2 MC-Score ETF System: The model’s out of sample performance YTD is 1.1%, and since inception -2.0%. Over the same period the benchmark SPY performance was 1.8% and 9.8% respectively. Over the previous week the market value of iM-BESTOGA-3 gained -0.13% at a time when SPY gained 0.62%. A starting capital of $100,000 at inception on 2/3/2014 would have grown to $746 which includes $105 cash and excludes Gain to date spent on fees and slippage. |
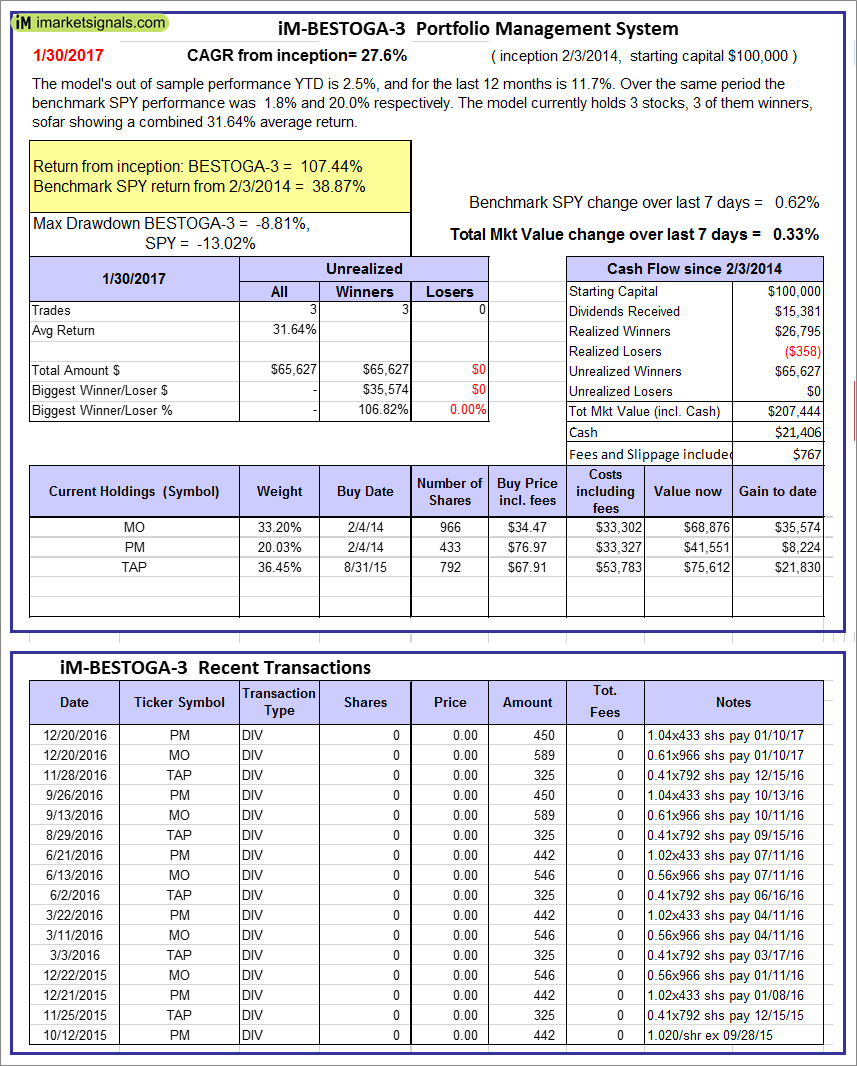 |
iM-BESTOGA-3: The model’s out of sample performance YTD is 2.5%, and for the last 12 months is 11.7%. Over the same period the benchmark SPY performance was 1.8% and 20.0% respectively. Over the previous week the market value of iM-BESTOGA-3 gained 0.33% at a time when SPY gained 0.62%. A starting capital of $100,000 at inception on 2/3/2014 would have grown to $207,444 which includes $21,406 cash and excludes $767 spent on fees and slippage. |
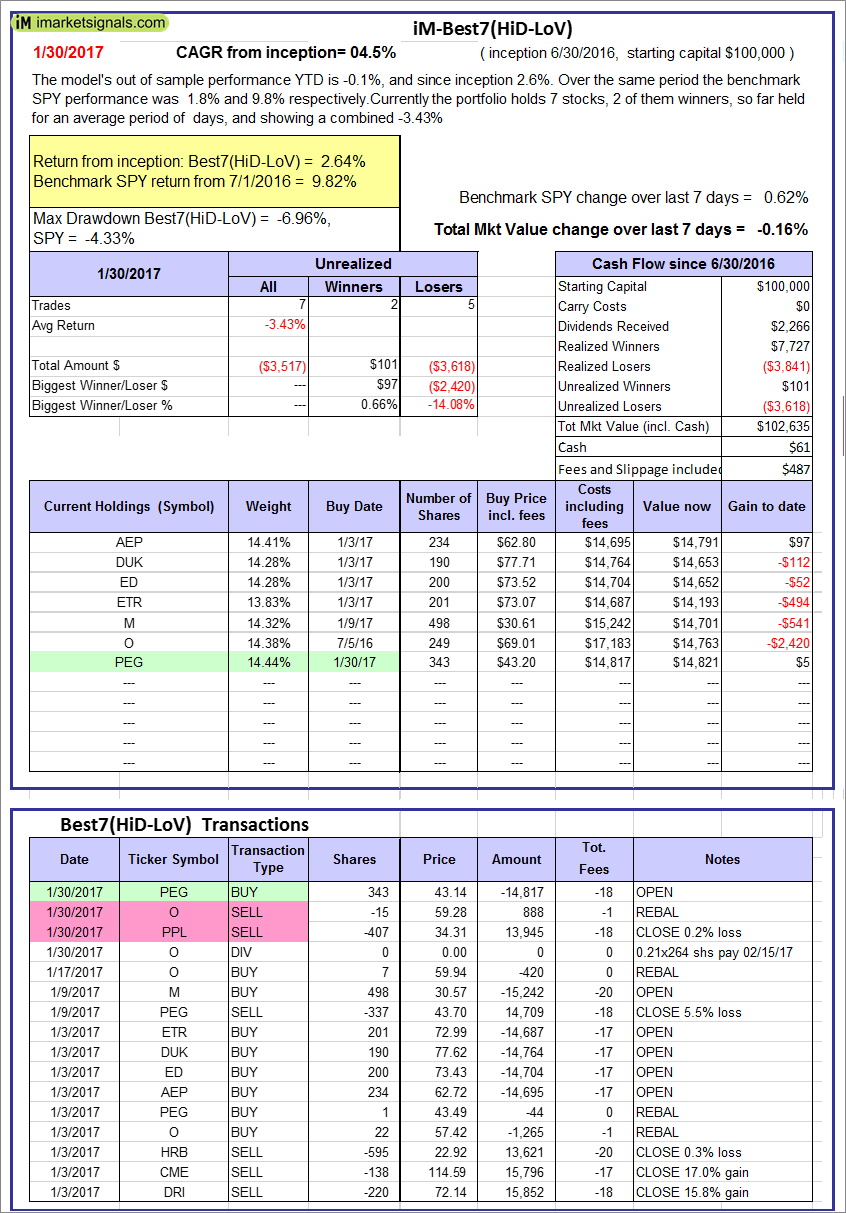 |
iM-Best7(HiD-LoV): The model’s out of sample performance YTD is -0.1%, and since inception 2.6%. Over the same period the benchmark SPY performance was 1.8% and 9.8% respectively. Over the previous week the market value of iM-BESTOGA-3 gained -0.16% at a time when SPY gained 0.62%. A starting capital of $100,000 at inception on 2/3/2014 would have grown to $102,635 which includes $61 cash and excludes $487 spent on fees and slippage. |
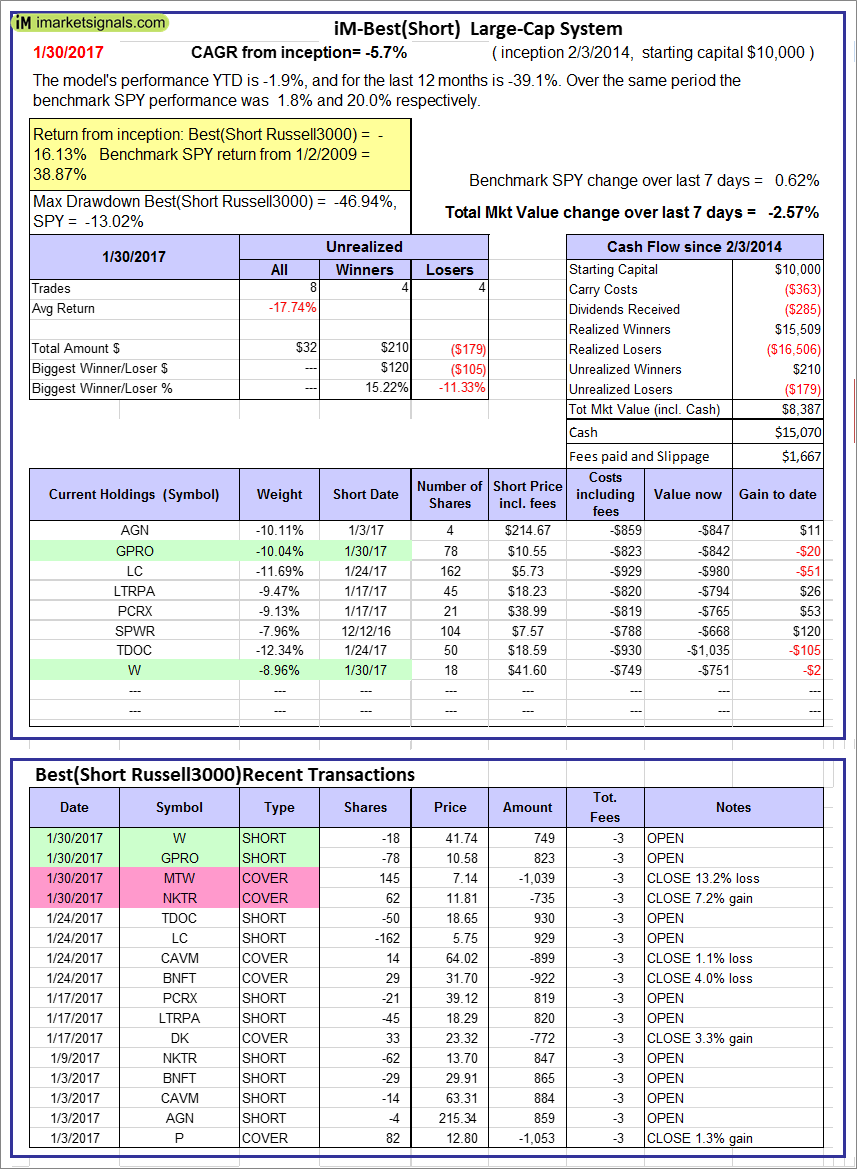 |
iM-Best10(Short Russell3000): The model’s performance YTD is -1.9%, and for the last 12 months is -39.1%. Over the same period the benchmark SPY performance was 1.8% and 20.0% respectively. Over the previous week the market value of iM-Best10(Short Russell3000) gained -2.57% at a time when SPY gained 0.62%. Over the period 2/3/2014 to 1/30/2017 the starting capital of $100,000 would have grown to $8,387 which includes $15,070 cash and excludes $1,667 spent on fees and slippage. |
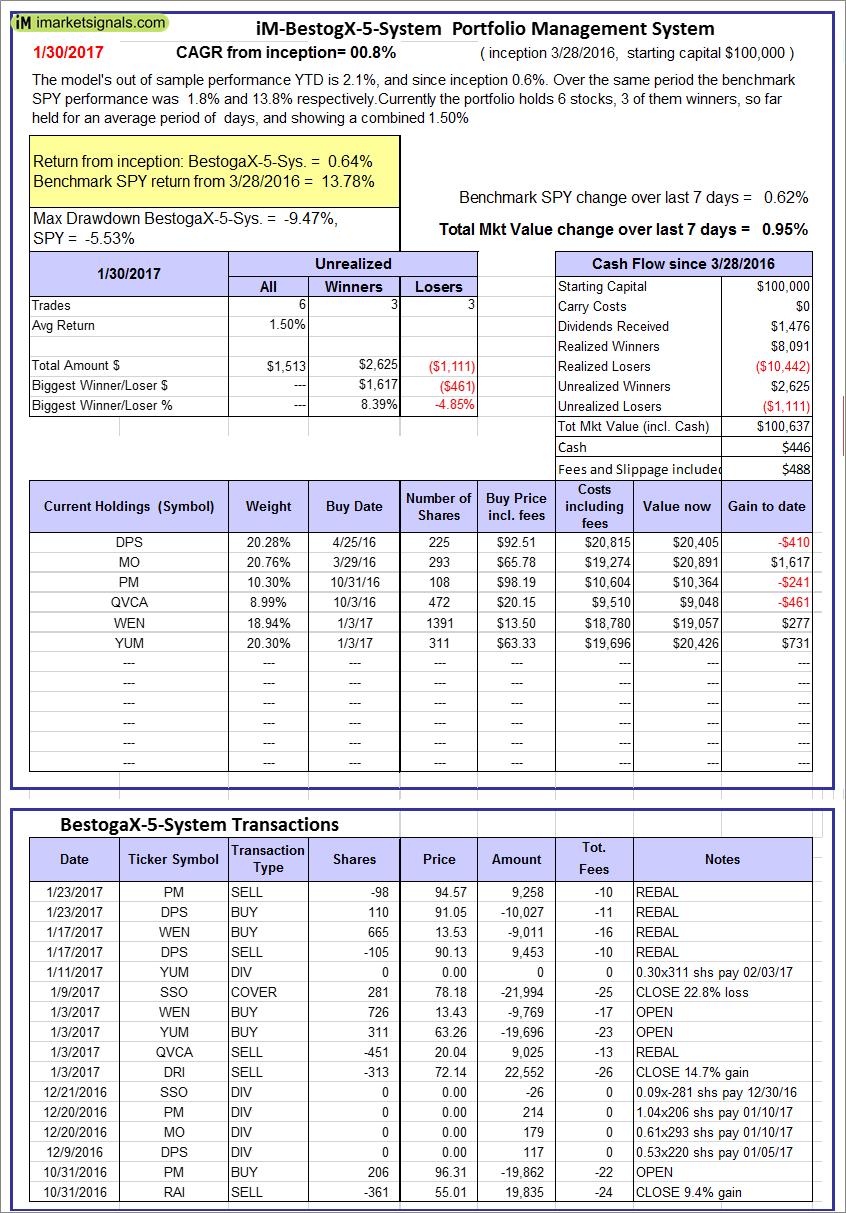 |
iM-BestogaX5-System: The model’s out of sample performance YTD is 2.1%, and since inception 0.6%. Over the same period the benchmark SPY performance was 1.8% and 13.8% respectively. Over the previous week the market value of iM-Best8(S&P 500)Tax-Eff. gained 0.95% at a time when SPY gained 0.62%. A starting capital of $100,000 at inception on 1/2/2009 would have grown to $100,637 which includes $446 cash and excludes $488 spent on fees and slippage. |
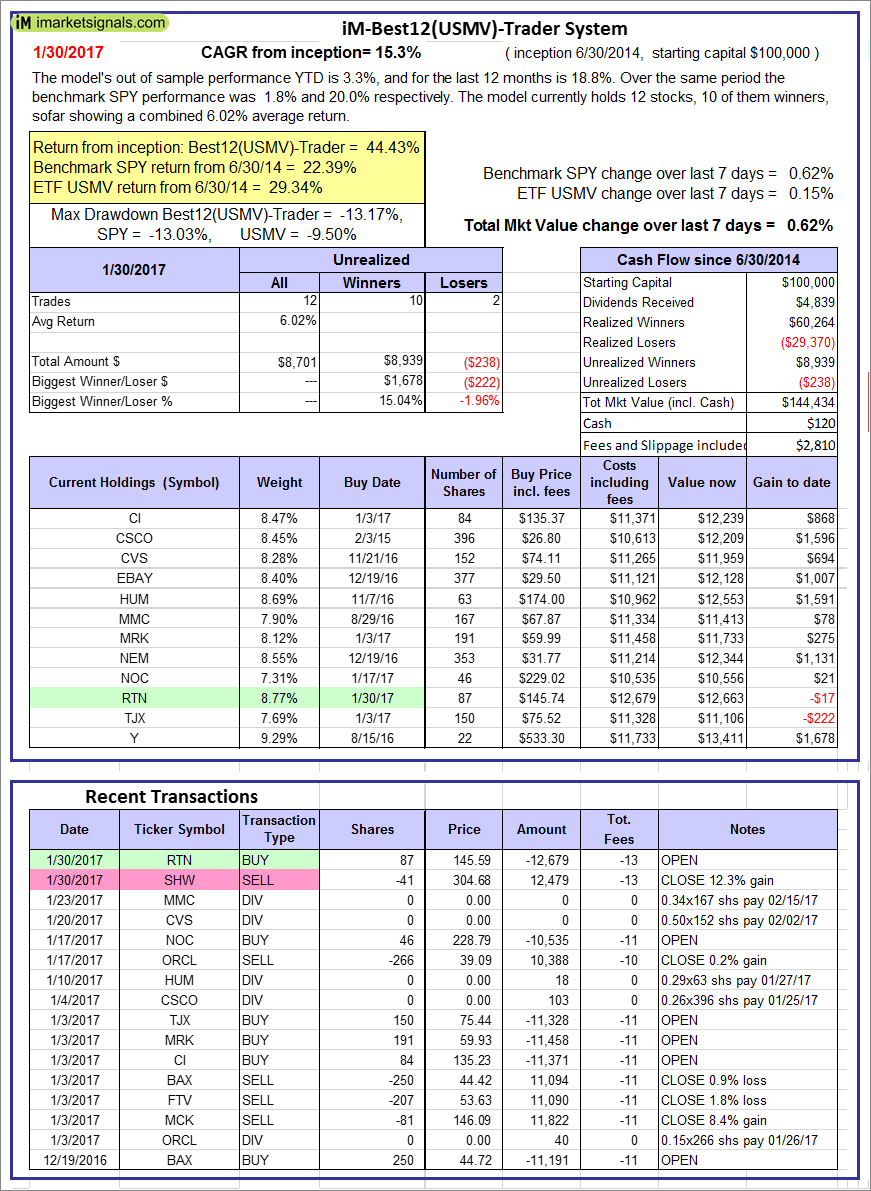 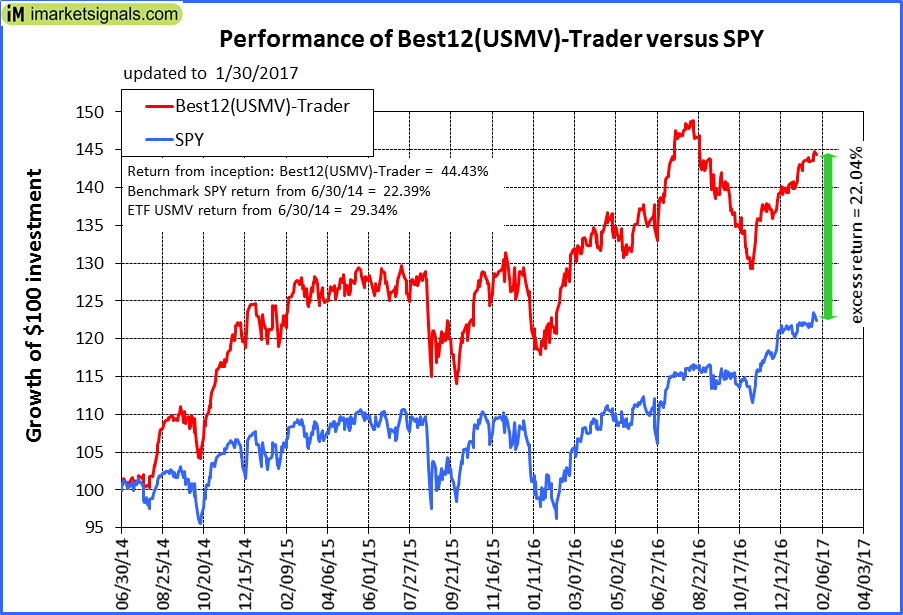 |
iM-Best12(USMV)-Trader: The model’s out of sample performance YTD is 3.3%, and for the last 12 months is 18.8%. Over the same period the benchmark SPY performance was 1.8% and 20.0% respectively. Since inception, on 7/1/2014, the model gained 44.43% while the benchmark SPY gained 22.39% and the ETF USMV gained 29.34% over the same period. Over the previous week the market value of iM-Best12(USMV)-Trader gained 0.62% at a time when SPY gained 0.62%. A starting capital of $100,000 at inception on 7/1/2014 would have grown to $144,434 which includes $120 cash and excludes $2,810 spent on fees and slippage. |
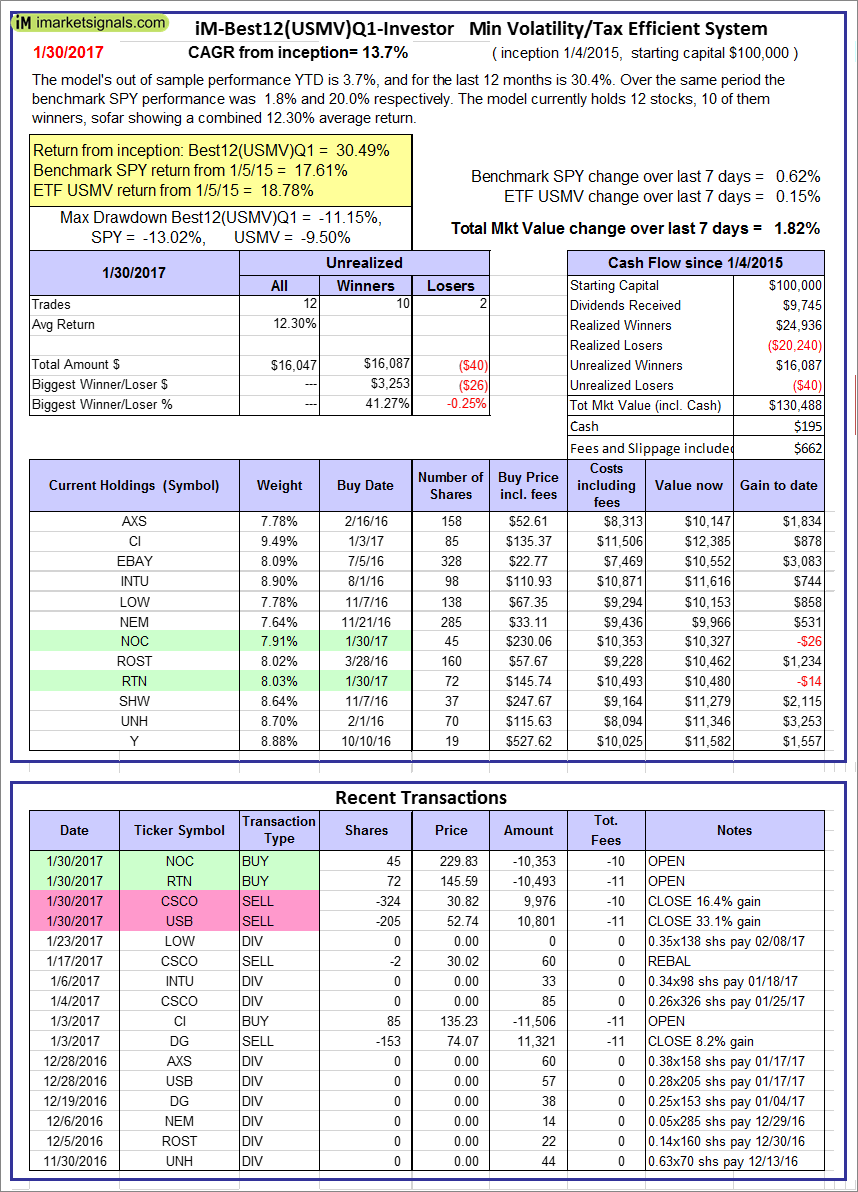 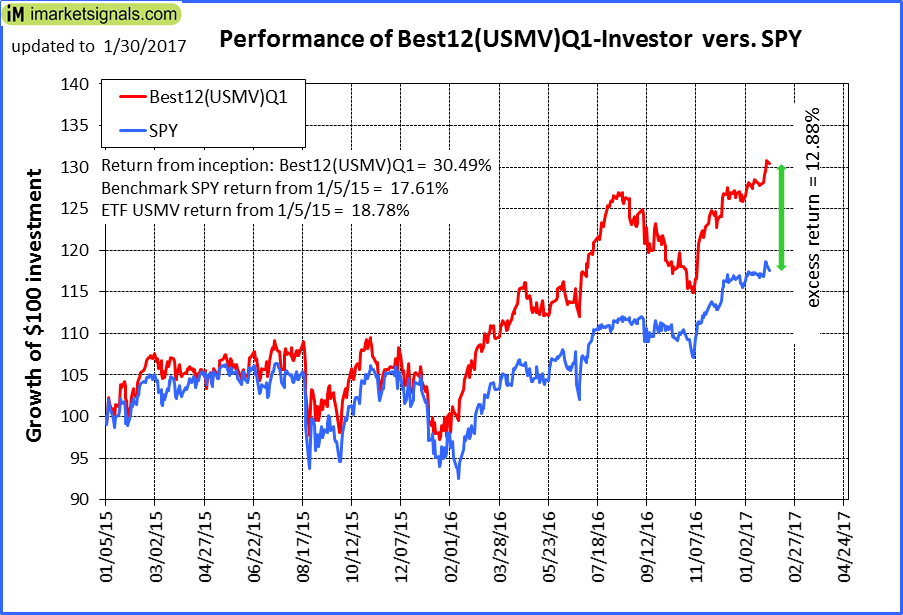 |
iM-Best12(USMV)Q1-Investor: The model’s out of sample performance YTD is 3.7%, and for the last 12 months is 30.4%. Over the same period the benchmark SPY performance was 1.8% and 20.0% respectively. Since inception, on 1/5/2015, the model gained 30.49% while the benchmark SPY gained 17.61% and the ETF USMV gained 18.78% over the same period. Over the previous week the market value of iM-Best12(USMV)Q1 gained 1.82% at a time when SPY gained 0.62%. A starting capital of $100,000 at inception on 1/5/2015 would have grown to $130,488 which includes $195 cash and excludes $662 spent on fees and slippage. |
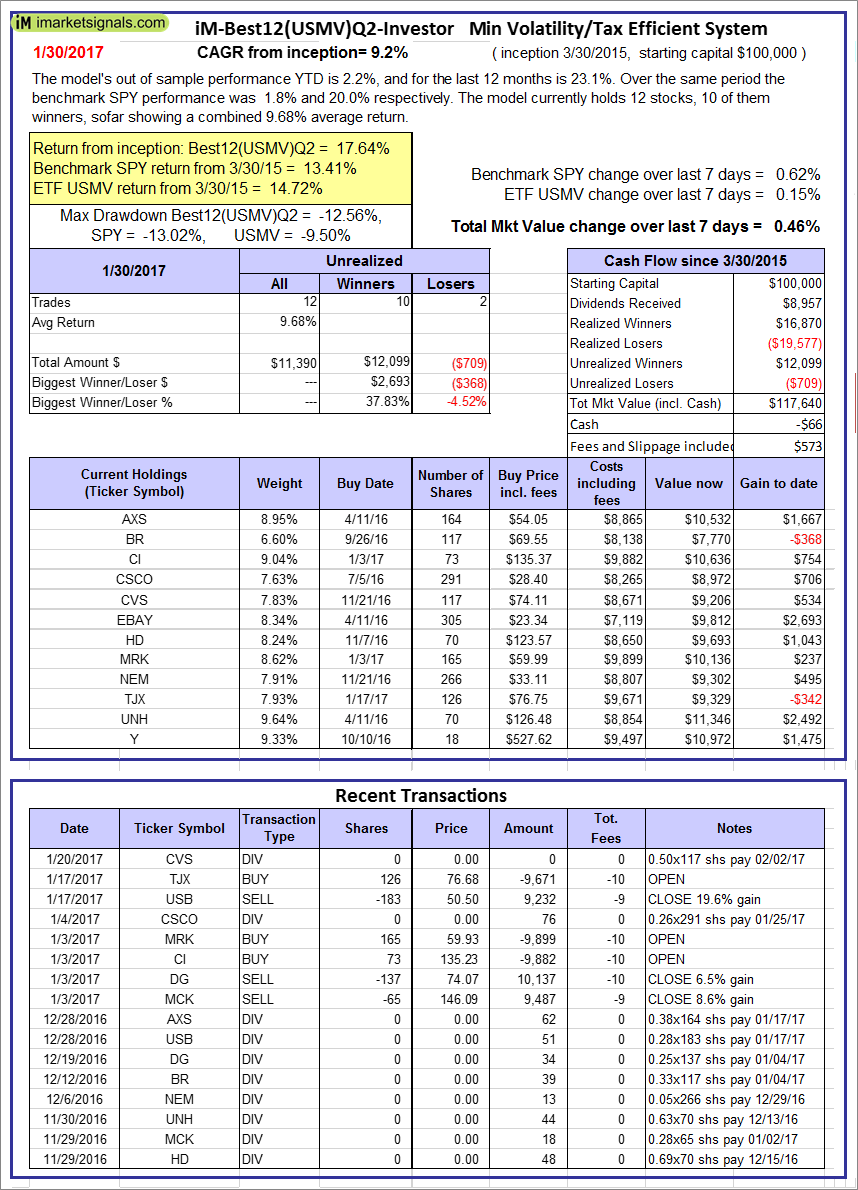 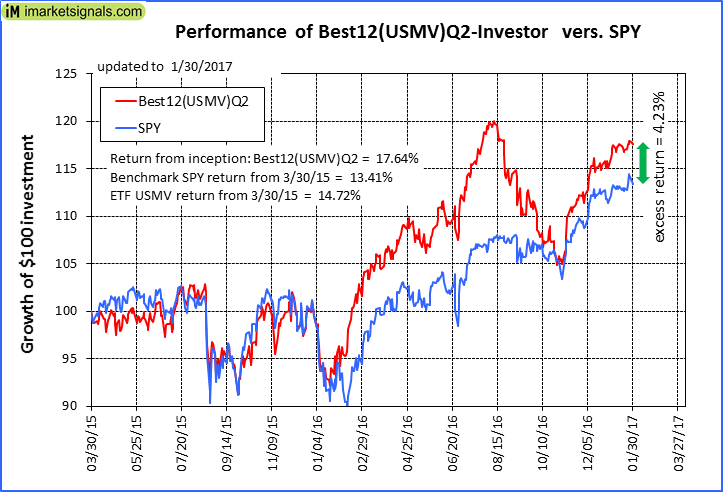 |
iM-Best12(USMV)Q2-Investor: The model’s out of sample performance YTD is 2.2%, and for the last 12 months is 23.1%. Over the same period the benchmark SPY performance was 1.8% and 20.0% respectively. Since inception, on 3/31/2015, the model gained 17.64% while the benchmark SPY gained 13.41% and the ETF USMV gained 14.72% over the same period. Over the previous week the market value of iM-Best12(USMV)Q2 gained 0.46% at a time when SPY gained 0.62%. A starting capital of $100,000 at inception on 3/31/2015 would have grown to $117,640 which includes -$66 cash and excludes $573 spent on fees and slippage. |
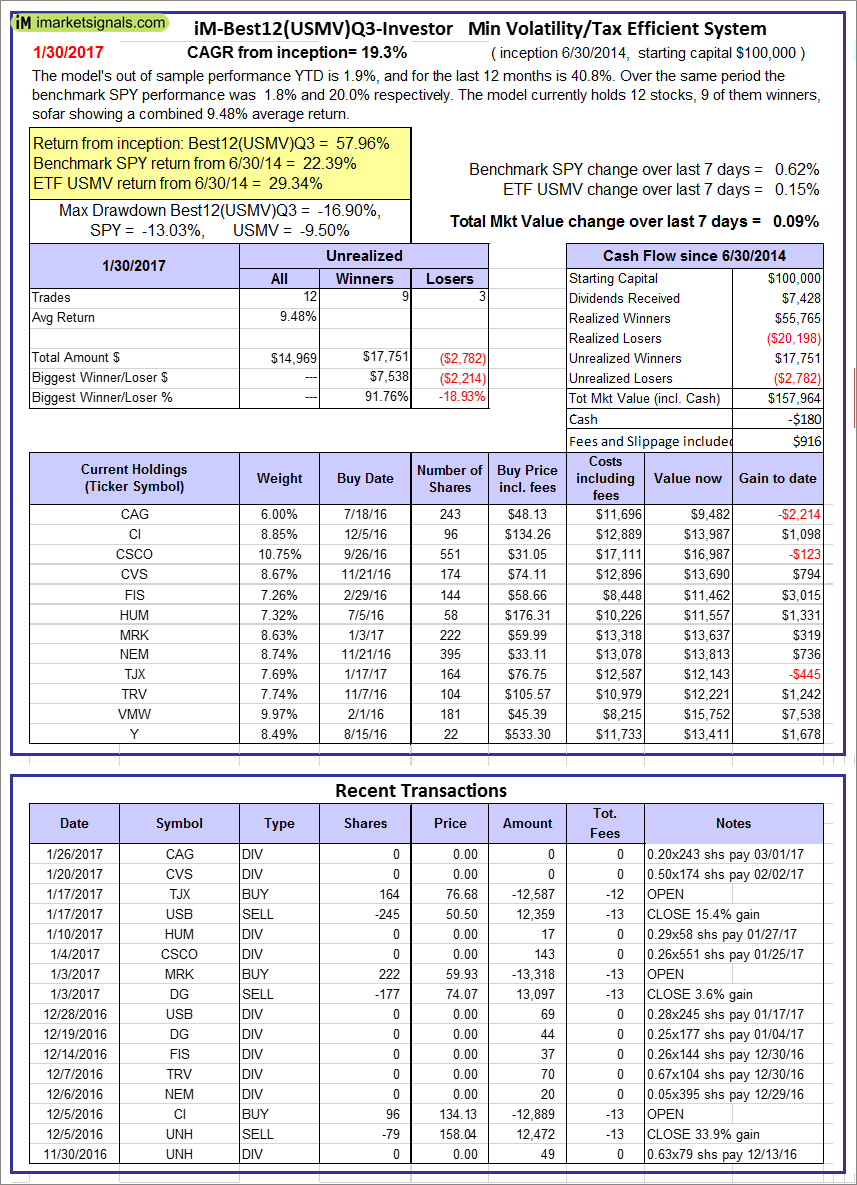 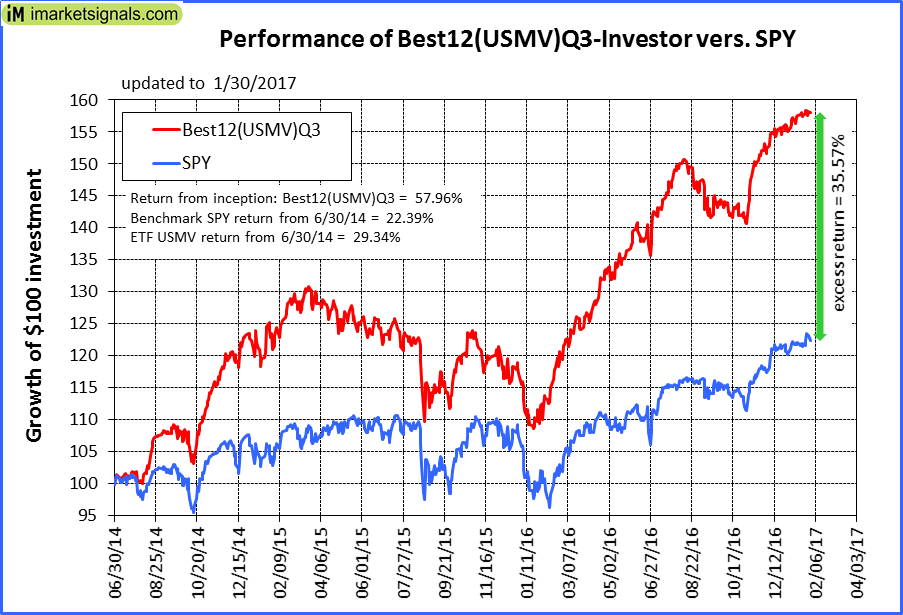 |
iM-Best12(USMV)Q3-Investor: The model’s out of sample performance YTD is 1.9%, and for the last 12 months is 40.8%. Over the same period the benchmark SPY performance was 1.8% and 20.0% respectively. Since inception, on 7/1/2014, the model gained 57.96% while the benchmark SPY gained 22.39% and the ETF USMV gained 29.34% over the same period. Over the previous week the market value of iM-Best12(USMV)Q3 gained 0.09% at a time when SPY gained 0.62%. A starting capital of $100,000 at inception on 7/1/2014 would have grown to $157,964 which includes -$180 cash and excludes $916 spent on fees and slippage. |
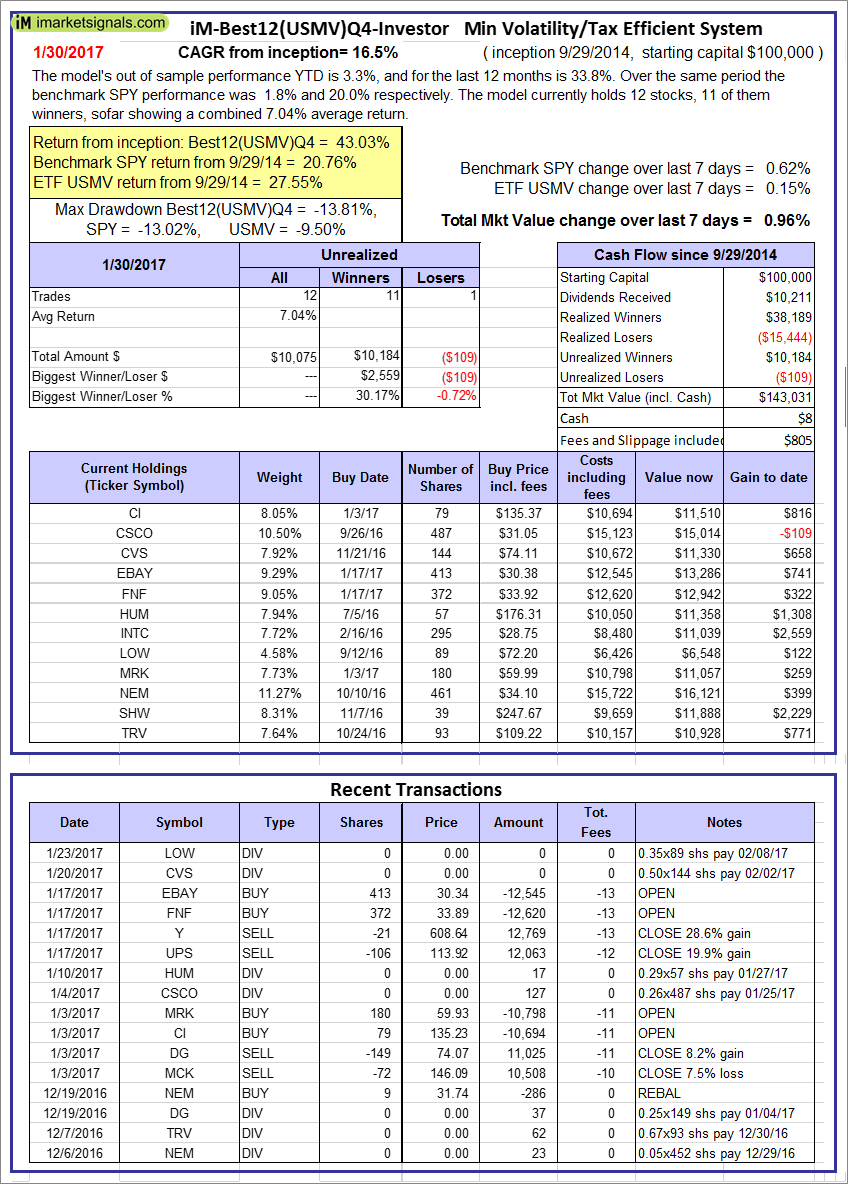 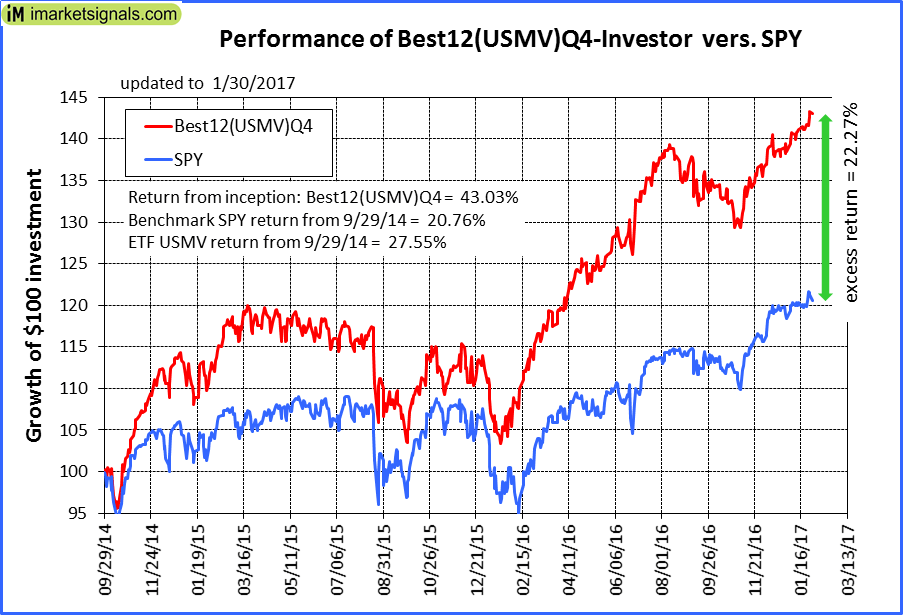 |
iM-Best12(USMV)Q4-Investor: Since inception, on 9/30/2014, the model gained 43.03% while the benchmark SPY gained 20.76% and the ETF USMV gained 27.55% over the same period. Over the previous week the market value of iM-Best12(USMV)Q4 gained 0.96% at a time when SPY gained 0.62%. A starting capital of $100,000 at inception on 9/30/2014 would have grown to $143,031 which includes $8 cash and excludes $805 spent on fees and slippage. |
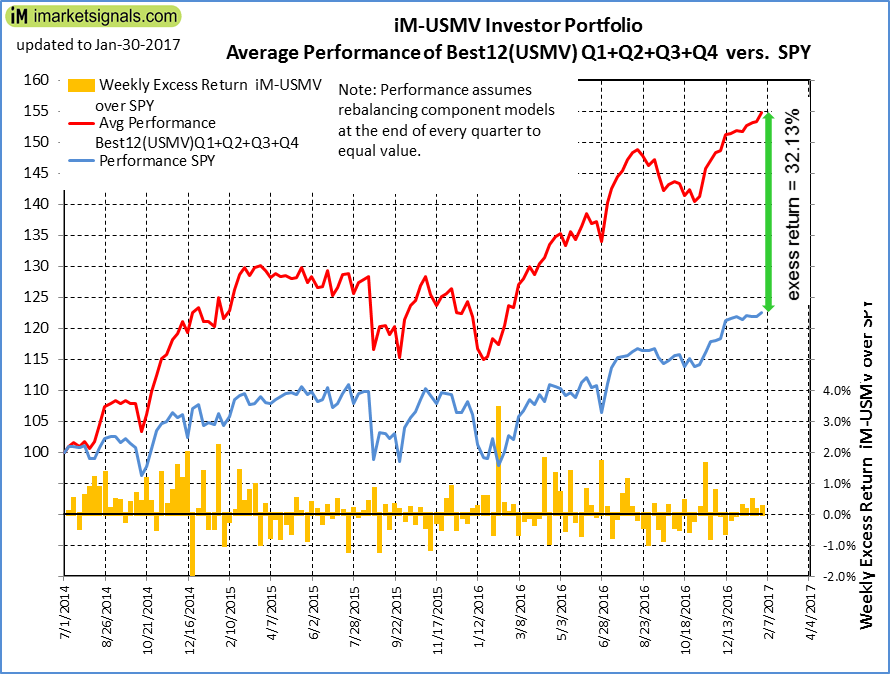 |
Average Performance of iM-Best12(USMV)Q1+Q2+Q3+Q4-Investor resulted in an excess return of 32.13% over SPY. (see iM-USMV Investor Portfolio) |
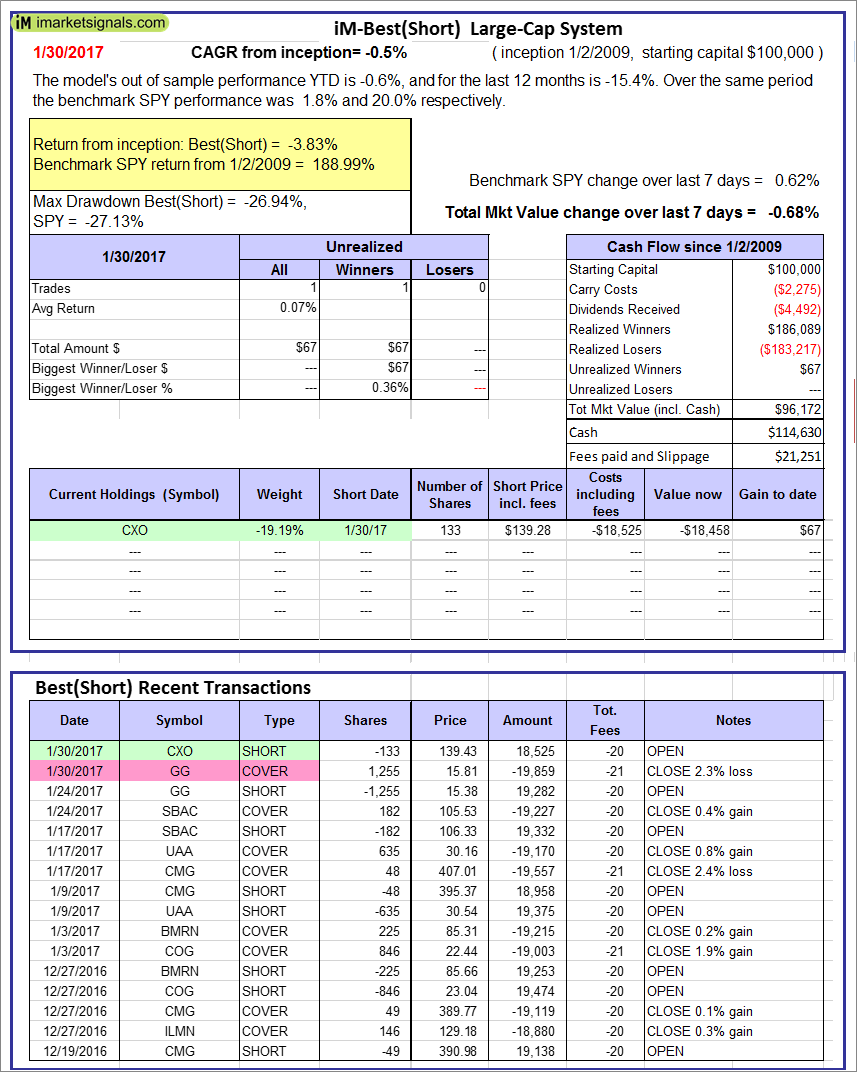 |
iM-Best(Short): The model’s out of sample performance YTD is -0.6%, and for the last 12 months is -15.4%. Over the same period the benchmark SPY performance was 1.8% and 20.0% respectively. Over the previous week the market value of iM-Best(Short) gained -0.68% at a time when SPY gained 0.62%. Over the period 1/2/2009 to 1/30/2017 the starting capital of $100,000 would have grown to $96,172 which includes $114,630 cash and excludes $21,251 spent on fees and slippage. |
iM-Best Reports – 1/30/2017
Posted in pmp SPY-SH
Leave a Reply
You must be logged in to post a comment.