
  |
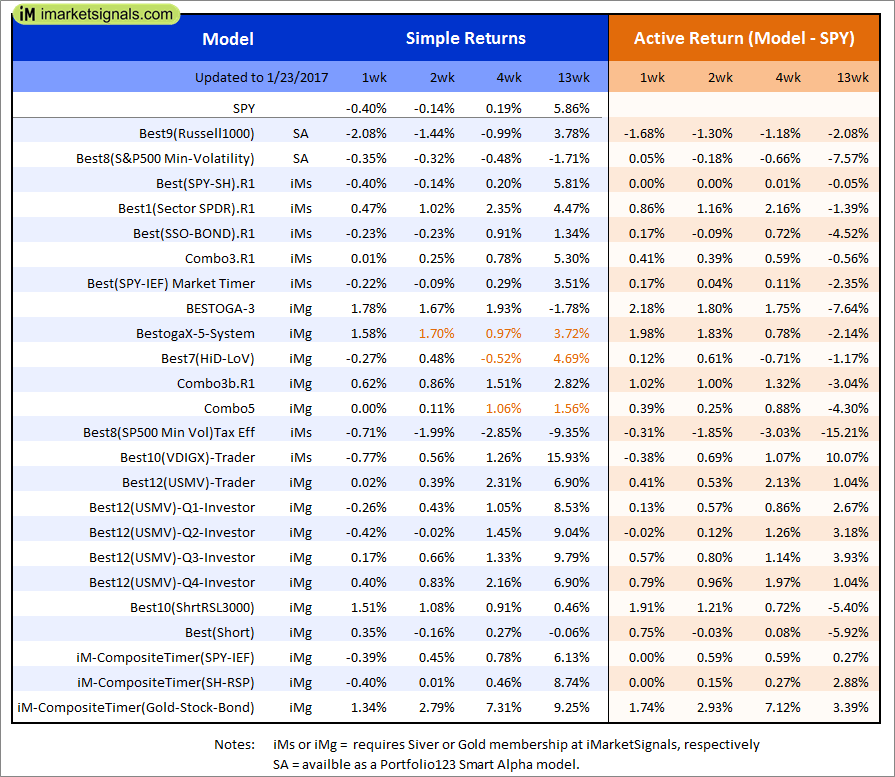
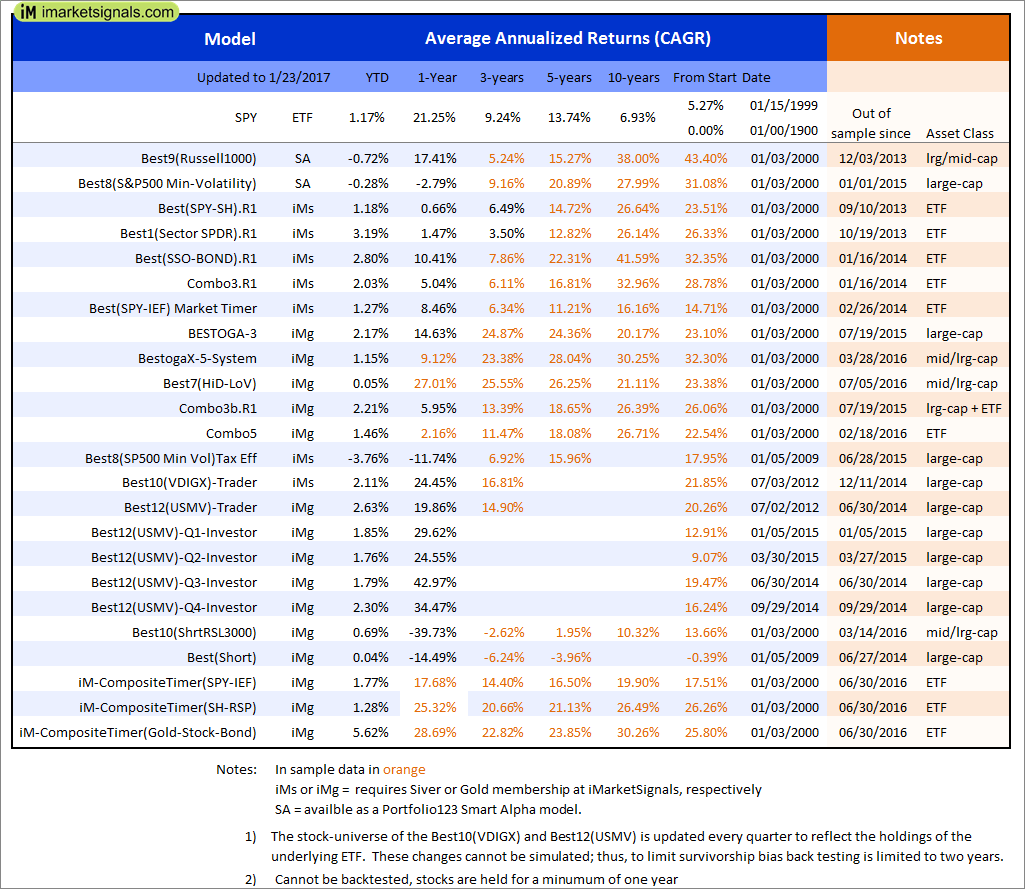
Out of sample performance summary of our models for the past 1, 2, 4 and 13 week periods. The active active return indicates how the models over- or underperformed the benchmark ETF SPY. Also the YTD, and the 1-, 3-, 5- and 10-year annualized returns are shown in the second table |
 |
iM-Best(SPY-SH).R1: The model’s out of sample performance YTD is 1.2%, and for the last 12 months is 0.7%. Over the same period the benchmark SPY performance was 1.2% and 21.3% respectively. Over the previous week the market value of Best(SPY-SH) gained -0.04% at a time when SPY gained -0.04%. A starting capital of $100,000 at inception on 1/2/2009 would have grown to $467,672 which includes -$2,720 cash and excludes $15,358 spent on fees and slippage. |
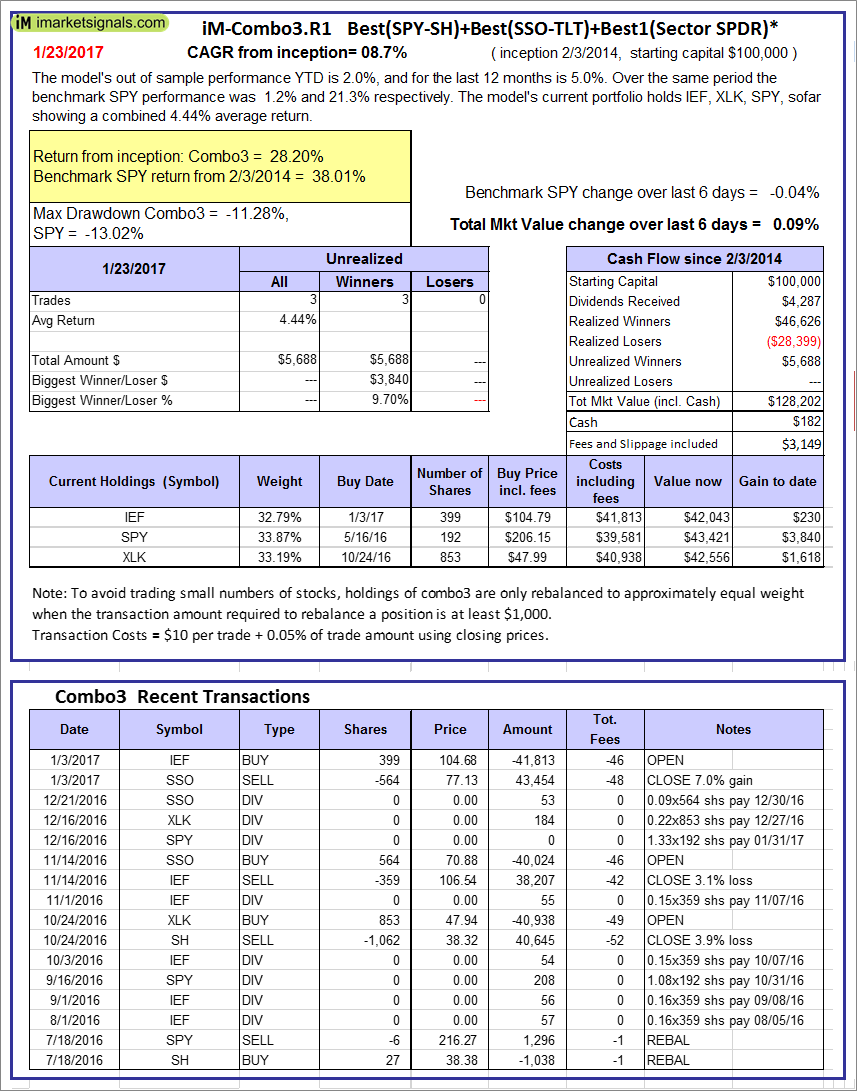 |
iM-Combo3.R1: The model’s out of sample performance YTD is 2.0%, and for the last 12 months is 5.0%. Over the same period the benchmark SPY performance was 1.2% and 21.3% respectively. Over the previous week the market value of iM-Combo3.R1 gained 0.09% at a time when SPY gained -0.04%. A starting capital of $100,000 at inception on 2/3/2014 would have grown to $128,202 which includes $182 cash and excludes $3,149 spent on fees and slippage. |
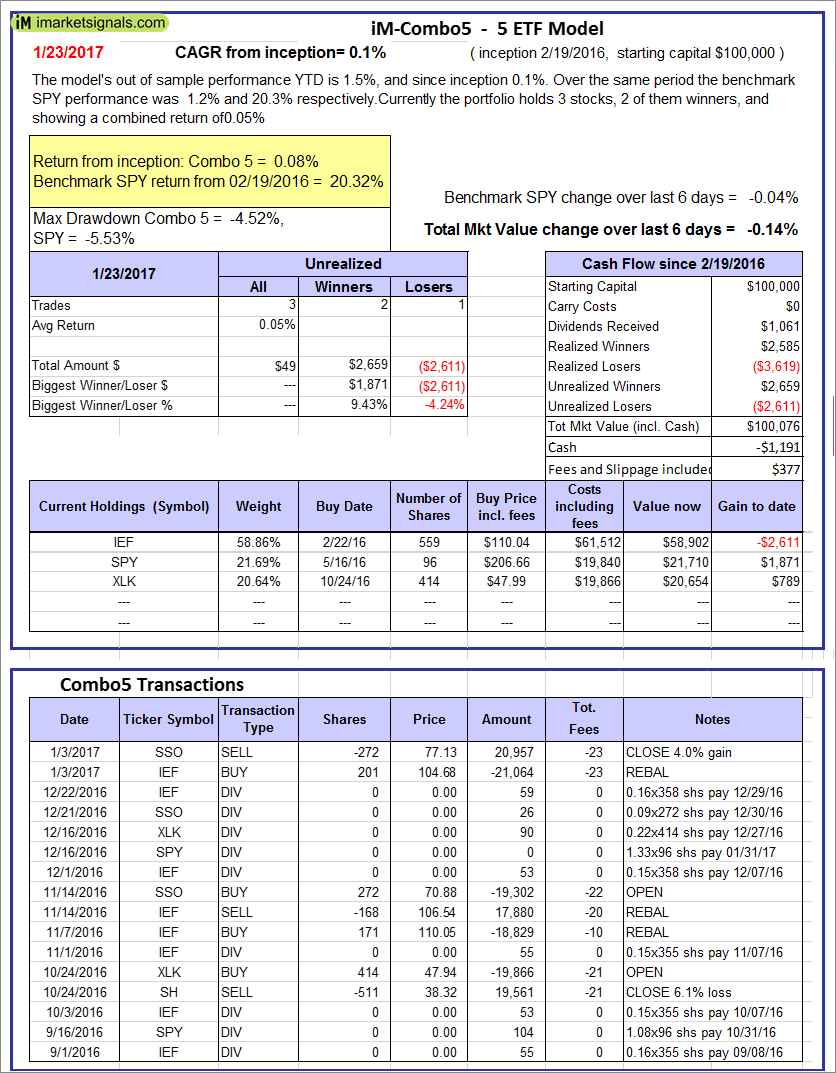 |
iM-Combo5: The model’s out of sample performance YTD is 1.5%, and since inception 0.1%. Over the same period the benchmark SPY performance was 1.2% and 20.3% respectively. Over the previous week the market value of iM-Combo5 gained -0.14% at a time when SPY gained -0.04%. A starting capital of $100,000 at inception on 2/22/2016 would have grown to $100,076 which includes -$1,191 cash and excludes $377 spent on fees and slippage. |
 |
The iM-Best8(S&P500 Min Vol)Tax-Efficient The model’s out of sample performance YTD is -3.8%, and for the last 12 months is -11.7%. Over the same period the benchmark SPY performance was 1.2% and 21.3% respectively. Over the previous week the market value of iM-Best8(S&P 500)Tax-Eff. gained -1.32% at a time when SPY gained -0.04%. A starting capital of $100,000 at inception on 1/2/2009 would have grown to $378,647 which includes -$43,279 cash and excludes $8,236 spent on fees and slippage. |
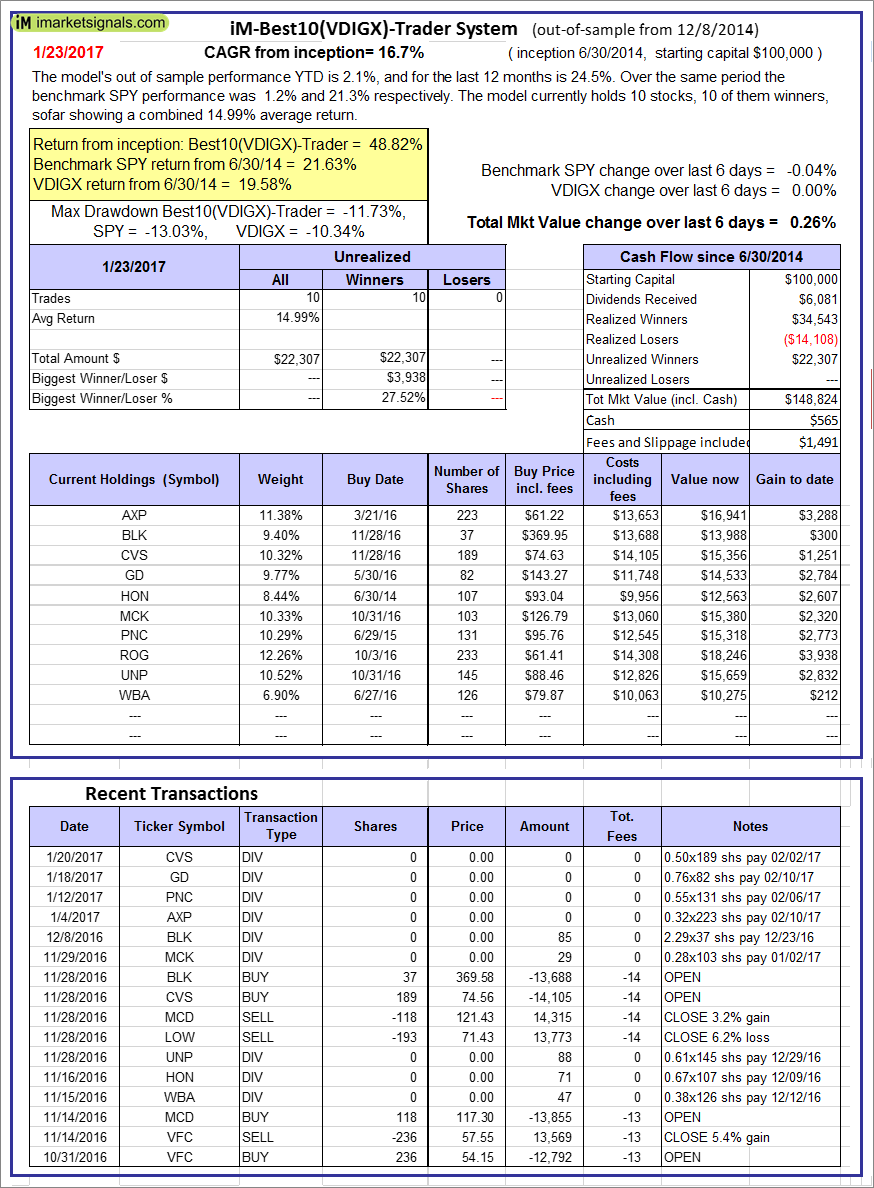 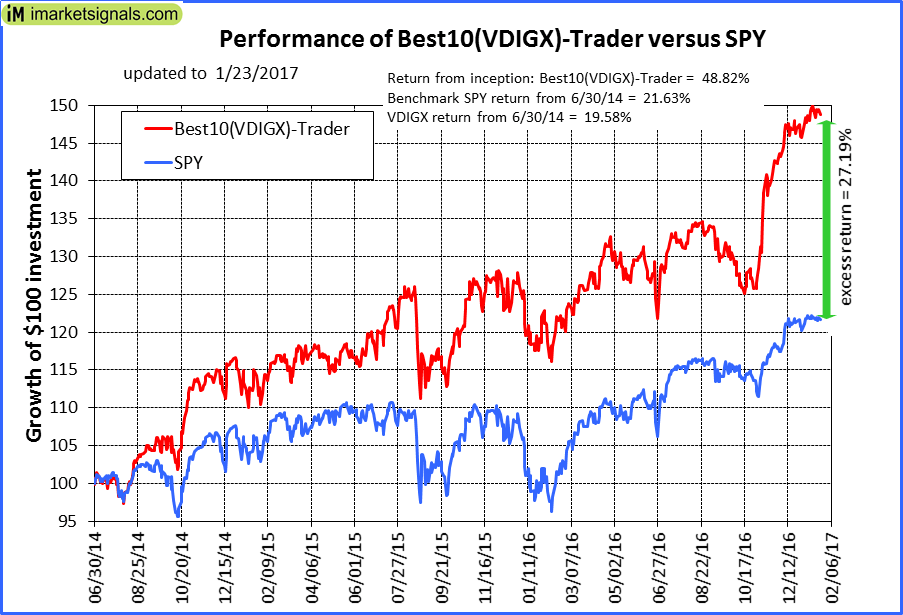 |
iM-Best10(VDIGX)-Trader: The model’s out of sample performance YTD is 2.1%, and for the last 12 months is 24.5%. Over the same period the benchmark SPY performance was 1.2% and 21.3% respectively. Since inception, on 7/1/2014, the model gained 48.82% while the benchmark SPY gained 21.63% and the ETF VDIGX gained 19.58% over the same period. Over the previous week the market value of iM-Best10(VDIGX) gained 0.26% at a time when SPY gained -0.04%. A starting capital of $100,000 at inception on 7/1/2014 would have grown to $148,824 which includes $565 cash and excludes $1,491 spent on fees and slippage. |
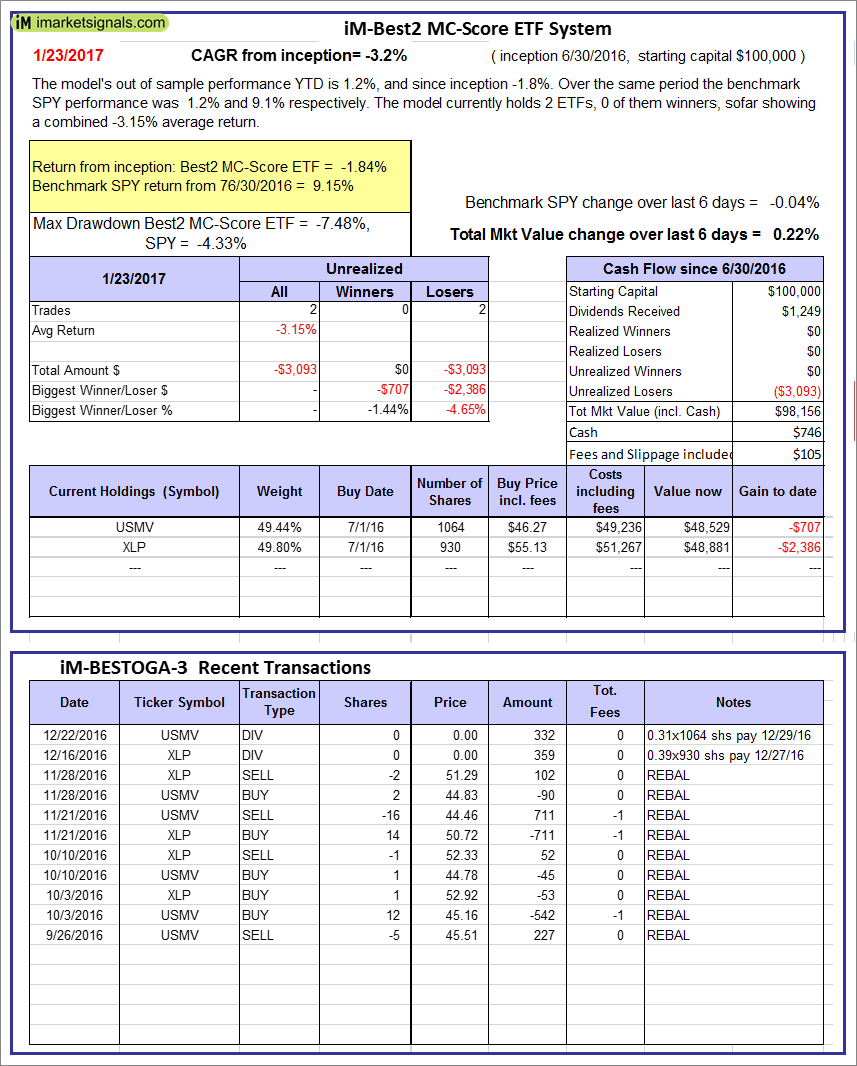 |
iM-Best2 MC-Score ETF System: The model’s out of sample performance YTD is 1.2%, and since inception -1.8%. Over the same period the benchmark SPY performance was 1.2% and 9.1% respectively. Over the previous week the market value of iM-BESTOGA-3 gained 0.22% at a time when SPY gained -0.04%. A starting capital of $100,000 at inception on 2/3/2014 would have grown to $746 which includes $105 cash and excludes Gain to date spent on fees and slippage. |
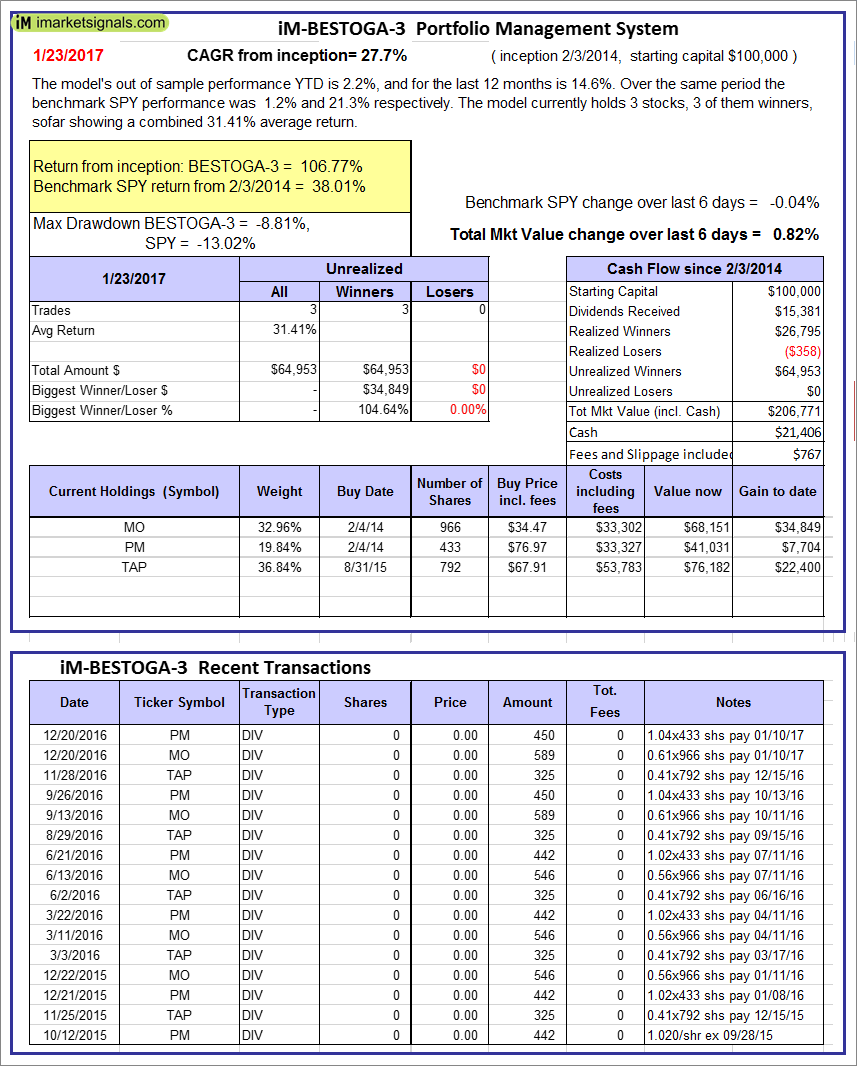 |
iM-BESTOGA-3: The model’s out of sample performance YTD is 2.2%, and for the last 12 months is 14.6%. Over the same period the benchmark SPY performance was 1.2% and 21.3% respectively. Over the previous week the market value of iM-BESTOGA-3 gained 0.82% at a time when SPY gained -0.04%. A starting capital of $100,000 at inception on 2/3/2014 would have grown to $206,771 which includes $21,406 cash and excludes $767 spent on fees and slippage. |
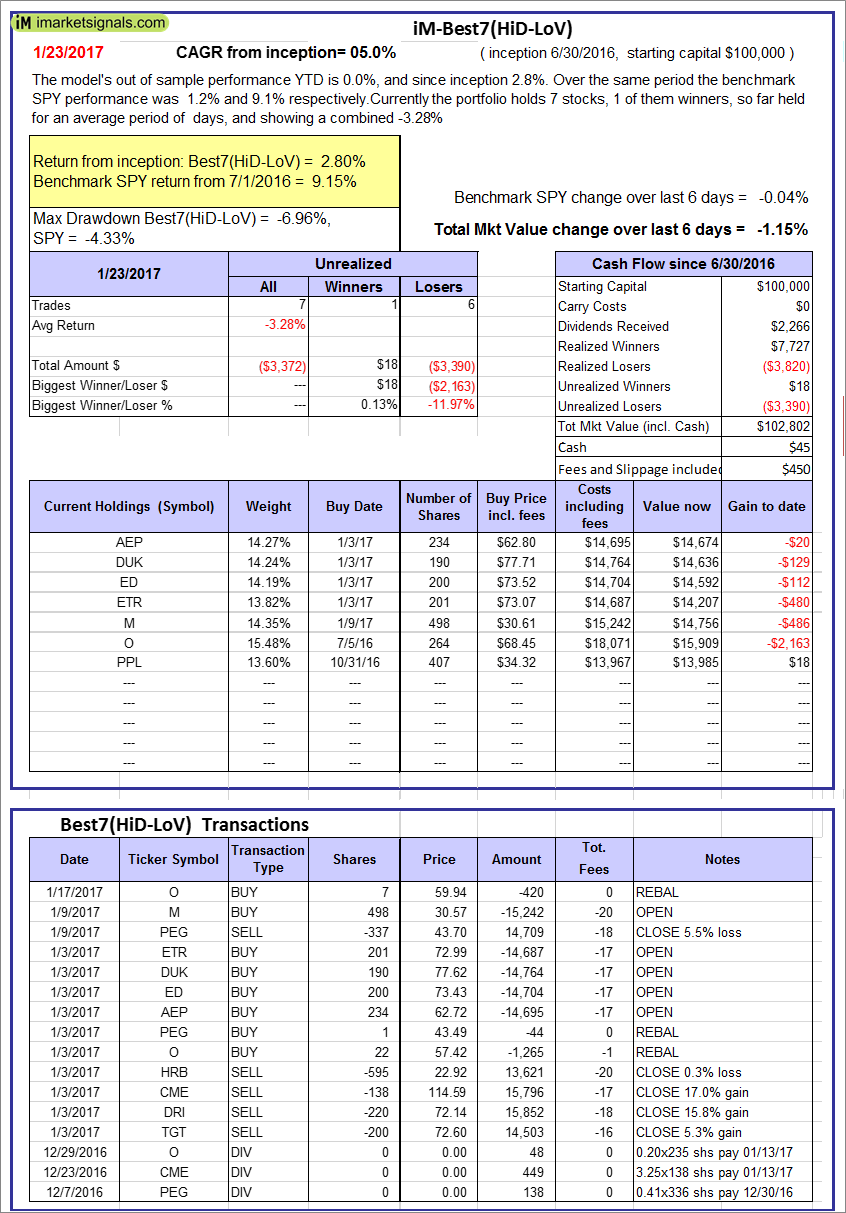 |
iM-Best7(HiD-LoV): The model’s out of sample performance YTD is 0.0%, and since inception 2.8%. Over the same period the benchmark SPY performance was 1.2% and 9.1% respectively. Over the previous week the market value of iM-BESTOGA-3 gained -1.15% at a time when SPY gained -0.04%. A starting capital of $100,000 at inception on 2/3/2014 would have grown to $102,802 which includes $45 cash and excludes $450 spent on fees and slippage. |
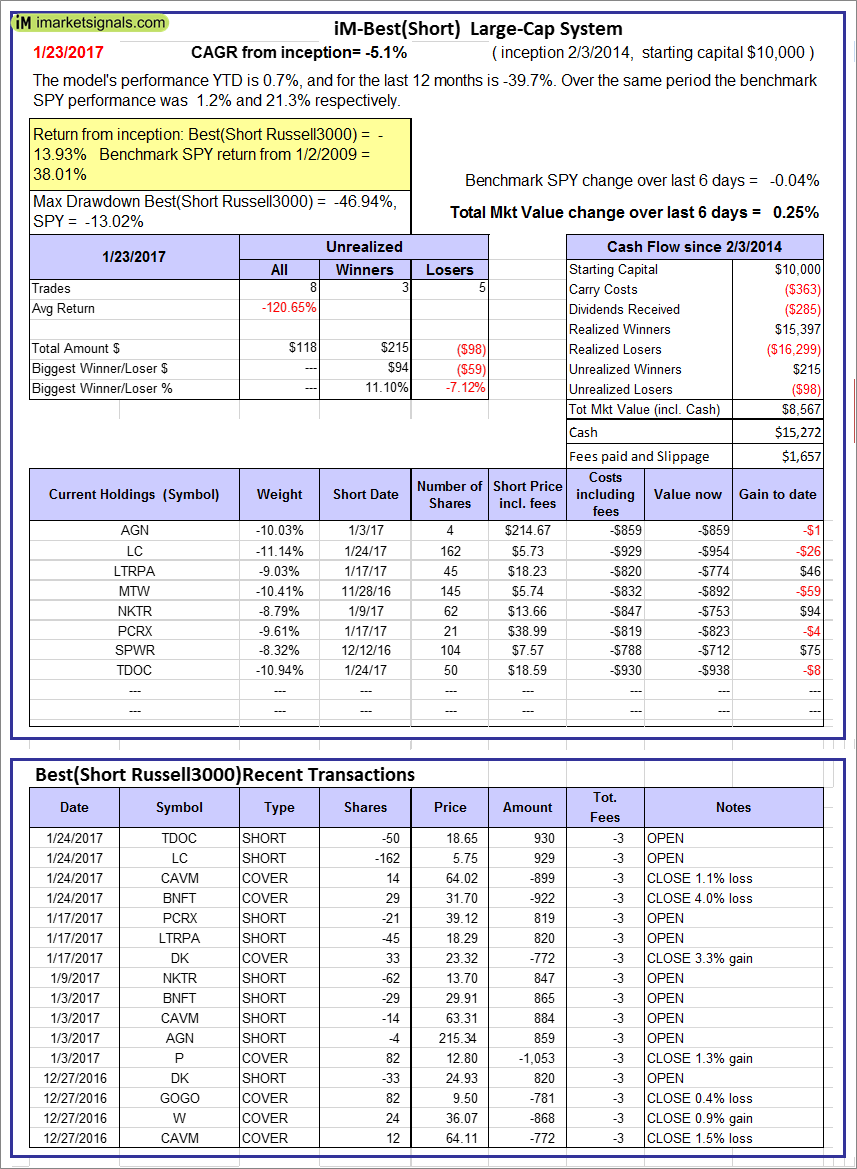 |
iM-Best10(Short Russell3000): The model’s performance YTD is 0.7%, and for the last 12 months is -39.7%. Over the same period the benchmark SPY performance was 1.2% and 21.3% respectively. Over the previous week the market value of iM-Best10(Short Russell3000) gained 0.25% at a time when SPY gained -0.04%. Over the period 2/3/2014 to 1/23/2017 the starting capital of $100,000 would have grown to $8,567 which includes $15,272 cash and excludes $1,657 spent on fees and slippage. |
 |
iM-BestogaX5-System: The model’s out of sample performance YTD is 1.1%, and since inception -0.3%. Over the same period the benchmark SPY performance was 1.2% and 13.1% respectively. Over the previous week the market value of iM-Best8(S&P 500)Tax-Eff. gained 1.26% at a time when SPY gained -0.04%. A starting capital of $100,000 at inception on 1/2/2009 would have grown to $99,692 which includes $446 cash and excludes $488 spent on fees and slippage. |
 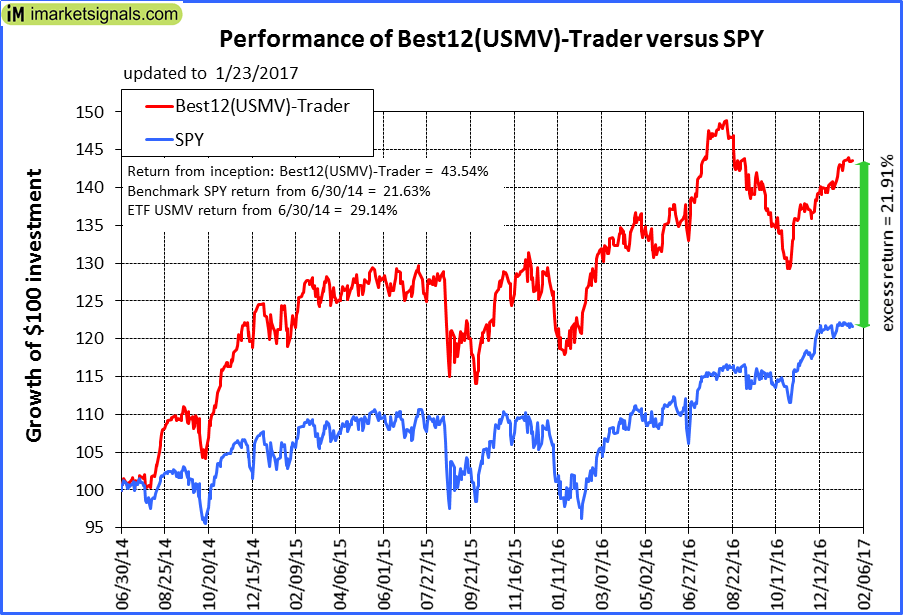 |
iM-Best12(USMV)-Trader: The model’s out of sample performance YTD is 2.6%, and for the last 12 months is 19.9%. Over the same period the benchmark SPY performance was 1.2% and 21.3% respectively. Since inception, on 7/1/2014, the model gained 43.54% while the benchmark SPY gained 21.63% and the ETF USMV gained 29.14% over the same period. Over the previous week the market value of iM-Best12(USMV)-Trader gained -0.14% at a time when SPY gained -0.04%. A starting capital of $100,000 at inception on 7/1/2014 would have grown to $143,538 which includes $159 cash and excludes $2,785 spent on fees and slippage. |
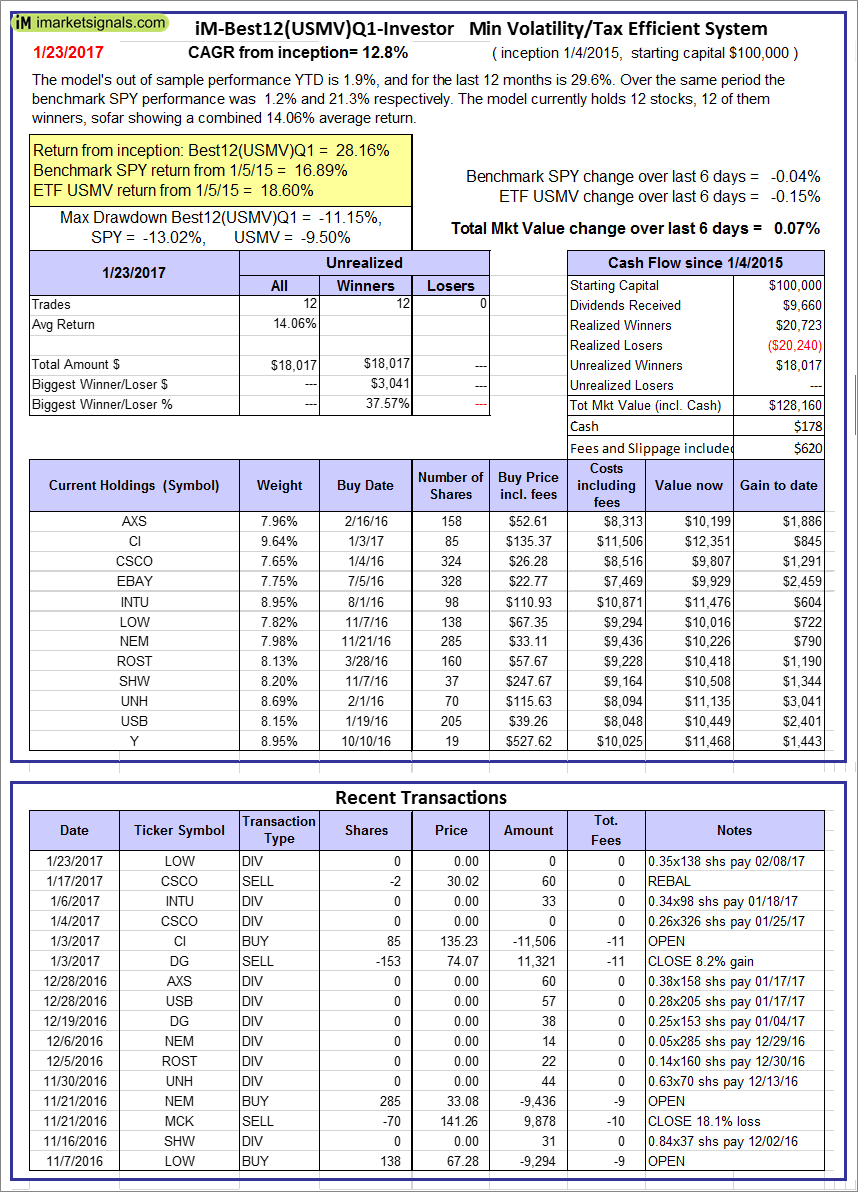 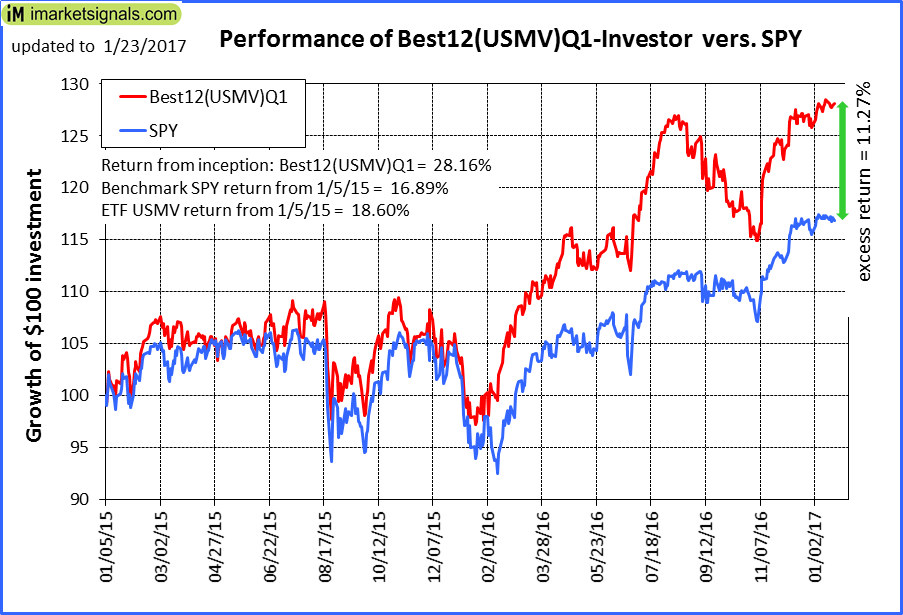 |
iM-Best12(USMV)Q1-Investor: The model’s out of sample performance YTD is 1.9%, and for the last 12 months is 29.6%. Over the same period the benchmark SPY performance was 1.2% and 21.3% respectively. Since inception, on 1/5/2015, the model gained 28.16% while the benchmark SPY gained 16.89% and the ETF USMV gained 18.60% over the same period. Over the previous week the market value of iM-Best12(USMV)Q1 gained 0.07% at a time when SPY gained -0.04%. A starting capital of $100,000 at inception on 1/5/2015 would have grown to $128,160 which includes $178 cash and excludes $620 spent on fees and slippage. |
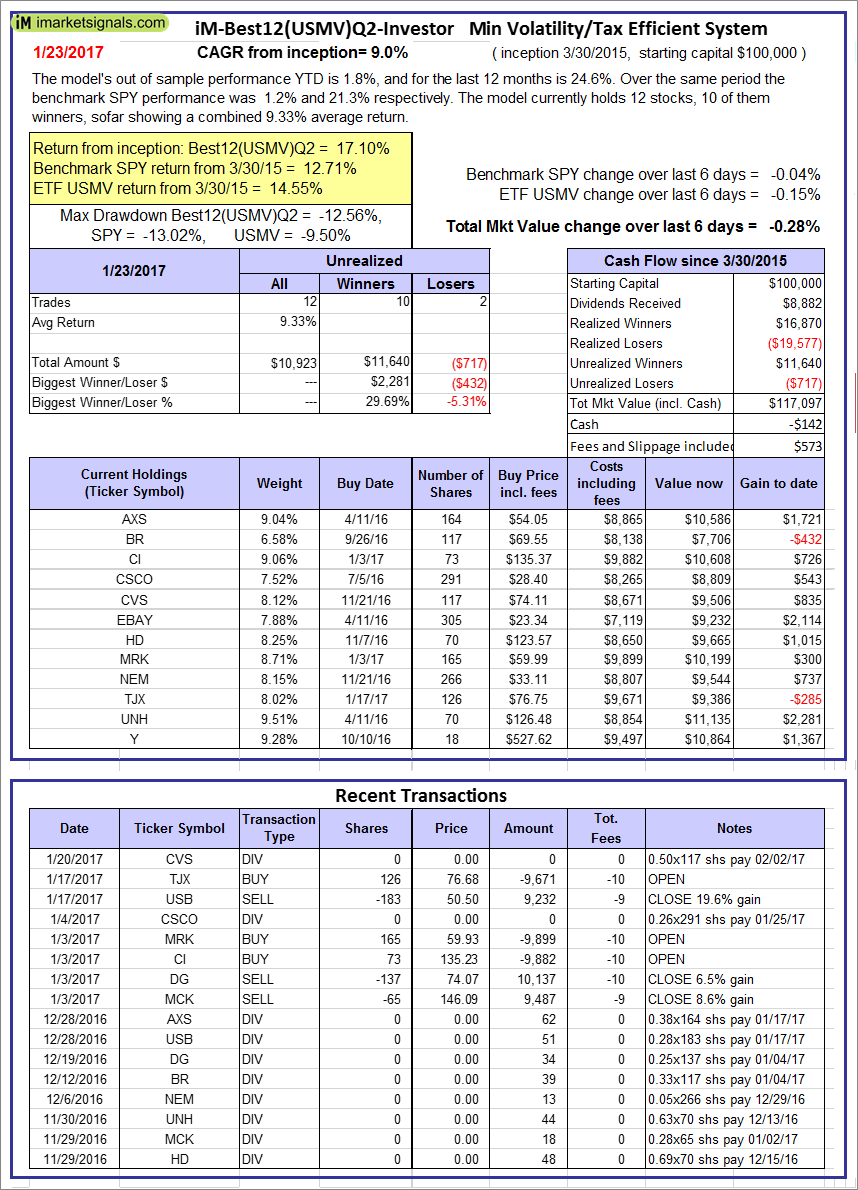 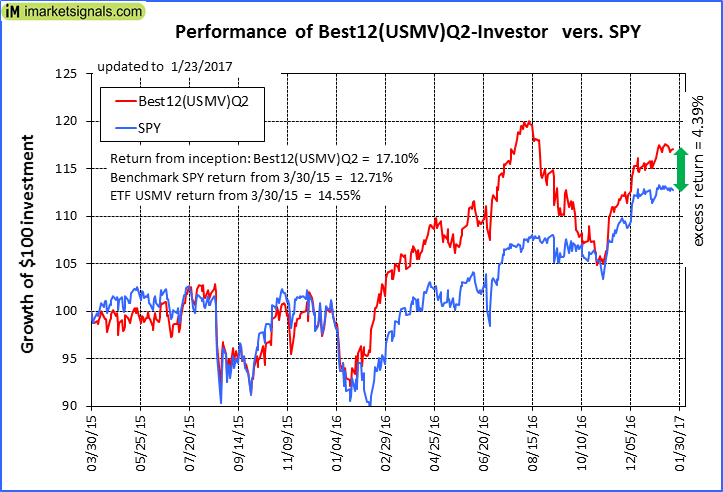 |
iM-Best12(USMV)Q2-Investor: The model’s out of sample performance YTD is 1.8%, and for the last 12 months is 24.6%. Over the same period the benchmark SPY performance was 1.2% and 21.3% respectively. Since inception, on 3/31/2015, the model gained 17.10% while the benchmark SPY gained 12.71% and the ETF USMV gained 14.55% over the same period. Over the previous week the market value of iM-Best12(USMV)Q2 gained -0.28% at a time when SPY gained -0.04%. A starting capital of $100,000 at inception on 3/31/2015 would have grown to $117,097 which includes -$142 cash and excludes $573 spent on fees and slippage. |
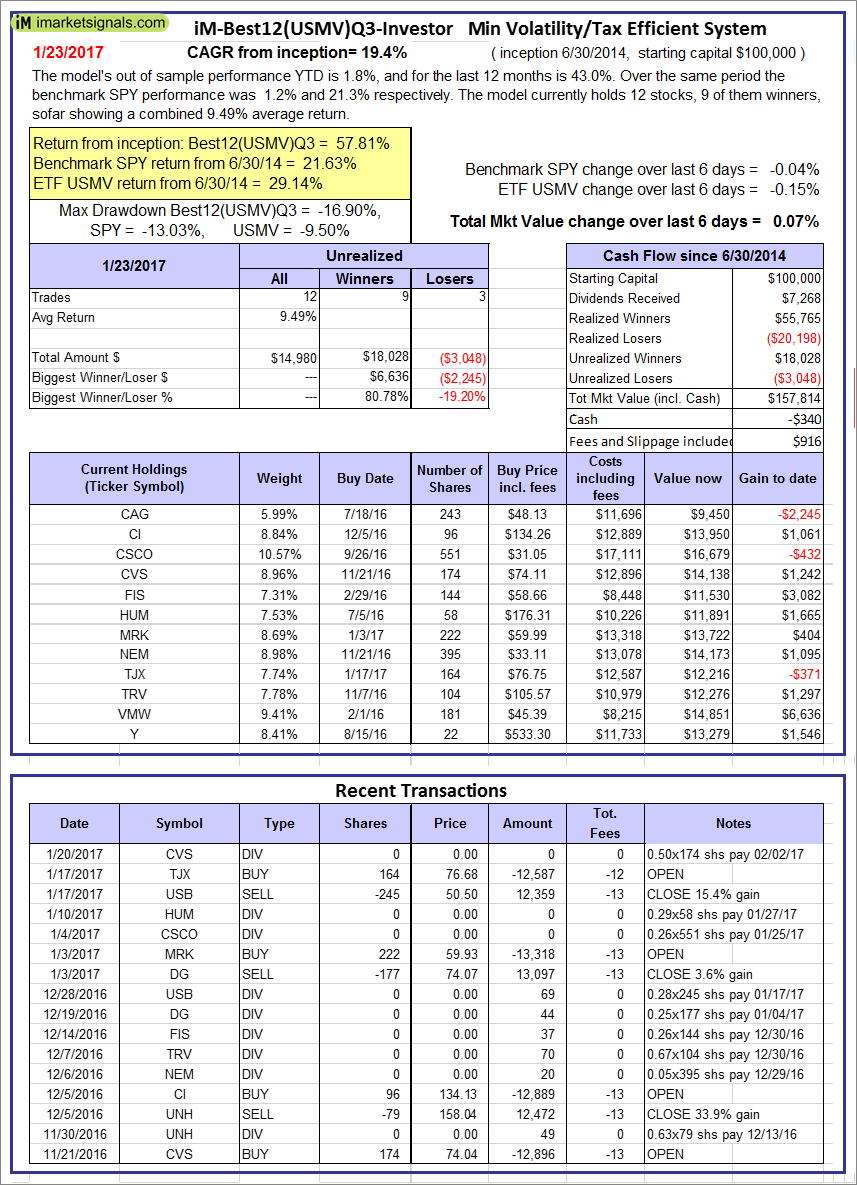 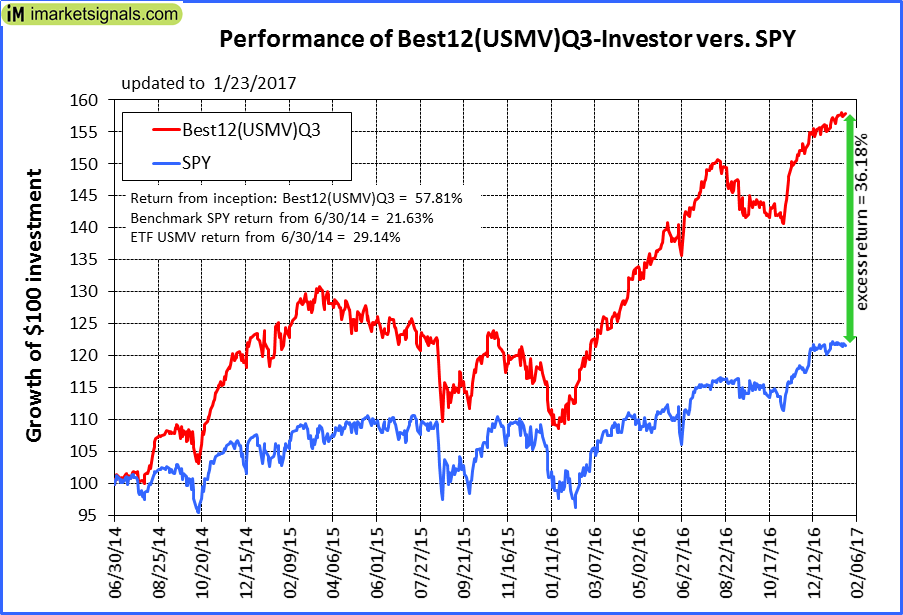 |
iM-Best12(USMV)Q3-Investor: The model’s out of sample performance YTD is 1.8%, and for the last 12 months is 43.0%. Over the same period the benchmark SPY performance was 1.2% and 21.3% respectively. Since inception, on 7/1/2014, the model gained 57.81% while the benchmark SPY gained 21.63% and the ETF USMV gained 29.14% over the same period. Over the previous week the market value of iM-Best12(USMV)Q3 gained 0.07% at a time when SPY gained -0.04%. A starting capital of $100,000 at inception on 7/1/2014 would have grown to $157,814 which includes -$340 cash and excludes $916 spent on fees and slippage. |
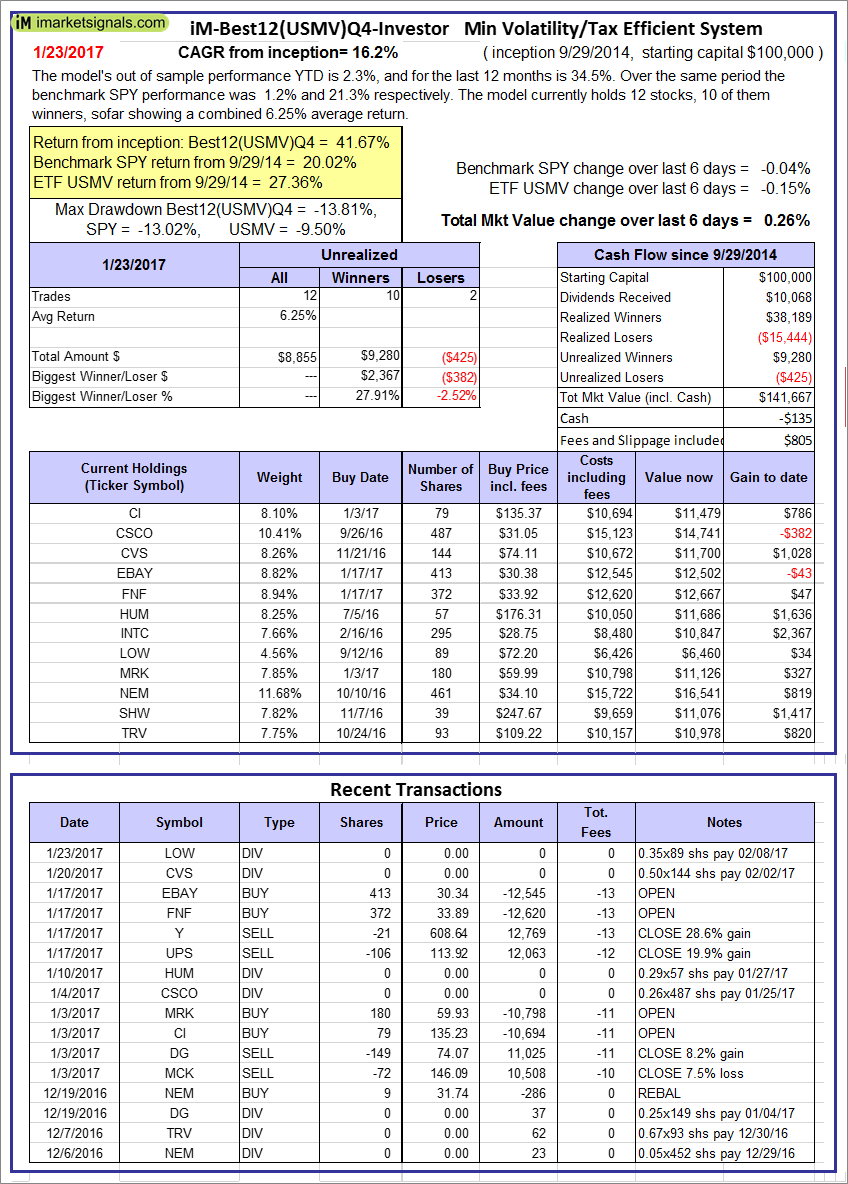 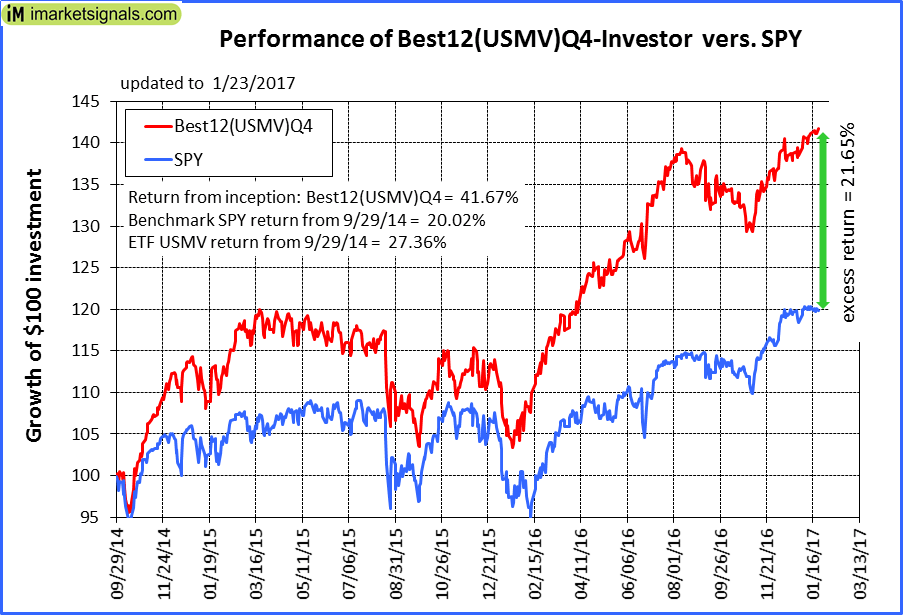 |
iM-Best12(USMV)Q4-Investor: Since inception, on 9/30/2014, the model gained 41.67% while the benchmark SPY gained 20.02% and the ETF USMV gained 27.36% over the same period. Over the previous week the market value of iM-Best12(USMV)Q4 gained 0.26% at a time when SPY gained -0.04%. A starting capital of $100,000 at inception on 9/30/2014 would have grown to $141,667 which includes -$135 cash and excludes $805 spent on fees and slippage. |
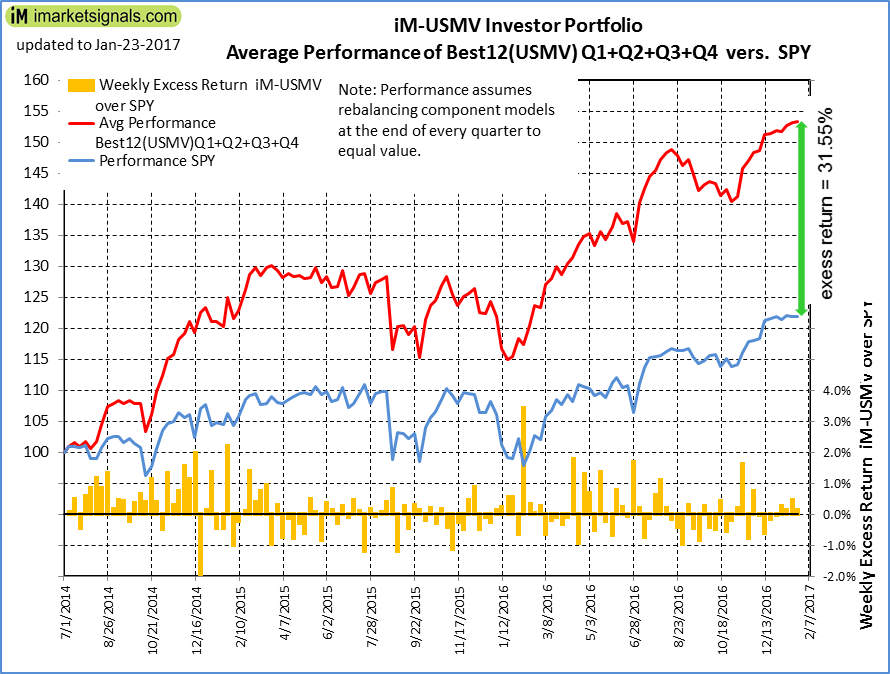 |
Average Performance of iM-Best12(USMV)Q1+Q2+Q3+Q4-Investor resulted in an excess return of 31.55% over SPY. (see iM-USMV Investor Portfolio) |
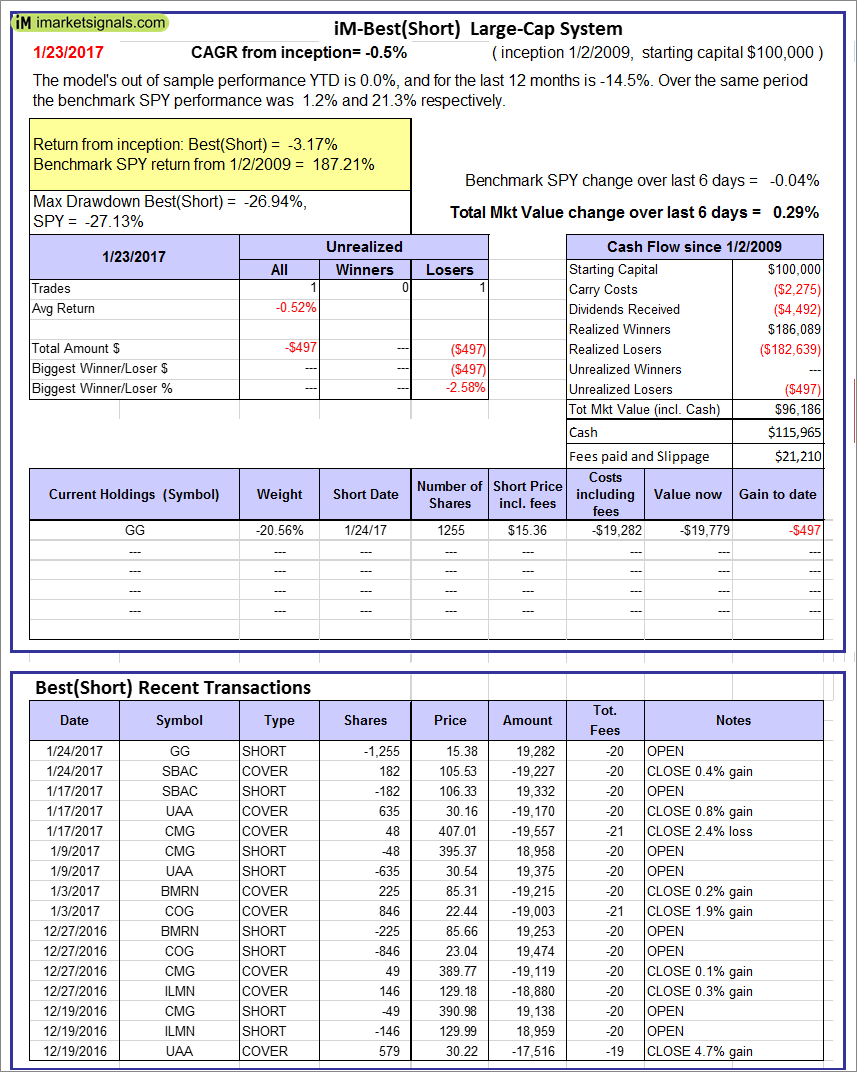 |
iM-Best(Short): The model’s out of sample performance YTD is 0.0%, and for the last 12 months is -14.5%. Over the same period the benchmark SPY performance was 1.2% and 21.3% respectively. Over the previous week the market value of iM-Best(Short) gained 0.29% at a time when SPY gained -0.04%. Over the period 1/2/2009 to 1/23/2017 the starting capital of $100,000 would have grown to $96,186 which includes $115,965 cash and excludes $21,210 spent on fees and slippage. |
iM-Best Reports – 1/23/2017
Posted in pmp SPY-SH
Leave a Reply
You must be logged in to post a comment.