
- The Shiller CAPE (cyclically adjusted price-earnings ratio) is typically regarded as a stock market valuation measure. When the CAPE is high stocks are supposed to be expensive, and vice-versa.
- The CAPE itself is not a good stock market timer. However, the CAPE can indirectly be used for market timing by determining a Cycle-ID as formulated by Theodore Wong.
- Wong uses double-leveraged long, inverse unleveraged short, and unleveraged long synthetic funds based on the monthly average of the S&P500 from 1900 to 2016, and shows very high hypothetical returns.
- Our 1950-2016 backtest of the CAPE-Cycle-ID model, when switching between the S&P500 with dividends and the money market, showed an annualized return of 11.9%, versus 10.4% for buy-and-hold.
The Shiller CAPE can be determined at the end of every month. Inputs are the average value of the S&P500 index for the month, earnings of the S&P500, and the Consumer Price Index. From the CAPE a market timer is developed according to a few simple rules.
The CAPE-Cycle-ID Market Timer
The construction and rules for our CAPE-Cycle-ID model are summarized below. The rules differ from the Wong model only in respect to the investment choices and trading times.
Construction:
- A primary oscillator is constructed from the year-over-year rate-of-change of the CAPE (YoY-ROC-CAPE).
- The exponential moving average (EMA) of the YoY-ROC-CAPE is then calculated with a smoothing factor of 0.20 (EMA-YoY-ROC-CAPE).
- A secondary indicator is calculated from the month-over-month change of the EMA-YoY-ROC-CAPE (MoM-EMA-YoY-ROC-CAPE).
Rules:
- Score +1 when the EMA-YoY-ROC-CAPE is greater or equal to -13%, otherwise score -1.
- Score +1 when the MoM-EMA-YoY-ROC-CAPE is greater than zero or when it has a positive slope, i.e. when the current month level is greater than the previous month level, otherwise score -1.
- Sum the scores for each month. Possible combined scores are +2, 0, and -2.
- Invest in the stock market when the combined score is +2 or 0.
- Go to cash or bonds when the combined score is -2.
Trading Rules:
After a combined score change, trade on the first trading day of the following week.
Performance
We calculated a hypothetical fund SPY* from the performance of the S&P500 with dividends reinvested by splicing the data from the SPDR S&P500 ETF (SPY) from 1993 to 2016, the Vanguard 500 Index Fund (VFINX) from 1980 to 1993, and before that from 1950 to 1980 daily data of the S&P500 with monthly dividends taken from the Shiller CAPE data.
We simulated a hypothetical money market fund SHV* with the Federal Funds Rate from 1950 to 2007 and thereafter spliced the iShares Short Treasury Bond ETF (SHV) to it.
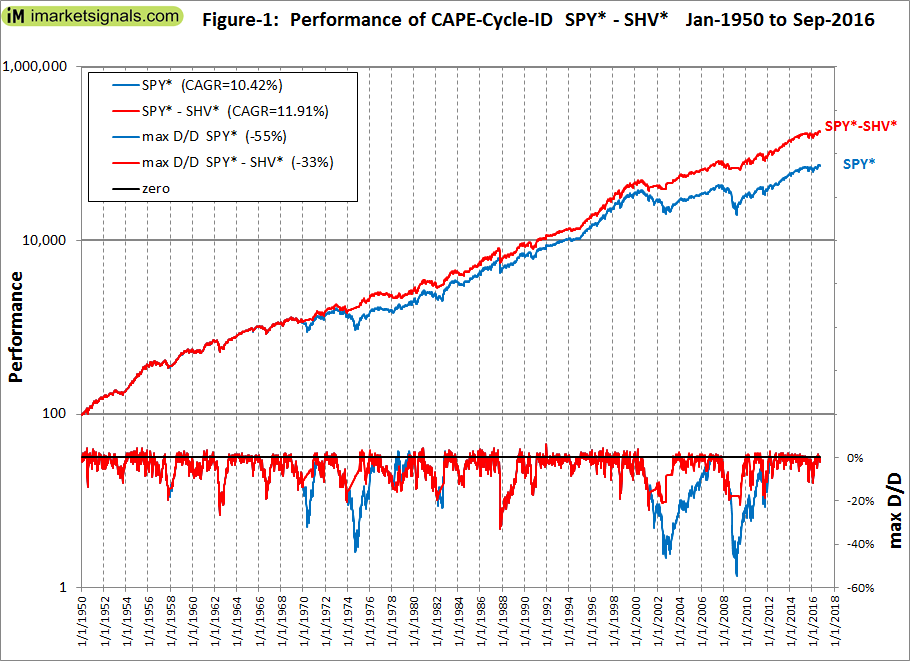
Over the period 1/3/1950 to 10/3/2016 the model, switching between SPY* and SHV*, showed an annualized return of 11.91% with a maximum drawdown of -33% in 1987. Buy-and-hold SPY* gave an annualized return of 10.42% with a maximum drawdown of -55% in 2009. (Figure-1)
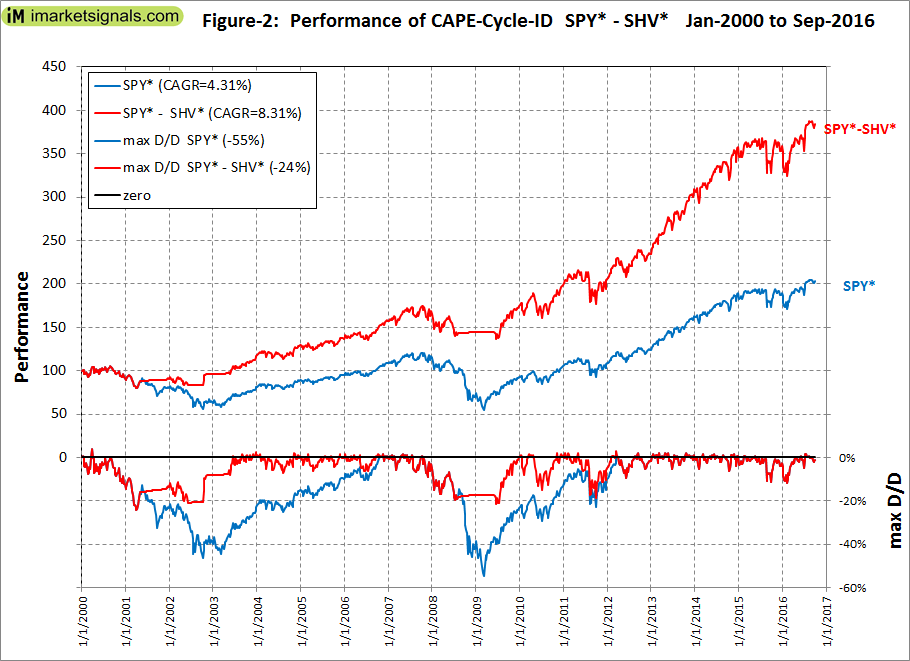
Over the period 1/3/2000 to 10/3/2016 the model showed an annualized return of 8.31% with a maximum drawdown of -24% in 2001. Buy-and-hold SPY* gave an annualized return of 4.31% with a maximum drawdown of -55% in 2009. (Figure-2)
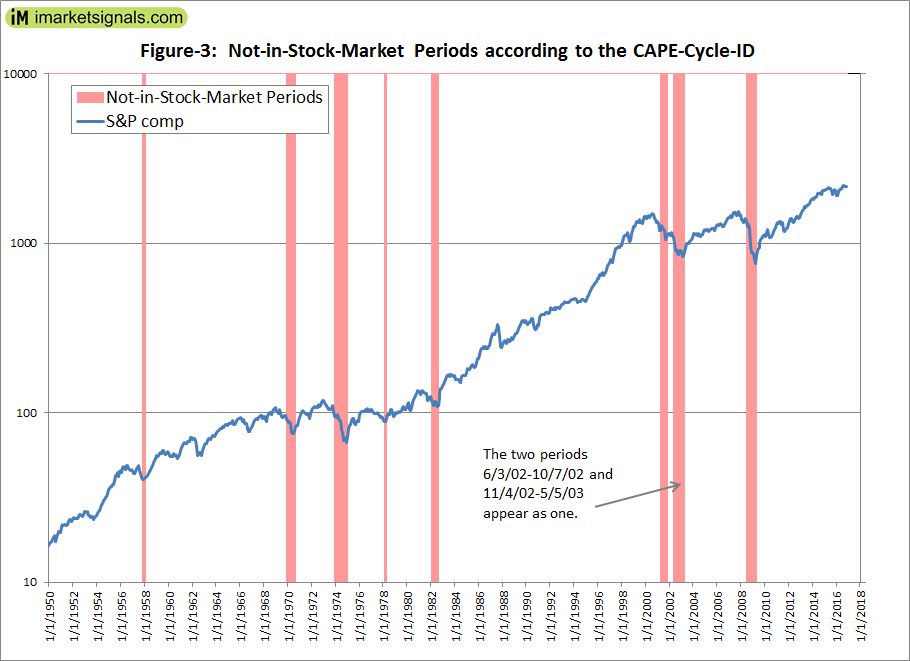
There were only nine periods from 1950 to 2016 when the CAPE-Cycle-ID signaled to be out of the stock market. They are listed below and are also shown by the vertical bars in Figure-3.
12/2/1957 to 3/3/1958
1/5/1970 to 10/5/1970
1/7/1974 to 2/3/1975
3/6/1978 to 5/1/1978
3/1/1982 to 10/4/1982
5/7/2001 to 12/3/2001
6/3/2002 to 10/7/2002
11/4/2002 to 5/5/2003
8/4/2008 to 6/1/2009
Conclusion
Higher returns could have been achieved by switching to longer-term bond funds instead of a money-market fund. However, we wanted to show the most conservative performance from this model, which over the period 1950 to 2016 provided 2.5-times the total return of what a constant investment in the stock market would have produced.
The model is simple to construct, but can also be followed live at iMarketSignals. Heeding the monthly signals from the CAPE-Cycle-ID should provide insurance against major stock market declines and improve investment performance.
Leave a Reply
You must be logged in to post a comment.